Embed Size (px)
Citation preview

OPEN DISCUSSION PAPERS IN
ECONOMICS
Creating Competition? Globalisation and
the emergence of new technology producers
Suma Athreye and John Cantwell
October 2005
NUMBER 52

Copies may be obtained from: Economics Department Faculty of Social Sciences The Open University Walton Hall Milton Keynes MK7 6AA Telephone: 01908 654437 Email: [email protected] Fax: 01908 654488 This series is registered under ISSN 1753-2590 (Print) ISSN 1753-2604 (Online)

Economics Research at The Open University
Throughout the 1990s, The Open University has been developing its research capacity in economics. Economists at the OU comprise a lively and expanding group with a wide set of interests ranging from development policy to decision theory, from Marxist theories of profit to libertarian foundations of environmental policy and from econometric analysis of large data sets through institutional economics to the use of case-studies in policy formation. Nearly a 1000 students from around the world register each year to study economics courses and their needs, together with the multi-disciplinary nature of social science at the university, shape out research. Through a variety of personal and group research projects, our work makes a strong contribution to areas like business, public policy and even philosophy where sharply focused analysis can inform decision-making as well as contribute to scientific progress. In 1999, approximately £250,000 million worth of externally funded grants (3 from the ESRC) were held by discipline members, some of whom also act as consultants to national and international bodies. Approximately half a dozen students are currently reading for doctorates with members of the discipline and we are always interested in proposals from colleagues or potential students who would like to do research with us. Some of the journals in which discipline members have published include: Annals of Operations Research, Economic Journal, Economica, Economics and Philosophy, Feminist Economics, Feminist Review, International Journal of the Economics of Business, International Journal of Industrial Organisation, Journal of Economic Issues, Journal of Economic Psychology, Journal of the History of Ideas, Journal of Social Policy, Local Government Studies, The Locke Newsletter, Open Learning, Oxford Economic Papers, Public Policy and Administration, Radical Statistics, Revue d’ Économie Politique, Risk Decision and Policy, Structural Change and Economic Dynamics, Technovation and Theory and Decision. The papers contain results of economic research which are the sole responsibility of the authors. Opinions expressed in these papers are hence those of the authors and do not necessarily reflect views of the University.

Creating Competition?
Globalisation and the emergence of new technology producers∗
Suma Athreye, Economics, Open University, UK+.
John Cantwell, Rutgers Business School, USA.
October 2005
Abstract:
This paper studies the emergence of new countries as contributors to technology
generation in the world economy and assesses the relationship between this and
globalisation (through trade, inward FDI and international migration). It considers two
measures of technology generation, viz. a country’s share of licensing revenues and of
foreign origin patenting in the US, thus covering different phases and aspects of
technological catch-up across countries. The paper uses a novel index to track the influence
of new countries as technology generators in these datasets and uses time series techniques
to understand the causal relationship between globalisation and the emergence of new
technology producers. Our findings suggest a role for increasing international direct
investment as a factor causing the emergence of new countries with the higher level
competitiveness associated with patenting, but not in the recent surge of new countries with
the basic capabilities needed to become licensors in the world economy. However, an
increase in the international spread of the subsidiary sources of the patenting activity of
multinationals appears to follow periods when the world economy becomes less open to
trade.
Keywords: Technology, Innovation, Patenting, Licensing, Globalisation
JEL Codes: O33, F23, O19, F43, O57
∗ We are grateful to the Open University for a small grant, which helped to collate the data required for the paper. We thank Elena Stassiouk and Nevena Yakova for timely research assistance and Ron Smith for guidance. The usual disclaimer applies. + Corresponding author: [email protected]

Creating Competition?
Globalisation and the emergence of new technology producers
There is considerable debate on the issue of whether new countries in the
developing world are catching-up in technological capabilities and if they can emerge as
significant producers of technology. Case studies suggest that countries like Ireland, Israel
and India have emerged as significant exporters of technologically sophisticated products
and services. A significant proportion of multinational company R&D has moved to
countries of developing Asia - estimates suggest that the share of US affiliate R&D in
Canada, Japan and Europe relative to the world as a whole decreased from 94% in 1989 to
85% in 1999, while the share of developing Asia grew from less than 1% to over 7.7%.1
Yet our knowledge remains limited of whether this transfer of R&D has been associated
with greater technological generation from new countries to a significant extent.
However, we also live in times when the unprecedented globalisation of the last two
decades is under threat. On the one hand, researchers concerned with the development of
poor countries in Africa are campaigning for Developed Market Economies to open a
larger part of their market. Larger developing countries such as India and Brazil have also
intervened aggressively for a fair deal in trading during the Doha and Cancun rounds of the
WTO negotiations. On the other hand, recent trends in the outsourcing of intellectual
labour have given rise to the fear in Developed Market Economies that they stand to lose
their comparative advantage in knowledge-intensive products as new countries emerge with
the basic capabilities needed to provide some technology-based services. At least two
recent works on international trade by eminent economists argue that these fears may be
well founded. Gomroy and Baumol (2000) show that in a multi-country, multi-product
1 US Department of Commerce as cited in Beausang (2004), Table 1.
1
2

setting where international trade is based mostly on created comparative advantages and
economies of scale, the terms of trade consequences of productivity improvements among
trading partners may be such that the classical argument that free trade benefits all
countries is overturned. In a similar vein, Samuelson (2004) has argued that productivity
growth in trading partners may sometimes ‘permanently harm’ the trading country.
These concerns about the possibilities and consequences of productivity growth in
trading partners are also closely related to the discussion of technological catch-up of
developing economies, especially in the context of North-South trade. Increases in
productivity in developing economies often start with simple technology transfer type
activities, facilitated by openness and then proceed through investments by firms in
capability building (within economies of the South) to become distinctive niches that
underlie the competitive advantages of these nations.
Our paper speaks to these audiences and their concerns. It provides a quantitative
assessment of the periods when new countries emerged as technology producers (thus
demonstrating technological catch-up), and assesses how different phases and dimensions
of technological catch-up are related to globalisation. We distinguish between the earlier
phases of technological catch-up that rely on the building of simpler capabilities, the
outcome of which forms part of what is measured by cross-border licensing revenues, and
the attainment of higher level technology based competitiveness, which can be captured by
the inventive sources of patenting. The paper also pays attention to different dimensions of
globalisation in the world economy - openness to trade, share of foreign direct investment
(FDI), the use of international locations as sources for patenting by multinational
corporations (MNCs), and the proportion of the world’s population that migrated between
countries.
2
3

There are two reasons to expect that the relationship between technological catch-
up and globalisation varies with whether countries are at earlier stages of development that
require simpler capabilities, or have entered a more mature phase of development that relies
on sophisticated capabilities. First, when building simpler capabilities smaller firms may
play a more prominent independent entrepreneurial role, and there is less need for
organisational complexity and interconnected network structures. Therefore, earlier
technological catch-up relies less upon a system for sustained and continuous international
knowledge exchanges and interdependencies (of the kind that are facilitated by trade and
FDI), but depends more in the first instance upon indigenous learning efforts. Second, the
recent rise in technology trade and the outsourcing of knowledge-related functions that has
accompanied the fragmentation of value chains has created new opportunities for those
with at least basic capabilities in what were formerly less well internationally
interconnected locations, especially in developing countries. Some countries with basic
capabilities may thus now be able to establish new niches for themselves in international
knowledge creation that does not depend on an already prevailing system of trade and FDI.
Indeed, our empirical findings suggest a strong role for increasing inward direct
investment in the world economy as a factor inducing the emergence of new countries as
patentees (which usually does require international knowledge interdependencies), but only
some ambiguous evidence that greater openness to international trade explains the recent
surge of new countries as licensors in the world economy. We interpret the latter finding as
suggestive of the important role played by exogenous factors such as the emergence of
generic technologies that have facilitated the growth of technology trade often in
intangibles as argued by Athreye (1998) and Arora et al (2001). However, patenting by
MNCs from international sources (that is, from the innovative efforts of their subsidiaries
abroad) is enhanced by a weakening of the possibilities for trade. This may be because
3
4

when openness to trade declines, host countries rely to a greater extent on a local presence
by the subsidiaries of foreign-owned MNCs to foster technology creation, as opposed to
international business knowledge linkages that come through trade and subcontracting.
However, when international knowledge linkages are created through FDI, it facilitates the
consolidation of higher level capabilities locally, even though FDI is not usually the means
by which lower level capabilities are initially built up in the earlier stages of development.
Taken together, these findings are consistent with the view that multinationals require the
presence of local capabilities and infrastucture before they invest (Lall, 2001), and that they
tend in recent times to have followed knowledge-based asset-seeking strategies to reinforce
their competitive strengths as argued by authors such as Cantwell (1995), Dunning (1996),
Makino et al (2002), Pearce (1999) and Wesson (2005).
The remainder of the paper is organised as follows: A brief review of the literature
on the emergence of new technology producing countries and regions in Section 1, is
followed in Section 2 by an outline of the method employed in our study, including a
description of the method used to track technological catch-up in the world economy.
Section 3 describes our main results and Section 4 concludes.
1. Factors influencing the emergence of new technology producing regions
The influence of globalisation and human capital on the technological capacities of
a country is widely acknowledged in the literature on technology and development. Yet
globalisation has a dual dimension in the way that it influences the emergence of new
technology producers that is not often addressed in this literature. The rates of growth of
exports and imports in the global economy provide or close a demand opportunity for all
countries - this may be especially important in poorer countries where low incomes may
4
5
cause domestic markets to be small to start with. Periods of relatively greater openness are
therefore also often periods where the world economy enjoys a boom in demand as a result
of growth in incomes of trading countries. This growth of demand may contain new
technological opportunities inasmuch as technological opportunity is dependent both upon
the novelty of product demand and a large scale of operations. Globalisation in this first
sense provides the preconditions for the generation of technology within developing
countries and is one dimension that underlies what we study in this paper - namely, through
the measure of the openness of the world economy to trade.
The second dimension of globalisation (and the more widely studied one) is the
ability of countries to exploit such demand booms. Here supply-side factors such as levels
of infrastructure, stocks of human capital and existing technological capacity condition the
influence of openness. Whilst openness allows opportunities to import capital goods and
technology-embodied products, human capital, and linkages to demanding users such as
foreign-owned firms may well play an important role in the exploitation of the
opportunities offered by openness, but the capacity to exploit these advantages may also
vary with dynamic firm capabilities and the institutional infrastructure of the country.2
This second dimension is thus quite distinct from the first dimension, but is reflected in the
geographical dispersion by multinational companies of their subsidiary sources of
technological knowledge creation.
An important factor emphasised in the literature on the emergence of technology
producing regions is that such regions embody ‘untraded’ competencies (Storper 1997)
which includes technology generating economic and social institutions. Other studies have
also highlighted the role of human capital and training and the inertia associated with such
labour in some regions. Thus, studies on the emergence of new science based regions such
2 See for example the discussions of ‘social capability’ (Abramovitz 1991) and the importance of ‘absorptive capacity’ in realising the benefits of foreign investment. (Narula and Dunning, 2000).
5
6
as those by Bresnahan and Gambardella (2004), Arora and Gambardella (2005), Florida
(2002) suggest that human capital variations have opened up the possibility for new regions
and nations to occupy distinctive technological niches in a global market based upon their
comparative advantage in access to skilled labour. Recent examples of technological
catch-up such as those of Israel and Taiwan point to the important role of openness and
human capital investment in creating distinctive comparative advantage positions for the
countries often in global production chains (Ernst 2002, Ernst and Kim 2002).3 Human
capital improvements are also often intertwined with the ability to exploit inward foreign
direct investment. Thus, openness on one hand provides opportunities for the export of
goods and services from new regions but a certain lack of mobility of some key local
supporting factors (such as skilled labour, or universities) in the face of a generally open
environment may also attract foreign direct investment of a local technology promoting
kind.
It is also argued that the emergence of general purpose technologies, such as IT and
biotechnology have created conditions in which new technology markets have emerged
(Athreye 1998, Arora, Gambardella and Fosfuri, 2001). Key parts of this argument relate
to the role of technological convergence (facilitated by the emergence of generic
technologies) in creating a large scale of market, the lowered costs of experimentation due
to easier trial and error (for example through the widespread use of computer aided
simulation) and the emergence of new languages that allow some hitherto tacit knowledge
to be codified. The emergence of these new markets however represents a changing
division of labour where newer nations have a chance to specialise narrowly and emerge as
technology producers. Some work from the study of patent data seems to support this 3 These case studies also emphasise the large and coordinated investments by numerous agents in the economy required to achieve success in technological catch-up and the role of indigenous institutions in imparting unique advantages to nations. It is beyond the scope of the aggregated level of analysis of this paper to examine these aspects of technological catch-up, though we think such factors do affect the inter-country differences in catch-up.
6
7

conclusion. For example, Cantwell and Vertova (2004) find that the technological
diversification of nations has declined in recent years and from this they conclude that
newer countries have different opportunities for catch-up when compared to earlier periods
because they can afford to catch-up through a much narrower specialisation.
Thus, in assessing the factors due to which new countries emerge as technology
producers in the world economy, we need to take account of the openness of the world
economy, the movement of inward direct investment and migration as well as the growth
and variation of the stock of human capital. In addition, the technological developments in
the fields of IT and biotechnology may exercise an independent influence because the
development of these fields has opened up huge opportunities for niche technologies based
on recombination which many new countries with sufficient human capital can exploit.
While these technological developments are not directly measurable, their influence has
been noted in several studies since the late 1980s on the growing importance of the
knowledge-based economy.4
2. Data and Methodology employed
The interrelationship between trade, foreign direct investment, human capital and
economic growth, implies the challenge in statistically testing some of the relationships at
the country level lies in overcoming the biases introduced by endogeneity in the statistical
models. Consequently, disentangling their influence on growth and then on technological
catch-up is problematic. In this paper we construct an aggregated measure of technological
catch-up that does not depend upon growth measures in a direct way. This allows us to
bypass some of the endogeneity issues to do with technology and growth. However, the
interrelatedness between processes of globalisation and technology generation remains an
4 See for example, Foray and Lundvall (1996) and Antonelli (1998).
7
8
important issue. Thus technology generation may respond to the demand opportunities
created by openness while international producers may flock to regions of technological
advantage. We use time series techniques to address these issues of interrelatedness and to
assess the direction of statistical causality. This comes at a cost however, since we also
lose much of the variation across countries in the data which we could exploit. Thus, one
implication of the methodology we employ is that we cannot say very much about
individual cases of success or failure of economies to emerge as technology producers.
2.1 Data used in the analysis
2.1.1 Measuring technological catch-up
We use two measures to evaluate a country’s contribution to the production of
technology in the world economy. The first is a country’s share of patents issued by the
USPTO that are attributable to all non-US inventors, and the second is a country’s share of
licensing revenues in the world economy.
The USPTO database has advantages and disadvantages in the analysis of
technological behaviour and these have been widely discussed in the literature using patent
data.5 For our purposes a major advantage is that it helps us track the presence across
countries of advanced technology generating capabilities. However, the US patent share of
countries is an underestimate of the overall technological capacity of countries, which
includes more basic capabilities that are less likely to be associated with the kinds of
knowledge creation that gives rise to patenting. It may also be biased towards areas of
industry which are dominant in US imports. For these reasons, US patents provide an over-
representation of innovation in advanced manufacturing and in areas for which the US
market may be important, but they are a poor representation of innovation of a simpler
kind, in services and of technology trade that does not involve the US (e.g. trade between
5 See e.g. Schmookler, 1950, 1966, Pavitt, 1985, 1988; Griliches, 1990; Archibugi, 1992.
8
9

two developing countries). Since the mid-1980s, knowledge intensive services have been
increasing in importance for economic activity with several new countries becoming
involved in technology trade in these fields (e.g. software exports from India). For this
reason we also use the share of a country in international royalty and licensing revenues as
a second measure of their technological generation capacity. This better reflects earlier
stages of the development process and other aspects of innovations that have arisen in more
recent industrial history (most notably, innovation in services).
While patents can be used to generate licensing revenues, licensing can also happen
without the issuance of patents. Licensing is the more prevalent way of trading
technology-based business services between firms. However, it should be noted that unlike
US patents, licensing revenues are probably far more influenced by local institutional
conditions, transfer pricing practices of multinationals, and bilateral trade ties – factors that
we will lose sight of in the high level of aggregation of our data.
The emergence of new countries as technology producers should result in a greater
dispersion of technology shares as measured by indices of concentration like the
Herfindahl. We compute the Herfindahl index of concentration using the following
definition
Ht = Σ Sit2, (1)
where Sit is the technology share of the ith country at time t. We then exploit a
particular decomposition of the Herfindahl index, which splits the change in overall
concentration into a turbulence effect and a regression effect.6
∆Ht = Σi (∆Sit)2 + 2 Σi (Sit-1 ∆Sit) (2)
In equation (2), the first term of the RHS measures technology share turbulence (the
concentration of the change in shares). Both positive and negative changes have the same
6 For an application of this decomposition to study the evolution of market shares and concentration see Kambhampati and Kattuman (2003).
9
10

weight in this index and the larger the value of the turbulence the more changes there will
have been in technology shares. By construction the turbulence measure is always positive.
The second term is however, the more interesting one for tracking technological
catch-up by new countries. It measures the linear association between initial technology
share and the change in that share, weighting large initial shares more than small ones. We
call this the Inverse Regression Index (IRI), since negative values imply a regression of
country shares towards the mean.7
Negative values of the inverse regression effect come about when countries that had
initially larger technology shares are also those with negative values of ∆Sit, (i.e. when
these countries lose technology shares). When technology producers with small initial
shares have gained or lost patent shares these are given a smaller weight and the cross term
will have a smaller positive value than if the same were to happen to large patentees.
As new countries begin to make small gains in technology shares and erode the
shares of existing nations they cause lower positive values for the turbulence term and a
negative value for the inverse regression index. When some already dominant existing
countries are increasing their technology shares both terms will be positive and higher. In
general, turbulence tends to be greatest when it is the largest countries that make significant
gains and losses against one another, since at that end changes in shares tend to be higher in
absolute terms.
We use the IRI term as the dependent variable in a time series analysis to capture
the existence of technological catch-up. Thus, we compute two IRI measures-one based on
patent shares of countries (IRIP) and the second based on licensing (revenue) shares of
countries (IRIL) and use these as the variables in our analysis.
7 This very similar to the Galtonian regressions used in Cantwell (1991), in which the variance of shares is analogously decomposed into a mobility effect (measured by one minus the correlation coefficient), and a regression effect (measured by one minus the slope coefficient on lagged shares).
10
11

2.1. 2 The globalisation variables
The data for the globalisation variables are drawn by aggregating the data over
countries from well-known data sources and these are detailed in the Appendix to this
paper. We use four measures of globalisation in the world economy:
(i) Openness to trade as measured by the ratio of exports and imports to total
world income (OPEN);
(ii) The ratio of inward FDI stock to gross world income (IFDI);
(iii) The share of patents that are assigned to the largest foreign-owned MNCs
active in each host country across the world economy - a measure of the
globalisation of R&D or patenting by MNCs from international R&D
sources (INTPAT);
(iv) The proportion of population that migrated across countries as a
percentage of the world population (PROPMIG).
We also looked at the possibility of including measures of human capital such as the
share of tertiary educated population in the world economy, and the variance in the share of
tertiary educated population in the world economy. However the earliest period for which
such data became available in a consistent fashion was from 1970 and the data were
available only for five yearly intervals. Given the relatively short span (for a time series
analysis) we decided not to include these variables but to use an econometric methodology
capable of controlling for the influence of such omitted factors.
Table 1 below describes the variables used in the study and their expected influence
on IRIP and IRIL, based on the review of the previous section. We further note that since
IRIP and IRIL may also be capable of influencing one another the direction of their
relationship is potentially complex. The relationship may be expected to be positive for
11
12

two reasons. First, patents are sometimes issued with a view to earning licensing revenues,
so new patentees should also imply new licensees. Second, new licensors may over time
acquire the higher grade capabilities and networks that permit them to become patentees,
although the lag here from one to the other may be considerable. However, new
technology producers may first test the market for their technologies through licensing, and
especially when tacit elements of knowledge are important they may bundle licensing
revenues with services. Once the scope for their market becomes clear, they may seek to
patent their proprietary technologies. In this case new patentees will further concentrate
licensing revenues and the relationship between IRIL and IRIP may become negative.
[Table 1 here]
Augmented Dicky Fuller tests (with a trend and intercept) were used to determine
whether a variable was stationary or trended. The order of integration of all the
explanatory variables, reported in Table 2, indicate non-stationary in all the globalisation
variables. Since the IRI is constructed by decomposing the difference of the Herfindahl
index for patents and licensing shares, it is stationary to start with. We thus used first
differences of the globalisation variables along with IRIL and IRIP (in levels) for our
estimation.
[Table 2 here]
[Figure 1 here]
Figure 1 plots the main trends in the explanatory variables we considered, while
Table 3 reports the correlation matrix of explanatory variables. Figure 1 shows a rising
trend in all the explanatory variables though the levels of OPEN, IFDI and INTPAT seem
considerably higher than the values for PROPMIG. The correlation matrix also shows that
the globalisation variables are very highly correlated in levels. De-trending the data by
12
13
differencing we find the correlations are still evident but much more manageable for
estimation purposes.
[Table 3 here]
2.2 Econometric methodology
We use a Vector autoregressive system of equations (VAR henceforth) to model the
inter-relationship between the emergence of new technology producers and globalisation in
the world economy. The estimated VAR takes the form:
yt= α + A1yt-1+….Apyt-p +εt
where yt is a k vector of endogenous variables, α is a k-vector of constants, A1-Ap
are matrices of coefficients to be estimated and εt is an error term which we assume does
not display any correlation with its own values or the right hand side variables. Thus each
variable in the system is explained by its own past values and the past values of the other
variables. For the k variables in the VAR system this gives us k separate equations to
estimate simultaneously. In our case, k=6, viz. the four globalisation variables detailed in
Table 1 and the two catch-up variables IRIP and IRIL.
VAR systems avoid many common problems such as simultaneity (only lagged
values appear) and the absence of a full variable set (since we use lagged values of the
dependent variable itself as an explanatory variable). However, they are intensive in their
need for a long span of data at regular intervals. The lag length we use is also a matter of
choice. We use statistical tests on the goodness of fit of the equations in order to choose
the appropriate lag length.
To assess causality between the dependent and explanatory variables we used
Granger causality tests. In this exercise we ask the data to predict observed values of the
one variable (e.g. IRI) using past lagged values of the others (e.g OPEN). If the fitted
model successfully predicts values of the dependent variable then we infer that OPEN
13
14

granger causes the change in the IRI. This is in fact equivalent to rejecting the null
hypothesis that coefficients of the lagged variable OPEN are all zero. We can also evaluate
if all the globalisation variables are jointly significant in predicting changes in IRI. The
first is an individual variable test of causality that evaluates the individual coefficients
while the second is a joint test of the significance of all the coefficients. Both hypotheses
are evaluated by the use of a χ2 (Wald) test statistic. However, as this explanation makes
clear, Granger causality tests have a strict statistical meaning, viz. that of causality as
implying observational precedence, which may not always be the same thing as economic
causality.8
3. Empirical analysis
3.1: Assessing periods of technological catch-up
Trends in patenting and licensing revenues suggest that both rose dramatically in
the late 1980s and through the 1990s (see Figures A1 and A2 of the Appendix). The
number of countries actively patenting in the dataset rose slowly from 42 in 1950 to a high
of 60 in 1989, although not every country patented every year.9 Similarly as Figure 2 shows
the number of countries earning licensing revenues grew far more dramatically from about
35 in 1985 to over 83 in 2003. This is of course still a lot fewer than the total number of
countries we were able to collect economic data for from sources like the Penn Tables and
the World Development Indicators. Thus, like with firms, only a certain proportion of
countries patent and license their technologies - thus demonstrating higher grade
technological capabilities.
[Figure 2 here]
8 A popular classroom example of this is that it can be shown that weather forecasts granger cause the weather! 9 These numbers exclude the US as a country of invention, which is (of course) the major patentee in the USPTO dataset. Thus, the patent share of the US alone was over 90% in 1950 and fell over time, but was still high at 55% in 1995. To get a clearer picture about the role of new countries in patenting, we consider all foreign invented patents issued by the USPTO – i.e. we exclude US invented patents. See the Appendix for details about the patenting data used in the study.
14
15

Figure 3 below shows the overall trend in the Herfindahl index for patents and for
license shares. After a long period between 1954-1975 when overall concentration hovered
around 15%, the index rose in the period between 1975-1992, reaching a value of 28 % in
1992 but then it fell again to levels close to 22%. Licensing revenues show a sharper
decrease in overall inequality as the dramatic increase in countries reporting positive
revenues in Figure 2 also suggests. Though the trend in licensing revenues appears to show
a secular decline since the mid-1980s - the apparent break in trend in 1970 may reflect the
different coverage of the pre-1970 data sources. The licensing data strongly suggest that
more countries started to participate in generating technology and perhaps trading
technological knowledge through licensing since the mid-1980s.
[Figure 3 here]
However, it is the shares of technology generation that went to these newer
countries that are important – were they large enough to make a dent on the shares of the
technological leaders? Figure 4 below plots the IRI term of equation (3) for both licensing
shares and patent shares. Since patent numbers vary widely year-on-year they can cause
individual patent shares to fluctuate widely. The variations in licensing revenues are even
wider. To smooth the data for these variations we also plot a three period moving average
for the two IRI terms.
[Figure 4 here]
Figure 4 shows that through much of the 1950s and 1960s the inverse regression
index values for patents were negative, reflecting a loss of patent shares to new patentees.
The negative values were somewhat larger in the 1950s than in the 1960s, when they
hovered between 0.0 and 0.5. The period 1992- 2001 has also been one of catch-up, with
smaller patentees gaining patent share. In the intervening period (1972-92) the index
turned positive and continued to rise in value up until the mid-1980s. Thus, for much of
15
16
the period since the mid-1970s a small number of countries consolidated their technological
positions and accounted for a growing share of world technology generating capacity. This
view of the overall concentration in technological activity in a few countries from 1975-92
is consistent with the results of another recent study, using a different methodology by
Kumar and Russell (2002).
The values of IRI on licensing shares for the pre-1970 period are difficult to
interpret as they may reflect the different source of data. However, from 1955-2003, the
IRI for licensing was negative in 32 time periods and positive in only 17. This is
comparable to similar values for the IRI in patenting: from 1950-2001 the IRI was positive
in 12 time periods and negative in 38. In the case of licensing revenues too, there seems to
have been some consolidation in the late seventies and early eighties but mostly, negative
values thereafter. Indeed unlike the case of patenting, the decline in IRI for licensing sets in
much earlier in the mid-1980s and stays negative for much of the remaining period.
In both cases, there was relatively little turbulence in the cross-country distribution,
and so the changes in the Herfindahl index were mostly due to changes in the Inverse
Regression Index. As we explained in Section 2.1 this is an indication that new countries
have emerged as significant technology producers.
3.2 Results of the VAR estimation
Tables 4 reports the results of the VAR estimations described in Section 2.3. The
results are reported in matrix form with column headings indicating the equation being
reported. The t-values of coefficients appear in square brackets under the coefficient
values- values greater than 1.56 indicate significance at the 5% level. The Likelihood Ratio
test, the Akaike Information Criterion and the Final Prediction Error tests ( not reported in
the paper) showed a lag length of one period to be the appropriate one to use in our
16
17

estimation.10 To take account for the different source of the data from 1970 and the
apparent break in trend caused by it, we substituted the average of values from 1969 to
1971 for the year 1970.
Looking at the results of the first VAR equation (for IRIP), we find that the IRIP is
affected by its own lagged values. IFDI has a negative, statistically significant coefficient.
Since negative values of the IRIP indicate the emergence of new patentees we conclude
that increases in IFDI is associated with the emergence of new technology producers with
higher level capabilities. INTPAT and PROPMIG also influence IRIP, but positively, and
so increases in MNC patenting from international sources and the proportion of migrant
population are associated with concentrating technology production among existing
patentees. IRIL does not have a significant impact on IRIP.
Moving to the next column, we find that IRIL is not influenced by its own past
values or even IRIP. However, as might be expected, it is negatively associated with
OPEN, and thus greater openness to international trade helps to promote the emergence of
new technology producers that have the basic capabilities needed to become licensors.
OPEN is itself associated with higher IFDI and lower MNC patenting from international
sources. IFDI is influenced by its own past values, whilst PROPMIG is influenced by both
OPEN and IFDI. INTPAT is negatively associated with OPEN.
Some of these results accord with what is observed in other cross-country studies.
Studies of the Four Dragons and Japan for example, show the role of openness and foreign-
owned firms in technology acquisition and the technological capability building process
(Hobday, 1995). The results on licensing suggest that with basic capabilities openness to
trade is more important than the attraction of FDI. In the earlier stages of development
international business linkages can take a variety of forms (such as the export of
10 All tests were evaluated at the 5% level of significance. The Schwarz Information Criteria and the Hannan-Quinn Information criteria indicate a lag length of zero is appropriate.
17
18
components to MNC networks under subcontracting agreements). This is also consistent
with the view that the opportunities offered by the growth of technology trade have opened
up a new potential amongst certain countries to take advantage of some established
capabilities through knowledge service provision that need not be tied to FDI networks.
Put differently, the growing division of innovative labour between countries may be based
as much upon a widening of the kinds of comparative advantage of nations that are relevant
to knowledge provision, as it is upon the availability of new technological opportunities as
such. Secondly, as we noted earlier licensing is more sensitive to local institutional and
governance factors. These factors would exercise less influence on patenting through the
USPTO. The aggregated measures for the world economy effects that we use in this
analysis would not be able pick up individual country level processes.
3.3. Assessing Granger Causality
We turn now to the Granger causality tests that reported in Table 5. Wald statistics
are shown against each variable along the columns. The results for IRIP show that IFDI,
INTPAT and PROPMIG granger causes changes in the IRIP. Further, we cannot reject the
hypothesis that the influence of the globalisation variables jointly is equal to zero, i.e. they
are jointly relevant to predicting the emergence of new patentees. In contrast, IRIL is not
influenced individually or jointly by any of the globalisation variables.
Turning now to the globalisation variables we find INTPAT granger causes OPEN,
and OPEN granger causes INTPAT. There is thus, bi-directional causality between these
two variables. However, FDI is not influenced by the values of any of the other variables.
PROPMIG is influenced by all the other globalisation variables. There is no suggestion
however, that the globalisation variables are themselves caused by changes in IRIL and
IRIP.
18
19
As we noted earlier, Granger causality interprets causality in a narrow way as a
matter of statistical precedence. Yet we feel our results may be consistent with an
interpretation of economic causality because both of our main findings with respect to IRIP
and INTPAT are consistent with the observation made by many scholars that inward FDI
seeks global sources of competitive advantage and will be drawn to regions of advantage.
Further, though periods of globalisation in the world economy have also always thrown up
new technology producers in the world economy – this has often been relatively few new
countries.
4. Summary and conclusions
In this paper we use measures of technological catch-up in the world economy to try
and assess periods of catch-up as well as to assess to what extent globalisation causes
changes in catch-up. These trends differ depending upon whether we look at the
geographical dispersal of the more sophisticated capabilities associated with patent shares
or the wider range of capabilities reflected by licensing (revenue) shares. Patenting shows
evidence of technological catch-up in the 1950s and 1960s and again in the period 1992-
2001. However, licensing revenues show a secular trend towards the emergence of new
countries as licensors starting from the mid-1980s onwards and gathering speed in the
1990s. This trend we speculate may be related to the new opportunities for niche strategies
connected with the increasing importance of knowledge-intensive services since the 1980s,
noted by several scholars.
Studying the impact of globalisation in explaining the emergence of new producers
of technology we again find dissimilar results for patenting and licensing (revenue) shares.
In the case of patenting we find evidence that inward foreign direct investment matters in
the emergence of new technology producers with the higher level capabilities needed.
19
20

MNC patenting from international sources and international migration also matter - they
promote concentration of patent shares, and thus constrain the incidence of higher levels of
technological catch-up across countries. Looking at licensing shares however, the
influence that runs from greater openness in the world economy to the emergence of new
countries as licensees does not appear to be robust, as it holds only in our VAR analysis
and not in the tests of Granger causality.
Lastly, despite the weakness of the effect of changes in the openness of the world
economy on the emergence of lower level new technology producers, we do find that
openness influences the other variables of globalisation. More open periods are also
periods of higher migration. Further, a reduction in openness in the world economy
predicts an increase in the extent of MNC patenting from international sources, and perhaps
from new locations. Both of these trends however imply the consolidation of technological
knowledge creation in fewer countries, albeit by means of drawing upon resources from
outside the established home bases of MNCs.
Our results are also suggestive of a general pattern in the linkages between
globalisation and technological catch-up that may not be true of all countries at all times,
but which has been observed on average in the post-war period. That is, in the earlier stages
of capability development, catch-up relies mainly on a localised and indigenous learning
that is not closely interconnected with current knowledge creation elsewhere in the world,
and so does not rely on prior FDI. However, once basic capabilities are formed, locations
can begin to act as creative nodes within global production networks, initially more
commonly through trade and subcontracting linkages, rather than through FDI. Yet when
the scope of trade and subcontracting networks are reduced, the role of local subsidiaries in
knowledge-creating nodes is likely to be increased. That is, the wider dispersion of
knowledge-generating capabilities by multinational firms come to take advantage of new
20
21

potential sources of ideas and begins to integrate them more fully into their international
corporate networks. Indeed, when moving on to the higher levels of technological
development needed for the later stages of catch-up, participation in the international
interconnectedness of knowledge networks provided by MNCs through FDI are more likely
to be a precondition.
21
22
References:
Abramovitz, M. (1991): Thinking About Growth and Other Essays on Economic
Growth and Welfare. Cambridge: Cambridge University Press.
Antonelli, C. (1998): Localized technological change, new information technology
and the knowledge-based economy: the European evidence, Journal of Evolutionary
Economics, Vol. 8, pp. 177 – 198.
Archibugi D. (1992): Patenting as an indicator of technological innovation: a
review, Science and Public Policy, Vol. 19, pp. 357-68.
Arora, A. and A. Gambardella (2005): From Underdogs to Tigers: The Rise and
Growth of the Software Industry in Brazil, China, India, Ireland, and Israel. Oxford:
Oxford University Press.
Athreye, S. (1998): On markets in knowledge, Journal of Management and
Governance, Vol. 1(2), pp. 231-253.
Arora, A., A. Fosfuri and A. Gambardella (2001): Markets for Technology,
Cambridge, Mass.: MIT Press.
Beausang, F. (2004) Outsourcing and the Internationalization of Innovation,
Working Paper 18, The American University of Paris, Paris.
Bresnahan, T and A. Gambardella (2004): Building High Tech Clusters: Silicon
Valley and Beyond, Cambridge: Cambridge University Press.
Cantwell, J.A. (1991): The international agglomeration of R&D, in Casson, M.C.
(ed.) Global Research Strategy and International Competitiveness, Oxford: Basil
Blackwell.
Cantwell, J.A. ( 1995): The globalisation of technology: what remains of the
product cycle model? Cambridge Journal of Economics, Vol. 19, pp. 155-174.
22
23

Cantwell, J.A. and G. Vertova (2003): Historical evolution of technological
diversification, Research Policy, Vol. 33, pp. 511-529.
Dunning, J. H. (1993): Multinational Enterprises and the Global Economy,
Wokingham: Addison Wesley.
Dunning, J. H. (1996): The geographic sources of the competitiveness of firms:
some results of a new survey. Transnational Corporations, Vol. 5, pp. 1-29.
Dunning, J.H. and J.A. Cantwell (1987): The IRM Directory of Statistics of
International Investment and Production, London: Macmillan.
Ernst, D. (2002): Global production networks and the changing geography of
innovation systems: implications for developing countries, Economics of Innovation and
New Technology, Vol. 11 (6), pp. 497-523.
Ernst, D. and Kim, L. (2002): Global production networks, knowledge diffusion and
local capability formation, Research Policy, Vol. 31 (8-9), pp. 1417-1429.
Florida, Richard (2002): The economic geography of talent, Annals of the
Association of American Geographers Vol. 92 (4), pp. 743-755.
Foray, D. and Lundvall, B.A. (eds., 1996): Employment and Growth in the
Knowledge-Based Economy, Paris: OECD.
Gomroy, R. and Baumol, W. (2000): Global Trade and Conflicting National
Interests, Cambridge, Mass.: MIT Press.
Griliches, Z. (1990): Patent statistics as economic indicators: a survey, Journal of
Economic Literature, Vol. 28, pp. 1661-707.
Hobday, M. (1995): Innovation in East Asia: The Challenge to Japan, Aldershot:
Edward Elgar.
23
24
Khambampati, U. and P. Kattuman (2003), Growth Response to Competitive
Shocks - Market Structure Dynamics under Liberalization: The Case of India’, Working
Paper No. 263, ESRC Centre for Business Research, University of Cambridge.
Kumar, S. and Russell, R.R. (2002): Technological change, technological catch-up
and capital deepening: relative contributions to growth and convergence, American
Economic Review, Volume 92, pp. 527-548.
Lall, S. (2001): Competitiveness, Technology and Skills, Cheltenham: Edward
Elgar.
Makino, S., Lau, C.-M. and Yeh, R.-S. (2002): Asset exploitation versus asset
seeking: implications for location choice of foreign direct investment from Newly
Industrialised Economies, Journal of International Business Studies, Vol. 33, pp. 403-421.
Narula, R. and J. Dunning (2000): Industrial development, globalisation and
multinational enterprises: new realities for developing countries”, Oxford Development
Studies, Vol. 28, pp. 141-167.
Pavitt K.L.R. (1985): Patent statistics as indicators of innovative activities:
possibilities and problems, Scientometrics, Vol. 7, pp. 77-99.
Pavitt K.L.R. (1988): Uses and abuses of patent statistics, in van Raan, A.F.J. (ed.),
Handbook of Quantitative Studies of Science and Technology, Amsterdam: Elsevier
Science Publishers.
Pearce, R.D. (1999): The evolution of technology in multinational enterprises: the
role of creative subsidiaries, International Business Review, Vol. 8, pp. 125-148.
Samuelson, P.A.(2004): Where Ricardo and Smith rebut and confirm the arguments
of mainstream economists supporting globalisation, Journal of Economic Perspectives,
Vol. 18 (3): 135-146.
24
25
Schmookler J. (1950): The interpretation of patent statistics, Journal of the Patent
Office Society, Vol. 32, pp. 123-146.
Schmookler J. (1966): Inventions and Economic Growth, Cambridge, Mass.:
Harvard University Press.
Storper, M. (1997) The regional world: territorial development in a global economy,
New York: Guilford Press.
UNCTC (1973): MNCs in World Development, New York: United Nations
Conference on Trade and Commerce.
Wesson, T. (2005): Foreign Direct Investment and Competitive Advantage,
Cheltenham: Edward Elgar, forthcoming.
25
26

FIGURES
Figure 1: Trends in the globalisation variables
0
10
20
30
40
50
60
1950
1952
1954
1956
1958
1960
1962
1964
1966
1968
1970
1972
1974
1976
1978
1980
1982
1984
1986
1988
1990
1992
1994
1996
1998
2000
year
%
OPENIFDIINTPATPROPMIG
26
27
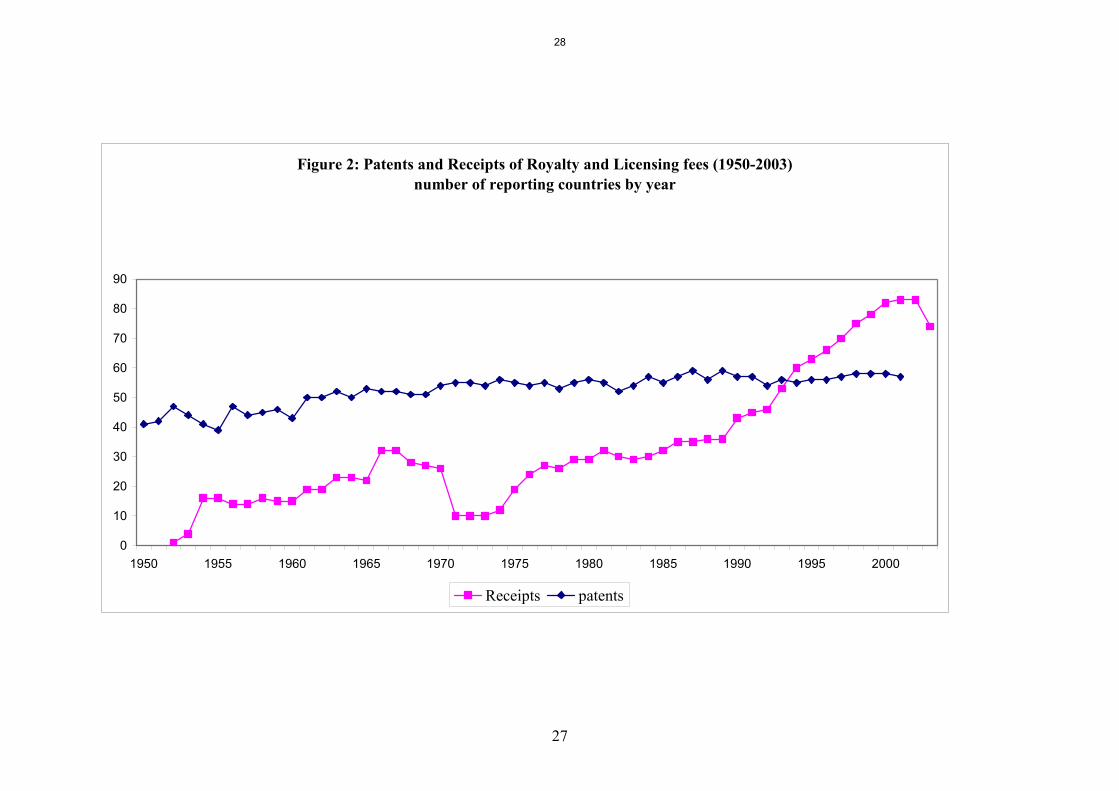
Figure 2: Patents and Receipts of Royalty and Licensing fees (1950-2003) number of reporting countries by year
0
10
20
30
40
50
60
70
80
90
1950 1955 1960 1965 1970 1975 1980 1985 1990 1995 2000
Receipts patents
27
28

Figure 3: Herfindahl index of Patents and Licensing revenues
0
0.1
0.2
0.3
0.4
0.5
0.6
0.7
1950 1955 1960 1965 1970 1975 1980 1985 1990 1995 2000
Year
H in
dex HerfPat
HerfLic
28
29

Figure 4: IRI for Patent and Licensing (revenue) shares
-0.15
-0.1
-0.05
0
0.05
0.1
0.15
0.2
1950 1955 1960 1965 1970 1975 1980 1985 1990 1995 2000
Year
IRI patent IRILic
3 per. Mov. Avg. (IRI patent) 3 per. Mov. Avg. (IRILic)
29
30

TABLES
Table 1: Explanatory Variables used in the econometric analysis (All ratios expressed in percentages)
Variable Description Influence on IRIP/IRIL
OPEN (Import + Export) / real GDP (1996
constant) -
IFDI Share of Inward FDI Stock as a proportion of World GDP
-
INTPAT Share of patents assigned to large foreign-owned firms in foreign locations
+
PROPMIG Absolute value of migrant population to world population
?
See Appendix for data sources used in the construction of the variables.
Table 2: Results of ADF Unit Root Tests
Variable Order of Integration Data Span
IRIP I(0) 1950-2001
IRIL I(0) 1955-2001
OPEN I(1) 1950-2000
IFDI I(2) 1950-2000
INTPAT I(1) 1950-2001
PROPMIG I(1) 1955-2000
Note: All tests are significant at the 5% level of significance
30
31

Table 3: Cross correlation matrix of explanatory variables (in levels and
differences)
LevelsOPEN IFDI INTPAT PROPMIG
OPEN 1.00IFDI 0.93 1.00INTPAT 0.81 0.93 1.00PROPMIG 0.89 0.89 0.72 1.00
DifferencesOPEN IFDI INTPAT PROPMIG
OPEN 1.00IFDI 0.17 1.00INTPAT -0.63 -0.17 1.00PROPMIG 0.30 0.08 -0.45 1.00
31
32

Table 4: VAR estimation (1955-2001), t-values in square brackets IRIPt IRILt ∆(OPEN)t ∆(IFDI)t ∆(INTPAT)t ∆(PROPMIG)t
Constant 0.00 0.00 0.01 0.19 0.22 0.02[-0.41] [ 0.05] [ 2.61] [ 1.37] [ 2.65]
[ 0.85]
IRIPt-1
0.04 -0.80 0.49 5.96 5.86 2.12 [ 0.20] [-0.74] [ 1.54] [ 0.42] [ 0.68]
[ 1.08]
IRILt-1 -0.02 0.06 0.02 1.58 0.28 -0.07 [-0.68] [ 0.40] [ 0.36] [ 0.75] [ 0.22] [-0.23]∆(OPEN) t-1 -0.09 -1.08 0.07 -1.07 -11.10 2.54
[-0.75] [-1.62] [ 0.37] [-0.12] [-2.07] [ 2.10]∆(IFDI)t-1 0.00 -0.01 0.00 0.89 -0.04 -0.05 [-1.92] [-0.65] [1.56] [ 6.56] [-0.49] [-2.49]∆(INTPAT)t-1 0.01 0.00 -0.01 -0.35 0.30 -0.07 [ 2.69] [-0.16] [-1.68] [-1.02] [ 1.43] [-1.52]∆(PROPMIG)t-1 0.04 -0.01 0.01 0.40 1.38 -0.21 [ 1.82] [-0.13] [ 0.25] [ 0.27] [ 1.54] [-1.03]Diagnostics (single equations)
R-squared
0.43 0.10 0.15 0.59 0.32 0.31Adj. R-squared 0.34 -0.05 0.02 0.52 0.21 0.20Sum sq. resids 0.00 0.04 0.00 7.43 2.73 0.14F-statistic 4.64 0.67 1.11 8.72 2.93 2.77Log likelihood 166.35 90.28 143.77 -23.31 -1.25 64.08Akaike AIC -7.24 -3.79 -6.22 1.38 0.38 -2.59Schwarz SC -6.96 -3.50 -5.93 1.66 0.66 -2.31
Diagnostics (VAR system)
Log likelihood 460.70 Akaike information criterion -19.03 Schwarz criterion -17.33
32
33
Table 5: VAR Granger causality (Wald) tests Dependent variable: IRIP IRIL ∆(OPEN)
Excluded Chi-sq df Prob. Excluded Chi-sq df Prob. ExcludedChi-sq df Prob.
IRIL 0.46 1 0.50 IRIP 0.55 1 0.46 IRIP 2.37 1 0.12∆(OPEN) 0.56 1 0.45 ∆(OPEN) 2.62 1 0.11 IRIL 0.13 1 0.72∆(IFDI) 3.70 1 0.05 ∆(IFDI) 0.43 1 0.51 ∆(IFDI) 2.43 1 0.12∆(INTPAT) 7.23 1 0.01 ∆(INTPAT) 0.03 1 0.87 ∆(INTPAT) 2.84 1 0.09∆(PROPMIG) 3.32 1 0.07 ∆(PROPMIG) 0.02 1 0.90 ∆(PROPMIG) 0.06 1 0.80All 15.12 5 0.01 All 4.02 5 0.55 All 5.06 5 0.41∆(IFDI) ∆(INTPAT) ∆(PROPMIG)
Excluded Chi-sq df Prob. Excluded Chi-sq df Prob. ExcludedChi-sq df Prob.
IRIP 0.17 1 0.68 IRIP 0.46 1 0.50 IRIP 1.17 1 0.28IRIL 0.56 1 0.45 IRIL 0.05 1 0.82 IRIL 0.06 1 0.81∆(OPEN) 0.02 1 0.90 ∆(OPEN) 4.29 1 0.04 ∆(OPEN) 4.40 1 0.04∆(INTPAT) 1.04 1 0.31 ∆(IFDI)) 0.24 1 0.63 ∆(IFDI) 6.22 1 0.01∆(PROPMIG) 0.07 1 0.79 ∆(PROPMIG) 2.39 1 0.12 ∆(INTPAT) 2.30 1 0.13All 2.19 5 0.82 All 6.37 5 0.27 All 16.59 5 0.01
33
34

Appendix: Data sources
We use two measures of the IRI index as the dependent variable: the first
computed over patent shares and the second computed over shares of licensing
revenues.
The patent shares we use are the share of each country in the patents issued
every year by the USPTO that are attributable to all non-US inventors. The total
number of patents in each year is shown in Figure A1 below.
Figure A1: Growth in non-US held Patents (1950-2001)
0
20000
40000
60000
80000
100000
120000
140000
160000
180000
Y ear
The share of licensing revenues was calculated by collating information from
two sources. For the period 1950-70, we consulted The IMF Balance of Payments
Yearbook (various years), which reports royalty and licensing fees in current USD by
country. From 1970-2001, we used the World Development Indicators database that
collates royalty and licensing revenues in current USD separately for each country
(http://www.worldbank.org/data/onlinedatabases/onlinedatabases.html). Data for the
34
35

total licensing revenues for the world economy for the period 1970-2003 were
available from the World Development Indicators online database, and for the period
1950-1969 the values were calculated by summing up licensing revenues by each
country for the period 1950-1969 - these are plotted in Figure A2 below. Country
shares of world licensing revenues were then computed by dividing each country’s
revenue by the total for the world economy in any year.
Figure A2: Royalty and Licensing fees (1950-2003)millions USD
0
10000
20000
30000
40000
50000
60000
70000
80000
90000
100000
1950
1952
1954
1956
1958
1960
1962
1964
1966
1968
1970
1972
1974
1976
1978
1980
1982
1984
1986
1988
1990
1992
1994
1996
1998
2000
2002
Receipts
The explanatory variables were collated from diverse sources. The openness
index has been computed using data contained in the Penn World Tables
(http://pwt.econ.upenn.edu/ - last downloaded March 2005).
Inward FDI stocks in current USD by country and aggregated for the world
economy were available in a consistent way for the period 1980-2001, from the World
Investment Report (2004) published by UNCTAD
(http://www.unctad.org/Templates/Page.asp?intItemID=1890&lang=1). For earlier
35
36

years (1950-79) we constructed the Inward FDI stock by extrapolating on the basis of
available Inward FDI flow data for the same period and utilizing Inward FDI stock
data for several benchmark years that were available. For the years 1950, 1960, 1967
and 1973 we used the data in Dunning (1993: Chapter 5), and for 1966 and 1971 the
estimates reported in UNCTC (1973). MNCs in World Development. We estimated
the end of year stocks in all the intervening years between benchmark years by
proportioning the overall change in stocks between years in line with the
proportioning of the total cumulative flow.
Inward FDI flow data for 1970-1979 are available from UNCTAD Handbook
of Statistics (online database). Where Inward FDI flows were not available (1950-
1964), World total Inward FDI flows were assumed equal to the sum of the US and
UK outflows. Inward FDI flow data for the period 1965-1969 is provided by
UNCTC(1973). Inward FDI stock data by country for the year 1975 was estimated in
Dunning & Cantwell (1987).
The proportion of international patents was computed by identifying the
patents held by large foreign-owned firms that were attributable to subsidiary sources
of invention outside their respective home countries. We aggregated these data,
available by host country and year (1950-1995), to create a measure of the number of
foreign held patents in the world economy. For the period 1996-2001 we used the
1995 values.
International migration data were available by country for five year intervals
from the UN Common database downloadable from
(http://unstats.un.org/unsd/cdb/cdb_help/cdb_quick_start.asp). The figure for net
migration refers to the net average annual number of migrants, that is, the annual
number of immigrants less the annual number of emigrants, including both citizens
36
37

37
and non-citizens. Migration as percentage of total population was calculated by
utilizing population data from the World Population Prospects, published by UN
Population division and available online at (http://esa.un.org/unpp/).
38

Titles available in the series: Number 1 Valuing the environmental impacts of open cast coalmining: the case of
the Trent Valley in North Staffordshire Andrew B Trigg and W Richard Dubourg, June 1993
Number 2 Scarcity and stability in a very simple general equilibrium model Vivienne Brown, February 1994
Number 3 A conflict model, with rational expectations, of the disinflation of the early 1980s Graham Dawson, February 1994
Number 4 Foreign Investment, Globalisation and International Economic Governance Grahame Thompson, May 1994
Number 5 Testing the Small Country Hypothesis for Developing Countries Jonathan Perraton, December 1994
Number 6 The Discovery of ‘Unpaid Work’: the social consequences of the expansion of ‘work’ Susan Himmelweit, June 1995
Number 7 Exit, Voice and Values in Economic Institutions Graham Dawson, June 1995
Number 8 Residential Summer Schools Attendance and Students’ Assessed Performances on Open University Foundation Courses Alan Gillie and Alan Woodley, June 1995
Number 9 Putting Words into People’s Mouths? Economic Culture and its Implications for Local Government Maureen Mackintosh, December 1995
Number 10 What is a Fair Wage? A Critique of the Concept of the Value of Labour-Power Susan Himmelweit, December 1995
Number 11 The Origin of the Poverty Line Alan Gillie, December 1995
Number 12 The Determinants of Product and Process Innovations Roberto Simonetti, Daniele Archibugi, Rinaldo Evangelista, February 1996
Number 13 Technical Change and Firm Growth: ‘Creative Destruction’ in the Fortune List, 1963-1987 Roberto Simonetti, February 1996
Number 14 Utilities vs. Rights to Publicly Provided Goods: Arguments and Evidence from Health-Care Rationing Paul Anand and Allan Wailoo, January 2000
Number 15 Proceeding to the Paddling Pool: The Selection and Shaping of Call Centre Labour George Callaghan and Paul Thompson, January 2000
Number 16 Doing ‘Qualitative Research’ in Economics: Two Examples and Some Reflections Elizabeth Hill and Gabrielle Meagher, November 1999
Number 17 Veblen, Bourdieu and Conspicuous Consumption Andrew B Trigg, January 2000
39

Number 18 The Effect of Idiosyncratic Events on the Feedback between Firm Size and Innovation Mariana Mazzucato, January 2000
Number 19 Non-market relationships in health care Maureen Mackintosh and Lucy Gilson, January 2000
Number 20 Selling pollution and safeguarding lives: international justice, emissions trading and the Kyoto Protocol Graham Dawson, October 2000
Number 21 Entrepreneurship by Alliance Judith Mehta and Barbara Krug, September 2000
Number 22 A disorderly household - voicing the noise Judith Mehta, October 2000
Number 23 Sustainable redistribution with health care markets? Rethinking regulatory intervention in the Tanzanian context Maureen Mackintosh and Paula Tibandebage, November 2000
Number 24 Surplus Value and the Keynesian Multiplier Andrew B Trigg, October 2000
Number 25 Edwards Revised: Technical Control and Call Centres George Callaghan and Paul Thompson, November 2000
Number 26 Social Norms, Occupational Groups and Income Tax Evasion: A Survey In The UK Construction Industry Maria Sigala, November 2000
Number 27 Procedural Fairness in Economic and Social Choice: Evidence from a Survey of Voters Paul Anand, December 2000
Number 28 Alternative rationalities, or why do economists become parents? Susan Himmelweit, December 2000
Number 29 Agglomeration and Growth: A Study of the Cambridge Hi-Tech Cluster Suma Athreye, December 2000
Number 30 Sources of Increasing Returns and Regional Innovation in the UK Suma Athreye and David Keeble, January 2001
Number 31 The Evolution of the UK software market: scale of demand and the role of competencies Suma Athreye, September 2000
Number 32 Evolution of Markets in the Software Industry Suma Athreye, January 2001
Number 33 Specialised Markets and the Behaviour of Firms: Evidence from the UK’s Regional Economies Suma Athreye and David Keeble, January 2001
Number 34 Markets and Feminisms Graham Dawson, January 2001
Number 35 Externalities and the UK Regional Divide in Innovative Behaviour Suma Athreye and David Keeble, January 2001
Number 36 Inequality and redistribution: analytical and empirical issues for developmental social policy Maureen Mackintosh, March 2001
40

Number 37 Modelling the Dynamics of Industry Populations Mariana Mazzucato and P A Geroski, January 2001
Number 38 Advertising and the Evolution of Market Structure in the US Car Industry during the Post-War Period (withdrawn) Mariana Mazzucato and P A Geroski, January 2001
Number 39 The Determinants of Stock Price Volatility: An Industry Study Mariana Mazzucato and Willi Semmler, February 2001
Number 40 Surplus Value and the Kalecki Principle in Marx’s Reproduction Schema Andrew B Trigg, March 2001
Number 41 Risk, Variety and Volatility in the Early Auto and PC Industry Mariana Mazzucato, March 2003
Number 42 Making visible the hidden economy: the case for gender impact analysis of economic policy Susan Himmelweit, August 2001
Number 43 Learning and the Sources of Corporate Growth Mariana Mazzucato and P A Geroski, June 2001
Number 44 Social Choice, Health and Fairness Paul Anand, September 2002
Number 45 The Integration of Claims to Health-Care: a Programming Approach Paul Anand, November 2002
Number 46 Pasinetti, Keynes and the principle of Effective Demand Andrew B Trigg and Frederic S Lee, June 2003
Number 47 Capabilities and Wellbeing: Evidence Based on the Sen-Nussbaum Approach to Welfare Paul Anand, Graham Hunter and Ron Smith, January 2004
Number 48 Entry, Competence-Destroying Innovations, volatility and growth: Lessons from different industries Mariana Mazzucato, June 2004
Number 49 Taking risks with ethical principles: a critical examination of the ethics of ‘ethical investment’ Graham Dawson, November 2004
Number 50 Innovation and Idiosyncratic Risk: an Industry & Firm Level Analysis Mariana Mazzucato and Massimiliano Tancioni, November 2005
Number 51 Industrial Concentration in a Liberalising Economy: a Study of Indian Manufacturing Suma Athreye and Sandeep Kapur, October 2004
41


![Openness Agreements: Part Two The Reality of Openness · Presented by © Adoptive Families Association of BC [2016] Openness Agreements: Part Two The Reality of Openness](https://img.dokumen.tips/doc/110x75/5e81797d22c1fb32191241b3/openness-agreements-part-two-the-reality-of-openness-presented-by-adoptive-families.jpg)