Embed Size (px)
Citation preview
‘Errors’ and omissions in paper-basedearly warning scores: the associationwith changes in vital signs—a databaseanalysis
David A Clifton,1 Lei Clifton,2 Dona-Maria Sandu,1 G B Smith,3 Lionel Tarassenko,1
Sarah A Vollam,4 Peter J Watkinson4
To cite: Clifton DA, Clifton L,Sandu D-M, et al. ‘Errors’and omissions in paper-based early warning scores:the association with changesin vital signs—a databaseanalysis. BMJ Open 2015;5:e007376. doi:10.1136/bmjopen-2014-007376
▸ Prepublication history andadditional material isavailable. To view please visitthe journal (http://dx.doi.org/10.1136/bmjopen-2014-007376).
Received 4 December 2014Revised 3 May 2015Accepted 7 May 2015
1Institute of BiomedicalEngineering, Universityof Oxford, Oxford, UK2Centre for Statistics inMedicine, University ofOxford, Oxford, UK3Centre of PostgraduateMedical Research &Education (CoPMRE), theSchool of Health & SocialCare, BournemouthUniversity, Bournemouth, UK4Nuffield Department ofClinical Neurosciences,University of Oxford,Oxford, UK
Correspondence toDr Peter J Watkinson;[email protected]
ABSTRACTObjectives: To understand factors associated witherrors using an established paper-based early warningscore (EWS) system. We investigated the types oferror, where they are most likely to occur, and whether‘errors’ can predict subsequent changes in patient vitalsigns.Methods: Retrospective analysis of prospectivelycollected early warning system database from a singlelarge UK teaching hospital.Results: 16 795 observation sets, from 200postsurgical patients, were collected. Incompleteobservation sets were more likely to containobservations which should have led to an alert thancomplete observation sets (15.1% vs 7.6%, p<0.001),but less likely to have an alerting score correctlycalculated (38.8% vs 30.0%, p<0.001). Mis-scoringwas much more common when leaving a sequence ofthree or more consecutive observation sets withaggregate scores of 0 (55.3%) than within thesequence (3.0%, p<0.001). Observation sets that‘incorrectly’ alerted were more frequently followed by acorrectly alerting observation set than error-free non-alerting observation sets (14.7% vs 4.2%, p<0.001).Observation sets that ‘incorrectly’ did not alert weremore frequently followed by an observation set that didnot alert than error-free alerting observation sets(73.2% vs 45.8%, p<0.001).Conclusions: Missed alerts are particularly commonin incomplete observation sets and when a patient firstbecomes unstable. Observation sets that ‘incorrectly’alert or ‘incorrectly’ do not alert are highly predictive ofthe next observation set, suggesting that clinical staffdetect both deterioration and improvement in advanceof the EWS system by using information not currentlyencoded within it. Work is urgently needed tounderstand how best to capture this information.
INTRODUCTIONPaper-based early warning score (EWS)systems are a common part of the manage-ment of hospitalised adult patients. Suchsystems assign weightings to vital sign obser-vations; these weightings are summed to
produce an aggregate score. An alert may begenerated if any individual weighting or theaggregate score are above set thresholds.Smith and Oakey1 investigated error rates inaggregate scores as they introduced an EWSduring an outbreak of Legionnaires’ disease,reporting error rates >20%. Error ratesappeared to change over time and a largeproportion of observation sets did not haveaggregate scores calculated, making the find-ings difficult to generalise. High error rateshave also been found in the assignment ofweightings2 and in a classroom environmentwhen nursing staff entered vital signs from aprovided list onto an early warning chart.3
Mohammad et al4 found that, even whenusing a handheld computer, error rates wereincreased on the ward in comparison to theclassroom environment. Finally, error rateshave been found to depend on the complex-ity of the scoring system.5
Strengths and limitations of this study
▪ We undertook a large study of error rates whenusing a well-established early warning system, awidely adopted but relatively little studied health-care tool.
▪ Alerts for patients becoming physiologicallyunstable were commonly missed when incom-plete observation sets were taken—suggestingthat this practice should be avoided.
▪ Alerts were also commonly missed whenpatients first became unstable, suggesting animportant opportunity is being missed.
▪ ‘Incorrect’ alerts or ‘missed’ alerts were highlypredictive of the next observation set, suggestingthat work is needed to understand what add-itional information clinical staff use to ‘outper-form’ the early warning system.
▪ The generalisability of our results may be limitedby the single centre design restricted to surgicalpatients.
Clifton DA, et al. BMJ Open 2015;5:e007376. doi:10.1136/bmjopen-2014-007376 1
Open Access Research
on 15 June 2018 by guest. Protected by copyright.
http://bmjopen.bm
j.com/
BM
J Open: first published as 10.1136/bm
jopen-2014-007376 on 3 July 2015. Dow
nloaded from
Despite these findings, there has been little investigationof the factors underlying errors when using an establishedEWS system in normal clinical ward practice. However,understanding these is critical for improving performance.The aims of this study were (1) to understand factors asso-ciated with errors when using an established paper-basedEWS system, and (2) to investigate the types of error,where these are most likely to occur, and whether ‘errors’can predict subsequent changes in patient vital signs.Therefore, using a large database of observations, we docu-mented (A) errors in the assignment of weights to vitalsign values, (B) errors in weight aggregation (summingthe individual weights for each vital sign), (C) the effect oftime of day on the occurrence of errors, and (D) howerrors affected the clinical response that should haveoccurred. We examined the scoring pattern for observa-tion sets before an error occurred, and whether an ‘error’associated with an observation set predicted the true EWSfor subsequent observations.
METHODSWe performed a secondary analysis of a large databaseof observations generated during the ComputerALerting Monitoring System 2 (CALMS-2) study (Midand South Buckinghamshire Research EthicsCommittee, REC No. 08/H0607/79). The CALMS-2study was a before and after study to determine whethercontinuous monitoring of ‘vital signs’ with computer-modelled alerting to detect patient deteriorationsreduced patients’ hospital length of stay. Paper-basedEWS observation sets were collected from postsurgicalpatients, based in a specialist surgical ward within theOxford University Hospitals NHS Trust. Patients meetingthe inclusion criteria (see online supplementary appen-dix A) were recruited consecutively.
Ward staffThe ward had between 20 and 28 beds in use through-out the study. A qualified nurse was responsible for thecare of six or seven patients during night shifts, and fouror five patients at all other times. Three clinical supportworkers were available during the early part of each day,while one clinical support worker was available at night.The normal ward staff undertook the majority of extra-shifts where these were required. Ward staff were trainedin the use of the EWS system when it was introduced orwhen they first started work on the ward using a struc-tured training package developed by the hospital’sRecognition of Acutely Ill and Deteriorating Patientscommittee. Annual updates occurred as part of theresuscitation training.
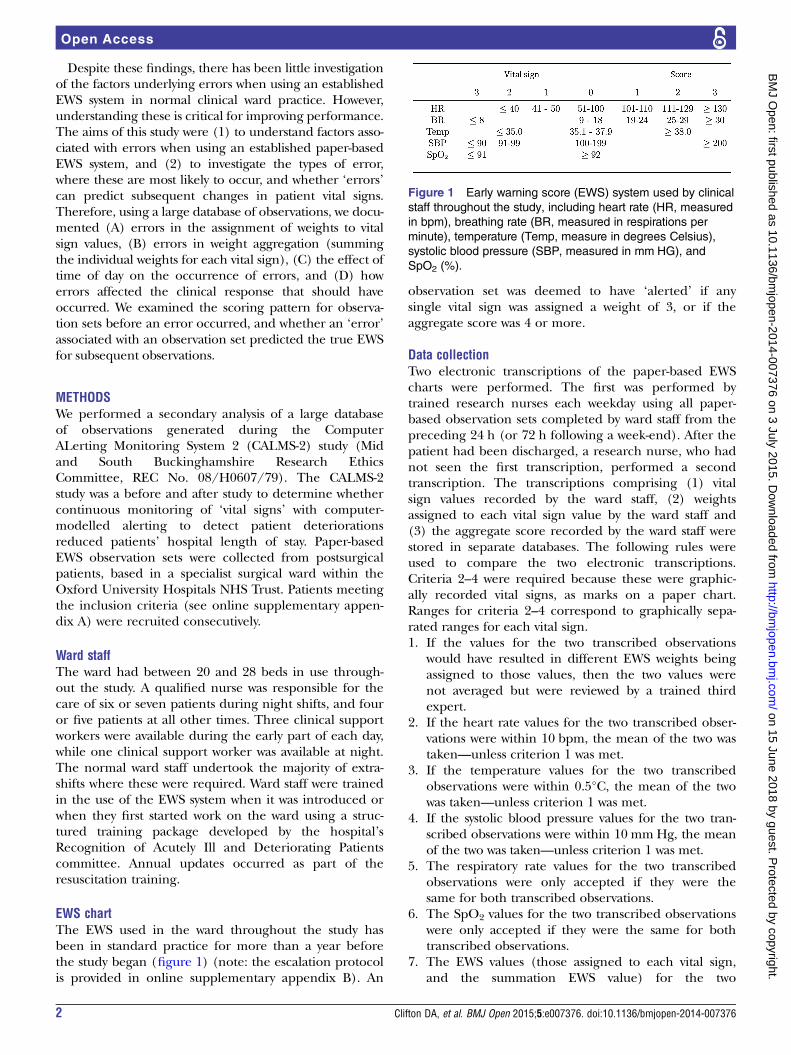
EWS chartThe EWS used in the ward throughout the study hasbeen in standard practice for more than a year beforethe study began (figure 1) (note: the escalation protocolis provided in online supplementary appendix B). An
observation set was deemed to have ‘alerted’ if anysingle vital sign was assigned a weight of 3, or if theaggregate score was 4 or more.
Data collectionTwo electronic transcriptions of the paper-based EWScharts were performed. The first was performed bytrained research nurses each weekday using all paper-based observation sets completed by ward staff from thepreceding 24 h (or 72 h following a week-end). After thepatient had been discharged, a research nurse, who hadnot seen the first transcription, performed a secondtranscription. The transcriptions comprising (1) vitalsign values recorded by the ward staff, (2) weightsassigned to each vital sign value by the ward staff and(3) the aggregate score recorded by the ward staff werestored in separate databases. The following rules wereused to compare the two electronic transcriptions.Criteria 2–4 were required because these were graphic-ally recorded vital signs, as marks on a paper chart.Ranges for criteria 2–4 correspond to graphically sepa-rated ranges for each vital sign.1. If the values for the two transcribed observations
would have resulted in different EWS weights beingassigned to those values, then the two values werenot averaged but were reviewed by a trained thirdexpert.
2. If the heart rate values for the two transcribed obser-vations were within 10 bpm, the mean of the two wastaken—unless criterion 1 was met.
3. If the temperature values for the two transcribedobservations were within 0.5°C, the mean of the twowas taken—unless criterion 1 was met.
4. If the systolic blood pressure values for the two tran-scribed observations were within 10 mmHg, the meanof the two was taken—unless criterion 1 was met.
5. The respiratory rate values for the two transcribedobservations were only accepted if they were thesame for both transcribed observations.
6. The SpO2 values for the two transcribed observationswere only accepted if they were the same for bothtranscribed observations.
7. The EWS values (those assigned to each vital sign,and the summation EWS value) for the two
Figure 1 Early warning score (EWS) system used by clinical
staff throughout the study, including heart rate (HR, measured
in bpm), breathing rate (BR, measured in respirations per
minute), temperature (Temp, measure in degrees Celsius),
systolic blood pressure (SBP, measured in mm HG), and
SpO2 (%).
2 Clifton DA, et al. BMJ Open 2015;5:e007376. doi:10.1136/bmjopen-2014-007376
Open Access
on 15 June 2018 by guest. Protected by copyright.
http://bmjopen.bm
j.com/
BM
J Open: first published as 10.1136/bm
jopen-2014-007376 on 3 July 2015. Dow
nloaded from

transcribed observations were only accepted if theywere the same for both transcribed observations.Under all other circumstances, differences were
resolved by a trained third expert, who made the finaldecision by reviewing the original paper-based record-ing. Transcription was done to the nearest digit, withoutrounding. Examples of reasons for differences betweentranscribed results are shown for interest (see onlinesupplementary appendix C).
Analysis and definitionsWe sought to determine1. The relationships between observation set complete-
ness, alerts and errors2. The effect of time of day on the occurrence of errors3. The effect of the aggregate score sequence on error
rates4. The types of errors in complete observation sets5. The relationship between ‘incorrect’ aggregate scores
and the score of the subsequent observation setWe documented errors in the assignment of weights to
vital sign values, errors in weight aggregation, the effectof time of day on the occurrence of errors, and howerrors affected the clinical response that should haveoccurred. We examined the scoring pattern for observa-tion sets before an error occurred and whether an‘error’ associated with an observation set predicted thetrue EWS for subsequent observations.Comparisons of proportions were performed using
the χ2 test with the appropriate number of degrees offreedom.A complete observation set was defined as one which
had (1) measurements for all five vital signs (figure 1),(2) weightings assigned to each vital sign or (3) anaggregate score. An observation set that should havegenerated an alert was defined as one for which (1) anyof the vital signs which, when correctly weighted, wouldhave resulted in a weight of 3, or (2) when the aggregatescore, correctly calculated from the weights for individ-ual recorded vital signs, would have equalled orexceeded a threshold of 4.
An observation set was defined as having an error inthe assignment of weights if one or more of the weightsassigned to the vital signs were incorrect. An observa-tion set was defined as containing an error in theaggregate score if the aggregate score differed from theaggregate score that would have been obtained if (1)all weights assigned to the vital signs were correct, and(2) the summation of those vital sign weights wascorrect.A sequence was defined as three or more consecutive
complete observation sets with the same aggregatescores.
RESULTSPatients200 upper-gastrointestinal surgical patients were includedin the study, with a median age of 64 years (IQR15 years), median length of stay of 10 days (IQR 7 days),and mortality of 3%. Full patient demographic data areprovided in online supplementary appendix D.
Completeness of observation sets and the effect onalerting ratesA total of 85.2% (14 313/16 795) of the observation setscontained measurements of all five vital signs. A total of77.9% (13 079/16 795) of the observations sets con-tained measurements of all five vital signs andfully-recorded weightings. In total 65.5% (10 995/16 795) of all observation sets were complete and had acorrectly calculated aggregate score. Temperature wasthe most commonly missing vital sign, being absent in11.4% (1915/16 795) of observation sets. All others wererecorded in more than 97% of observation sets.Table 1 shows the breakdown of recorded scores based
on whether they would lead to an alert or not, com-pared to the expected action (alert or no alert) for cor-rectly calculated scores based on the same vital signsdata. These are shown for 13 079 complete and 3716incomplete observation sets as described above, and forthe total of 16 795 sets.
Table 1 Observation sets according to alerting status
Observation set
Expected action by staff Observed action by staff Complete* Incomplete Total
Correctly calculated score would
lead to an alert
Staff record a score that would
lead to an alert
696 (5.3%) 343 (9.2%) 1039 (6.2%)
Correctly calculated score would
NOT lead to an alert
Staff record a score that would
NOT lead to an alert
11 969 (91.5%) 3038 (81.8%) 15 007 (89.4%)
Correctly calculated score would
NOT lead to an alert
Staff record a score that would
lead to an alert
116 (0.9%) 118 (3.2%) 234 (1.4%)
Correctly calculated score would
lead to an alert
Staff record a score that would
NOT lead to an alert
298 (2.3%) 217 (5.8%) 515 (3.1%)
Total 13 079 (100%) 3716 (100%) 16 795 (100%)
*Complete for measurements of all five vital signs and fully recorded weightings.EWS, early warning score.
Clifton DA, et al. BMJ Open 2015;5:e007376. doi:10.1136/bmjopen-2014-007376 3
Open Access
on 15 June 2018 by guest. Protected by copyright.
http://bmjopen.bm
j.com/
BM
J Open: first published as 10.1136/bm
jopen-2014-007376 on 3 July 2015. Dow
nloaded from

A total of 33.1% (515/1554) of the observation setsthat should have led to an alert did not have an alertingscore recorded.Only 18.4% (234/1273) of the observation sets
recorded as causing an alert did not have physiologicalobservations that should have led to an alert.Incomplete data sets were more likely than complete
data sets to contain observations that should have led toan alert (15.1% (560/3716) vs 7.6% (994/13 079),p<0.001), but less likely to have an appropriate alertingaggregate score recorded (61.3% (343/560) vs 70.0%(696/994), p<0.001).Observation sets that should not have led to an alert
but which had an alerting aggregate score recordedwere more common in incomplete than complete obser-vation sets (3.2% (118/3716) vs 0.9% (116/13 079),p<0.001).
Time of dayThe distribution of complete and incomplete observa-tion sets by hour of day is shown (figure 2).
Scoring patterns and incidence of errorTable 2 shows the 13 079 complete observation setsdivided according to whether these sets: (1) formed part
of a stable series; (2) occurred after the end of a stableseries; or (3) were neither part of a stable series, noroccurred after a series (other). When leaving a series inwhich the aggregate scores were 0, observation sets weremis-scored more commonly than within the series,55.3% (389/704) vs 3.0% (219/7332, p<0.001). Forseries in which the aggregate scores were >0, the subse-quent observation set was mis-scored at a similar rate(27.9%, 83/298) to the error rate within the series(27.8%, 308/1108), p=0.988.
Types of error in complete observation setsOnly 16.2% (2114/13 079) of the complete observationsets included one or more errors in the assignment ofweights to vital sign measurements. 15.9% (2084/13 079) of the complete sets had an error in the aggre-gate score. Overall, 16.9% (2212/13 079) of the com-plete observations sets had errors in the assignment ofweights, the aggregate score, or both.Table 3 shows the complete observation sets by error
type related to the correct alert status of the next obser-vation set.Only 14.7% (17/116) observation sets that contained
an error which resulted in an ‘incorrect’ alert were fol-lowed by an observation set that correctly resulted in analert. In comparison, 4.2% (431/10 328) of error-free,non-alerting observation sets were followed by an obser-vation set that correctly resulted in an alert (p<0.001).A total of 73.2% (218/298) of observation sets which
contained an error that resulted in ‘incorrectly’ notalerting were followed by observations that correctly didnot result in an alert. In comparison, 45.8% (247/539)of error-free alerting observation sets were followed byobservations that correctly did not result in an alert(p<0.001).
DISCUSSIONAlthough EWS systems have become a standard of care,6
understanding of many aspects of their performanceremains poor. As far as we can tell, our study (containingmore than 16 000 observation sets) of a well-establishedsystem in stable clinical practice, is the largest assessmentof errors within a paper-based track and trigger system
Figure 2 Distribution by hour of observation sets with
(dashed line) and without (solid line) errors in assignment of
scores to vital sign values, or errors in the aggregate score.
Table 2 Occurrence of observation sets with and without errors by observation sequence type
Without errors
n (%)
With errors
n (%)
Occurring as part of a stable series
Within sequence where EWS values=0 7113 (97.0) 219 (3.0)
Within sequence where EWS values≥1 800 (72.2) 308 (27.8)
Occurring after the end of a stable series
First observation after a sequence where EWS values=0 315 (44.7) 389 (55.3)
First observation after a sequence where EWS values≥1 215 (72.1) 83 (27.9)
Other 2424 (66.6) 1213 (33.4)
Total 10 867 (83.1) 2212 (16.9)
EWS, early warning score.
4 Clifton DA, et al. BMJ Open 2015;5:e007376. doi:10.1136/bmjopen-2014-007376
Open Access
on 15 June 2018 by guest. Protected by copyright.
http://bmjopen.bm
j.com/
BM
J Open: first published as 10.1136/bm
jopen-2014-007376 on 3 July 2015. Dow
nloaded from

undertaken to date. The scale of the study allowed us toinvestigate behaviour around ‘errors’ in novel ways.In our study, 65.5% of all observation sets contained
all five vital signs and had the correct aggregate EWS cal-culated, comparing favourably with a previous studywhere only 54.4% of all observation sets met these cri-teria (and only four vital signs were required).1
However, our results are far from reassuring. Almost athird of observation sets where an alerting aggregatescore should have been generated did not have a scorerecorded. One in six observations sets in which an alert-ing aggregate score was recorded did not contain vitalsigns that should have generated an alert. In both cases,errors were much more likely when the observation setwas incomplete. As incomplete observation sets werealso particularly likely to contain vital signs that shouldhave led to an alerting aggregate score, errors in incom-plete observation sets are particularly likely to affectpatient care. Decreasing the number of incompleteobservation sets would seem a relatively easy target forimprovement.Interestingly, though staffing levels were somewhat
lower at night, error rates were not increased, in contrastto previous findings.7 This may be because the wardstudied is staffed to reflect a relatively high nursingworkload. The usual practice of staff undertaking two‘observations rounds’ per day is shown by the two peaksin figure 2, similar to those previously reported.8
Errors of weighting and errors of summation featuredequally, with the large majority of observation sets witherrors showing both weight assignment and calculationmistakes. At around 17% of all observation sets, the com-bined error rate is lower than reported by Edwards et al,2
where assignment errors predominated and the overallerror rate was 36%.Errors were particularly likely when a patient was first
starting to become unstable (leaving a sequence of zeroscores), where more than 50% of the first >0 aggregatescores were mis-scored. An opportunity to recogniseearly deterioration is being missed. The fact is that a pre-ceding stable aggregate score sequence affects the abilityto identify the first signs of instability and this could behandled electronically by only allowing the clinician tosee the previous observation sets once all the vital signs
had been entered. However, this approach may not benecessary if assignment and summation of weights wereautomated.Perhaps the most important discovery in this paper is
that the ‘errors’ are not all that they first appear to be.For both observation sets that incorrectly resulted in analert and observation sets that incorrectly did not resultin an alert, the subsequent observation set was dispro-portionately more likely to have the same alert status asthe preceding ‘incorrect’ set than if the ‘error’ were notpresent. It appears that clinicians either use additionalinformation with that available from the vital signs ofthe patients9 or sense information within the measuredvital signs that the EWS system does not encapsulate intheir overall assessment of a patient’s risk status. It isclear that they detected both deterioration and improve-ment in advance of the EWS system. If these ‘correctlypredictive’ aggregate scores are taken as the optimumassessment of patient status, the effects on ‘error’ ratesare dramatic, reducing the proportion of completeobservation sets that should have had an alerting aggre-gate score but did not from 30.0% (298/994, table 1) to8.0% (78/994, table 3). Why is this information so crit-ical? In our efforts to exclude all ‘error’, as defined bythe mathematically correct aggregate score for a particu-lar observation set, we must not risk losing the informa-tion that allows clinicians to outperform the EWSsystem. There is a danger that the ‘power of the score’will subjugate both clinicians’ concern and the willing-ness of the response team to respond to a patient who isphysiologically ‘normal’ as defined by the EWS criteria.Recording a mathematically incorrect aggregate score isclearly not the optimal approach. Although a ‘clinicianconcern’ option was present in our EWS system, thisconcern was not assigned a weight and hence, did notcontribute to the aggregate score. Assigning ‘clinicianconcern’ a weight to form part of the overall aggregatescore is an approach that may have merit.Our work has limitations. First, it was restricted to a
single surgical ward, with EWS training specific to theparticular institution. Different error behaviours mayoccur in different environments, with different trainingsystems. Staff were aware that they were taking part in astudy, which may have affected overall error rates. As
Table 3 Observation type by next observation set
Observation type
Next set
n (%)
Alerting Non-alerting No next set
Error with incorrect alert 17 (14.7) 99 (85.3) 0 (0)
Error-free no alert 431 (4.2) 9754 (94.4) 143 (1.4)
Error with incorrect no alert 78 (26.2) 218 (73.2) 2 (0.7)
Error-free alert 292 (54.2) 247 (45.8) 0 (0)
Error but correct alert 92 (58.6) 65 (41.4) 0 (0)
Error but correct no alert 118 (7.2) 1510 (92.0) 13 (0.8)
Total 1028 (7.9) 11 893 (90.9) 158 (1.2)
Clifton DA, et al. BMJ Open 2015;5:e007376. doi:10.1136/bmjopen-2014-007376 5
Open Access
on 15 June 2018 by guest. Protected by copyright.
http://bmjopen.bm
j.com/
BM
J Open: first published as 10.1136/bm
jopen-2014-007376 on 3 July 2015. Dow
nloaded from

recent work suggests that errors in chart analysis maydepend on chart design,10 some of our findings may berestricted to the particular chart used during the study. Itis possible that our researchers’ interpretation of the vitalsign values recorded graphically on the chart could leadto incorrect error rates, a risk inherent in all such ana-lyses of paper charts. However, the rules we adopted,combined with blind double data entry and thirdresearcher resolution should have minimised this risk. Webelieve that this is an appropriate approach when under-taking research regarding error rates with paper-basedEWS systems. Importantly, our major findings, relating topatterns surrounding ‘errors’ are unlikely to be affectedby misinterpretation of individual original recordings.What can be learnt from our study about the assess-
ment of local EWS performance? A large majority ofobservation sets score zero (reducing the opportunityfor error), and so clinically important error rates areobscured by reporting overall values. Error rates con-cerning vital signs that would lead to a change in patientcare are much greater than overall error rates.Assessments of EWS performance should, therefore,report the proportions of alerts missed and erroneouslygenerated, along with a measure of the error rate inrecognising when a patient first becomes unstable.These are the errors most likely to affect patient out-comes, but are not captured in current national auditrecommendations.11
What can be done beyond local performance review toimprove the recognition of deteriorating patients? Someinformation is already available. Simpler scores result inlower error rates.5 However, simpler scores would need tohave equivalent capacity to detect deterioration and avoidunnecessary alerting. Designing a chart by taking humanfactors into account can reduce interpretation errors,10 12
such as those demonstrated by our transcribers. It may bethat this approach can also improve error rates in weightassignment and aggregation. To these, our study findingsadd that incomplete observation sets should be avoided,as these are consistently associated with missing importantchanges in a patient’s condition.Most importantly, observation sets that ‘incorrectly’
alert or ‘incorrectly’ do not alert are predictive of thenext observation set. By detecting information not cur-rently used within early warning systems in their overallassignment of a patient’s risk status, clinicians detectboth deterioration and improvement in advance of theearly warning system. Work is urgently needed to under-stand if and how this information can be captured, espe-cially as there is a trend towards automatedmeasurement of vital signs, electronic assignment of aweight to vital sign values, and automated aggregation ofweightings to generate an overall score.
CONCLUSIONErrors are much more common in observation setswhich should lead to a change in patient care than in
those that should not. Therefore, assessments of EWSperformance should report the proportions of alertsmissed and erroneously generated. Errors that lead to afailure to recognise when a patient first becomesunstable should also be reported.Incomplete observation sets should be avoided, as
these are more likely to contain vital signs that shouldlead to an alert and more likely to be associated witherrors that cause an alert not to be generated.Clinicians are able to outperform the EWS.
Understanding how they do this and how to incorporatethis ability into future EWSs are important areas forfuture research.Acknowledgements DAC was supported by a Royal Academy of EngineeringResearch Fellowship, and by the Centre of Excellence in PersonalisedHealthcare funded by the Wellcome Trust and EPSRC under grant number WT088877/Z/09/Z. MAFP was supported by the RCUK Digital EconomyProgramme under grant number EP/G036861/1 (Centre for Doctoral Trainingin Healthcare Innovation). The authors wish to thank the ward staff involved inthis project. The authors also wish to thank the research nurses for thecollection of clinical data used in this investigation and Marco Pimentel for hiswork on the database.
Contributors DAC undertook data analysis and the initial drafting of thepaper. Lei Clifton populated the databases and undertook initial data analysis.D-MS cleaned the databases and undertook the work underlying the errors inagreement between researchers’ analysis of the track and trigger charts. PJWran the study, wrote the paper from the original draft, and developed theoriginal ideas, as well as the analysis plan. GBS undertook an extensiveexternal review of the proposed paper in collaboration with PJW, which madesubstantial improvements to the paper, including the inclusion of types oferrors when interpreting the charts. SAV had the original idea for the paper,undertook data collection and data entry, and revised the paper. LT co-wrotethe paper and contributed to the analysis plan.
Funding The work described in this paper was funded by the NIHRBiomedical Research Centre Programme (Oxford).
Competing interests PJW and LT have developed an electronic early warningscore supported by the Engineering and Physical Sciences Research Counciland the Oxford Biomedical Research Centre which is in local use within theOxford University Hospitals NHS Trust. GBS is a co-designer of VitalPAC, anelectronic vital signs and early warning system manufactured by The LearningClinic (TLC). GBS’s wife is a minority shareholder in TLC. GBS acts as anunpaid research adviser to TLC and has received reimbursement of travelexpenses from them for attending symposia in the UK. GBS acted as expertadvisor to the National Institute for Health and Clinical Excellence during thedevelopment of the NICE clinical guideline 50: ‘Acutely ill patients in hospital:Recognition of and response to acute illness in adults in hospital’. He wasalso a member of the National Patient Safety Agency committee that wrote thetwo reports: ‘Recognising and responding appropriately to early signs ofdeterioration in hospitalised patients’ and ‘Safer care for the acutely ill patient:learning from serious incidents’. He was a member of the Royal College ofPhysicians of London’s National Early Warning Score Development andImplementation Group (NEWSDIG).
Ethics approval Mid and South Buckinghamshire REC.
Provenance and peer review Not commissioned; externally peer reviewed.
Data sharing statement We would be happy to make the data underlying thisstudy available to other investigators to undertake ethically approved research.The full data set underlying the study is available from the correspondingauthor PJW at: Kadoorie Centre, Level 3, John Radcliffe Hospital, Headington,Oxford, OX3 9DU. Participants gave informed consent for anonymised datasharing.
Open Access This is an Open Access article distributed in accordance withthe terms of the Creative Commons Attribution (CC BY 4.0) license, whichpermits others to distribute, remix, adapt and build upon this work, for
6 Clifton DA, et al. BMJ Open 2015;5:e007376. doi:10.1136/bmjopen-2014-007376
Open Access
on 15 June 2018 by guest. Protected by copyright.
http://bmjopen.bm
j.com/
BM
J Open: first published as 10.1136/bm
jopen-2014-007376 on 3 July 2015. Dow
nloaded from

commercial use, provided the original work is properly cited. See: http://creativecommons.org/licenses/by/4.0/
REFERENCES1. Smith A, Oakey R. Incidence and significance of errors in a patient
“track and trigger” system during an epidemic of legionnaires’disease: retrospective casenote analysis. Anaesthesia2006;61:222–8.
2. Edwards M, McKay H, Van Leuvan C, et al. Modified early warningscores: inaccurate summation or inaccurate assignment of score?Crit Care 2010;14(Supp 1):P257.
3. Prytherch D, Smith G, Schmidt P, et al. Calculating early warningscores—a classroom comparison of pen and paper and hand-heldcomputer methods. Resuscitation 2006;70:173–8.
4. Mohammad MA, Hayton R, Clements G, et al. Improving accuracyand efficiency of early warning scores in acute care. Br J Nurs2009;18:18–24.
5. Subbe C, Gao H, Harrison D. Reproducibility of physiological track-and-trigger warning systems for identifying at-risk patients on theward. Intensive Care Med 2007;33:619–24.
6. National Institute for Clinical Excellence. Guideline CG50—acutely illpatient in hospital: Recognition of and response to acute illness inadults in hospital. Technical Report; 2007.
7. Gordon C, Beckett D. Significant deficiencies in the overnight use ofa standardised early warning scoring system in a teaching hospital.Scott Med J 2011;56:15–18.
8. Hands C, Reid E, Meredith P, et al. Patterns in the recording of vitalsigns and early warning scores: compliance with a clinical escalationprotocol. BMJ Qual Saf 2013;22:719–26.
9. Cioffi J, Conway R, Everist L, et al. ‘Patients of concern’ to nurses inacute care settings: a descriptive study. Aust Crit Care 2009;22:178–86.
10. Christofidis MJ, Hill A, Horswill MS, et al. A human factors approachto observation chart design can trump health professionals’ priorchart experience. Resuscitation 2013;84:657–65.
11. NICE Clinical Guideline 50. Acutely ill patients in hospital. London:National Institute for Health and Clinical Excellence, 2007. http://www.nice.org.uk/guidance/cg50/resources/cg50-acutely-ill-patients-in-hospital-full-guideline3 (accessed Jun 2014).
12. Chatterjee MT, Moon JC, Murphy R, et al. The “OBS” chart: anevidence based approach to re-design of the patient observationchart in a district general hospital setting. Postgrad Med J2005;81:663–6.
Clifton DA, et al. BMJ Open 2015;5:e007376. doi:10.1136/bmjopen-2014-007376 7
Open Access
on 15 June 2018 by guest. Protected by copyright.
http://bmjopen.bm
j.com/
BM
J Open: first published as 10.1136/bm
jopen-2014-007376 on 3 July 2015. Dow
nloaded from