Embed Size (px)
Citation preview

Journal website: http://epaa.asu.edu/ojs/ Manuscript received: 2/15/2015 Facebook: /EPAAA Revisions received: 7/2/2015 Twitter: @epaa_aape Accepted: 7/3/2015
education policy analysis archives A peer-reviewed, independent, open access, multilingual journal
Arizona State University
Volume 23 Number 70 July 26th, 2015 ISSN 1068-2341
The Influence of Multiple Administrations of a State Achievement Test on Passing Rates for Student Groups
Joseph F. T. Nese Gerald Tindal
Joseph J. Stevens University of Oregon United States of America
& Stephen N. Elliott
Arizona State University United States of America
Citation: Nese, J. F. T., Tindal, G., Stevens, J. J., & Elliott, S. N. (2015). The influence of multiple administrations of a state achievement test on passing rates for student groups. Education Policy Analysis Archives, 23(70). http://dx.doi.org/10.14507/epaa.v23.1974 Abstract: The stakes of large-scale testing programs have grown considerably in the past decade with the enactment of the No Child Left Behind (NCLB) and Race To The Top (RTTT) legislations. A significant component of NCLB has been required reporting of annual yearly progress (AYP) of student subgroups disaggregated by sex, special education status, English language proficiency, and race/ethnicity. In this study we address the implications of a state policy that allows students to have multiple test opportunities to reach proficiency within an academic year, and its effect on passing rates. We found through logistic regression analyses that additional testing opportunities benefited specific majority student subgroups: White, non-free or reduced lunch program, non- limited English proficient, general education, and students close to the proficiency score. As states move to new achievement standards and assessments in 2015,
epaa aape

Education Policy Analysis Archives Vol. 23 No. 70 2 policymakers may want to assess the potential benefits and costs of a multiple testing policy. Keywords: Large scale testing; Accountability. La Influencia de Múltiples Oportunidades de Examinación en la Aprobación y el Rendimiento de Estudiantes en Pruebas Estatales Resumen: Las expectativas de los programas de pruebas a gran escala han crecido considerablemente en la última década con la promulgación de las legislaciones No Child Left Behind (NCLB) y Race to the Top (RTTT). Un componente importante de la ley NCLB ha requerido la presentación de informes de progreso anual (AYP) por subgrupos de estudiantes desglosados por sexo, educación especial, el dominio del idioma Inglés, y raza / etnia. En este estudio abordamos las implicaciones de una política de Estado que permite que los estudiantes tengan múltiples oportunidades de tomar el examen para aprobar dentro de un año académico, y su efecto sobre las tasas de aprobación. Encontramos a través de análisis de regresión logística que las oportunidades de tener oportunidades adicionales beneficiaron subgrupos específicos y mayoritarios de estudiantes: Blancos, que no recibían asistencia alimentaria, y que no estaban en grupos con bajos niveles de dominio del inglés, educación general y estudiantes cerca de obtener resultados de competencia. Como los estados están mudando a nuevos estándares de rendimiento y evaluaciones en 2015, las autoridades podrían querer evaluar los beneficios y los costos de una política de múltiples oportunidades de examinación. Palabras clave: pruebas a gran escala; rendición de cuentas. A Influência de ter Múltiplas Oportunidades para Exames na Aprovação e no Desempenho dos Alunos em Testes Estaduais Resumo: As expectativas programas de testes em grande escala têm crescido consideravelmente na última década, com a promulgação da legislação No Child Left Behind (NCLB) e Race to the Top (RTTT). Um componente importante da lei NCLB exigiu relatórios de progresso anual (AYP) dos subgrupos de alunos por sexo, educação especial, proficiência em Inglês, e raça / etnia. Neste estudo discutimos as implicações de uma política de estado que permite que os alunos tenham várias oportunidades para fazer o exame para passar em um ano lectivo, e seu efeito sobre as taxas de aprovação. Descobrimos através de análise de regressão logística que oportunidades adicionais beneficiaram e subgrupos específicos maioritarios dos estudantes: brancos, não recebem ajuda alimentar, de ensino geral e estudantes perto de conseguir resultados de competição. Como os estados estão se movendo para novos padrões e avaliações de desempenho em 2015, as autoridades podem querer avaliar os benefícios e os custos de uma política de múltiplas oportunidades de exame. Palavras-chave: testes em larga escala; prestação de contas.
Introduction1
In the past 15 years, development and implementation of large-scale achievement tests has not only increased but also come under increased scrutiny. With a focus on improving educational systems, such tests have been used to provide systems accountability through the reporting of proficiency for students overall and for disaggregated subgroups of students (No Child Left Behind [NCLB], 2001) and/or to establish requirements for graduation (Phillips, 2000; Schafer, 2000). In
1 Funding Source: This work was supported by the Institute of Education Sciences, U.S. Department of Education, through grant R32C110004 awarded to the University of Oregon. The opinions expressed are those of the authors and do not necessarily represent views of the Institute or the U.S. Department of
T h e I n f l u e n c e o f M u l t i p l e A d m i n i s t r a t i o n s o f a S t a t e A c h i e v e m e n t T e s t 3
either use, both intended and unintended consequences need to be addressed, particularly in the meaning or interpretation of scores (Lane & Stone, 2002).
In a paper on validating high-stakes testing programs, Kane (2002, p. 30) makes the distinction between descriptive interpretations, which draw conclusions about a student based on the student's test performance, and decision-based interpretations, which involve assumptions supporting the decision procedure’s suitability as a policy that are justified by claims about the consequences. Using Kane’s argument-based approach to validation, proposed score interpretations require evidence for evaluating inferences and assumptions. In the context of year-end state achievement test programs, descriptive interpretations are applied through achievement standards that define requirements to meet state performance objective (by grade and content area) based on cut scores, and high-stakes decisions are often applied to aggregates (e.g., teachers, but more often schools and districts) of these ordinal proficiency levels. In this context, the central interpretations that users make are in reference to state standards or Common Core State Standards. Assuming the testing program has been appropriately designed and deployed, percent proficient results are reported overall and for various subgroups; the question is then how well these aggregated percentages of students' achievement accurately represent schools and districts, the building block of the ultimate AYP decision in NCLB. As Ho (2013, p. 65) articulated, “this aggregation can occur at a substantial distance in space and time from the design and development of the original test”, which is “designed for individual-level inferences and uses,” but “is likely to be extended to support trends, gaps, gap trends, as well as school, district, and state aggregates.” In this distribution of students and subgroups into proficiency categories, it is possible that classifications are mis-specified, either with false negatives or false positives, and descriptive interpretations affect decision-based interpretations.
One strategy to determine the validity of assignment of students into various proficiency categories would be to use multiple measures, and/or multiple test administrations, theoretically increasing validity by increasing the amount of information associated with the construct measurement (Henderson-Montero, Julian, & Yen, 2003a, 2003b). One of the considerations with multiple measures is their integration into a decision, with any of four possible combinational strategies: conjunctive, where the attainment of a minimum standard on each of multiple measures; compensatory, where poorer performance on one measure can be offset by stronger performance on another; mixed conjunctive-compensatory, where multiple measures are combined by a compensatory rule and minimum performance on any of multiple measures can fulfill the proficiency requirement; and confirmatory, where information from one measure is used to validate or compare information from another (Chester, 2003). In the end “the manner by which the multiple measures are combined to reach a decision is as important as the measures themselves” (Henderson-Montero et al., 2003a, p. 8).
Multiple test administrations also provide a strategy in determining whether the percentages of subgroups in various proficiency categories are reliable and valid. On a single test administration, an examinee's score may be inaccurate for a number of reasons including measurement error; teacher/class coverage of curricular material at that point in time; inadequate opportunity to learn the tested material; unfamiliarity with test-taking procedures, equipment, or methods; or transient factors related to examinee state on the day of testing (e.g., attention, motivation, fatigue, illness). Multiple test administrations can potentially provide a mechanism to control for some of the sources of inaccuracy in which performance on any of the administrations can fulfill the achievement standard.
Two empirical summaries of major testing programs explicitly addressed the effects of multiple opportunities to take a test. In the GI Forum v. Texas Education Agency (Cruse & Twing, 2000), the critical issue was the use of test scores for determining high school graduation. Texas

Education Policy Analysis Archives Vol. 23 No. 70 4 applied a conjunctive approach to support graduation decisions, using both multiple measures and multiple administrations; that is, in addition to passing the graduation test, students were expected to successfully complete all required course work and other graduation obligations imposed by their districts (Cruse & Twing, 2000; Phillips, 2000). Students had eight opportunities to take and pass the test so that “any unreliability works to the benefit of the examinees who have true scores below the actual standard” who may eventually pass because of positive random error, and “the probability of not passing due to random error is almost zero” (Mehrens, 2000, p. 389). It was reported that multiple test administrations decreased the possibility of false negative results and increased the possibility of false positive results, which arguably advantaged all students whose scores were near the proficiency cut point within a compensatory model (Mehrens, 2000). That is, in this example of high-stakes assessment for accountability, the cost of increased false-positives was outweighed by the benefit of decreased false-negatives. In addition, the high-stakes nature of the test were tethered directly to students such that students were arguably motivated to do well, and the interpretive argument gave way to the decision-based interpretation (Kane, 2002).
Research has shown, however, that repeated exposure to a test alone can result in increased scores (Hausknecht, Halpert, Di Paolo, & Moriarty Gerrard, 2007), confounding the score with a validity argument. The meta-analysis by Kulik, Kulik, and Bangert (1984) focused on practice effects on test performance (i.e., simple exposure to a test), separate from growth (i.e., learning) or errors in equating (i.e., noise around the signal that reflects learning). The authors found larger effects when the practice and criterion tests were identical (ES = 0.42) than they were when practice and criterion measures were parallel forms (ES = 0.23), and that these effect sizes increased with more practice tests (up to 1.89 with seven identical tests, and 0.74 for seven parallel tests). Lower ability students benefited more from multiple test opportunities than did higher ability students, whether or not the test was identical or parallel. Thus, multiple tests resulted in increased performance across testing administrations although the source of the improvement due to learning/maturation, practice, or other effects was unspecified (Hausknecht et al, 2007; Kulik et al., 1984). That is, performance generally increases across repeated test administrations but that does not necessarily imply improved learning.
As Chester (2003) noted, we need to understand how multiple administrations influence students and systems, the consequences of decisions based on such a policy, and the contribution to more effective instruction prior to that decision. Generally, accountability systems based on student test scores have been shown to affect classroom and school practices. “High-stakes testing systems influence what teachers and administrators do,” including (presented here without value): targeting intervention for low-performing students, aligning curriculum to standards, affecting the scope of instruction, or shifting resources to tested subjects or standards (Hamilton, Stecher, & Yuan, 2008, p. 3). The latter is termed reallocation, or “shifting resources to better align instruction with the substantive content of the test used for accountability” (Koretz, 2015, p. 7; Koretz & Hamilton, 2006; Koretz, McCaffrey, & Hamilton, 2001). Although reallocation across content subjects does not bias inferences of achievement results, reallocation within a subject can inflate scores when teachers shift resources to material that is emphasized by the test at the expense of unrepresented material that is important for the intended inference (Kane, 2006; Koretz, 2015). Thus, reallocation of resources can affect validity inferences, and multiple test administrations can create space for reallocation.
Reback (2008) argued that an accountability system that aggregates student scores as pass rates incentivizes schools to improve the performance of students who are on the margin of passing (i.e., on the “bubble), and does not incentivizes schools to improve the performance of other students. In his study examining whether minimum competency school accountability systems (e.g.,
T h e I n f l u e n c e o f M u l t i p l e A d m i n i s t r a t i o n s o f a S t a t e A c h i e v e m e n t T e s t 5
NCLB, 2001) influence the distribution of student achievement, Reback found that students performed better than expected when their test scores were important for the schools' accountability rating, and that low achieving students performed better than expected when their classmates' scores were important for the schools' rating (an effect not found for high achieving students). Reback reported that student score distributional effects were related to responses to yearly changes in schools' accountability incentives and efforts to improve the performance of specific students.
Multiple test administrations in an accountability setting provide the opportunity for resource reallocation (positive or negative effects) to low performing or marginal students and to the scope of instruction, with consequences (intended or not). The accountability interpretations (percentages of student subgroups in various proficiency categories) need to be supported by collecting evidence (outcomes from repeated opportunities for testing) for evaluating inferences and assumptions that the test reflects such standards and is sensitive to instruction that in turn is aligned to the standards with students given opportunity to learn them. Given this perspective of validation, we investigated a state policy allowing multiple test administrations to reach proficiency. Using state achievement test data, we were able to explore, given multiple test administrations, whether students (and targeted subgroups) met proficiency who otherwise would not have, and whether multiple test attempts or changes in proficiency were related to student characteristics.
Research Context
The Elementary and Secondary Education Act (ESEA) does not reference the issue of multiple tests for AYP, only specifying that student proficiency be measured not less than once and that outcomes need to be disaggregated by specific student groups (sex, special education, English language learner, and race/ethnicity). A few states have allowed multiple tests on NCLB summative tests (e.g., Delaware, Oregon), some allow multiple tests and broad testing windows for interim assessments (e.g., South Dakota), and perhaps as many as 26 states allow retests at some future date on end-of course exams at the middle and high school levels (Blank & Stillman, 2010; Domaleski, 2011). In Oregon, the policy allowing multiple tests on the state NCLB summative assessment was designed to alleviate resource demands when testing the majority of students in the spring (Oregon Department of Education, 2012c). According to state policy in 2011-12, all students in eligible grades were tested at least once per year, with each student in Grades 3–8 allowed up to two additional opportunities during the October to May testing window to retake the state online mathematics and reading tests (Oregon Department of Education, 2012b). According to a guide published in 2012:
...students who have received accelerated instruction and have had adequate opportunity to learn the assessed content standard may be tested in the fall or early winter to help the district alleviate resource demands (e.g., computer labs, internet bandwidth, instructional assistants, IT staff) when testing the majority of students later in the school year. (Oregon Department of Education, 2012c, p. 4)
Testing in late winter and spring, however, “helps to ensure each student has had sufficient instructional time and allows for the provision of adequate instructional supports and interventions as appropriate” (Oregon Department of Education, 2012b, p. 5), for the purposes of meeting accountability requirements and measuring year-to-year growth in a cohort of students. Students who did not pass the state test could be retested after being provided with “additional instruction only if the district expects a different outcome based on additional classroom-derived evidence and if retesting is consistent with district procedures” (Oregon Department of Education, 2012b, p. 5). Schools can choose which students will be retested and how instruction will be delivered.

Education Policy Analysis Archives Vol. 23 No. 70 6 Immediately upon test completion the overall scale score is available to the teacher, and within two days teachers can access subscores.
The purpose of this study was to explore whether and when students pass the state achievement test given multiple opportunities. We asked two primary questions in this study: (a) Are student characteristics associated with how many times a student takes the state test? And (b) For various student subgroups, what is the likelihood of passing the test given previous failure(s)? We asked these questions with an interest in the performance of students on the “bubble” of proficiency, who were potentially false-negatives (i.e., one standard error of measurement below the proficiency cut score).
Method
We analyzed several subgroups of students who participated in the statewide testing program. Our analysis focused on documenting incremental changes in passing rates for these student subgroups when they retested. We conducted the same analyses for all students in Grades 3–8, for both mathematics and reading tests; however, in the interest of brevity we describe the Grade 3 mathematics sample throughout this article as an explication of the methods and a demonstration of the results. More detailed statistical results are available upon request to the first author.
Sample
The original sample for this study included all students in Grades 3–8 who took the 2011–2012 Oregon Assessment of Knowledge and Skills (OAKS) mathematics or reading test. To prepare the sample data, we excluded students who took the state alternate assessment (Grade 3 math, n = 5,721). Because the state policy allowed only three annual testing opportunities per student, we also excluded students who were tested more than three times (Grade 3 math, n = 1), and those students reported to have taken multiple tests on the same day (Grade 3 math, n = 2). We excluded student scores that were not included in the adequate yearly progress (AYP) district performance calculations, so that all students in the analyses recorded a score that was used for district accountability purposes (Grade 3 math, n = 8,403).
Approximately half of the population in each grade received a second test, and almost a quarter received a third test (about 45% of those tested twice). For the Grade 3 sample, the composition of students becomes descriptively more female, Hispanic, participating in free or reduced lunch program (FRL), and limited English proficient (LEP) across mathematics test occasions, and descriptively more Hispanic, Minority, FRL, and LEP across reading occasions.
We created indicator variables for students who had failed the previous test administration. We labeled “bubble” students those who were within one standard error of measurement (SEM; 3 scaled points) below the proficiency cut score on the previous test (equivalent to the lower half of a 68% confidence interval). Those students who scored lower than one SEM below the proficiency cut score (BelowBubble) were coded as the reference group. Those above the proficiency cut score, of course, did not receive additional testing opportunities. Table 1 shows the percentages of Bubble and BelowBubble students in Grades 3-8 for mathematics to demonstrate the prevalence of multiple tests. For example, for math Test 2, 19% of the 21,947 Grade 3 students were within one SEM below the proficiency cut score for Test 1 (i.e., Bubble1 students), and for math Test 3, 25% were within one SEM below the proficiency cut score of Test 2 (i.e., Bubble2 students).

T h e I n f l u e n c e o f M u l t i p l e A d m i n i s t r a t i o n s o f a S t a t e A c h i e v e m e n t T e s t 7
Table 1 Percentages of Bubble Students with One, Two, or Three Mathematics Tests for Grades 3-8
Grade n Bubble1 BelowBubble1 Bubble2 BelowBubble2 3 Test 1 39,839 10.5 49.1 8.6a 29.8a
Test 2 21,947 18.7 81.3 14.5 53.2 Test 3 10,040 10.7 89.3 25.4 74.6
4 Test 1 39,528 9.9 43.8 7.7b 27.9b Test 2 19,597 19.5 80.5 14.1 55.1 Test 3 9,072 11.1 88.8 24.3 75.7 5 Test 1 40,568 10.9 47.7 9.1c 33.3c
Test 2 22,100 19.6 80.4 15.0 59.9 Test 3 11,175 12.7 87.3 24.1 75.9
6 Test 1 40,673 11.1 47.3 8.9d 32.6d Test 2 21,842 20.2 79.7 14.6 59.2 Test 3 9,584 13.0 87.0 24.1 75.9
7 Test 1 41,008 12.3 40.6 9.2e 28.0e Test 2 19,420 24.7 75.2 16.4 56.8 Test 3 8,275 18.1 81.9 27.1 72.9
8 Test 1 41,071 10.2 40.5 8.0f 26.6f Test 2 18,765 21.4 78.6 15.0 56.2 Test 3 8,090 13.4 86.6 25.3 74.7
Note. Bubble students were within one standard error of measurement (SEM; 3 scaled points) below the proficiency cut score on the previous attempt (1 or 2), and BelowBubble students scored lower than one SEM below the proficiency cut score on the previous attempt (1 or 2). a n = 26,805. b n = 25,671. c n = 28,643. d n = 29,763. e n = 27,558. f n = 26,842. All demographic information we report was taken directly from state test data files. Grade 3 student demographic characteristics included the following: sex (49% female); race-ethnicity, categorized as White (non-Hispanic; 64%), Hispanic (22%), and non-Hispanic Racial Minority (14% Asian, Black/African American, American Indian/Alaskan Native, Multi-racial, and Pacific Islander); free or reduced price lunch recipient (FRL; 56%); Limited English Proficiency (LEP; 16%); and special education recipient (SpEd; 12%; Author, 2014).
Measures
For all analyses the outcome measures were the student developmental scale scores on the standardized Oregon Assessment of Knowledge and Skills (OAKS; Oregon Department of Education, 2012a) mathematics or reading tests. The 2011-12 OAKS was a summative, computer-adaptive assessment based on the Oregon Content Standards. OAKS raw scores were converted to scale scores using one parameter item response theory (IRT) modeling. Rasch unit scale scores were based on the number of items answered correctly while taking item difficulty into account (students were not penalized for guessing). Information on the technical adequacy of the test is publicly available and the tests were administered under standard conditions (Oregon Department of Education, 2012a; 2012b).
The test specifications varied by grade and subject, and were intended to measure the core content standards in the state curriculum. For example, the Grade 3 math test consisted of approximately 40 multiple-choice items composed of the following: (a) 35% of items on Number and

Education Policy Analysis Archives Vol. 23 No. 70 8 Operations, the understanding of fractions and fraction equivalence; (b) 35% of items on Number and Operations, Algebra, and Data Analysis, the understandings of multiplication and division, and strategies for basic multiplication facts and related division facts; and (c) 30% of items on Geometry and Measurement, the understanding of properties of two-dimensional shapes, including perimeters. The Grade 3 reading and literature test consisted of approximately 50 items with the following score reporting categories: vocabulary (28%); read to perform a task (16%); demonstrate general understanding (28%); and develop an interpretation (28%).
Analyses
To determine whether student characteristics were associated with number of tests taken, we conducted a pair of logistic regression analyses in which the presence of an additional test (Test 2 or Test 3, conditioned on failing previous test opportunities) was regressed on student characteristics (i.e., sex, race-ethnicity, FRL, LEP, SpEd, and bubble status from prior test). To determine the likelihood of passing the test given previous failures for various student subgroups, we conducted a discrete-time survival analysis (Singer & Willett, 2003) that modeled the conditional probability of passing the test on a given occasion, conditioned upon failing all previous tests. All analyses were conducted using Mplus version 7.11 (Muthén & Muthén, 1998-2014) maximum likelihood estimation with standard errors computed using a sandwich estimator that is robust to non-normality and non-independence of observations.
Results
Table 3 shows the observed percentages of Grade 3 students and student subgroups that took and passed the mathematics test for AYP reporting purposes, and for Tests 1, 2, and 3. For AYP reporting purposes and across tests, descriptively, a greater proportion of White students passed the state math test than racial minority students, and a greater proportion of racial minority students passed than Hispanic students. A greater proportion of non-FRL, non-LEP, non-SpEd, and bubble students passed than their counterparts. For all student subgroups, the observed proportion passing the test decreased across test occasions, with the exception of Hispanic and LEP students whose proportions increased across occasions, and FRL and SpEd students whose proportions increased at the third test occasion.
Are Multiple Tests More Likely For Certain Students?
The results of the logistic regression analysis for the second test are presented in Table 2. The threshold (τ), analogous to the intercept, represents the reference group (male, White, non-FRL, non-LEP, non-SpEd, Below Bubble students). This value can be converted into a conditional probability (τ/1+ τ), so that the probability of receiving Test 2 upon not reaching proficiency on Test 1 for this group was above .90 for all grades on the mathematics test, and above .87 for all grades on the reading test. In general, these probabilities decreased slightly across grades, and were higher for mathematics than for reading. For Grade 3, only 5%-6% (math and reading, respectively) of non-proficient reference group students were not given an additional test opportunity, while for Grade 8, 10%-13% (math and reading, respectively) of non-proficient reference group students were not given an additional test opportunity. Thus, the students in the reference group were less likely to be given additional testing opportunities in reading than mathematics, and also less likely to be given additional opportunities as they aged.

T h e I n f l u e n c e o f M u l t i p l e A d m i n i s t r a t i o n s o f a S t a t e A c h i e v e m e n t T e s t 9
Table 2 Odds Ratios of Math and Reading Logistic Regression Analyses for the Second Test for Grades 3-8
Math 3 4 5 6 7 8
Threshold 17.73* 17.89* 19.83* 12.33* 9.55* 9.35* Female 1.08 1.00 1.00 1.17 0.99 1.15 Hispanic (vs. White) 0.94 1.05 0.99 0.95 0.99 0.95 Racial Minority (vs. White) 1.01 0.96 1.00 0.87 1.00 1.08 FRL 0.85 0.93 0.91 1.07 1.01 0.98 LEP 0.75* 0.69* 0.66* 0.60* 0.73* 0.86 SpEd 0.26* 0.25* 0.27* 0.41* 0.45* 0.48* Bubble 3.22* 3.48* 3.68* 3.30* 2.44* 2.40*
Reading Threshold 15.49* 15.55* 19.71* 10.67* 7.64* 6.63* Female 1.11 1.11 1.06 1.27* 1.11 1.09 Hispanic (vs. White) 1.16 1.17 1.24 1.06 1.20 1.13 Racial Minority (vs. White) 0.99 1.11 1.04 0.92 1.15 1.07 FRL 0.79 0.84 0.83 1.12 1.08 1.04 LEP 0.57* 0.64* 0.58* 0.56* 0.62* 0.64* SpEd 0.26* 0.25* 0.23* 0.34* 0.42* 0.57* Bubble 4.41* 3.39* 3.18* 2.53* 1.89* 2.27*
Note. The relation between the intercept (β0) and threshold (τ) is: β0 = -τ; odds ratios and probabilities have been adjusted to reflect this relation. Bubble students were within one standard error of measurement (SEM; 3 scale score points) below the proficiency cut score on the previous attempt (Test 1). * p < .001. The p value reflects the significance of the estimated parameters in logits (not the odds ratiosreported here.
The relation of student predictors with the probability of retesting are presented in Table 2 as log odds for the focal group versus the reference group. Note that conditional probabilities can be calculated in the same way as for the threshold parameter above; however, care must be given to specify the appropriate comparison groups. In general, across grades and subjects, LEP, SpEd, and Bubble statuses were statistically significant predictors of a second test. That is, all else constant, a second test was more likely for non-LEP students vs. LEP students; GenEd students vs. SpEd students; and Bubble students vs. Below Bubble students. Specifically for Grade 3 math, non-LEP students were 1.33 times more likely than LEP students, GenEd students 3.83 times more likely than SpEd students, and Bubble students 3.22 times more likely than Below Bubble students to take Test 2.2 The results described for the Grade 3 mathematics sample were consistent across grades and subjects in direction, magnitude, and with very few exceptions, p values (Table 2). The exceptions included: mathematics Grade 8 LEP status was not statistically significant, and reading Grade 6 sex which was statistically significant in comparison to the pattern of results for other grades.
The results of the logistic regression for Test 3 have been presented in Table 3. Across grades and subjects, parameters were similar in direction, magnitude, and with very few exceptions, statistical significance. In general, SpEd, and Bubble statuses were statistically significant predictors
2 For ease of interpretation, results are described in text such that the comparison group is that whose odds ratio was above 1.0. For odds ratios reported in tables as less than 1.0, we reversed the sign of the logit parameters (�; not presented for brevity) and transformed to odds ratios (i.e., e-�).

Education Policy Analysis Archives Vol. 23 No. 70 10
of a third test administration. Thus, all else constant, a third test administration was more likely for GenEd students vs. SpEd students, and Bubble students vs. Below Bubble students. Specifically for Grade 3 math, non-LEP students were 1.23 times more likely than LEP students, GenEd students 1.82 times more likely than SpEd students, and Bubble students 2.19 times more likely than Below Bubble students to receive Test 3. Similar to the Test 2 logistic regression results, the LEP and sex predictors provided exceptions to the pattern of results across grades. That is, math Grades 3 and 5 LEP status were statistically significant; reading Grades 5 and 6 LEP status were statistically significant; reading Grade 6 sex was statistically significant; and math Grade 6 FRL status was statistically significant in contrast to results found in other grades.
Table 3 Odds Ratios of Math and Reading Logistic Regression Analyses for the Third Test for Grades 3-8
Math 3 4 5 6 7 8
Threshold 2.03* 2.23* 2.31* 1.36* 1.29* 1.42* Female 0.95 1.00 0.97 1.06 1.05 1.01 Hispanic (vs. White) 0.91 0.88 0.91 0.90 0.92 0.92 Racial Minority (vs. White) 0.97 0.91 0.90 0.87 0.94 0.91 FRL 1.15 0.96 1.03 1.15* 1.06 1.13 LEP 0.82* 0.85 0.74* 0.85 0.87 0.88 SpEd 0.55* 0.59* 0.53* 0.66* 0.73* 0.70* Bubble 2.19* 2.07* 2.17* 1.91* 1.84* 1.85*
Reading Threshold 1.69* 2.00* 2.12* 1.35* 1.13 1.11 Female 0.96 0.98 0.99 1.17* 1.03 1.01 Hispanic (vs. White) 0.99 0.96 0.96 0.96 1.00 1.06 Racial Minority (vs. White) 1.16 1.05 0.98 0.93 0.96 1.05 FRL 1.10 0.97 1.07 1.13 1.09 1.17 LEP 0.94 0.83 0.70* 0.73* 0.90 0.85 SpEd 0.56* 0.58* 0.49* 0.68* 0.73* 0.72* Bubble 2.09* 2.02* 1.93* 1.45* 1.68* 1.86*
Note. The relation between the intercept (β0) and threshold (τ) is: �0 = -τ; odds ratios and probabilities have been adjusted to reflect this relation. Bubble students were within one standard error of measurement (SEM; 3 scale score points) below the proficiency cut score on the previous attempt (Test 2). * p < .001. The p value reflects the significance of the estimated parameters in logits (not the odds ratiosreported here.
Likelihood of Passing the Test on Successive Attempts by Student Subgroup
Two discrete-time survival analyses, one for mathematics and one for reading, were conducted to examine the probability of reaching proficiency at each test occasion and to determine whether student characteristics were related the time at which a student reached proficiency. Results of the analyses are displayed in Table 4.

T h e I n f l u e n c e o f M u l t i p l e A d m i n i s t r a t i o n s o f a S t a t e A c h i e v e m e n t T e s t 11
Table 4 Odds Ratios for Math and Reading Discrete-time Survival Analyses for Grades 3-8
Math 3 4 5 6 7 8
Threshold 1 0.73* 0.54* 0.69* 0.70* 0.57* 0.55* Threshold 2 1.27* 1.37* 2.05* 1.92* 1.92* 1.74* Threshold 3 1.42* 1.51* 2.34* 2.32* 2.19* 2.18* Female 0.84* 0.81* 0.87* 0.87* 0.92* 0.94 Hispanic (vs. White) 0.84* 0.90* 0.90* 0.82* 0.80* 0.80* Racial Minority (vs. White) 0.99 1.02 1.01 1.09 1.03 1.00 FRL 0.47* 0.46* 0.47* 0.46* 0.48* 0.49 LEP 0.51* 0.52* 0.35* 0.32* 0.31* 0.30* SpEd 0.44* 0.37* 0.32* 0.26* 0.24* 0.23* Bubble on 1 4.66* 5.61* 5.73* 5.29* 4.00* 4.73* Bubble on 2 4.01* 4.02* 4.48* 4.60* 3.35* 3.77*
Reading Threshold 1 0.39* 0.29* 0.37* 0.40* 0.23* 0.41* Threshold 2 1.32* 1.20* 1.58* 2.17* 1.49* 2.20* Threshold 3 1.60* 1.34* 1.95* 3.08* 2.49* 3.19* Female 1.13* 1.10* 1.11* 1.10* 1.19 1.26* Hispanic (vs. White) 0.82* 0.84* 0.83* 0.65* 0.61* 0.63* Racial Minority (vs. White) 0.93 0.89* 0.90* 0.87* 0.84* 0.84* FRL 0.47* 0.47* 0.46* 0.46* 0.47* 0.48* LEP 0.32* 0.30* 0.19* 0.11* 0.13* 0.11* SpEd 0.34* 0.27* 0.26* 0.21* 0.18* 0.19* Bubble on 1 4.45* 4.43* 4.25* 3.98* 3.26* 3.85* Bubble on 2 3.56* 3.43* 2.94* 3.44* 3.23* 3.36*
Note. Bubble students were within one standard error of measurement (SEM; 3 scale score points) below the proficiency cut score on the previous attempt (1 or 2). * p < .001. The p value reflects the significance of the estimated parameters in logits (not the odds ratiosreported here.
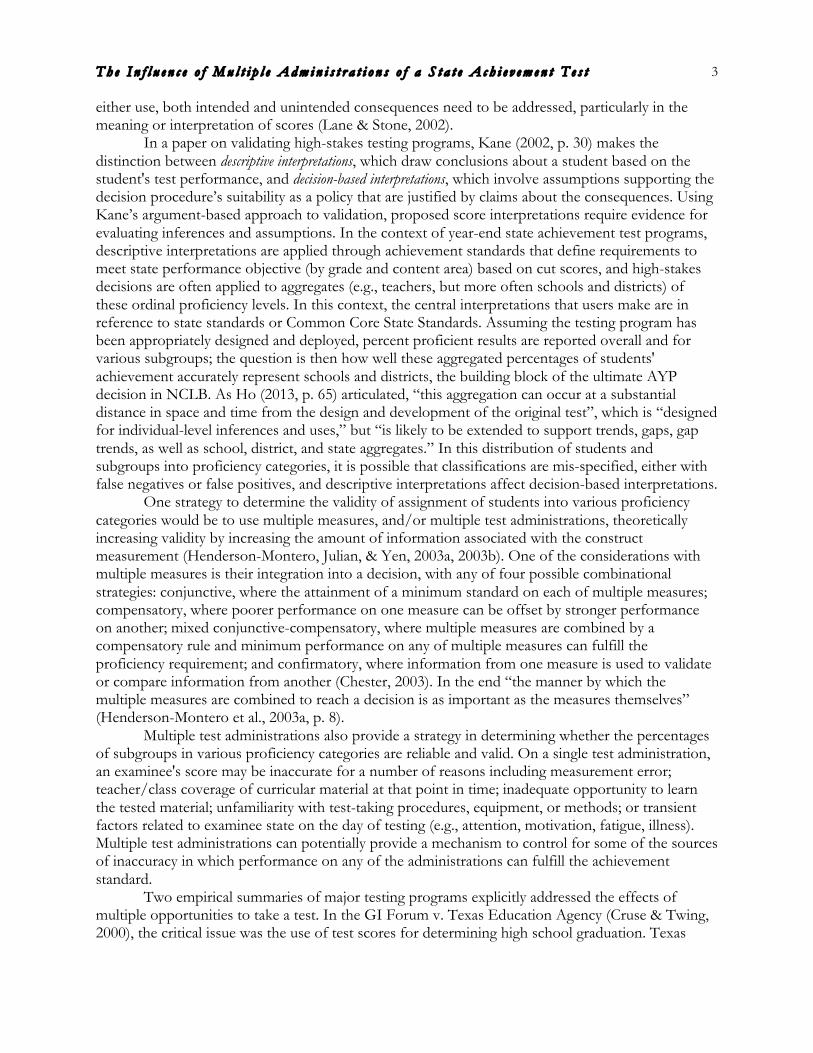
Mathematics. Across grades, the predictors of passing the state math test were similar in magnitude, direction, and level of statistical significance, with the exception of Racial Minority status across grades, and sex for Grade 8 only. Using Grade 3 as an example and all else constant and with failure to reach proficiency on previous tests, males were 1.19 times more likely to pass the state math test than females; White students were 1.20 times more likely to pass than Hispanic students; non-FRL students were 2.11 times more likely to pass than FRL students; non-LEP students were 1.94 times more likely to pass than LEP students; and GenEd students were 2.28 times more likely to pass than SpEd students. All else constant, Bubble students were more than four times more likely to pass Tests 2 and 3 than students below the bubble on those test administrations. Figure 1 shows the estimated probability of passing the math or reading test for select subgroups of Grade 3 students, in which the benefit of multiple opportunities for Bubble students is clear.
Education Policy Analysis Archives Vol. 23 No. 70 12
a) Mathematics b) Reading
Figure 1. The estimated probabilities of passing the Grade 3 math or reading test for specific student subgroups. Reference = White, male, non-FRL (free/reduced priced lunch recipient), non-LEP (limited English proficiency status), GenEd (general education), BelowBubble (lower than one standard error of measurement below the proficiency cut score on the previous test). FRL = White, male, FRL, non-LEP, GenEd, BelowBubble. LEP = White, male, non-FRL, LEP, GenEd, BelowBubble. SpEd = White, male, non-FRL, non-LEP, Special Education, BelowBubble. Bubble = White, male, non-FRL, non-LEP, GenEd, Bubble (one standard error of measurement below the proficiency cut score on the previous test).
Prob
abili
ty o
f pas
sing

T h e I n f l u e n c e o f M u l t i p l e A d m i n i s t r a t i o n s o f a S t a t e A c h i e v e m e n t T e s t 13
In the survival analysis, there was some variability in the magnitude of odds ratios for math predictors across grades. The odds ratio for LEP increased across grades, such that non-LEP students were substantially more likely to pass the math test at Grade 8 (3.29) than at Grade 3 (1.94). A similar trend was seen for GenEd students, who were 2.28 times more likely to pass the math test than SpEd students at Grade 3 and 4.28 times more likely at Grade 8. The odds ratios for the Bubble students at both opportunities slightly increased and peaked at Grade 5, then slightly decreased.
Reading. In the survival analyses on the reading test at each grade, the predictors of passing the state reading test were similar in direction and statistically significant, with the exception of Racial Minority status for Grade 3 only. We use Grade 3 for more specific description of results as an example. All else constant and given failure to reach proficiency on previous tests, females were 1.13 times more likely to pass the state reading test than males; White students were 1.23 times more likely to pass than Hispanic students; non-FRL students were 2.13 times more likely to pass than FRL students; non-LEP students were 3.09 times more likely to pass than LEP students; and GenEd students were 2.95 times more likely to pass than SpEd students. All else constant, Bubble students were 4.45 times more likely to pass Test 2 and 3.56 times more likely to pass Test 3 than students below the bubble on those test administrations.
There was also some variability in the magnitude of odds ratios for the reading predictors across grades. The odds ratio for LEP sharply increased across grades, such that non-LEP students were much more likely to pass the reading test at Grade 8 (9.29) than at Grade 3 (3.09). This was true to a lesser extent for GenEd students, who were about 3 times more likely to pass the reading test than SpEd students at Grade 3, and more than 5 times more likely at Grade 8.
The results of the survival analyses for math and reading differed somewhat. Most notably, males were significantly more likely to pass the state math test than females, whereas females were more likely to pass the state reading test. And while there were generally no differences between Racial Minority and White students in the likelihood of passing the math test, White students were more likely to pass the reading test than Racial Minority students (excepting Grade 3). There were also some discrepancies in the magnitude of the odds ratios across subject. While non-LEP students were more likely than LEP students to pass either state test, the likelihood was much greater for reading. The same trend can be seen for GenEd versus SpEd students, but to a lesser extent.
Discussion
The purpose of this study was to explore the implications of a state accountability system that allowed multiple tests. Specifically, we examined the likelihood of passing the test given previous failure(s) to reach proficiency, and whether student characteristics were associated with multiple testing or the likelihood of passing.
Generally, we found across Grades 3-8 that LEP, SpEd, and Bubble status students were statistically significant predictors of additional test administrations. That is, all else constant, non-LEP students were about one and a half times more likely than LEP students to receive a second test, if they failed the first. General education students were more than three times more likely than SpEd students to receive a second test, if they failed the first, and more than one and a half times as likely to receive a third test, if they failed the second. Bubble students were about three times more likely than Below Bubble students to receive a second test, if they failed the first, and about twice as likely to receive a third test, if they failed the second. Furthermore, we found that, all else constant and given previous non-proficient test results, male, White, non-FRL, non-LEP, GenEd, and Bubble students were more likely to pass the state achievement test than their respective

Education Policy Analysis Archives Vol. 23 No. 70 14
counterparts. However, White students were not more likely to pass the math test than Racial Minority students on succeeding tests. Taking the results of these two analyses, the non-LEP, GenEd, and Bubble students that were more likely to pass the state test given multiple opportunities (Figure 1) were also the students receiving additional opportunities to pass through a retest.
Practical Implications
In order for a testing event to be a meaningful opportunity, testing needs to be aligned to learning objectives, and offer direct feedback about student performance that could connect to future learning materials (Kurz et al., 2014). Thus, testing can be an important part of learning for teachers and students who are aware of their own performances and competencies, but it remains uncertain whether large-scale state achievement are meaningful learning events. Furthermore, the state acknowledges that some students may benefit from retesting after receiving further instruction. Although testing later in the year helps “...ensure each student has had sufficient instructional time and allows for the provision of adequate instructional supports and interventions as appropriate” (Oregon Department of Education, 2012c, p. 5), multiple testing opportunities delivered prior to spring allow for identification of potential problem areas and targeted instructional supports in those areas to bring the student to proficiency. Nevertheless, state policy encourages districts to administer multiple tests less frequently than is current practice in Oregon (Oregon Department of Education, 2012c, p. 6). These practices fit well within the conceptions noted earlier, that multiple administrations set the stage for adjusting opportunity to learn (Crocker, 2003), and for revealing instructional sensitivity (Polikoff, 2010).
Nevertheless, research is scant on how teachers and school teams use state test results to inform instruction. A recent study surveyed the types of summative assessments teachers administer, how the data are analyzed, and the instructional responses developed as a result (Hoover & Abrams, 2013). Although summative state assessments were not included in the survey, the results suggested that most teachers reported using data to make instructional changes by differentiating instruction for remediation, re-teaching concepts, and changing the pace of future instruction (Hoover & Abrams, 2013). In addition, 31% of surveyed teachers reported never analyzing students’ assessment data by AYP subgroups, which can show variation perhaps more useful to guide instruction for students such as those with disabilities. In many states, however, results are not available until the following summer or fall and thus cannot be applied to the students or curriculum during the school year tested. Furthermore, state tests may be too molar to provide teachers with useful information to inform instruction, as opposed to interim or formative assessments (Black & Wiliam, 1998).
Only those students who received accelerated instruction, had adequate opportunity to learn the assessed content standards, and demonstrated proficiency in the grade level content based on classroom-derived evidence were to be tested early (Oregon Department of Education, 2012c). One curious incidental finding was that early testing for those likely to pass does not appear to be the policy applied by districts and schools. Figure 2 overlays a scatterplot of mean test scores for each date of testing with a histogram of the frequency of tests for each date. The graph for Test 1 clearly shows the low average test scores (well below the proficiency cut score) for students tested early. Contrasted by the graph for AYP, in which very few early administrations were actually used for AYP reporting purposes (and many that were appeared to be, on average, close to or above the proficiency cut-score). Thus, we might speculate that teachers and administrators were using the multiple testing policy to provide diagnostic assessment of those students who would benefit from targeted instruction to reach proficiency and/or additional opportunity to learn. (Note that we presume teachers and/or administrators decide whether an additional testing opportunity is given, and not the student.) Because the multiple administration policy is designed to retest those students

T h e I n f l u e n c e o f M u l t i p l e A d m i n i s t r a t i o n s o f a S t a t e A c h i e v e m e n t T e s t 15
who may pass given an additional opportunity, it may be encouraging schools to implement educational triage, “the diversion of resources to students believed to be on the threshold of passing” (Booher-Jennings, 2005). Research on the influence of proficiency-based accountability systems has reported that educators do focus resources on students closest to proficiency (Jennings & Sohn, 2014), and also that educators, especially those in low-performing schools, engage in coaching (e.g., Koretz et al., 2001, 2006), emphasizing test preparation that focuses on specific attributes of the test (Jacobs, 2005; Jennings & Sohn, 2014). The Oregon policy was not intended to provide all students below proficiency with additional instruction and a retest opportunity. Although we found certain student subgroups were more likely to receive an additional administration, the intent of educators, application of the policy, and how it influenced instruction is beyond the scope of this study. A potential unintended consequence of this policy (in general and not specific to Oregon), is that resource allocation benefits students most likely to pass the test at the expense of traditionally lower achieving student groups such as those receiving LEP and special education services. One important finding of the present study was that controlling for student characteristics, Bubble students (those nearest the proficiency cut-score) were more likely than students with lower scores to receive an additional test and also to pass the state math test. Referring back to the study by Kulik et al. (1984), the ES of the equating error of parallel forms for three test occasions (ES = .35) results in a swing of approximately 3.6 units on the Oregon math test for Grade 3 students, which is equivalent to the SEM around the cut score. Thus, as our results demonstrate, those bubble students with scores one SEM below the cut score, who have a higher probability of being false-negatives, benefit from multiple opportunities, and three opportunities are just enough to account for measurement error. We found that Bubble students are more than four times more likely to pass the state test given multiple opportunities compared to those more than one SEM below the cut-score. Perhaps more importantly, however, is the idea that multiple testing opportunities may ameliorate other sources of inaccuracy. Similar to the Texas graduation program litigated in the GI Forum, the risk of false-negatives is a concern when proficiency decisions are made based on imperfect measurement. In that case, a single attempt is a less certain evaluation because measurement error can cause a student with true achievement at or slightly above the proficiency cut-score to fail a single administration of the test (Phillips, 2000).
Unreliability can be ameliorated if a policy is adopted allowing a confidence interval surrounding the cut score used to judge proficiency. Many states allow schools to use confidence intervals around aggregations of proficiency (Fulton, 2006; NCLB, 2001), and some are as large as large as 99% (±2.58 SEM). In that case, false negative due to unreliability of measurement are unlikely. However, other sources of inaccurate estimation (e.g., curricular coverage at the time of test, opportunity to learn, test-taking, or transient state factors of the examinee) are not necessarily controlled through the use of confidence intervals but can be ameliorated through multiple test administrations. Of course, the margin of error is afforded to the accountability unit (e.g., schools), and not to student scores, but it can be argued that individual student results also carry consequence and as such deserve to be recognized as estimates, which performance standards generally do not provide.

Education Policy Analysis Archives Vol. 23 No. 70 16
a) Test 1 b) Test 2
c) Test 3 d) AYP
Figure 2. These figures overlay a scatterplot of the mean test scores for each date of testing, with a histogram of the frequencies of tests for each date by Test Opportunities 1, 2, 3, and AYP. The left y-axis represents the mean math scores by date, the y-axis on the right represents the number of students tested by date, and the x-axis represents the dates of the 2011-12 school year. The horizontal line represents the proficiency cut-score (212). (Note that the mean score axis was formatted for readability and does not show outlier means.) The median (min, max) dates were as follows: 1: 3/8/12 (11/8/11, 5/17/12); 2: 4/26/12 (11/8/11, 5/17/12); 3: 5/11/12 (2/14/12, 5/17/12); AYP: 4/25/12 (11/8/11, 5/17/12).
Mea
n M
ath
Scor
e by
Dat
e
Frequency of Tests by D
ate

T h e I n f l u e n c e o f M u l t i p l e A d m i n i s t r a t i o n s o f a S t a t e A c h i e v e m e n t T e s t 17
The potential consequences of multiple test administrations, (e.g., educational triage, resource reallocation, opportunity to learn, increased reliability) are presented as issues that affect the inferences and assumptions of scores in an accountability framework. In addition, multiple testing opportunities can mitigate the effects of several sources of imprecision in test scores. Scores and/or proficiency categories may not accurately reflect students' true knowledge and abilities as a result of test unreliability. Given our findings, a single test policy may raise equity issues for particular subgroups of students, especially students with disabilities (SWD). A recent report provided information about the inclusion of students with disabilities in school accountability systems, the use of school practices that may relate to their educational outcomes, and their achievement in relation to school accountability status (Harr-Robins et al., 2012). Among other results, the researchers found that in 16 states over 4 years, 35% to 40% of schools missed AYP either partially or solely due to the performance of SWD. Because disadvantaged groups are disproportionately lower performers, perhaps every opportunity should be made to ensure that they have every chance to meet proficiency standards. This includes multiple test opportunities related to opportunity to learn (which arguably reflects interim assessment as opposed to summative assessment). Under Title IX, disproportionality in and of itself is evidence of discrimination (Title IX of the Education Amendments of 1972), so to help promote equity, every available opportunity should be provided for protected subgroups.
For example, Oregon’s multiple testing policy is changing in preparation for the implementation of SMARTER Balanced Assessment Consortium (SBAC). In Oregon, the SBAC assessment is planned for implementation in 2014-15 with students given only one test in the spring; as a result, the state changed testing practices to allow two testing opportunities for 2012-13 and one in 2013-14 to prepare for the single administration SBAC test (Oregon Department of Education, 2012c, p. 5). In the year analyzed for this study (2011-2012), all of the Grade 3 subgroups benefited from multiple testing opportunities; descriptively, the proficiency rates for the subgroups we analyzed increased by at least 50% from Test 1 to AYP reporting. But AYP subgroups specifically benefitted, as the proficiency rates for Test 1 compared to that reported for AYP increased by 83% for SpEd students, 99% for FRL students, 119% for Hispanic students, and 181% for LEP students. In 2012-13, when only two testing opportunities were allowed, proficiency rates also increased, but to a lesser degree. Specifically, proficiency rates increased 37% for SpEd students, 47% for FRL students, 56% for Hispanic students, and 79% for LEP students. Because this comparison is across cohorts, these differences may be in part due to cohort variation. For example, the 2011-12 Grade 3 cohort had a proficiency rate on Test 1 of 40%, while the 2012-13 Grade 3 cohort had a Test 1 proficiency rate of 48%. Both cohorts, however, had a similar Test 2 proficiency rate around 32%, and for final AYP reporting, the 2011-12 cohort actually had a slightly higher overall proficiency rate (65.9%) than did the 2012-13 cohort (63.1%). Thus, it can be argued that the third test had a meaningful influence on testing practice, as it raised the proficiency rate of the 2011-12 cohort beyond that of the comparison cohort despite the large initial discrepancy. Projecting to 2014-15 in which only one test will be administered, all else equal, we can speculate that proficiency rates are likely to fall further. Of course, attending to disproportionality was not the intent of the policy examined in this study, which did not make a provision to retest all students who did not meet achievement standards and in practice benefited higher-performing students.
Limitations
The implications of the results presented here should be tempered by the following meaningful limitations. In a multiple test administration setting in general, regression to the mean represents a threat to validity. In this study’s setting in particular, all retested students failed to meet

Education Policy Analysis Archives Vol. 23 No. 70 18
achievement standards and thus were exhibited lower scores and thus regression to the mean is more likely and may have been more influential. Of course, not all students who met achievement standards on subsequent administrations were false-negatives on the first, just as some marginal students who met achievement standards could be considered false positives. Given opportunity and meaningful learning, the score gain to reach proficiency was consequential and not regression to the mean. In a study on practice effects and coaching, Hauscknecth, et al. (2007) found that less than 10% of the total gain effect size could be attributed to regression to the mean; however, this only considered two studies. Here, we could not partition observed score gains between regression to the mean and learning; future research could explore the relation between test scores and instruction (e.g., academic standards covered at the time of and between testing) to understand how LEA’s and teachers use the data. This targets the junction of learning and accountability in large-scale state testing programs. Additionally, although the sample reported here represents the operational accountability population of one state, specific results are likely to differ across states with varying demographics, other assessments, and other accountability systems and administration procedures.
Conclusion
The consequences of large-scale testing programs (Lane & Stone, 2002) are influenced by a single testing administration with accountability implications for both students and LEAs (Thomas, 2005). Students, particularly those on the proficiency margin (within one SEM below the proficiency cut-score), benefit from multiple tests, and SpEd students whom we found to be less likely to pass the state test than GenEd students, are negatively affected by a single administration. Schools are most commonly identified as not meeting AYP due to the pass rates of SWD students (Eckes & Swando, 2009), and use of a single test administration policy increases the risk of false negatives (more palatable is the risk of false positives). Whitehurst and Lindquist (2014) articulated the negative implications of reducing testing across grades, particularly for “vulnerable groups,” and the conclusions may apply to within-year testing as well. As scaled test scores are being reduced to dichotomous proficiency categories, a multiple testing policy must be weighed in potential benefits and costs. A multiple test policy may increase the reliability of decision-making (Chester, 2003), and provide improved prospects for additional instruction, opportunity to learn, student development, and concomitant success for students and schools (Harr-Robins, et al., 2012). On the other hand, such a policy may also increase the likelihood of educational or instructional triage (e.g., Jennings & Sohn, 2014), reallocation and coaching (Koretz et al., 2001, 2006), resource demands, educator response to and public opinion of additional testing, and student testing fatigue. In light of our results, we believe there are important research questions to be addressed examining the effects of multiple tests on the accuracy of proficiency estimation as well as the effects of single versus multiple testing opportunities on accountability, and the effect of multiple tests on the assessment of student subgroups.
References
Black, P., & Wiliam, D. (1998). Inside the black box: Raising standards through classroom assessment. Phi Delta Kappan, 80, 139–148.
Blank, R. K., & Stillman, L. (2010). Statewide Student Assessment: 2009-10. Washington, DC: Council of Chief State School Officers.
Booher-Jennings, J. (2005). Below the bubble: “Educational triage” and the Texas accountability system. American educational research journal, 42, 231-268. doi: 10.3102/00028312042002231

T h e I n f l u e n c e o f M u l t i p l e A d m i n i s t r a t i o n s o f a S t a t e A c h i e v e m e n t T e s t 19
Chester, M. D. (2003). Multiple measures and high-stakes decisions: A framework for combining measures. Educational Measurement: Issues and Practice, 22, 32-41. doi: 10.1111/j.1745-3992.2003.tb00126.x
Crocker, L. (2003). Teaching for the test: Validity, fairness, and moral action. Educational Measurement: Issues and Practice, 22, 5-11. doi: 10.1111/j.1745-3992.2003.tb00132.x
Cruse, K., L., & Twing, J. S. (2000). The history of statewide achievement testing in Texas. Applied Measurement in Education, 13, 327-331. doi: 10.1207/S15324818AME1304_02
Domaleski, C. (2011). State end-of-course testing programs: A policy brief. Washington, DC: Council of Chief State School Officers.
Eckes, S. E., & Swando, J. (2009). Special education subgroups under NCLB: Issues to consider. Teachers College Record, 111, 2479-2504.
Fulton, M. (November, 2006). State note. Minimum subgroup size for adequate yearly progress: State trends and highlights. Denver, CO: Education Commission of the States. Retrieved from http://www.ecs.org/clearinghouse/71/71/7171.pdf.
Hamilton, L. S., Stecher, B. M., & Yuan, K. (2008). Standards-based reform in the United States: History, research, and future directions. Santa Monica, CA: RAND.
Harr-Robins, J., Song, M., Hurlburt, S., Pruce, C., Danielson, L., Garet, M., & Taylor, J. (2012). The inclusion of students with disabilities in school accountability systems (NCEE 2012-4056). Washington, DC: National Center for Education Evaluation and Regional Assistance, Institute of Education Sciences, U.S. Department of Education.
Hausknecht, J. P., Halpert, J. A., Di Paolo, N. T., & Moriarty Gerrard, M. O. (2007). Retesting in selection: a meta-analysis of coaching and practice effects for tests of cognitive ability. Journal of Applied Psychology, 92, 373-385. doi: 10.1037/0021-9010.92.2.37
Henderson-Montero, D., Julian, M. W., & Yen, W. M. (2003a). Multiple measures: Alternative design and analysis models. Educational Measurement: Issues and Practice, 22, 7-12. doi: 10.1111/j.1745-3992.2003.tb00122.x
Henderson-Montero, D., Julian, M. W., & Yen, W. M. (2003b). Multiple perspectives on multiple measures: An introduction. Educational Measurement: Issues and Practice, 22, 6. doi: 10.1111/j.1745-3992.2003.tb00121.x
Ho, A. (2013). The epidemiology of modern test score use: Anticipating aggregation, adjustment, and equating. Measurement: Interdisciplinary Research and Perspectives, 11, 64-67. DOl: 10.1080/15366367.2013.788344
Hoover, N. R. & Abrams, L. M. (2013). Teachers' instructional use of summative student assessment data. Applied Measurement in Education, 26, 219-231, DOI: 10.1080/08957347.2013.793187
Jennings, J., & Sohn, H. (2014). Measure for Measure How Proficiency-based Accountability Systems Affect Inequality in Academic Achievement. Sociology of Education, 87, 125-141. doi: 0.1177/0038040714525787
Kane, M. (2002). Validating high-‐stakes testing programs. Educational measurement: Issues and practice, 21, 31-41. doi: 10.1111/j.1745-3992.2002.tb00083.x
Kane, M. T. (2006). Validation. In R. L. Brennan (Ed.), Educational measurement (4th ed., pp. 17–64). Westport, CT: American Council on Education/Praeger.
Koretz, D. (2015). Adapting educational measurement to the demands of test-based accountability. Measurement: Interdisciplinary Research and Perspectives, 13, 1-25. doi: 10.1080/15366367.2015.1000712

Education Policy Analysis Archives Vol. 23 No. 70 20 Koretz, D., and Hamilton, L. S. (2006). Testing for accountability in K-12. In R. L. Brennan (Ed.),
Educational measurement (4th ed., 531-578). Westport, CT: American Council on Education/Praeger.
Koretz, D., McCaffrey, D., and Hamilton, L. (2001). Toward a Framework for Validating Gains Under High-Stakes Conditions. CSE Technical Report 551. Los Angeles: National Center for Research on Evaluation, Standards, and Student Testing.
Kulik, J. A., Kulik, C. L. C., & Bangert, R. L. (1984). Effects of practice on aptitude and achievement test scores. American Educational Research Journal, 21, 435-447. doi: 10.3102/00028312021002435
Kurz, A., Elliott, S. N., Lemons, C. J., Zigmond, N., Kloo, A., & Kettler, R. J. (2014). Assessing opportunity-to-learn for students with disabilities in general and special education classes. Assessment for Effective Intervention, 40, 24-39. doi: 10.1177/1534508414522685
Lane, S., & Stone, C. A. (2002). Strategies for examining the consequences of assessment and accountability programs. Educational Measurement: Issues and Practice, 21, 23-30. doi: 10.1111/j.1745-3992.2002.tb00082.x
Mehrens, W. A. (2000). Defending a state graduation test: GI forum v. Texas Education Agency. Measurement perspectives from an external evaluator. Applied Measurement in Education, 13, 387-401. doi: 10.1207/S15324818AME1304_05
Muthén, L. K., & Muthén, B. O. (1998-2014). Mplus User’s Guide (7th ed.). Los Angeles, CA: Muthén & Muthén.
No Child Left Behind. (2001). Committee on Education and Labor (First ed., pp. 1-95). Washington, DC: U. S. Government Printing Office.
Oregon Department of Education. (2012a). Technical report: Oregon's statewide assessment system test development, Volumes 1-10. Salem, OR.
Oregon Department of Education. (2012b). Test administration manual 2011-2012 school year. Salem, OR.
Oregon Department of Education. (2012c). A best practices guide for districts regarding when to administer the Oregon Assessment of Knowledge and Skills (OAKS). Salem, OR.
Phillips, S. E. (2000). GI Forum v. Texas Education Agency: Psychometric evidence. Applied Measurement in Education, 13, 343-385. doi: 10.1207/S15324818AME1304_04
Polikoff, M. S. (2010). Instructional sensitivity as a psychometric property of assessments. Educational Measurement: Issues and Practice, 29, 3-14. doi: 10.1111/j.1745-3992.2010.00189.x
Reback, R. (2008). Teaching to the rating: School accountability and the distribution of student achievement. Journal of Public Economics, 92, 1394-1415. doi: 10.1016/j.jpubeco.2007.05.003
Schafer, W. D. (2000). GI Forum v. Texas Education Agency: Observations for states. Applied Measurement in Education, 13, 411-418. doi: 10.1207/S15324818AME1304_07
Singer, J. D., & Willett, J. B. (2003). Applied longitudinal data analysis: Modeling change and event occurrence. New York, NY: Oxford University Press. doi: 10.1093/acprof:oso/9780195152968.001.0001
Thomas, R. M. (2005). High stakes testing: Coping with collateral damage. Mahwah, NJ: Lawrence Erlbaum Associates.
Title IX of the Education Amendments of 1972, 20 U.S.C.A. §§ 1681-1688. Whitehurst, G. J. & Lindquist, K. (2014, January 22). Test more, not less [Web log post]. Retrieved
from http://www.brookings.edu/blogs/brown-center-chalkboard/posts/2014/01/22-more-testing-whitehurst

T h e I n f l u e n c e o f M u l t i p l e A d m i n i s t r a t i o n s o f a S t a t e A c h i e v e m e n t T e s t 21
About the Authors
Joseph F. T. Nese University of Oregon [email protected] Joseph F. T. Nese, PhD, is a Research Associate at Behavioral Research and Teaching (BRT) at the University of Oregon. He conducts research in educational assessment and applied measurement, focusing on developing and improving systems that support data-based decision-making and using advanced statistical methods to measure and monitor student growth. 0000-0002-9878-7395 Gerald Tindal University of Oregon [email protected] Dr. Tindal is currently the Castle-McIntosh-Knight Professor in the College of Education – University of Oregon. He is the Department Head of Educational Methodology, Policy, and Leadership and directs Behavioral Research and Teaching (BRT). His research focuses on integrating students with disabilities in general education classrooms using curriculum-based measurement for screening students at risk, monitoring student progress, and evaluating instructional programs. Dr. Tindal also has conducts research on large scale testing and development of alternate assessments. This work includes investigations of teacher decision-making on test participation, test accommodations, and extended assessments of basic skills. He publishes and reviews articles in many special education journals and has written several book chapters and books on curriculum-based measurement and large-scale testing. He teaches courses on assessment systems, data driven decision-making, research design, and program evaluation. 0000-0001-7381-0301 Joseph J. Stevens University of Oregon [email protected] Joseph Stevens, PhD, joined the University of Oregon in 2005 and is currently a Professor in the department of Educational Methodology, Policy, and Leadership. He is a Co-Principal Investigator with the National Center on Assessment and Accountability (NCAASE) at the University of Oregon. His doctoral degree is in Psychology and Quantitative Methods from the University of Arizona. He was formerly Professor of Education at the University of New Mexico. He also worked at the Psychological Corporation and as a measurement statistician at Educational Testing Service. His interests are in measurement, validity, research design, and longitudinal modeling and individual differences in academic achievement especially for special education students and language learners. He teaches courses in advanced statistical methods and research design. 0000-0003-3717-164X Stephen N. Elliott Arizona State University [email protected]

Education Policy Analysis Archives Vol. 23 No. 70 22 Stephen N. Elliott, PhD, is the Mickelson Foundation Professor in the Sanford School of Social and Family Dynamics at Arizona State University. His research focuses on scale development and educational assessment practices with students with disabilities or at risk for educational difficulties. Assessment tools he has developed include the Social Skills Improvement System (SSiS), Academic Competence Evaluation Scales (ACES), Vanderbilt Assessment of Leadership in Education, and My Instructional Learning Opportunities Guidance System (MyiLOGS). He has published numerous articles, chapters, and books on (a) the assessment of children's social and academic competence, (b) the design and evaluation of methods that increase students’ access to learning and large-scale achievement test, and (c) the assessment of school leadership. Steve is a co-PI of the National Center on Assessment and Accountability for Special Education, a United States Department of Education funded research center. 0000-0003-1643-0489
education policy analysis archives Volume 23 Number 70 July 26th, 2015 ISSN 1068-2341
Readers are free to copy, display, and distribute this article, as long as the work is attributed to the author(s) and Education Policy Analysis Archives, it is distributed for non-commercial purposes only, and no alteration or transformation is made in the work. More details of this Creative Commons license are available at http://creativecommons.org/licenses/by-nc-sa/3.0/. All other uses must be approved by the author(s) or EPAA. EPAA is published by the Mary Lou Fulton Institute and Graduate School of Education at Arizona State University Articles are indexed in CIRC (Clasificación Integrada de Revistas Científicas, Spain), DIALNET (Spain), Directory of Open Access Journals, EBSCO Education Research Complete, ERIC, Education Full Text (H.W. Wilson), QUALIS A2 (Brazil), SCImago Journal Rank; SCOPUS, SOCOLAR (China).
Please contribute commentaries at http://epaa.info/wordpress/ and send errata notes to Gustavo E. Fischman [email protected] Join EPAA’s Facebook community at https://www.facebook.com/EPAAAAPE and Twitter feed @epaa_aape.

T h e I n f l u e n c e o f M u l t i p l e A d m i n i s t r a t i o n s o f a S t a t e A c h i e v e m e n t T e s t 23
education policy analysis archives editorial board
Editor Gustavo E. Fischman (Arizona State University) Associate Editors: Audrey Amrein-Beardsley (Arizona State University), Jeanne M. Powers (Arizona State University)
Jessica Allen University of Colorado, Boulder Jaekyung Lee SUNY Buffalo Gary Anderson New York University Christopher Lubienski University of Illinois,
Urbana-Champaign Michael W. Apple University of Wisconsin,
Madison Sarah Lubienski University of Illinois, Urbana-
Champaign Angela Arzubiaga Arizona State University Samuel R. Lucas University of California, Berkeley David C. Berliner Arizona State University Maria Martinez-Coslo University of Texas,
Arlington Robert Bickel Marshall University William Mathis University of Colorado, Boulder Henry Braun Boston College Tristan McCowan Institute of Education, London Eric Camburn University of Wisconsin, Madison Michele S. Moses University of Colorado, Boulder Wendy C. Chi Jefferson County Public Schools in Golden, Colorado
Julianne Moss Deakin University
Casey Cobb University of Connecticut Sharon Nichols University of Texas, San Antonio Arnold Danzig California State University, San
Jose Noga O'Connor University of Iowa
Antonia Darder Loyola Marymount University João Paraskveva University of Massachusetts, Dartmouth
Linda Darling-Hammond Stanford University Laurence Parker University of Utah Chad d'Entremont Rennie Center for Education
Research and Policy Susan L. Robertson Bristol University
John Diamond Harvard University John Rogers University of California, Los Angeles Tara Donahue McREL International A. G. Rud Washington State University Sherman Dorn Arizona State University Felicia C. Sanders Institute of Education Sciences Christopher Joseph Frey Bowling Green State
University Janelle Scott University of California, Berkeley
Melissa Lynn Freeman Adams State College Kimberly Scott Arizona State University Amy Garrett Dikkers University of North
Carolina Wilmington Dorothy Shipps Baruch College/CUNY
Gene V Glass Arizona State University Maria Teresa Tatto Michigan State University Ronald Glass University of California, Santa Cruz Larisa Warhol Arizona State University Harvey Goldstein University of Bristol Cally Waite Social Science Research Council Jacob P. K. Gross University of Louisville John Weathers University of Colorado, Colorado
Springs Eric M. Haas WestEd Kevin Welner University of Colorado, Boulder Kimberly Joy Howard University of Southern
California Ed Wiley University of Colorado, Boulder
Aimee Howley Ohio University Terrence G. Wiley Center for Applied Linguistics Craig Howley Ohio University John Willinsky Stanford University Steve Klees University of Maryland Kyo Yamashiro Los Angeles Education Research
Institute

Education Policy Analysis Archives Vol. 23 No. 70 24
archivos analíticos de políticas educativas consejo editorial
Editores: Gustavo E. Fischman (Arizona State University), Jason Beech (Universidad de San Andrés), Alejandro Canales (UNAM) y Jesús Romero Morante (Universidad de Cantabria)
Armando Alcántara Santuario IISUE, UNAM México
Fanni Muñoz Pontificia Universidad Católica de Perú,
Claudio Almonacid University of Santiago, Chile Imanol Ordorika Instituto de Investigaciones
Economicas – UNAM, México Pilar Arnaiz Sánchez Universidad de Murcia, España
Maria Cristina Parra Sandoval Universidad de Zulia, Venezuela
Xavier Besalú Costa Universitat de Girona, España
Miguel A. Pereyra Universidad de Granada, España
Jose Joaquin Brunner Universidad Diego Portales, Chile
Monica Pini Universidad Nacional de San Martín, Argentina
Damián Canales Sánchez Instituto Nacional para la Evaluación de la Educación, México
Paula Razquin Universidad de San Andrés, Argentina
María Caridad García Universidad Católica del Norte, Chile
Ignacio Rivas Flores Universidad de Málaga, España
Raimundo Cuesta Fernández IES Fray Luis de León, España
Daniel Schugurensky Arizona State University, Estados Unidos
Marco Antonio Delgado Fuentes Universidad Iberoamericana, México
Orlando Pulido Chaves Instituto para la Investigacion Educativa y el Desarrollo Pedagogico IDEP
Inés Dussel DIE-CINVESTAV, Mexico
José Gregorio Rodríguez Universidad Nacional de Colombia
Rafael Feito Alonso Universidad Complutense de Madrid. España
Miriam Rodríguez Vargas Universidad Autónoma de Tamaulipas, México
Pedro Flores Crespo Universidad Iberoamericana, México
Mario Rueda Beltrán IISUE, UNAM México
Verónica García Martínez Universidad Juárez Autónoma de Tabasco, México
José Luis San Fabián Maroto Universidad de Oviedo, España
Francisco F. García Pérez Universidad de Sevilla, España
Yengny Marisol Silva Laya Universidad Iberoamericana, México
Edna Luna Serrano Universidad Autónoma de Baja California, México
Aida Terrón Bañuelos Universidad de Oviedo, España
Alma Maldonado DIE-CINVESTAV México
Jurjo Torres Santomé Universidad de la Coruña, España
Alejandro Márquez Jiménez IISUE, UNAM México
Antoni Verger Planells University of Barcelona, España
Jaume Martínez Bonafé, Universitat de València, España
José Felipe Martínez Fernández University of California Los Angeles, Estados Unidos
Mario Yapu Universidad Para la Investigación Estratégica, Bolivia

T h e I n f l u e n c e o f M u l t i p l e A d m i n i s t r a t i o n s o f a S t a t e A c h i e v e m e n t T e s t 25
arquivos analíticos de políticas educativas
conselho editorial Editor: Gustavo E. Fischman (Arizona State University)
Editores Associados: Rosa Maria Bueno Fisher e Luis A. Gandin (Universidade Federal do Rio Grande do Sul)
Dalila Andrade de Oliveira Universidade Federal
de Minas Gerais, Brasil Jefferson Mainardes Universidade Estadual de
Ponta Grossa, Brasil Paulo Carrano Universidade Federal Fluminense,
Brasil Luciano Mendes de Faria Filho Universidade
Federal de Minas Gerais, Brasil Alicia Maria Catalano de Bonamino Pontificia
Universidade Católica-Rio, Brasil Lia Raquel Moreira Oliveira Universidade do
Minho, Portugal Fabiana de Amorim Marcello Universidade
Luterana do Brasil, Canoas, Brasil Belmira Oliveira Bueno Universidade de São
Paulo, Brasil Alexandre Fernandez Vaz Universidade Federal
de Santa Catarina, Brasil António Teodoro Universidade Lusófona, Portugal
Gaudêncio Frigotto Universidade do Estado do Rio de Janeiro, Brasil
Pia L. Wong California State University Sacramento, U.S.A
Alfredo M Gomes Universidade Federal de Pernambuco, Brasil
Sandra Regina Sales Universidade Federal Rural do Rio de Janeiro, Brasil
Petronilha Beatriz Gonçalves e Silva Universidade Federal de São Carlos, Brasil
Elba Siqueira Sá Barreto Fundação Carlos Chagas, Brasil
Nadja Herman Pontificia Universidade Católica –Rio Grande do Sul, Brasil
Manuela Terrasêca Universidade do Porto, Portugal
José Machado Pais Instituto de Ciências Sociais da Universidade de Lisboa, Portugal
Robert Verhine Universidade Federal da Bahia, Brasil
Wenceslao Machado de Oliveira Jr. Universidade Estadual de Campinas, Brasil
Antônio A. S. Zuin University of York


