Embed Size (px)
Citation preview

ONR Marine Mammal & Biology Program
Review
20-22 October 2014
Abstract Book
2
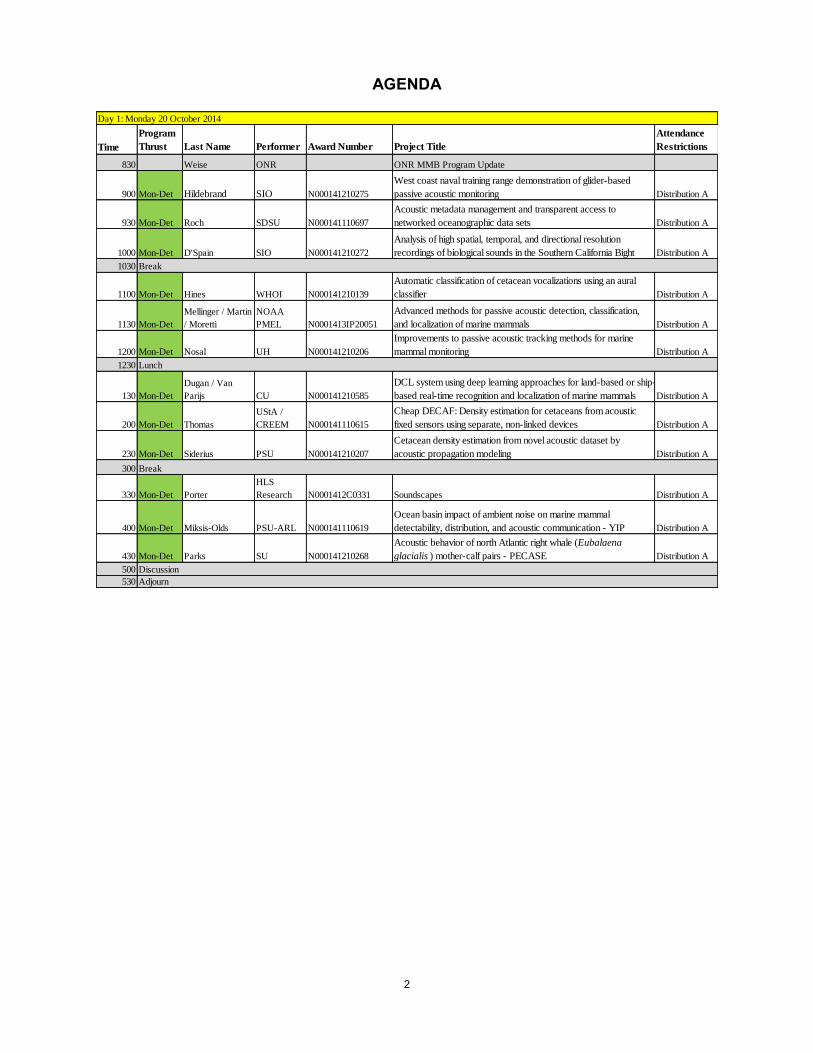
AGENDA
Day 1: Monday 20 October 2014
Time
Program
Thrust Last Name Performer Award Number Project Title
Attendance
Restrictions
830 Weise ONR ONR MMB Program Update
900 Mon-Det Hildebrand SIO N000141210275
West coast naval training range demonstration of glider-based
passive acoustic monitoring Distribution A
930 Mon-Det Roch SDSU N000141110697
Acoustic metadata management and transparent access to
networked oceanographic data sets Distribution A
1000 Mon-Det D'Spain SIO N000141210272
Analysis of high spatial, temporal, and directional resolution
recordings of biological sounds in the Southern California Bight Distribution A
1030 Break
1100 Mon-Det Hines WHOI N000141210139
Automatic classification of cetacean vocalizations using an aural
classifier Distribution A
1130 Mon-Det
Mellinger / Martin
/ Moretti
NOAA
PMEL N0001413IP20051
Advanced methods for passive acoustic detection, classification,
and localization of marine mammals Distribution A
1200 Mon-Det Nosal UH N000141210206
Improvements to passive acoustic tracking methods for marine
mammal monitoring Distribution A
1230 Lunch
130 Mon-Det
Dugan / Van
Parijs CU N000141210585
DCL system using deep learning approaches for land-based or ship-
based real-time recognition and localization of marine mammals Distribution A
200 Mon-Det Thomas
UStA /
CREEM N000141110615
Cheap DECAF: Density estimation for cetaceans from acoustic
fixed sensors using separate, non-linked devices Distribution A
230 Mon-Det Siderius PSU N000141210207
Cetacean density estimation from novel acoustic dataset by
acoustic propagation modeling Distribution A
300 Break
330 Mon-Det Porter
HLS
Research N0001412C0331 Soundscapes Distribution A
400 Mon-Det Miksis-Olds PSU-ARL N000141110619
Ocean basin impact of ambient noise on marine mammal
detectability, distribution, and acoustic communication - YIP Distribution A
430 Mon-Det Parks SU N000141210268
Acoustic behavior of north Atlantic right whale (Eubalaena
glacialis ) mother-calf pairs - PECASE Distribution A
500 Discussion
530 Adjourn

3
Day 2: Tuesday 21 October 2014
Time
Program
Thrust Last Name Performer Award Number Project Title
830 IER Aguilar de Soto ULL N000141210626 Population parameters of beaked whales Distribution A
900 IER Au UH N000141210205
Conduct research on the foraging behavior of beaked whales in
Hawaiian waters Distribution A
930 IER
Baumann-
Pickering SIO N000141210273
Modeling of habitat and foraging behavior of beaked whales in the
Southern California Bight Distribution A
1000 IER Mooney WHOI N000141110612
Acoustic behavior, baseline ecology and habitat use of pelagic
odontocete species of concern Distribution A
1030 Break
1100 IER Laidre UW N000141110201 Behavioral ecology of narwhals in a changing arctic Distribution A
1130 IER
Hildebrand /
Sirovic SIO N000141210904
Blue and fin whale habitat modeling from long-term year-round
passive acoustic data from the Southern California Bight Distribution A
1200 IER Baumgartner WHOI N000141210208 Environmental influences on diel calling behavior in baleen whales Distribution A
1230 Lunch
130 Kumar Navy/NAVFAC/EXWC Navy 6.4 Living Marine Resources (LMR) Program Overview
145 IER Fiechter UCSC N000141210893
Predicting trophic interactions and habitat utilization in the California
Current ecosystem Distribution A
215 IER Baker OSU N000141110614
Gene GIS: Computational tools for spatial analyses of DNA
profiles with associated photo-identification and telemetry records
of marine mammals Distribution A
245 IER Baumgartner WHOI N000141210919
Fine scale baleen whale behavior observed via tagging over daily
time scales / Cetacean community ecology in the waters of Sri
Lanka and the Bay of Bengal Distribution A
300 IER Lawson WHOI N000141210898
Zooplankton and micronekton distribution and interaction with
predators at the northwest Atlantic shelf break and its canyons Distribution A
315 Break
345
IER-
S&TD Boehme UStA N000141310654
Integration of a miniaturized conductivity sensor into an animal-
borne instrument Distribution A
415 Discussion
500 Adjourn
530-730 Poster Session

4
Day 3: Wednesday 22 October 2014
Time
Program
Thrust Last Name Performer Award Number Project Title Distribution A
830
IER-
S&TD Johnson UStA N000141210209
A multi-week behavioral sampling tag for sound effects studies:
design trade-offs and prototype evaluation Distribution A
900
IER-
S&TD Calhoun UV N000141110608
Development and testing of an ultra low power system-on-chip
(SOC) platform for marine mammal tags and passive acoustic
signal processing Distribution A
930
IER-
S&TD Wells
Chicago
Zoological
Society
N000141210391 /
1070269 Evaluation of tag attachments on small cetaceans Distribution A
1000
EoS-
Hearing Cranford QMC N000141210516 Building a virtual model of a baleen whale: Phase 2 Distribution A
1030 Break
1100
EoS-
Hearing Rogers / Gray GT N000141310640
Augmentation of the in vivo elastic properties measurement system
to include bulk properties Distribution A
1130
EoS-
Hearing Mooney WHOI N000141210203 Baseline hearing measurements in Alaskan belugas Distribution A
1145 Mod-Data Mountain BU N000141310641 ESME workbench enhancements Distribution A
1215 Lunch
115 Bell Navy/NAVFAC Navy Fleet/SYSCOM Compliance Monitoring Program Overview
130 EoS-Phys Moore WHOI N000141210388
Markers of decompression stress of mass stranded/live caught and
released vs. single stranded marine mammals Distribution A
200 EoS-Phys Fahlman Texas A&M N000141210269 Lung mechanics in marine mammals Distribution A
230 EoS-Phys Kanatous CSU N00014120895
Proof of concept to isolate and culture primary muscle cells from
northern elephant seals to study the mechanisms that maintain
aerobic metabolism under the hypoxic conditions of breath-hold
diving Distribution A
245 Break
315 EoS-Phys Ponganis SIO N000141210633
Deep-diving California sea lions: Are they pushing their
physiological limits? Distribution A
345 EoS-Phys Costidis UNCW N000141210656 Arteriovenous patterns in beaked whales Distribution A
415 EoS-Phys
Holt / Noren /
Williams
NOAA-
NWFSC N0001413IP20035 The metabolic cost of click production in bottlenose dolphins Distribution A
445 Discussion
515 Adjourn - End of Program Review

5
Table of Contents
Day 1: Monday 20 Oct 2014
Program
Thrust Last Name Project Title Page
Mon-Det Hildebrand
West coast naval training range demonstration of glider-based passive acoustic
monitoring 9
Mon-Det Roch
Acoustic metadata management and transparent access to networked
oceanographic data sets 11
Mon-Det D'Spain
Analysis of high spatial, temporal, and directional resolution recordings of
biological sounds in the Southern California Bight 13
Mon-Det Hines Automatic classification of cetacean vocalizations using an aural classifier 15
Mon-Det
Mellinger / Martin /
Moretti
Advanced methods for passive acoustic detection, classification, and
localization of marine mammals 17
Mon-Det Nosal
Improvements to passive acoustic tracking methods for marine mammal
monitoring 19
Mon-Det Dugan / Van Parijs
DCL system using deep learning approaches for land-based or ship-based real-
time recognition and localization of marine mammals 21
Mon-Det Thomas
Cheap DECAF: Density estimation for cetaceans from acoustic fixed sensors
using separate, non-linked devices 23
Mon-Det Siderius
Cetacean density estimation from novel acoustic dataset by acoustic
propagation modeling 25
Mon-Det Porter Soundscapes 27
Mon-Det Miksis-Olds
Ocean basin impact of ambient noise on marine mammal detectability,
distribution, and acoustic communication - YIP 29
Mon-Det Parks
Acoustic behavior of north Atlantic right whale (Eubalaena glacialis ) mother-
calf pairs - PECASE 31

6
Day 2: Tuesday 21 October 2014
Program
Thrust Last Name Project Title Page
IER Aguilar de Soto Population parameters of beaked whales 34
IER Au
Conduct research on the foraging behavior of beaked whales in Hawaiian
waters 36
IER Baumann-Pickering
Modeling of habitat and foraging behavior of beaked whales in the Southern
California Bight 38
IER Mooney
Acoustic behavior, baseline ecology and habitat use of pelagic odontocete
species of concern 40
IER Laidre Behavioral ecology of narwhals in a changing arctic 42
IER Hildebrand / Sirovic
Blue and fin whale habitat modeling from long-term year-round passive
acoustic data from the Southern California Bight 44
IER Baumgartner Environmental influences on diel calling behavior in baleen whales 46
IER Fiechter
Predicting trophic interactions and habitat utilization in the California Current
ecosystem 48
IER Baker
Gene GIS: Computational tools for spatial analyses of DNA profiles with
associated photo-identification and telemetry records of marine mammals 50
IER Baumgartner
Fine scale baleen whale behavior observed via tagging over daily time scales /
Cetacean community ecology in the waters of Sri Lanka and the Bay of Bengal 52
IER Lawson
Zooplankton and micronekton distribution and interaction with predators at the
northwest Atlantic shelf break and its canyons 54
IER-S&TD Boehme
Integration of a miniaturized conductivity sensor into an animal-borne
instrument 56

7
Day 3: Wednesday 22 October 2014
Program
Thrust Last Name Project Title Page
IER-S&TD Johnson
A multi-week behavioral sampling tag for sound effects studies: design trade-
offs and prototype evaluation 74
IER-S&TD Calhoun
Development and testing of an ultra low power system-on-chip (SOC)
platform for marine mammal tags and passive acoustic signal processing 76
IER-S&TD Wells Evaluation of tag attachments on small cetaceans 78
EoS-
Hearing Cranford Building a virtual model of a baleen whale: Phase 2 80
EoS-
Hearing Rogers / Gray
Augmentation of the in vivo elastic properties measurement system to include
bulk properties 82
EoS-
Hearing Mooney Baseline hearing measurements in Alaskan belugas 84
Mod-Data Mountain ESME workbench enhancements 86
EoS-Phys Moore
Markers of decompression stress of mass stranded/live caught and released vs.
single stranded marine mammals 88
EoS-Phys Fahlman Lung mechanics in marine mammals 90
EoS-Phys Kanatous
Proof of concept to isolate and culture primary muscle cells from northern
elephant seals to study the mechanisms that maintain aerobic metabolism under
the hypoxic conditions of breath-hold diving 92
EoS-Phys Ponganis Deep-diving California sea lions: Are they pushing their physiological limits? 94
EoS-Phys Costidis Arteriovenous patterns in beaked whales 96
EoS-Phys Holt / Noren / Williams The metabolic cost of click production in bottlenose dolphins 99

8
Day 1: Monday May 20, 2014
2014 ONR
Marine Mammal & Biology
Program Review

9
2014 Marine Mammal & Biology Program Review Sponsor: ONR Status: ENDED
Glider-based Passive Acoustic Monitoring Techniques
John A Hildebrand and Gerald L. D’Spain
Scripps Institution of Oceanography, University of California San Diego [email protected] 858 534-4069 [email protected] 858 534-5517
Background Passive acoustic monitoring of marine mammal presence is needed both for Naval environmental compliance, as well as for basic scientific studies of marine mammals. Autonomous gliders have the potential to provide persistent monitoring of marine mammal presence by providing a platform for passive acoustic monitoring. Gliders may prove to be a both a less costly and more effective solution for passive acoustic monitoring than shipboard towed array monitoring. Likewise, gliders may provide more spatial coverage (at the sacrifice of not providing continuous coverage over time) than possible from bottom mounted acoustic sensors. Objective Our objective is to test glider-based passive acoustic monitoring capabilities for marine mammal calls within a West Coast naval training range. We have been testing various autonomous platforms for marine mammal call passive acoustic monitoring, and comparing these platforms against fixed bottom-mounted acoustic instruments. Evaluation of autonomous glider-based passive acoustic monitoring of marine mammal presence is particularly needed within the southern California offshore range, a site of significant naval training. Methods Two mobile, autonomous platforms for passive acoustic monitoring were explored: the Wave Glider autonomous near-surface vehicle and the flying wing ZRay autonomous underwater glider. The passive acoustic monitoring performance of these two mobile autonomous platforms were compared with a fixed bottom-mounted autonomous broadband system, the High-frequency Acoustic Recording Package (HARP). During May, 2013, a southern California Navy range monitoring demonstration was conducted. Both gliders were operated near an array of three bottom-mounted HARPs deployed in the southern California Bight (Figure 1).
Figure 1. Wave Glider locations (blue circles) relative to three bottom-mounted HARPs (red triangles). Bathymetric contours (10 m) slope down to north-west, bold contour is 500 m depth. Results A group of whistling and clicking delphinids passed near the experimental site and were recorded by both the Wave Glider and HARPs. Figure 2 shows spectrograms from the bottom-mounted HARPs (P2 and P3) and the Wave Glider (WG) as it traveled near the P2 HARP (red dots in Figure 1). Identical instrumentation (HARP data logger and hydrophone) and processing parameters (FFT and color mapping for spectral level) allow direct comparison of the whistle amplitudes when recorded at the three locations. Whistles in the 5-20 kHz band were readily detected by the bottom HARPs as the delphinids approached the instruments, but the WG HARP revealed only a short period with high-level receptions (red arrow in Figure 2). Sound speed structure plays an important role in determining detection range by autonomous gliders and bottom-mounted sensors. Refraction due to acoustic propagation in the thermocline provides an explanation for why the WG HARP detected whistling delphinids primarily at close range in this setting.

10
Figure 2. Spectrograms of 0.25-hour duration (left plots) for P2 (top plot), P3 (middle plot) and WG (bottom plot) HARPs and 10- sec-duration spectrograms (right plots) detailing whistles recorded by all three instruments. The color scale and dynamic range is identical in all six plots.
Notes:

11
2014 Marine Mammal & Biology Program Review Sponsor: ONR Status: ONGOING
Acoustic Metadata Management and Transparent Access to Networked Oceanographic Data Sets
Marie A. Roch, Simone Baumann-Pickering, Catherine L. Berchok,
John A. Hildebrand, Erin M. Oleson, Sofie M. Van Parijs San Diego State University
[email protected] 619 594 5830 (SDSU) / 858 534 7280 (SIO)
Background Passive acoustic monitoring (PAM) of sound-producing animals (e.g. marine mammals) is producing multi-year data sets in many locations. Such long-term data sets allow the investigation of questions related to the effects of environmental processes and anthropogenic activities on these animals at varying temporal-spatial scales. A critical aspect of being able to learn from large, varied, acoustic data sets is the ability to provide consistent and transparent access to the acoustic metadata that is derived from them. This is juxtaposed with the need to include new information for specific research questions that evolve over time. This work proposes a method for organizing acoustic metadata that addresses many of the problems associated with the retention of metadata from long-term passive acoustic data sets. Objective The objectives of this effort are to produce:
1. A database capable of flexibly storing multiple types of acoustic metadata derived from a variety of acoustic platforms, both stationary and mobile.
2. Standardization of methods to make the data repositories useful to the passive acoustic monitoring community.
3. Access to network available data products in a standard manner (e.g. ephemeris, oceanographic measurements)
4. Secure access on network platforms using industry standard security protocols.
5. Query and visualization primitives in selected analysis and modeling languages (e.g. Python, Matlab, R) for efficient manipulation of spatiotemporal data.
6. Demonstration projects to show the value of the database as a scientific workbench component.
Methods We developed the Tethys Metadata Schema, a set of data structuring rules that organize acoustic metadata produced from PAM efforts. The data are structured using extensible markup language (XML), which permits standardization and the opportunity for researchers asking specific questions to store new types of data. A freely available web-services architecture called the Tethys Metadata Workbench has been developed to implement this schema and is being used to represent data from US Navy sponsored PAM efforts in both the Pacific and Atlantic. The architecture builds on a freely available XML datastore from Oracle Corp. (Redwood Shores, CA), and provides methods for creating, retrieving, and updating acoustic metadata as well as for mediators to connect to other data providers. Libraries have been developed to permit Java, Python, and Matlab clients to work with Tethys servers, and a rudimentary R interface has been developed which is being expanded. Results Advances made this year have improved data exchange, permitting the Tethys Workbench to provide improved standardization of data interchange and the potential to be expanded as a NOAA Environmental Research Division Data Access Program (NOAA ERDDAP) server with a small amount of additional work. The development of an interface library to add generation of Tethys-ready data to detector software reduced the complexity of importing output from automated detectors. This new capability was used to add millions of detections to a Tethys Workbench server and permitted us to identify and implement areas for performance improvements. The ability to export acoustic detections to OBIS-SEAMAP has been added, and summaries of work undertaken by individual

12
laboratories can now be shared with the broader community without the need to grant access to a Tethys Workbench server. We demonstrated this with the export of several million detection records to OBIS-SEAMAP, a subset of which is being released publicly (many of the records are related to unpublished automated detector work and will be made public once the work is published). A study on world-wide beaked whale descriptions using Tethys for spatiotemporal analysis was published this year (Baumann-Pickering et al., 2014), and manuscripts describing the Tethys schema, a classification study of site and equipment variability, and a spatial-temporal analysis of blue and fin whales across the Southern California Bight were completed (Roch et al., submitted; Roch et al., submitted, Širović et al., submitted). A comprehensive analysis of acoustic beaked whale detections in the Southern California Bight is currently underway (Figure 3, Baumann-Pickering et al., in progress). The ONR sponsored blue, fin, and beaked whale analyses used Tethys to manage millions of detections that were normalized for detection range based on propagation modeling conducted with the ESME Workbench (Mountain, 2012), demonstrating the synergy between ONR projects (Figs. 1, 2, and 3).
Figure 1 (Širović et al., submitted) – Locations of
HARP deployment sites in the Southern California Bight. Examples of detection areas for blue whale
calls obtained by propagation modeling along radials to a common detection threshold are shown for sites
B, E, and P as gray shaded areas within a broken line. Lighter grey line marks 500 m and darker line is
1,000 m bathymetry contour.
Figure 2 – (Širović et al., submitted) – Detection of normalized blue whale B call counts (averaged
monthly) at each site in the Southern California Bight. Sites are arranged, to the maximum extent possible, from the northernmost sites at the top towards the southernmost sites at the bottom. Size of the patch represents the call detection rate normalized by the area in which a call is likely to be detected. Dotted
lines are periods with no data at that site and straight lines denote periods with recording but no detected
calls.
Figure 3 - Comparison of beaked whale acoustic presence across the Southern California Bight
(monthly boxplots of daily detections with median line, lower panel) with the multivariate El Niño-Southern Oscillation (ENSO) index (upper panel) over a five
year period. Authors’ unpublished data

13
2014 Marine Mammal & Biology Program Review Sponsor: ONR Status: COMPLETED
ANALYSIS OF HIGH SPATIAL, TEMPORAL, AND DIRECTIONAL RESOLUTION
RECORDINGS OF BIOLOGICAL SOUNDS IN THE SOUTHERN CALIFORNIA BIGHT
Gerald L. D’Spain, Tyler A. Helble, Heidi H. Batchelor, Pauline Laikijrung, and Peter McCarty Marine Physical Laboratory, Scripps Institution of Oceanography, UCSD
[email protected], 858-534-5517
Background In 1999, a large experiment was conducted by the Navy community off the Southern California coast. This experiment involved the deployment of 16 horizontal hydrophone line arrays on the ocean bottom. The geometry of the array deployment is shown in Fig. 1. The outputs from these arrays were fiber-optic cabled to shore and recorded continuously for a period of a few months. The passive acoustic data from these arrays provide high spatial, temporal, and directional measurements of the properties of underwater sound sources, including calling marine mammals and other biological sources, in a Navy training area. Therefore, these data not only provide a unique basis for various scientific studies of these biological sound sources, but the results are of benefit to Navy environmental compliance efforts.
Figure 1. Geometry of 16 hydrophone line arrays deployed in the 1999 experiment. Objectives The overall objective of this project was to conduct a set of biologically-focused research projects using the data collected during this Navy exercise. These efforts involved both graduate students at Scripps Institution of Oceanography and undergraduate students from the environmental engineering department at UCSD.
Methods The unclassified part of the data set was acquired from the Applied Research Labs, University of Texas. A significant portion was transcribed into a format amenable to processing with the in-house data analysis software. (Transcription of the data set is still ongoing). Single-element spectrograms were created to identify time periods for further analyses. Both conventional and data-adaptive beamforming methods were applied to the data from the 3 subarrays - LF, MF, and HF – nested in each array. Results Numerous recordings of blue whale and fin whale calls are present in the data. An example spectrogram containing such baleen whale calls is shown in Fig. 2.
Figure 2. 2-min spectrogram over the 0-300 Hz band containing baleen whale calls. In addition, an unusual low-frequency fish chorus occurring only at night is present in the nearshore array data. This chorus cycles in amplitude with a periodicity of 30-35 sec. The beam spectrograms (bearing-time records) for the 6 nearshore arrays over one night are presented in Fig. 3. These plots illustrate that

14
the chorusing sound is highly spatially heterogeneous, with the highest levels recorded by the shallowest, nearest-to-shore, farthest-upcoast two arrays (nos. 13 and 14). They also illustrate that the sounds at each array are strongly anisotropic, arriving primarily from a location near the coast between arrays 13 and 14 (southeast from array 13, northwest from array 14). This position is about the same location as the offshore cooling water intake systems at the San Onofre Nuclear Generating Station (SONGS). Results from the entrapment studies at SONGS suggest that the species of fish contributing to the nearshore chorus are queenfish and white croaker, two physiologically similar members of the family of Sciaenids.
Figure 3. Directionality of the underwater sound field in the 300-500 Hz band over the 13-hour period encompassing the nighttime period on 10 May, 1999 (00:00 to 13:00 GMT along the
horizontal axes of the plots) for the 6 nearshore arrays marked by yellow markers in Fig. 1. The changes in directionality and level of the chorusing sounds over the nighttime period recorded by the nearest-to-shore array for 6 nights in April and May are shown in Fig. 4. Although the received levels show a clear increase with increasing time from the beginning of April to the end of May, the directionality of the chorusing sounds remains surprisingly constant from one night to the next. The fish apparently chorus only when they are located in specific offshore areas.
Figure 4. Directionality at array 14 (the closest to shore) of the underwater sound field in the 300-500 Hz band over the 13-hour period encompassing nighttime for 6 nights spanning early April to late May, 1999.
Notes:
15
2014 Marine Mammal & Biology Program Review Sponsor: ONR Status: ONGOING
Quantifying the Effects of Propagation on Classification of Cetacean
Vocalizations
Paul C Hines and Carolyn M Binder Dalhousie University [email protected]
Background The goal of this research is to develop a robust automatic classifier with a high probability of detection and a low false alarm rate that can classify vocalizations from a variety of cetacean species in diverse ocean environments. In previous work as part of ONR grant N000141210139, a unique automatic classifier developed by the PI that uses perceptual signal features –features similar to those employed by the human auditory system– was employed to successfully classify anthropogenic transients, and vocalizations from five cetacean species. Although this is a significant achievement, successful implementation of this (or any) classifier requires that it be temporally and spatially robust. Objectives It is well known that acoustic propagation can vary substantially between environments, which can result in distortion of acoustic signals. This in turn, can lead to environment-dependent time-frequency characteristics of a received vocalization. The resulting distortion of vocalizations may impact the accuracy of classifiers. Thus, to develop a classification system capable of operating in many environments, one must understand the role of propagation on the classifier. The primary goal in the current project is to address the question: “Will the aural classifier work on vocalization data from species collected under a variety of environmental conditions?” This will be done by performing a propagation experiment using cetacean vocalizations and synthetically generated calls as source signals, and testing the received signals with the classifier. The measurements will be complemented by comparing experimental results to propagation model results with the goal of generalizing the results to other ocean environments. It is worthy of mention that there is no study published in the literature that systematically analyzes the impact of propagation on automatically classifying vocalizations, using both underwater
propagation experiments and complementary modeling. Methods A two-day trial was conducted in the Gulf of Mexico on 30 April and 1 May 2013. Two moorings were deployed on each day of the experiment, each with at least two hydrophones at different depths within the water column. Up-sampled bowhead and humpback vocalizations, and synthetic signals representing the same species (155 of each signal type) were transmitted as the ship drifted. Transmissions were monitored in real-time using a hydrophone deployed from the well deck of the ship. After transmissions were completed (about one hour), the range to the moored receivers was increased and the transmissions were repeated. The signal sequence was transmitted eight times during the two experimental days, and over ranges of 1–20 km. Environmental properties were measured throughout the experiments in order to quantify the propagation conditions. CTD casts were performed at each transmission site and Free Fall Cone Penetrometer casts were taken along the ship’s track to characterize the water column and sediment properties, respectively. A pulse propagation model (OASES) was used to transmit signals through a virtual environment to synthesize how the environment distorts a signal as it propagates through the water. The environments at the experimental sites were modeled using the sound speed profiles and sediment characteristics that were measured, and placing ‘receivers’ in the modeled environment at the same depths and ranges as the recorders used in the experiments. This method facilitates model/ data comparisons. The acoustic data collected during the experiments and propagated through the modeled environment were input to the aural classifier algorithm. Classification tasks are divided so that the real and synthetic calls are considered separately. The classifier is first

16
trained using the five features that best discriminated between the real bowhead and humpback calls. The impact of propagation on classifier performance was assessed in terms of classification accuracy and area under the ROC curve (AUC) – one would expect a decrease in AUC and/or accuracy if propagation effects negatively impact classifier performance. Results Preliminary results from the aural classifier using the experimental data are presented in Figure 1a as a performance matrix. The 0 km and 70 m ranges refer to respectively, the original signals that were not transmitted into the water, and the signals transmitted into the water and recorded on the monitor hydrophone 70 m away from the projector. The classifier performance for all training/testing pairs that included data transmitted over 20 km was little better than chance — likely because the SNR of the received signals was so low that no signal could be discerned from the ambient noise when listened to. These results suggest that there is a range-dependent component to the classifier performance. Further work is required to determine the relative importance of complex propagation effects and decrease in SNR (as signals propagate over longer ranges) to the performance degradation noted here.
The OASES model was run for geometries and environmental parameters consistent with the experiment. Figure 1b shows results obtained by training the classifier on synthetic signals propagated with OASES over a range of 0 km (i.e., a receiver was placed at the same range step as the source). Data points were binned into histograms after being projected onto the horizontal axis. Correct classification is repre-sented by a colored histogram bin plotted on the background of the same color (e.g., dark blue on light blue). Histograms of all training and validation results are plotted in the same figure. The classifier was able to discriminate between the signal types with 100% accuracy and an AUC = 1.00 for all propagation ranges. From these results it is clear that the class distributions for both classes are not significantly changed by propagation effects (as a function of range). It should be kept in mind that at this point these results are preliminary, the model currently produces only simplified propagation conditions. In order to make more general statements about the model results, additional work needs to be done to ensure that the pulse propagation model is sufficiently realistic to represent true propagation conditions.
Notes:

17
2014 Marine Mammal & Biology Program Review Sponsor: ONR Status: ONGOING
Advanced methods for passive acoustic detection, classification, and localization
of marine mammals
David K. Mellinger, Marie A. Roch, Steve W. Martin, David J. Moretti, Jonathan Klay Oregon State University; Univ. Salifornia, San Diego; SPAWAR Systems Center; Naval Undersea
Warfare Center [email protected]
Background Automated algorithms must provide the ability to detect, classify, and locate marine mammal vocalizations, and in some cases provide data for estimating the population density of species present. In recent years, researchers have developed algorithms for detecting calls and classifying them to species or species group. Algorithms must be robust in real ocean environments where non-Gaussian and non-stationary noise sources, especially vocalizations from similar species, pose significant challenges. In this project, we are developing improved methods for detection, classification, and localization of many types of marine mammal sounds.. Objectives We are developing advanced real-time passive acoustic marine mammal detection, classifi-cation, and localization methods using a two-pronged approach: developing improved DCL algorithms, and developing standardized interfaces and software. First, we are developing, testing, and characterizing advanced DCL algorithms: 1. Echolocation click classification. Algorithms are being developed and tested for several species of beaked whales and small odontocetes. 2. Tonal signal detection and classification. Algorithms are being tested for several species of mysticetes and for small odontocetes. 3. Multi-sensor localization. Algorithms will be developed and tested on datasets containing sounds of both odontocetes and mysticetes. Second, improved DCL software will be developed and both existing and new methods will be made available in user-friendly software. Methods Odontocete click detection and classification. A multi-class support vector machine (SVM) classifier for echolocation clicks from five
species of odontocetes – Blainville’s and Cuvier’s beaked whales, Risso’s dolphins, short-finned pilot whales, and sperm whales – is being improved by resolving confusion between species whose clicks overlap in frequency. Roch et al. (2008) developed a system for odontocete click classification based on Gaussian mixture models (GMMs) using cepstral feature vectors. This system is being extended to cover more species and more recording/noise environments. Subspace models are being developed using hierarchical principal components analysis and random-projection trees to learn new feature sets instead of cepstral feature vectors. Tonal signal detection and classification. Echolocation clicks that interfere with detection of whistles and other tonal sounds are being mitigated by detecting them and then removing them by interpolation. Extracted contours are classified to species using hidden Markov models (HMMs) which are capable of modeling temporal transitions. Minke boing call detection is done using a first-stage tonal detection step followed by a second stage which processes a narrow frequency band from 1320 to 1450 Hz to detect the onset frequency-modulation (FM) upsweep component of the call. Advanced localization algorithms. The first requirement for passive acoustic localization of marine mammals is the need to associate the detection of an individual signal as it is received across multiple hydrophones. A nearest-neighbor approach to detection association is followed that still uses TDOA/hyperbolic methods, but will not discard TDOAs from pairs of detections when the normally requisite three detections are not achieved. Rather, detections from a given hydrophone will be associated with detections from all of its nearest neighbors and pair-wise TDOAs will be calculated.

18
Software and interfaces. An Application Programming Interface (API) is a specification of a set of procedure calls (for objects, methods), data types (scalars, structures, classes, etc.), and protocols for use of the procedures and data types, making it relatively simple for a developer to add new algorithms to an existing system. New APIs are being developed and tested for Ishmael, M3R, and PAMGUARD. Results Tonal detection/classification. Methods have been developed and applied to fin, sei, Bryde’s, minke, and humpback whales (Fig. 1). The minke algorithm includes detection of minke boing calls, while the other detections are more generic: for humpback song units, and for fin, sei, and Bryde’s whale calls. Humpback song unit processing is also done using the Generalized Power Law (GPL) detector. Improvements also include a common parallel-processing front end. Another approach to whistle classification has concentrated on increasing the purity of automatically generated whistle clusters prior to training hidden Markov models. We completed work on exploiting ridge information in spectrograms to help identify delphinid whistles (Kershenbaum and Roch, 2013). By looking at a spectrogram as a topological map, it is possible to examine the direction in gradient vectors and look for coherent regions where the signs of the gradient vectors swap. This algorithm has been incorporated into our whistle extraction algorithm Silbido. Work on unsupervised clustering of whistles was also refined. Odontocete click detection/classification:. An iterative normalized least mean squares (NLMS) method and a subspace-based method – to separate a raw audio stream into ‘noise’ and ‘signal’ components – were developed for noise reduction in ocean recordings. The methods improve the signal-to-noise ratio of the clicks and help improve detection performance. A new detector was developed using NLMS and the noise-subspace method combined with the existing energy ratio mapping algorithm (ERMA) detector, improving overall performance at detecting Blainville’s beaked whale clicks. Blainville’s beaked whale buzz click sequences are classified using a class-specific support vector machine (CS-SVM).
Localization and tracking. Humpback song unit automated localizations are are done via cross correlation of GPL outputs, rather than spectrograms or raw time series, and are showing promise. GPL processing appears to work in the presence of Navy MFAS activity. Two model-based localization methods have been developed for baleen whale localization. One uses detection start times and associations to determine time difference of arrivals, while the second uses cross-correlation of call sequences between hydrophone pairs. For minke, fin, sei, Bryde’s, and humpback whales, rudimentary kinematic tracking of individual whales enabled automatic call interval analysis. Call intervals automatically obtained not only helped confirm the species, but also added information on the species’ call rates and behavior. Advances were made on localization of beaked whales using TDOAs gained from widely spaced sensors. To handle the large number of ambiguous solutions arising from false time-delay measurements from different sources, propagation paths, or periods of a given click train, we developed an algorithm that efficiently tracks multiple whales in real time. Our approach uses a multi-hypothesis tracker (MHT) with pruning to maintain a large number (thousands) of candidate tracks. With each new update, each track is updated as a Kalman filter using several potential associations, then candidate tracks are pruned. Software: The architecture for writing detection, classification, and localization modules has been completed and communication between Ishmael and PAMGUARD and a test module has been established. The architecture provides a translation library for each DCL platform supported that marshals data into a format that can be shared with other processes. Modules run as separate programs that share a limited region of memory with the DCL platform. This allows modules written on platforms that require separate processes (e.g. Matlab, R) to be gracefully handled. Transitions. Both model-based localization algorithms have been transitioned to an Operations and Maintenance Navy (OMN)-funded effort monitoring for marine mammals in the Hawaii Range Complex (see Related Projects).

19
2014 Marine Mammal & Biology Program Review Sponsor: ONR Status: ONGOING
IMPROVEMENTS TO PASSIVE ACOUSTIC METHODS
FOR TRACKING MARINE MAMMALS
Eva-Marie Nosal Department of Ocean and Resources Engineering, University of Hawaii
[email protected], 808-956-7686
Background The focus of this effort is to improve passive acoustic localization and tracking methods for marine mammals. These methods are useful for monitoring and studying marine mammal bioacoustics and behavior in the wild. Objectives The objectives of this project are to investigate and implement several specific ideas that have the potential to improve the accuracy, efficiency, and applicability of model-based passive acoustic tracking methods for marine mammals: 1) Invert for sound speed profiles, hydrophone position and hydrophone timing offset in addition to animal position. 2) Improve maximization schemes used in model-based tracking. 3) Use information in addition to arrival times for tracking. 4) Improve and test approaches to track multiple animals simultaneously. Methods Existing datasets are used to develop and apply the tracking methods. The main effort is directed toward data collected at Navy Ranges (esp. AUTEC and PMRF), but other datasets that use bottom-mounted sensors are also be considered if they are available and appropriate. This project uses model-based tracking methods [e.g. Tiemann et al. 2004; Thode 2005; Nosal 2007] the have been developed to localize animals in situations where straight-line propagation assumptions made by conventional marine mammal tracking methods fail or result in unacceptably large errors. A source is localized by maximizing the ambiguity surface defined by the least squares difference between predicted and measured arrivals times. Arrival time predictions are made using a sound propagation model, which in turn uses information about the environment including sound speed profiles and bathymetry. Calculations are based on measured time-of-arrivals (TOAs) or time-differences-of-arrival (TDOAs), modeled
TOAs/TODAs, estimated uncertainties, and any available a priori information. All methods are fully automated through MATLAB code. To meet Objective 1, sound speed, phone position and/or timing offsets are included (in addition to source location) in the set of unknown model parameters in model-based tracking. For Objective 2, the benefits (including reduced run times and more precise position estimates) of implementing maximization schemes that are more sophisticated than the usual grid search methods to find local maxima in ambiguity surfaces are explored. To meet Objective 3, the ambiguity surface function is expanded to include received sound pressure levels and transmission loss. For Objective 4, 2 approaches are taken: 1) Development of source separation methods that are applied prior to tracking, and 2) Extension of the ambiguity function to include all possible associations (or cross-correlation peaks) in the ambiguity surfaces. Results Including sound speed profiles (via the first 3 principal components) in inversion results in “tighter” peaks in the localization ambiguity surfaces, therefore lower error bars. This is a result of better match between data and model. For example, in a minke whale boing dataset (7 PMRF hydrophone localization dataset from the 2011 DCLDE Workshop), including SSP in the inversion reduced 95% confidence intervals in position estimates by 2-5 times. A simple downhill simplex optimization scheme (Neadler-Meade) was implemented. For the Minke PMRF dataset, the optimization scheme consistently converged to values near the correct maxima and overall run times were reduced by ~10 times when compared with a grid-search method (which successively refines grid spacing as the algorithm “zooms in” on the final solution). The same approach was applied to the AUTEC sperm whale localization datasets from the 2005 DCL Workshop and worked well

20
in cases with relatively simple likelihood surfaces (i.e. small parameter spaces and few peaks from few animals and well-associated calls) [Nosal 2013]. In more complicated cases (e.g. multiple animals and/or mis/un-associated calls) the likelihood surfaces are multi-modal and require more sophisticated optimization schemes to identify maxima (work ongoing). Theory was developed to localize marine mammals using received sound pressure level. The approach uses differences in received sound pressure levels (DSPLs) in the same way that that time-differences of arrival are used in model-based time of arrival localization methods. A source is localized by finding the position that gives predicted sound pressure levels that best match measured sound pressure levels. Using this method, sound pressure levels can be used to roughly localize marine mammals with widely-spaced hydrophones (assuming source omni-directionalily and if hydrophones calibration). Due to large errors, the DSPL model-based localization method will be most useful in cases with non-synchronized hydrophones or when combined with timing-based localization methods. Work is ongoing.
The model-based TDOA method was extended to deal with multiple-animal datasets using a method in which animals are separated based on position. The method does not require a TDOA association step, and false TDOAs (e.g. a direct path associated with a multipath arrival) do not need to be removed. An analogous development was also made for a model based time of arrival (TOA) tracking method. Both methods are outlined and demonstrated using the AUTEC 2005 DCL dataset in Nosal 2013. References Nosal E-M, LN Frazer (2007). Sperm whale three-dimensional track, swim orientation, beam patter, and click levels observed on bottom-mounted hydrophones. JASA 122(4), 1969-1978. Nosal, E-M (2013). Methods for tracking multiple marine mammals with wide-baseline passive acoustic arrays. J. Acoust. Soc. Am. 134(3), 2383-2392. Thode A (2005). Three-dimensional passive acoustic tracking of sperm in ray-refracting environments. JASA 18(6), 3575-3584. Tiemann CO, MB Porter, LN Frazer (2004). Localization of marine mammals near Hawaii using an acoustic propagation model. JASA 115(6), 2834-2843.
Notes:

21
2014 Marine Mammal & Biology Program Review Sponsor: ONR Status: ONGOING
DCL System Using Deep Learning Approaches for Land-Based or Ship-Based
Real-Time Recognition and Localization of Marine Mammals
Peter J. Dugan, Yann A. LeCun, Sofie M. Van Parijs, Christopher W. Clark Cornell University
[email protected], 607.254.1149
Background The ONR DCL grant focuses on advancing the state of the art for bioacoustic signal detection and classification through researching new technologies, algorithms and systems. This work engaged a unique team of experts from Cornell University (CU), New York University (NYU) and Northeast Fisheries Science Center (NEFSC) which aimed at developing new technologies for advancing detection, classification (DC) for data mining big datasets. The research achieved several significant outcomes. First, a new software and hardware framework using high performance computing (HPC) was developed using commercial off the shelf products. The software, called DeLMA (time series acoustic signal Detection and Localization using Machine learning Algorithms), provides a generic data processing model, which is flexible and scalable, allowing integration of customized data-mining algorithms, operating on platforms ranging from laptops to distributed server systems. Research shows that the processing model can support a range of inputs consisting of different data sources and sensor types; addressing hybrid-systems and complex data needs. Configurable load balancing and remote-distributed processing offers the capability of supporting large oceanographic datasets while utilizing the power of HPC processing. Naval applications and research laboratories requiring high-speed data processing could benefit from this technology. Processing is orders of magnitude faster than serialized solutions, thereby enhancing performance for mission critical results. Scalability can help keep platforms uniform and consistent across field observations and laboratory environments, while accommodating ship-based or faster than real-time, big data environments. The DeLMA model is also capable of integrating a variety of data sources, such as results from acoustic models and vessel information, for advanced signal processing, leveraging mixed sensor applications for other related initiatives. Objectives The work focused on algorithms, hardware and software for advancing detection, classification and general data-mining capabilities, such as localization, as applied to scalable data environments, Figure 4. Algorithm research was aimed at leveraging the International Machine Learning Community (IMLC) for
investigating new advanced technologies for data mining large sound archives; specifically, new technologies such as the convolutional neural network (CNN) and some traditional approaches applied to multiple sensor inputs, such as hybrid algorithms. Software and hardware objectives use advanced systems science approaches, aimed at investigating strategies to help overcome the challenges of processing and analyzing large amounts of passive acoustic data, making it easier for scientists to gain better understandings of movement patterns, population trends and behavioral responses. The final segment of this work is focused on large, integrated datasets for multi-year data.
Figure 4. HPC components developed under this work. Methods Algorithms CU collaborated with institutions and businesses to promote the development of advanced algorithms. To address a variety of mysticete sounds, algorithm work was broken down to two types, referred to as TYPE-I (frequency-modulated, FM), and TYPE-II (pulse trains, PT). All TYPE-I work and data competitions focused on North Atlantic Right Whale (NARW) signals. Early phases of TYPE-I research worked with NYU to develop a working prototype of a biologically motivated algorithm, CNN. Research was further promoted within IMLC through Kaggle.com and the bioacoustics community. CU developed two new TYPE-I algorithms, one based on connected region processing (CRA) and the second on histogram of oriented gradients (HOG). Both CRA and HOG methods were fitted to the DeLMA software for scalable processing. The team competed in two international competitions and hosted a third competition at the Bioacoustics Workshop at the International Conference on Machine Learning (ICML-2013). TYPE-II, algorithm work was supported and

22
applied to several existing and new projects, supporting detection for several signal types. A new extension for applying algorithms to the HPC, called HK-ANN, was investigated. Work focused on allowing the human operator to improve detection performance by influencing the HPC-ADA system through visual inspection of the output, referred to as user-assisted-recognition. Research required an expert human operator to score detection event outputs from any algorithm, and then execute a post-processing artificial neural net to further refine the initial HPC result. Software A software model for processing large time-series datasets, called DeLMA, was developed using MATLAB, Figure 5. The system was designed to scale from a laptop (or desktop) application to a large, distributed server hardware platform. Design included a flexible HPC interface, capable of running a variety of algorithms concurrently, across multiple datasets and sound formats.
Figure 5. Software, scalable from laptops to servers Hardware A scalable hardware platform referred to as the HPC Acoustic Data Accelerator (HPC-ADA), was developed as a powerful distributed server platform for executing big data applications for single, or multi-channel datasets, Error! Reference source not found.. The HPC-ADA prototype system was constructed utilizing a DELL Cloud Server C6220, with remote access to other platforms. The system contains 64 physical cores of Intel Xeon E-2670 @ 2.6 GHz processor, 192 GB of local memory, 2 TB of local disk storage used for local cache, 32 TB of gigabit connected network attached storage for sound archives and data products. The HPC-ADA server hosts the DeLMA software application with several data-mining algorithms to support research and various analysis projects.
Results With help from collaborators, the team sponsored an open competition for algorithm development in conjunction with an ICML workshop. Two data competitions were leveraged through Kaggle.com, collectively attracting 245 independent teams. Solutions varied, several biologically inspired CNNs finished near the top along with various hybrid algorithms. Scores were relatively high, with the top 10 entries having a mean score 98.05% +/- 0.246%.
Figure 3. HPC-ADA architecture The competition also indicated that separate groups of human analysts may disagree by as much as a 25% (+/-7.8%) in their DC results for two identical datasets. The Cornell solutions, CRA and HOG, finished in the top 20% for Kaggle, scores 96.4% and 93.8% respectively. CRA and HOG were then applied to a 12 months dataset. Results show strong seasonal patterns for NARW calling behavior when running against large datasets. The TYPE II algorithm methods were applied to support several projects. Post-classifier results using the HK-ANN method showed an increase in true positive rate of 20% and reduction of false positive rate of 6%. Altogether, from 2011-2013, algorithms and HPC technology developed through this work have successfully supported 19 large projects at CU and executed over 3.6 million channel hours of sounds. Critical work is seeking funding for this promising, ongoing research for HPC technology development aimed at improving methods and techniques related to data mining for big data applications. The final phase of initial funding is focused on manuscripts and the release of related materials.
Notes:

23
2014 Marine Mammal & Biology Program Review Sponsor: ONR
Status: COMPLETED
Cheap DECAF: Density Estimation for Cetaceans from Acoustic Fixed sensors using separate, non-linked devices
Len Thomas, Danielle Harris
Centre for Research into Ecological and Environmental Modelling (CREEM) University of St Andrews
St Andrews, UK Email: [email protected]
Phone: UK+1334 461801
Luis Matias Centro de Geofísica
Universidade de Lisboa Lisbon, Portugal.
Background The primary aim of Cheap DECAF was to make density estimation of cetaceans less costly and, therefore, more accessible to the wider scientific community. The methods developed here are applicable to re-deployable arrays of both sea-bed mounted instruments (such as Ocean Bottom Seismometer arrays) and surface buoys, so should increase our capability to monitor cetacean density in geographic areas of interest, including those where naval operations are conducted. Objectives The specific objectives of the project were to: 1. demonstrate how cue-counting methods can be used efficiently to obtain estimates of density over long time periods and large spatial scales using directional sound sensors; 2. extend the methods to allow for uncertainty in the depth of vocalizing animals; 3. develop and apply methods based on tracking moving individual animals; 4. develop and apply methods based on measuring total sound energy in relevant frequency bands; 5. obtain baseline estimates of spatial density of fin whales in the study area. Objectives 1 – 3 were led by the University of St Andrews/University of Lisbon. Objective 4 is being led by Oregon State University (grant number: N00014-11-1-0606). Objective 5 was a joint objective. Methods All objectives used data from recordings of fin whales (Balaenoptera physalus) from a sparse
array of Ocean Bottom Seismometers (OBSs). The OBS array was deployed for 1 year (2007-2008) off the south coast of Portugal, near the Straits of Gibraltar (Fig. 1).
-6.0 °-7.0 °-8.0 °-9.0 °-10.0 °-11.0 °-12.0 °-13.0 °
-6.0 °-7.0 °-8.0 °-9.0 °-10.0 °-11.0 °-12.0 °-13.0 °
39.0
°38.0
°37.0
°36.0
°35.0
°34.0
°33.0
°
39.0
°38.0
°37.0
°36.0
°35.0
°34.0
°33.0
°
Fig. 1 Location of the array of 24 OBS sensors in the Atlantic off Portugal. Green denotes instruments that could estimate range to detections for their entire deployment, red denotes instruments that could not estimate ranges and white denotes instruments that could estimate ranges for parts of their deployment.
The 1-year dataset was processed to detect and estimate ranges to fin whale calls. Distance sampling was then applied to the range data. Specifically, a cue counting approach was applied (where calls, not animals, were the units of interest) with multiple covariates added to the detection function model in order to investigate whether various oceanographic variables influenced the ability to detect calls. The results of the distance sampling were used to correct the number of detected calls for those missed. Spatial modeling techniques were then used to

24
(a) investigate spatio-temporal patterns of fin whale call density, and (b) incorporate data from instruments that were not able to range to detected calls. Extensive development and testing of the ranging method was also conducted throughout the project. There were two main areas to explore: (a) the accuracy of the range estimates and how these could be improved, and (b) the effect of poor range estimates in a distance sampling analysis. Methods to account for animal depth in acoustic distance sampling surveys were also developed by extending work on krill swarm density estimation (e.g., Cox et al., 2011). Results The distance sampling results showed that there was a clear temporal pattern in call densities, with a peak in calling in December and January (Fig. 2). Month and depth were selected as significant covariates that affected detectability of calls. The spatio-temporal modeling results suggested that time of year, depth, seafloor slope, shipping levels, ocean surface velocity, sea surface temperature, latitude and longitude were all significant explanatory variables of the spatio-temporal patterns of fin whale calling activity (fitted using a Generalized Additive Model). The main results of developing and testing the ranging method were: the accuracy of the ranging algorithm was improved by further considering the velocities in the sediments and the water column, as well as applying an additional correction factor to account for gain differences between the vertical and horizontal channels. The optimal set of parameters were applied to a fin whale track from an auxiliary dataset from the Azores (Fig. 3). The method development work to account for animal depth involved the simulation of several monitoring scenarios with both towed and fixed sensors. With adequate sample size, most of the simualtion results generated a bias of less than 10%.
Fig. 2 Preliminary monthly call densities with 95% confidence intervals displayed. Units are calls/100 km
2. hr
-1.
Fig. 3 Comparison of ranges to fin whale calls that are (1) estimated using triangulation and (2) estimated using the single-sensor ranging method (SSM). The best choice of elastic parameters in the sediments are used and an amplification factor (F) of two is applied to the vertical channel. Reference: Cox, M.J., Borchers, D.L., Demer, D.A., Cutter, G.R. & Brierley, A.S. (2011) Estimating Antarctic krill (Euphausia superba) density from multibeam echosounder observations using distance sampling methods. Journal of the Royal Statistical Society: Series C (Applied Statistics), 60, 301–316.
Notes

25
2014 Marine Mammal & Biology Program Review Sponsor: ONR
Status: COMPLETED
Cetacean Density Estimation from Novel Acoustic Datasets by Acoustic Propagation Modeling
Elizabeth T. Küsel(1), Martin Siderius(1), David K. Mellinger(2)
(1) Portland State University, (2) Oregon State University [email protected], (503) 725-3223
Background Odontocete echolocation clicks have been used as a preferred cue for density estimation studies from single-sensor data sets. Such studies require estimating detection probability as a function of range. Many echolocation clicks can be very broadband in nature, with 10-dB bandwidths of 20 to 40 kHz or more. Because detection distances are not realizable from single-sensor data, the detection probability is estimated in a Monte Carlo simulation using the sonar equation along with transmission loss calculations to estimate the received signal-to-noise ratio (SNR) of tens of thousands of click realizations. Continuous-wave (CW) analysis, that is, single-frequency analysis, is inherent to basic forms of the passive sonar equation. By means of analytical formulations, it has been recently shown that considering transmission loss by using CW analysis with the click’s center frequency while disregarding its bandwidth introduces bias to detection probabilities and hence to population density estimates. Objectives The main objective of this work is to examine the methodology that has been used to estimate detection probabilities of highly broadband clicks recorded by single instruments. Using simple modeling experiments based on synthetic and real data sets that have highly broadband signals, we quantify the bias in the sonar equation estimates of detection probability and its effect on density estimates. Furthermore, we discuss the usage of transmission loss as an appropriate measure for calculating the SNR of received clicks, as well as the usage of complex propagation models that require, most often nonexistent, detailed environmental information. Lastly we also look into the effects of including multipath clicks in density estimates. Methods A series of modeling experiments were devised with increasing degrees of complexity to
examine the effect of high frequency and highly broadband calls on density estimates. All experiments were based on the single-sensor density estimation formula. First, a simple experiment was conducted where 100 points were randomly distributed inside circular areas of 10 and 20 km. Different detection circles were assumed inside both circular areas, and were defined by the radius where transmission loss equaled noise levels. The synthetic data was created using a single frequency and the modeling to estimate detection probabilities was performed by using the same frequency, and also a higher frequency than the data. The objective was to show that by using a different frequency in the simulations than that of the original data, the detection circle would change and density estimates would be consequently under or overestimated. A more complex synthetic data set was then created by calculating arrival amplitudes for each of the 100 points randomly distributed inside an 8 km circular area. Arrival amplitudes were convolved with a synthetic and highly broadband signal. Realistic ambient noise data was also added to the received signals. Analysis of this synthetic data set and its modeling was performed following three distinct cases. Case 1 considered a 5 kHz bandwidth centered around the signal’s center frequency and disregarded all multipath arrivals. Case 2 considered the full bandwidth of the signal but still disregarded multipath arrivals. Finally, case 3 considered both the full bandwidth and the multipath arrivals. By knowing the exact number of points, or animals, we could investigate how well the density estimator performed and the effect of choosing different frequency bands for the detection and modeling components of the analysis. A test case using a real data set containing highly broadband false killer whale (Pseudorca crassidens) clicks recorded off the Kona coast of Hawai’i was used to further investigate the methodology. In this case, whale

26
acoustic and diving behaviors were also incorporated into the model. Results For the simple modeling experiment, the expected probability of detection is given by the ratio of the detection area by the total area. The total number of animals divided by the total area considered gives the expected density. We observed from the results that when the same data frequency was used in the modeling, expected and simulated probability of detection and density estimate agree well. On the other hand, by using a higher frequency in the Monte Carlo simulation, the probability of detection is underestimated and consequently the density estimate is overestimated. Results of the analysis using the more complex synthetic data set showed good agreement between the expected density estimate and the calculated estimate using a narrow bandwidth around the
center frequency and no multipath detections. By considering the full bandwidth of the synthetic signal in case 2, caused the density estimate to increase. Case 3, which considered both full bandwidth and multiple arrivals, yielded a density estimate that was approximately double from that of case 2. A close look at transmission loss indicate that either for isospeed or heterogeneous waveguides, this parameter could be calculated using the simpler spherical spreading law plus high frequency attenuation for the purpose of estimating population density. It is worth noting that each detected click corresponds to one arrival and that transmission loss is the sum of all the arrivals. As observed in the synthetic data set, at closer ranges to the recording sensor, multiple arrivals can be present. However, it is also noted that multiple arrives can be extremely difficult to discern in real data sets.
Notes:
27
2014 Marine Mammal & Biology Program Review Sponsor: ONR Status: ONGOING
SOUNDSCAPES
Michael B. Porter and Laurel J. Henderson
Heat, Light, and Sound Research [email protected] (858)457-0800
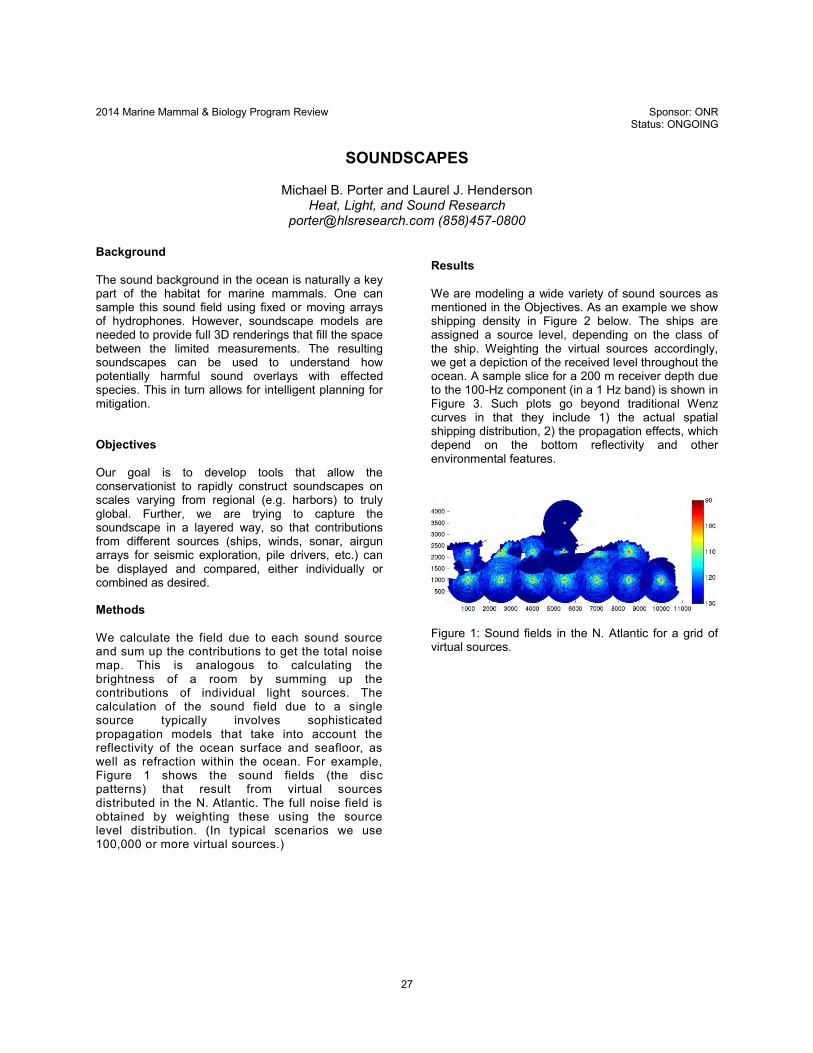
Background The sound background in the ocean is naturally a key part of the habitat for marine mammals. One can sample this sound field using fixed or moving arrays of hydrophones. However, soundscape models are needed to provide full 3D renderings that fill the space between the limited measurements. The resulting soundscapes can be used to understand how potentially harmful sound overlays with effected species. This in turn allows for intelligent planning for mitigation. Objectives Our goal is to develop tools that allow the conservationist to rapidly construct soundscapes on scales varying from regional (e.g. harbors) to truly global. Further, we are trying to capture the soundscape in a layered way, so that contributions from different sources (ships, winds, sonar, airgun arrays for seismic exploration, pile drivers, etc.) can be displayed and compared, either individually or combined as desired. Methods We calculate the field due to each sound source and sum up the contributions to get the total noise map. This is analogous to calculating the brightness of a room by summing up the contributions of individual light sources. The calculation of the sound field due to a single source typically involves sophisticated propagation models that take into account the reflectivity of the ocean surface and seafloor, as well as refraction within the ocean. For example, Figure 1 shows the sound fields (the disc patterns) that result from virtual sources distributed in the N. Atlantic. The full noise field is obtained by weighting these using the source level distribution. (In typical scenarios we use 100,000 or more virtual sources.)
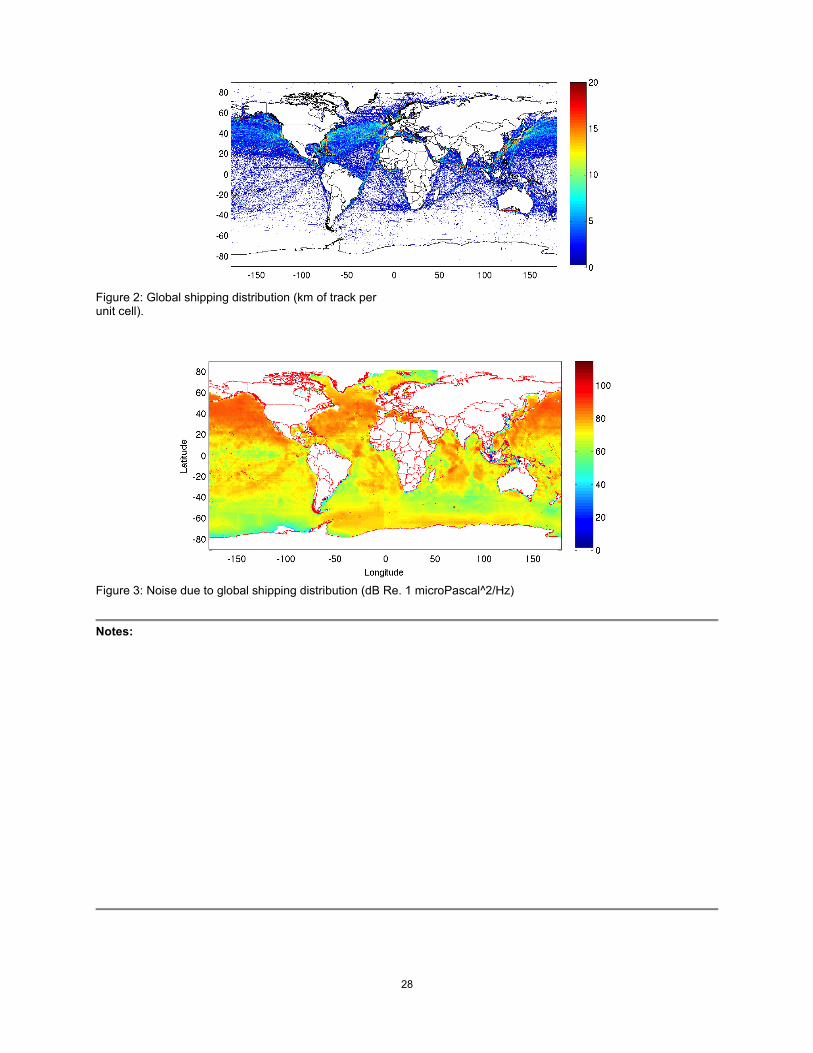
Results We are modeling a wide variety of sound sources as mentioned in the Objectives. As an example we show shipping density in Figure 2 below. The ships are assigned a source level, depending on the class of the ship. Weighting the virtual sources accordingly, we get a depiction of the received level throughout the ocean. A sample slice for a 200 m receiver depth due to the 100-Hz component (in a 1 Hz band) is shown in Figure 3. Such plots go beyond traditional Wenz curves in that they include 1) the actual spatial shipping distribution, 2) the propagation effects, which depend on the bottom reflectivity and other environmental features.
Figure 1: Sound fields in the N. Atlantic for a grid of virtual sources.
28
Figure 2: Global shipping distribution (km of track per unit cell).
Figure 3: Noise due to global shipping distribution (dB Re. 1 microPascal^2/Hz)
Notes:

29
2014 Marine Mammal & Biology Program Review Sponsor: ONR Status: ONGOING
Ocean Basin Impact of Ambient Noise on Marine Mammal Detectability,
Distribution, and Acoustic Communication - YIP
Jennifer L. Miksis-Olds Applied Research Laboratory, The Pennsylvania State University
[email protected], (814) 865-9318
Background Sound is capable of propagating over great distances in the ocean, and loud, low frequency sources can propagate half-way around the globe. For this reason, sound can be used to observe a variety of signals in marine ecosystems ranging from natural phenomena to anthropogenic activities indicative of global ocean use and climate change. The acoustic characteristics of marine habitats have direct implications on marine animal communication, navigation, and sensing of their environment. Ocean sound is also important to humans for tasks related to signal detection associated with military surveillance and environmental monitoring of animals for mitigation and regulatory purposes. Effective sound transmission in the marine environment is impacted by many factors including physical and chemical properties of the seawater, as well as human generated noise linked to ocean transportation, energy exploration, and military operations. The ultimate goal of this research is to enhance the understanding of global ocean noise and how variability in sound level impacts marine mammal acoustic communication and detectability. How short term variability and long term changes of ocean basin acoustics impact signal detection will be considered by examining 1) the variability in low frequency ocean sound levels and sources, and 2) the relationship of sound variability on signal detection as it relates to marine mammal active acoustic space and acoustic communication. This work increases the spatial range and time scale of prior studies conducted at a local or regional scale. The comparison of acoustic time series from different ocean basins provides a synoptic perspective for observing and monitoring ocean noise on multiple times scales in both hemispheres as economic and climate conditions change. Quantified changes in the acoustic environment can then be applied to the investigation of ocean noise issues related to general signal detection
tasks, as well as marine mammal acoustic communication and impacts. Objectives 1. Determine the major sources (or drivers) of variation in low frequency ambient sound levels on a regional and ocean basin scale. 2. Investigate the impacts of variation in low frequency ambient sound levels on signal detection range, marine mammal communication, and distribution. Methods Over a decade of oceanographic data, shipping information, and historical acoustic data from the Comprehensive Nuclear Test-Ban Treaty Organization (CTBTO is being used to investigate the relationship between ambient ocean sound, its variability, and signal detection. Regional noise variability statistics were quantified and applied to calculations of the range over which signals can be detected given the inherent environmental variability. Propagation loss was modeled with the OASIS Peregrine parabolic equation (PE) model (in collaboration with Kevin Heaney, OASIS). The regional soundscape was decomposed into multiple frequency bands and statistical parameters to examine the patterns and trends in the rate and direction of change in low frequency sound over the past decade. Time series of species specific vocal detections have been compiled indicating hourly presence/absence over the duration of the datasets. The vocal detections are the response parameter in ongoing model development to identify the strongest predictors of marine mammal vocal presence in each location. Model parameters include: sound level, temperature, chlorophyll concentration, primary productivity estimates, and shipping movements. Results Linear trend analysis revealed that ocean sound levels have not uniformly increased across the globe over the past decade (Figure 1). Parsing the soundscape into frequency categories and

30
Figure 2. Long term spectral averages for (Left) a decade time series in the Indian Ocean over the 80-125 Hz bandwidth, and (Right) a six year time series in the Pacific Ocean over the full CTBTO IMS bandwidth (1-125 Hz). Images were created with a one hour window and 0.25 Hz resolution.
sound level percentiles allowed for detailed examination of the acoustic environment that would not have been possible with a single analysis of the full spectrum or with a single sound level parameter. The use of percentiles was valuable in discriminating between trends in the sound floor, median levels, and loudest sound levels. Analysis of the different sound level parameters indicated that a single parameter trend analysis is not sufficient for a comprehensive understanding of sound level dynamics at any one location. Great variability in the soundscape was observed over time scales ranging from hours to seasons. This translated into order of magnitude differences in signal detection area. The greatest seasonal variability was observed at Wake Island in the Equatorial Pacific Ocean, and analysis of distribution of signal detection area estimates on a daily basis showed clear differences between ocean basins. Long term spectral averages highlight the decrease in frequency of vocalization for blue whales in the Indian Ocean (Figure 2). There was not an analogous decrease in fin whale vocalizations observed at the Pacific Ocean location (Figure 2). Species detected at the Indian Ocean location include Antarctic, Madagascar, and Sri Lankan blue whales, fin whales, minke whales, U1, and U2 type calls attributed to unidentified blue whales. Species
detected in the Pacific Ocean at Wake Island were fin, blue, minke and Bryde’s whales.
Notes:
Indian Ocean*
Eq. Pacific Ocean***
S. Atlantic Ocean**
Figure 1. Summary of linear trends for the full spectrum (5-115 Hz). P1 is the soundfloor, P50 is the median, and P99 is the time series of loudest events. Sound levels are in dB re 1mPa
2/Hz. *
denotes the trend over a 10 year dataset. ** denotes the trend over an 8 year dataset. *** denotes the trend over an approximate 6 year dataset.

31
2014 Marine Mammal & Biology Program Review Sponsor: ONR Status: ONGOING
Acoustic Behavior of North Atlantic Right Whale (Eubalaena glacialis) Mother-Calf Pairs
Susan E. Parks1, Sofie Van Parijs2
1- Syracuse University, Department of Biology [email protected], (315) 443-1795
2- Northeast Fisheries Science Center, NOAA Fisheries [email protected], (508) 495-2991
Background North Atlantic right whales (Eubalaena glacialis) are a highly endangered baleen whale species. Mother-calf pairs are a critical segment of the population for recovery, however these individuals suffer from higher accidental mortality from vessel strikes than other right whales. The long-term goal of this project is to quantify the behavior of mother-calf pairs to determine a) why mothers and calves are more susceptible to collisions with vessels and, b) determine the vocal behavior of this critical life stage to assess the effectiveness of passive acoustic monitoring to detect mother-calf pairs in important habitat areas. Objectives The primary objectives of this project are to: 1) determine behavioral characteristics that may make mother-calf pairs more susceptible to collisions with vessels than other right whales, 2) quantify vocal development and behavioral ontogeny of calves, 3) assess the individual distinctiveness of right whale vocalizations, and 4) characterize vocal behavior of mother-calf pairs to assess effectiveness of passive acoustics for monitoring in 3 critical habitat areas over a period of 5 years (2011-2015). Methods Data collection occurred in three known critical habitat areas for North Atlantic right whales for a total of five months of the year (January-February off the coast of Florida (SE), April in Cape Cod Bay (CCB), Massachusetts, and August-September in the Bay of Fundy (BOF), Canada). In each of the habitats, focal follows were conducted on mother-calf pairs with a special emphasis on repeated data collection from specific pairs to assess ontogenetic changes in the behavior and sound production of calves. For each focal follow, data collected include behavioral focal sampling, passive acoustic recordings, and in some cases, attachment of non-invasive suction cup acoustic recording tags to assess the behavioral state,
diving behavior and sound production behavior of mother-calf pairs. Results To date, 59 focal follows have been conducted from 30 different mother-calf pairs. Data include over 129 hours of behavioral observations, 148 hours of acoustic recordings with at least 1150 high signal-to-noise ratio calls documented in the presence of mother-calf pairs, and 6 tags deployed on a either a mother or calf from 2 different habitat areas in 2014 (5 in the southeast and 1 in Cape Cod Bay). The behavioral state time budgets and the call rates of individual of right whale mother-calf pairs changed considerably between the SE U.S. (birth) and the BOF (just prior to weaning 8 months later). In all three habitat areas, mothers and calves spent the majority of their time in a resting state, however this amount declined throughout the year, from 76% to 44% for mothers between the SE U.S. and the BOF and from 69% to 51% for calves. There was also a decrease in the time spent in nursing behaviors. (10% in SE U.S. to 3% in the BOF). There was also an increase in the time spent traveling, feeding, and socializing during this progression (Figure 1a and 1b).

32
Figure 6a and 1b: the activity state in which North Atlantic right whale mothers and their calves spend the majority of their time varies between the three critical habitats. The behavioral states associated with call production also changed between habitat areas. Although the overall call rate of mother-calf pairs was low, it was always highest during social behavior in all three habitats. In the SE U.S., the average call rate during social behavior was 5 calls/hour compared with 1 call/hour in all other activity states combined. In Cape Cod Bay, there was an average rate of 104 calls/hour during social behavior compared with only 3 calls/hour in all other activity states combined. Lastly, in the Bay of Fundy, there were an average of 150 calls/hour while social compared with 18 calls/hour in all other activity states combined. The calls produced by calves in the SE U.S. are also considerably different in structure from those of adult right whales. This presents a problem for passive acoustic monitoring as a
method to automatically detect the presence of right whales as only calls with characteristics of adult upcalls would be detected (Figure 2a and 2b). This fact, coupled with the low levels of vocal behavior when mothers and calves are together, suggest that passive acoustic monitoring will not be an effective technique for reliably detecting right whale mother-calf pairs, at least in the SE U.S. critical habitat, and other methods must be considered.
Figure 7a and 2b: the upcalls of a newborn North Atlantic right whale calf do not share the same acoustic parameters as the upcalls of adult right whales, creating potential problems for the use of passive acoustic monitoring.
Notes:
33
Day 2: Tuesday May 21, 2014
2014 ONR
Marine Mammal & Biology
Program Review

34
2014 Marine Mammal & Biology Program Review Sponsor: ONR Status: ONGOING
Population parameters of Blainville´s and Cuvier´s beaked whales
Natacha Aguilar, Cristina Reyes, Agustina Schiavi, Phil Hammond
University of La Laguna (ULL), Tenerife, Canary Islands, Spain [email protected], +34 636876526
Background Beaked whales appear to be specifically sensitive to some acoustic sources and this can lead to mass strandings. The scarcity of knowledge about the population dynamics and reproductive parameters of these animals impedes the assessment of the population effects of stranding mortalities. This ONR funded project continues a long-term photo-ID study in the island of El Hierro, performed here since 2003 largely with NOPP/ONR funding. El Hierro is a pristine area of residence of Blainville´s and Cuvier´s beaked whales (Mesoplodon densirostris and Ziphius cavirostris) in the Canary Islands (Spain), where the populations are expected to be limited by natural factors. El Hierro has a steep bathymetry and beaked whales are found in deep waters close to the shore. This allows us to perform low-cost shore-based research of these species. The combined effort of observers from a coastal cliff and from a boat enables effective detection of groups of beaked whales occurring in the study area. Long-term monitoring provides an ideal opportunity to study social structure and demography in the populations of El Hierro, expected to be limited by natural variables such as habitat carrying capacity. Re-sightings of reproductive adults provide life-history data such as reproduction rates, essential to assess the recovery capacity of the species after mass mortalities. The results of the project augment the sparse knowledge about beaked whale population biology, facilitating the assessment of potential population effects of human impacts on these species. This long-term study has produced one of the largest individual catalogs available for beaked whale species. The catalog is accessible at www.cetabase.info for the scientific community and the public. Objectives 1. To assess the spatial fidelity of beaked whales to local areas and the connectivity of the populations among neighboring areas. Here, the study is in the Canary Islands. 2. To estimate beaked whale abundance in El Hierro and analyze the dynamics of the local populations of Blainville's and Cuvier's beaked whales over a 12 year period. 3. To study medium and long term individual associations. 4. To obtain life history parameters of Blainville's beaked whales from long-term photoID data Methods The land and boat-based stations communicate by VHF radio. Once a group is detected the boat
approaches it to obtain individual photo-identification data, as well as to record the composition and behavior of the group. Ancillary data collection during the cruises, performed at no cost for the project, include oceanographic parameters and acoustic recordings of groups with and without calves during dives. Between 2012 and 2014 we performed twelve seasonal photoID surveys off El Hierro, summing 134 days of field cruises. In total, 92% of these days had good conditions to work at sea. Of these, photoID of beaked whales was achieved in 86% of the days (82% of all field days). The species photo-identified were one or both resident ziphiid species in the waters of the island: Blainville’s and Cuvier’s beaked whales. Capture-recapture analysis of the photoID data was performed using software Mark and U-care. The individual cataloge of beaked whales is made available in Cetabase. This bilingual open-access virtual catalogue has analytical tools providing data summaries downloadable as csv spreadsheets and as text files ready to use in software Mark for population analysis. It is designed to allow data sharing of marine mammals, while maintaining data ownership. Cetabase got in 2014 more than 100.000 hits, from some 20 countries. Connectivity: photographs of beaked whales from entities working in other islands were gathered, summing 75 Blainville´s and 76 Cuvier´s beaked whales to be compared with the cataloge of El Hierro. Results Life-history parameters and social structure: The best estimates of life history parameters for the population of Blainville´s beaked whales in El Hierro are: i) age of sexual maturity and first birth for females: ≈10 and 11 years, respectively; ii) inter-calf interval: ≈3 years (i.e. the new calf is born 3 years after the birth-year of the previous calf), and as low as two years in cases when the first calf was missing (calf death?); iii) weaning age: 2-3 years. For Cuvier´s beaked whale only one female has been monitored during more than one breeding cycle, with an inter-calf interval of 5 years. The best estimate weaning period of this species, based on three females, is of 3.5 years. Potential long-term kin associations between female Blainville´s: The composition of the groups of beaked whales changes with time, resembling a fission- fusion society typical of delphinids. However, some individuals seem to have preferred companions and the factors influencing the degree of inter-individual

35
association are still unknown. Blainville´s beaked whales often form harems in groups that remain stable for variable periods of time. Our database includes only one case of a female monitored from juvenile to first reproduction. This female was weaned at an estimated age of 3 years and dispersed from the family group only to re-associate with her mother at the time of her first reproduction. This anecdote raises the possibility that mothers play a role in the fitness of their female offspring. In matrilineal species such as killer whales, mothers seem to play an important role in the long-term survival of their male offspring, even when the offspring has reached adult size. Foraging restrictions on females with recently born calves. In spite of their fission-fusion society, groups of Blainville´s beaked whales can be stable over a year and groups tend to dive in a coordinated manner. DTAG data in the same area of El Hierro show that adult beaked whales do not feed in dives shallower than 200 m depth or shorter than some 30 min long. In El Hierro, mother-calf pairs including very young calves have been observed performing only series of 10 min dives. This suggests that females may restrict their foraging behavior when their offspring are very young. It is unknown if females act as capital breeders during this time, consuming previously gathered energy stores, or if they change their foraging behavior to adapt to shallower prey. Population size. The total adult population of El Hierro with recognizable body marks in the same part of the body comprises 54 Blainville´s and 58 Cuvier´s beaked whales. Of these, 54% and 45% of the individuals of each species, respectively, were observed only once since 2003. Some of these whales may be transients, i.e. they visited the area only once, while others may have been in the area and passed unnoticed, or may return to El Hierro after
some years. The second option is supported by the long time-lags between consecutive sightings recorded for some animals, of up to four years, with a mean time-lag of 2 years. Based on this, and excluding the animals seen for first and only time in 2013 or 2014, 53% of the Blainville´s and 62% of the Cuvier´s beaked whales have been seen more than once. These individuals can be considered as the core residents in El Hierro, with individual Blainville´s beaked whales that have been observed from 2003 to 2014, in up to 9 different years, and individual Cuvier´s beaked whales observed in up to 10 years in this period. Connectivity. The larger two catalogues of beaked whales in the archipelago are from the most occidental island (El Hierro) and from the most oriental islands (Fuerteventura y Lanzarote). These areas are some 200 nm apart. Smaller photoID catalogues are available from three other islands at 30, 40 and 60 nm from El Hierro. No photoID matches have been detected among any of the islands for Blainville´s or Cuvier´s beaked whales. In contrast, there are numerous re-sightings within each island, this includes resightings in islands where the sample size is small. Re-sightings can be months to years apart. The lack of connectivity among islands is in apparent contradiction with the fact that half of the animals are observed only once in the study area of El Hierro (holding the largest database). We propose that beaked whales in the Canary Islands have offshore and slope-associated sub- populations, with unknown connectivity. The slope-associated part of the population has high spatial fidelity for the insular slope of given islands, albeit the whales perform offshore movements. The offshore part of the population performs occasional visits to the slope of the islands.
Notes:

36
2014 Marine Mammal & Biology Program Review Sponsor: ONR Status: COMPLETED
Understanding the foraging ecology of beaked and short-finned pilot whales
PI: Whitlow W. L. Au1 CoPI: Jeffrey Drazen2
Graduate Research Assistant: Giacomo Giorli1,2
Graduate Research Assistant : Adrienne Copeland1
1Marine Mammal Research Program Hawaii Institute of Marine Biology
phone: (808) 247-5026 fax: (808) 247-5831 [email protected]
2 Department of Oceanography University of Hawaii
Award Number: N000141210205
Background Spinner dolphin foraging research suggests that the prey field properties and dynamics are the major factors affecting dolphins life and natural history. Other research using Dtag strongly suggests that beaked and short-finned pilot whales forage on squids that are within layers, albeit, at much deeper depths than for most dolphins. Stomach content analyses indicate that beaked whales feed mainly on squid, but also on a variety of demersal and mesopelagic fishes. To understand the distribution of beaked and short-finned pilot whales it is important to analyze the distribution of their specific prey. Squid distribution is most likely influenced by the organisms they prey on, which can vary from microneckton to larger fish. A complete analysis of the biomass in the water column is important to have a full understanding of this predator-prey relationship. We intent to start research on the predator-prey relationship of these odontocetes that foraging at deep depths (800 – 1200 m) using active and passive acoustics augmented by video imaging and appropriate oceanographic instruments. Objectives The overall goal of our research is to understand beaked whale foraging and to learn how to alleviate acoustic encounters between Navy assets and beaked whales and other deep diving odontocetes. Under- standing of the characteristics and dynamics of the prey field is critical in understanding the foraging behavior and life cycle of beaked whales and other deep diving odontocetes.
The specific objectives needed to meet our overall goal are as follows: 1. estimate the three-dimensional spatial extent of potential prey field 2. collect synoptic data of beaked and short-finned pilot whale foraging on the prey field 3. determine the taxa composition of the prey field 4. estimate the size and density of the micronekton in the prey field 5. relate volume scattering coefficient with the density of micronekton in the prey field 6. correlate relevant oceanographic parameters with the presence of the prey field Method We used three main techniques and tools to determine the distribution and abundance of the prey field of beaked whales and other deep diving odontocetes, to understand the relationship of deep diving odontocetes and the prey field and to understand how the marine mammals interact with the prey field. The three tools used in this study and the manner in which they are used and the type of data they collect are enumerated below. 1. The first set of tools are three ecological acoustic recorders (EARs) which are PAM devices (operating at 80 kHz sample rate) that were deployed in the study area at depths of approximately 800-950 m. The EAR data will provide a good indication of the diurnal foraging pattern in each area and also indicate which of these areas beaked whales tend to frequent the most. 2. The 38 and 70 kHz versions of the Simrad EK-60 scientific echosounder will provide across slope and along slope examination of the prey

37
field. The acoustic volume scattering along the survey tracks will be determined when foraging whales are present and when they are absent.The active acoustic survey will be performed in water depths between 700 and 1500 m. Isobaths in the Kona coast of the Big Island tend to follow the shape of the shore line. 3. The third tool will be a specially fabricated profiler to investigate the composition, density and the characteristics of the micronekton in the deep layers that beaked whales forage on. The key instrument of the profiler will be the DIDSON high resolution imaging sonar and a low-light video camera system. From the DIDSON images, the size and density of micronektons can be determined. The DIDSON is rated to 1,000 m depth and can be powered by batteries on the profiler with the output (images) fed directly to a digital video recorder which will store the images on a laptop disk. A low-light Remote Ocean Systems (ROS) Navigator camera will be integrated on to the profiler system with illumination provided by a dual array of red LED.
Results Three EARs were deployed along the length of the Kona coast, one in the north, one in the central and one in south. The results suggest beaked whales foraged mainly at night at the north and south locations but mainly during the day at the central location. The EAR at the central location also detected the most beaked whale biosonar signals. Pilot whales foraged mainly at night in all three locations whereas sperm whales did not display any strong preference for foraging at night or day. The active acoustic survey indicate that There is a scattering layer at an approximate depth of 500 – 600 m. The layer migrates towards the surface at night but a diffuse layer is always present at the deepest depth. The total biomass in the water column is higher when whales are foraging than when they are not foraging. The average length and density of micro- nekton at three difference depth regime were measured by the DIDSON. An encounter with a 3-m squid at a depth of about 550 m will also be discussed.
Notes:

38
2014 Marine Mammal & Biology Program Review Sponsor: ONR Status: ONGOING
Modeling of habitat and foraging behavior of beaked whales in the Southern
California Bight
Simone Baumann-Pickering, John A. Hildebrand, Jeffrey E. Moore, Tina M. Yack University of California San Diego, Scripps Institution of Oceanography
[email protected], (858) 534-7280
Background We define occurrence patterns for multiple beaked whale species and develop a habitat model for Cuvier’s beaked whales in the Southern California Bight using passive acoustic encounters. Data from line-transect surveys and autonomous acoustic recorders are modeled using dynamic and static oceanographic habitat variables. We aim to compare habitat models from acoustic line-transect data with those from autonomous acoustic recorder encounters. We intend to identify the foraging behavior of beaked whales with respect to spatio-temporal occurrence on a diel or seasonal basis and in relation to static and/or dynamic oceanographic variables. Knowledge about foraging and habitat preference and potential shifts in occurrence due to seasonal or oceanographic factors are crucial for conservation and management, as well as mitigation of potential effects of Naval activities. Objectives The objective of this project is to improve our understanding of beaked whale distribution and habitat preferences and to describe inter-specific variability. Previous experience shows that modeling habitat preferences of poorly known species, such as beaked whales, can lead to better understanding of their foraging behavior. Methods High-Frequency Acoustic Recording Packages (HARPs) have collected acoustic data at 17 sites within the Southern California Bight (SCB) between 2006 and 2013. An automated multi-step beaked whale detector was run on the dataset. All echolocation signals were identified using an automated click detector. Spectral and temporal click parameters were calculated. An expert system classified 75 s of data containing at least 7 click detections as having beaked whale frequency modulated (FM) pulses given these conditions: 1) signals had a peak and center frequency above 32 and 25 kHz,
respectively, a duration of more than 355 μs, and a sweep rate of more than 23 kHz/ms; 2) if more than 13% of all initially detected echolocation signals over 75 s remained after applying these criteria, the segment was classified to have beaked whale FM pulses. This method detected all North Pacific FM pulse types with approximately 5% missed rate, except Baird’s beaked whales (partial), and Longman’s beaked whales. A third classification step, based on computer assisted manual decisions by trained analysts, labeled the automatically detected segments to pulse type level and rejected false detections. Results Monitored in nearly 28 cumulative years of acoustic records, Cuvier’s beaked whales had 72 cumulative days of detection, and were the most frequently detected beaked whale (99.6% of all beaked whale encounters; Baird’s beaked whale not accounted for). The BW43 signal type, possibly produced by Perrin’s beaked whale, occurred for 0.3 cumulative days. The relative presence of these two signal types across all recording sites differed substantially with Cuvier’s beaked whales occurring more towards the offshore and southern portion of the study area whereas the BW43 signal type was detected more in the central to southern basins (Figure 1). Few detections were made of Stejneger’s beaked whales (16 minutes) and BW70 signal type (possibly Pygmy beaked whale, 7 minutes). There appears to be a seasonal component to the presence of Cuvier’s beaked whales in the SCB with lower detection rates from July through September across all monitored sites (Figure 2). Analysis of the SCB towed array data resulted in a total of 23 Cuvier’s beaked whale encounters, 4 Baird’s beaked whale encounters, and 3 unidentified Mesoplodon encounters over the 4,875 km of trackline surveyed during the four survey years (Figure 3).
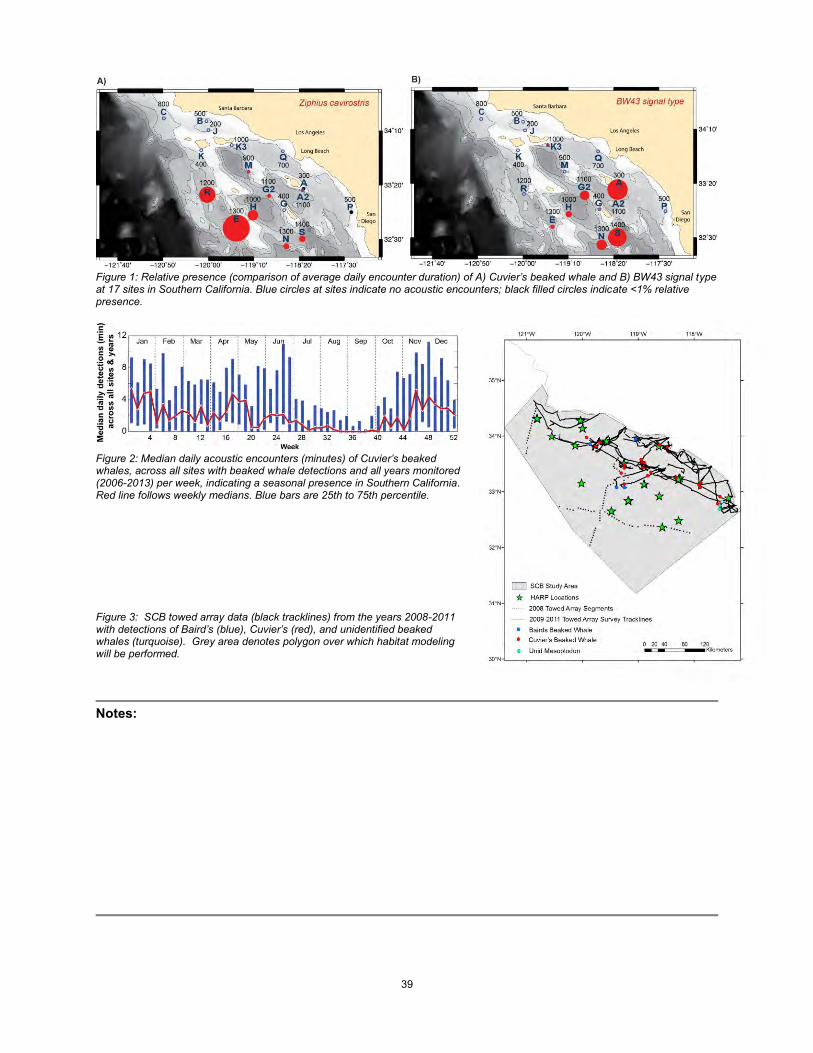
39
Figure 1: Relative presence (comparison of average daily encounter duration) of A) Cuvier’s beaked whale and B) BW43 signal type at 17 sites in Southern California. Blue circles at sites indicate no acoustic encounters; black filled circles indicate <1% relative presence.
Figure 2: Median daily acoustic encounters (minutes) of Cuvier’s beaked whales, across all sites with beaked whale detections and all years monitored (2006-2013) per week, indicating a seasonal presence in Southern California. Red line follows weekly medians. Blue bars are 25th to 75th percentile. Figure 3: SCB towed array data (black tracklines) from the years 2008-2011 with detections of Baird’s (blue), Cuvier’s (red), and unidentified beaked whales (turquoise). Grey area denotes polygon over which habitat modeling will be performed.
Notes:

40
2014 Marine Mammal & Biology Program Review Sponsor: ONR Status: COMPLETED
Acoustic Behavior, Baseline Ecology and Habitat Use of
Pelagic Odontocete Species of Concern
T. Aran Mooney1, Peter L. Tyack, Robin W. Baird, Paul E. Nachtigall 1Woods Hole Oceanographic Institution [email protected], (508) 289-3714
Background Although false killer whales (Pseudorca crassidens) and melon-headed whales (Peponocephala electra) are found in tropical and sub-tropical waters across the globe, surprisingly little is known about their baseline acoustic behavior. This is likely due to their generally deeper, and often far-ranging pelagic habitat which can be difficult to study. In Hawaii, the habitats of these animals can significantly overlap with regions that are extensively used for U.S. Naval training operations. Scientific significance: This proposal will improve our understanding of the acoustics, dive behavior and habitat use of two focal odontocetes species with significant anthropogenic interactions: the insular Hawaiian false killer whale (FKW), recently listed as endangered, and the melon-headed whale (MHW), a species recently involved in a near mass-stranding event after naval activities. Few acoustic or behavioral data exists for either species in the wild. These results provide vital baseline information on the vocalization characteristics and use of sound by both species. These acoustic behavior data will provide novel biological information for pelagic odontocetes with implications for monitoring and acoustic detection. Naval significance: This research will provide necessary baseline sound-use and dive behavior data on two cetacean species of concern which occupy waters frequently used in U.S. Naval training operations. Information can be applied to future acoustic detection models, predicting areas of cetacean occurrence, means of mitigating potential sonar-induced impacts, and assessing future effects. Objectives The goal is to establish the baseline acoustics, behavior and ecology of these species to predict and mitigate potential human impacts. Information gained will provide a context for evaluating natural behavioral ecology and potential responses to anthropogenic sounds. The objectives were collect detailed, non-invasive, bioacoustic behavior measurements and: 1) Quantitatively examine the acoustic signals of Hawaiian insular false killer whales (FKWs) and melon-headed whales (MHWs). 2) Determine baseline acoustic behavior, basic activities, detailed dive patterns and fine-scale habitat use for both species. 3) Pair data on the acoustic characteristics of calls with behavioral ecology information to evaluate the potential for species classification, passive acoustic detection, and density.
Methods Data were collected with non-invasive, suction cup tags (DTAG3) attached to individual FKWs, MHWs, and other species as opportunities allowed. Additional acoustic records were obtained using two novel devices which incorporated the WHOI DMON. They were: a DMON-Drifter and a DMON-Digital Acoustic Waterproof Gizmo (DAWG). Tag records were visually and aurally inspected all calls were individually extracted using custom Matlab scripts. LIMPET satellite tags were also deployed on both FKWs and MHWs to track movements and record diving behavior. Results During this project we logged more than 13,000 km over 105 boat days at sea, substantially increasing effort from 42 days proposed. We had 343 sightings of 13 species of cetaceans (nine of which we obtained acoustic records), and averaged 3.4 sightings per day. Twenty-three DTAGs were deployed; 11 on the target species including one on a FKW and 10 on MHWs, for a total of 8 hrs and 27 min of recordings (5 hrs from MHW and 3 from FKW) across 9 MHW sightings and 1 FKW sighting. Towards the end of each field seasons, if MHWs and FKWs were infrequently sighted, we also obtained bioacoustic behavior data from other odontocete species of concern including six DTAG deployments on short-finned pilot whales and six on pantropical spotted dolphins, providing an overall Dtag recording total of 31.5 hrs. We also leveraged acoustic recording time with odontocete species using the novel DMON tools, adding >8 hrs to the acoustic data set of our focal species and nearly 32 hrs (essentially doubling) to the overall acoustic recording totals. During the field efforts LIMPET satellite tags were deployed on one FKW, five MHWs, as well as three Blainville’s beaked whales, one Cuvier’s beaked whale, and four sperm whales. A primary challenge in working with FKWs and MHWs is that their low densities make them difficult to find. DTAGging additional species of interest substantially increased the data set and consequently we collected at least two additional robust data sets from: pantropical spotted dolphins and short-finned pilot whales. Five of the spotted dolphin tags were on their respective focal animal for multiple hrs, thus collecting novel baseline behavioral data for these populations. These attachments to small, pelagic delphinids suggests we can efficiently address the behavior of

41
species for which basic biological information is often lacking. Due to large group sizes these species also comprise large portions of Navy marine mammal takes. For the MHWs, 36 call categories emerged. Calls were categorized by untrained observers and the acoustical characterized (Fig. 1). They differed significantly in duration, peak and centroid frequency, and -3 dB bandwidth. Calls of a given type were more likely to follow each other than expected. These data suggest that repeated calls may function in individual, subgroup, or group recognition. Repeated call production could also serve to enhance signal detection in large groups with many individuals producing simultaneous calls. Results suggest that caution should be used in developing automatic classification algorithms for this species based on small sample sizes, as they may be dominated by repeated calls from a few individuals, and thus not representative of species- or population-specific acoustic parameters. While there was only a single sighting of FKWs during the effort, one FKW was DTAGged and another in the group was satellite tagged, providing substantial data from this group. Locations were obtained from the satellite tagged individual (HIPc155, aka PcTag033) over a span of 199 days, the longest attachment duration on a FKW. This individual was from social cluster 3 (Baird et al. 2012), only the sixth satellite-tagged individual from this cluster. Habitat use patterns were generally similar to previous Cluster 3 individuals, although HIPc155 did spent more time off the west side of Hawai‘i Island than other individuals from Cluster 3. The DTAG results suggest that during the tag-attachment period the animal was exhibiting two very different behavioral states. The first 100 min encompassed a period of “social foraging” (visually and acoustically observed). The second portion of the tagging period involved directed travel into rough seas. During the first 100 min, dives were to a mean depth of 17.8 m (mean); during the second period there 3x fewer dives, and dives were shallower. The social foraging period also evidenced by 16x more whistles/min. Our laboratory tests with a trained false killer whale suggests these calls can be shaded
across the head and body likely improving directional orientation and group cohesion. Frequent ‘bi-phonation’ (simultaneous whistle-clicks) was observed on the tag, 71% of the time (compared to whistles alone). These results suggest that FKW passive acoustic detection may be highly dependent upon behavioral states.
ACharacterization
Time (s)
Freq
uen
cy (
kHz)
Two Call CategoriesB
Figure 1. (A) Spectrogram and power spectral
density estimate (right) of three characteristic
calls from three of the DTAGged MHWs.
Vertical black lines denote the 95% energy
duration of the call. (B) Two groups of call
spectrograms with three exemplars each and
the total number of calls in that category.
Notes:

42
2014 Marine Mammal & Biology Program Review Sponsor: ONR Status: ONGOING
Behavioral ecology of narwhals in a changing Arctic
Kristin Laidre, Marianne Rasmussen, Harry Stern, Jens Koblitz, Mads Peter Heide-Jørgensen, Mikkel
Villum Jensen, Richard McGovern Polar Science Center, Applied Physics Laboratory, University of Washington,
1013 NE 40th St. Seattle, WA 98105 USA [email protected], phone: 206-616-9030
Background This study provides the first baseline data on acoustic foraging ecology of narwhals (Monodon monoceros) in the offshore pack ice of Greenland, an area being altered by increases in shipping, seismic exploration, and sea ice loss. We anticipate our results will be of broad interest to managers for predicting impacts of anthropogenic activities on this species. We utilize a combination of new data collected from field studies with a long-term historical archive combined with remotely-sensed imagery to provide new information on narwhal ecology in a changing Arctic. Objectives Our primary objectives are to understand baseline narwhal behavioral ecology in the pack ice of Baffin Bay. We collect data on the species’ acoustic, movement, and diving ecology in the offshore pack ice of Baffin Bay over a 4 year long research program with three ecological focus areas (acoustic ecology, sea ice ecology, and foraging ecology). Our longitudinal and cross-population analyses use a suite of ecological modeling approaches over a >2 decade period that encompass a period of sea ice decline and increased anthropogenic activities in West Greenland (1993-present). Our detailed objectives are to answer the following science questions: 1. Acoustic ecology: What are baseline characteristics of the acoustic repertoire of narwhals in the offshore Baffin Bay pack ice (depth-specific high frequency calls, echolocation clicks, and buzzes during foraging dives)? How might acoustic communication and foraging ecology be impacted by increasing anthropogenic activities in Baffin Bay (increasing shipping, future transit through the NW Passage, seismic exploration, increasing tourism)? 2. Sea ice habitat selection: How are narwhals’ movements in Baffin Bay related to sea ice concentration, distance to the sea ice edge, location and velocity of outlet glaciers, and the
timing of sea ice break-up (as measured by the date when sea ice concentration drops below 50% concentration)? How have these relationships changed over the past two decades of sea ice loss? Are there population-level differences in sea ice habitat selection? 3. Foraging ecology and predation: What is the interannual variability of narwhal winter home ranges and what is the overlap with high densities of Greenland halibut? What are the spatial and temporal trends in the occurrence of killer whales in West Greenland? Given the loss of annual sea ice and purported increase in killer whales in the Canadian Arctic, do killer whale catch and observation data from West Greenland follow this trend and have narwhals been exposed to increasing risk of predation? Methods We designed and built an acoustic recording station deployed at leads in the pack ice within high-density offshore narwhal wintering grounds. This station records depth-specific high frequency calls, echolocation clicks, and buzzes of narwhals. We took two approaches to collecting acoustic data from narwhals. First, we deployed a 15Hz-480kHz Reson hydrophone with pre-amplifier and recording using a National Instruments sound card with a sample rate of 500 kHz. Second, we utilized a custom made 16 channel vertical array (with a laptop and pre-amplifier inside an insulated heated aluminum box) as a stand-alone system recording between the surface and 25 m. This provides the foundation to quantify details in narwhal echolocation behavior. We conducted the field work for this project in the pack ice in 2012 and 2013 in Greenland. All personnel and equipment were deployed and retrieved from the ice using an AS350 helicopter with strategically placed fuel depots. The helicopter allowed for spotting groups of narwhals and flexibility landing on the sea ice to collect data. Additionally, we are using an extensive data analysis of over 18 years of satellite tracking and

43
dive data (1993-2010) from five different narwhal subpopulations to look at movements and sea ice associations. The satellite tracking database includes tracking data from n=79 individual narwhals tagged in Melville Bay (West Greenland), Somerset Island (Canada), Eclipse Sound (Canada), and Admiralty Inlet (Canada), and Uummannaq (West Greenland). We are using the satellite tracking data to identify individual trajectories, focal areas, and population-level home ranges. We examine speed, dispersal, and movements under different ice regimes and quantify fine scale winter habitat selection/sea ice characteristics within focal areas by extracting a suite of habitat variables and remotely-sensed data on sea ice conditions. Our primary data source for sea ice satellite passive microwave data is from SMMR and SSM/I (1979-present) (25-km pixel size). AMSR-E data are used to compute specific parameters in the post-2002 period at a higher resolution (6.25 km pixel size). Results Our first published results from this project documented shifts in the timing of narwhal migration in all 5 summering areas relative to later autumn sea ice freeze-up dates (Laidre et al. 2012). In 2013, we submitted two papers for review. The first paper reports high frequency broad-band clicks recorded from narwhals in the pack ice in April 2012 and 2013. The energy in the high frequency narwhal clicks extended up to 200 kHz. Buzzes with click rates up to 300 clicks /sec were also recorded, however no whistles were obtained. This is the first time the whole bandwidth of narwhal echolocation clicks has reported, and the first case where buzzes have been recorded from narwhals at their wintering ground. The second paper analyses the movements of narwhals tagged with satellite transmitters from Admiralty Inlet, Canada over four winters. We compare interannual migration routes and winter ranges across years with
contrasting sea ice conditions and find a high degree of inter-individual variability in the date whales depart from the summering areas. Wintering areas range from 33,000 to >120,000 km2. No significant differences in mean latitude during the winter period were found, however median winter velocity (km/day) was significantly different across years (p=0.002), with the lowest velocity for the years whales remained in Baffin Bay and the highest velocities in years whales also used Davis Strait. Narwhals ranged most widely and had the highest winter velocities in years with the most dense sea ice cover, suggesting heavy ice years requires whales to conduct compensatory movements to keep up with moving leads and cracks. On the contrary, low sea ice cover on the wintering grounds resulted in whales remaining stationary over their preferred foraging ground for longer periods and lower daily velocities without requiring large movements. Current work for this project this upcoming year includes further analyses of narwhal echolocation behaviour using data from the 16 channel vertical hydrophone array. This includes 1) determining narwhal swim speed and ascent rates, 2) measuring the intensity (source level) of narwhal echolocation clicks, 3) measuring the width of narwhal echolocation beam and hence the volume of water body covered with every click, and 4) investigating the scanning behavior (i.e. changes of the acoustic gaze while ascending to the surface in order to breathe). In addition, we are in the process of completing an analysis of outlet glacier habitat selection. We use a state-space model to develop proximity matrices for narwhals at glacial fronts in West Greenland at a range of distances (3-10 km). We are modeling the occurrence of narwhals as a function of glacier covariates, including glacier velocity, direction (retreat or advance), sediment outflow, and bathymetry in front of the glacial moraine.
Notes:

44
2014 Marine Mammal & Biology Program Review Sponsor: ONR Status: ONGOING
Blue and fin whale habitat modeling from long-term year-round passive acoustic
data from the Southern California Bight
Ana Širović and John A. Hildebrand Scripps Institution of Oceanography, University of California San Diego
email: [email protected] phone: (858) 534-8036 email: [email protected] phone: (858) 534-4069
Background Understanding patterns and causes of variability in cetacean distributions over space and is of interest to the scientific community and the Navy. In this project, data collected in the Southern California Bight (SCB) between 32° and 34° 20’ N from 2006–2012 is used to enhance our knowledge of year-round blue (Balaenoptera musculus) and fin whale (B. physalus) habitat use in this region. Passive acoustic data have been collected using High-frequency Acoustic Recording Packages (HARPs) deployed at 16 locations in the SCB. Blue and fin whales produce a variety of calls in this area. The calls of primary interest in this work include Northeast Pacific blue whale B calls that last approximately 15-20 s each and can be produced in regular sequences or as singular, generally co-occurring calls, and fin whale 20 Hz downswept pulses that are also produced in regular sequences or irregularly and during call-countercall bouts. We investigate the effects of environmental, remotely sensed variables such as sea surface temperature or chlorophyll a concentration, as well as temporal variables, such as month, season, and year on the distribution of these two whale species. Such temporal variables are rarely included into models based exclusively on visual survey data thus our models are likely to offer new insights on the importance of these time scales on blue and fin whale habitat preferences. Objectives The primary objective of this research is to develop predictive, year-round habitat models of the presence of calling blue and fin whales in the SCB. The models are primarily based on available passive acoustic and remotely sensed environmental data for the SCB. Methods
Predictive, year-round habitat models of the presence of calling blue and fin whales were developed using a generalized additive modeling (GAM) framework. The response variables were based on the passive acoustic data collected using High-frequency Acoustic Recording Packages (HARPs) deployed at 16 locations in the SCB between 2006 and 2012. Blue and fin whale calls were automatically detected using spectrogram correlation and acoustic energy detection methods, respectively. Acoustic propagation modeling was used for estimating propagation areas at each recording site. Remotely sensed environmental variables included in the models were sea surface temperature, sea surface height, chlorophyll a concentration, and primary productivity. Average 8-day values for each variable were extracted over the acoustic detection area at each site. Additionally, temporal variables such as month, season, and year were incorporated into the models. Separate GAMs are being developed for each species and a variety of temporal and spatial scales. The goal is to develop a set of year-round habitat models for calling blue and fin whales in the SCB and test predictive abilities of these models across space and time. Results Over 3 million blue whale calls were detected at 16 sites during 9404 days (nearly 26 cumulative years) of effort, although some calls may have been detected on more than one instrument. Blue whale B calls were generally detected between June and January, with a peak in September (Fig. 1a black bars). Across the years, there was some variability in detection numbers, with a slight peak in 2007 and 2008, and a minimum in 2011 (Fig. 1b), and with a slight overall negative trend (change of -1.6 daily calls per 1000 km2 per year). Fin whale acoustic index, indicative of the 20 Hz calls, was highest between September and December, with a peak in November (Fig. 1a red line). There was a secondary, smaller peak in fin whale acoustic index in March. Across the years of this study,

45
there appears to be an overall increase in fin whale acoustic index at a rate of 1.3 daily per year (Fig. 1b).
Fig. 1. Overall (A) monthly seasonal and (B) yearly interannual blue whale B call daily detections normalized by detection area (black bars) and daily fin whale acoustic index normalized by detection area and TL (red line).
Generally, sites around the northern Channel Islands, particularly to the north in the Santa Barbara Channel, had the highest call abundances during peak calling periods, but blue whale B calls were also common along coastal sites near Los Angeles and San Diego. There may be a preference for Channel Island sites earlier in the calling season, while later in the season call distribution is more even across the SCB. There was also a seasonal cycle in the fin whale acoustic index, coupled with a large amount of spatial variability across the SCB. Peak in the fin whale acoustic index occurred during fall, with a broad shoulder and a secondary peak in the winter and a minimum during June and July. Fin whale acoustic index was the highest farther offshore and farther south during peak calling periods than blue whale call detections, with highest levels in the basin just to the west of San Clemente Island. Overall, the developed GAMs were better at explaining the deviance in blue whale call detections than the fin whale acoustic index. Month and sea surface temperature were variables with the most predictive significance for blue whale B calls, while sea surface height, sea surface temperature, and at some locations year, were the most important variables for fin whale acoustic index predictive models.
Notes:

46
2014 Marine Mammal & Biology Program Review Sponsor: ONR Status: ONGOING
Environmental influences on diel calling behavior in baleen whales
Mark F. Baumgartner
Woods Hole Oceanographic Institution [email protected], 508-289-2678
Background Baleen whales rely on acoustic communication to maintain contact with conspecifics for the purposes of social interactions, breeding, and possibly coordinated feeding activities. Passive acoustic monitoring takes advantage of this communication to detect whale presence. Unlike odontocetes that use echolocation to forage, calling in baleen whales is by no means obligatory; therefore, the absence of call detections does not always imply an absence of whales. To effectively apply passive acoustic monitoring to research and mitigation problems, we require a much better understanding of the social and environmental factors that influence variability in the calling behavior of baleen whales. One of the most prevalent observations in passive acoustic recordings over scales of days to months is diel calling behavior. Increased calling activity during particular times of the day is frequently hypothesized to be caused by diel vertical migration of prey, but few studies have directly studied this relationship because it is difficult to continuously observe acoustic behavior and environmental conditions (e.g., prey migration) in areas occupied by whales over time scales of days to weeks. Autonomous vehicles, particularly ocean gliders, have the ability to profile the water column on station for durations ranging from days to weeks to characterize both baleen whale calling behavior and prey vertical migration. Gliders equipped with instrumentation to monitor whale presence in real time are also capable of surveying for whales and stopping when aggregations are found. We have implemented an automated low-frequency detection and classification system (LFDCS) for baleen whale calls on glider-installed DMON instruments to allow known calls (e.g., right whale upcall, fin whale 20-Hz pulses) to be detected, tallied, and transmitted to a shore-based computer via Iridium satellite in near real-time. With this capability, gliders can be deployed in areas that are difficult to access with ships (e.g., remote regions or challenging seasons), find whales, and study the environmental factors that
influence variability in the whales’ calling behavior over time scales of days to weeks. Objectives Our objective is to investigate the relationship between prey behavior and baleen whale calling behavior in a poorly studied environment: the central Gulf of Maine during late fall and early winter. We hypothesize that diel calling patterns are established, in part, by the diel availability of prey: when prey is strongly aggregated during the day at depth, calling activity is reduced while the whales feed. Conversely, during periods of active vertical migration by prey or when prey is diffusely distributed, the whales cannot profitably forage, and therefore increase calling activity and social interactions in lieu of feeding. To address this hypothesis, we (1) deployed ocean gliders to locate whales and simultaneously observe prey migration behavior and whale acoustic activity, and (2) conducted shipboard zooplankton sampling in the region to identify available prey, including both migrating and non-migrating species. Methods We deployed two gliders on November 12, 2012 in the northern Gulf of Maine, and the gliders remained in an area known as the Outer Fall for 3 weeks. Each glider was equipped with sensors to measure temperature, salinity, chlorophyll fluorescence, and optical backscatter, and one of the gliders carried a 1 MHz acoustic Doppler current profiler to measure acoustic backscatter. Additionally, each glider was equipped with a DMON/LFDCS to passively record baleen whale calls and to process the acoustic data in real-time to detect, classify, and report whale calls to a shore-based computer system via Iridium satellite. One of the gliders was deployed in station-keeping mode to examine temporal variability in calling behavior and environmental properties, while the second glider was used to do an acoustic survey inside our 40×60 km study area. The survey glider profiled continuously from the surface to just above the sea floor to collect full water column profiles of physical and biological

47
oceanographic properties (e.g., temperature, salinity, chlorophyll fluorescence). The station-keeping glider unfortunately developed a leak in the hull early in the study, and was restricted to profiling between the surface and 50 m depth. We also completed a 9-day cruise to the study area aboard the R/V Endeavor from November 29 to December 4, 2012 to conduct intensive environmental and prey sampling in proximity to the gliders. The glider survey was designed, in part, to locate whales in the region to facilitate sampling near whales from the R/V Endeavor. As expected for late autumn, periods of low winds and calm seas were infrequent and short, making traditional shipboard marine mammal observations difficult. However, the near real-time reporting capability of the gliders allowed us to locate whales within just a few hours of searching on our first day of decent weather. To our knowledge, this was the first use of real-time detection and reporting of marine mammal calls from autonomous underwater vehicles to adaptively plan shipboard research activities. Once on scene with whales, we collected depth-stratified zooplankton samples with a 1-m2 MOCNESS capable of catching zooplankton ranging in size from small copepods to large euphausiids. Sampling occurred during both day and night to assess diel changes in species-specific vertical distribution. We also profiled with an instrument package consisting of a conductivity-temperature-depth profiler, chlorophyll fluorometer, optical plankton counter (OPC), and video plankton recorder (VPR). The net, OPC, and VPR data are being used to examine prey behavior and to identify the dominant zooplankton species in the region. Results During the 3-week deployment, the two gliders reported over 25,000 acoustic detections attributed to fin, humpback, sei, and North Atlantic right whales. Real-time detections were evaluated after recovery of the gliders by (1)
comparing the acoustic detections to continuous archived audio recorded by the DMON, and (2) comparing species-specific detection locations with nearby sightings collected from both an aircraft and ship. The overall false detection rate for individual calls was 14%, and for right, humpback, and fin whales, false predictions of occurrence during 15-minute reporting periods were 5% or less. Transmitted pitch tracks allowed unambiguous identification of both humpback and fin whale song in near real time. In 10 cases when whales were sighted during concurrent aerial or shipboard surveys and a glider was nearby (within 20 km and ±12 hours), 9 of those sightings were accompanied by real-time acoustic detections of the same species by the glider. Acoustic detections in the Outer Fall were significantly reduced in 2012 when compared to acoustic detections of baleen whales obtained during a similar glider deployment in the Outer Fall during late fall 2009. Visual sightings from the NOAA NEFSC aerial surveys were also significantly lower in 2012 than in 2009 for right, fin, and sei whales. This change in occurrence was strongly linked to dramatic warming of the entire water column in 2012 compared to 2009, which in turn, likely had a strong affect on zooplankton and fish abundance. From our shipboard sampling in 2012, zooplankton abundance was quite low in the study area and well below what would be considered sufficient for feeding right whales. The reduced abundance of both prey and baleen whales in 2012 made study of the factors that influence diel patterns in calling behavior difficult. There was no observed diel vertical migration of late-stage C. finmarchicus, the primary prey of right whales, and there was little evidence of coherent vertical migration of euphausiids. Interestingly, right whales exhibited the same diel calling patterns in 2009 and 2012, suggesting that at least the abundance of prey had little influence on calling behavior.
Notes:

48
2014 Marine Mammal & Biology Program Review Sponsor: ONR Status: ONGOING
Predicting trophic interactions and habitat utilization in the California Current
ecosystem
J. Fiechter, L. Huckstadt, K. Rose, D. Costa, E. Curchitser, C. Edwards, A. Moore and K. Hedstrom. University of California at Santa Cruz, Institute of Marine Sciences
Email: [email protected]; Phone: (831) 459-1306
Background While specifically focusing on trophic interactions affecting habitat utilization and foraging patterns of California sea lions (CSL) in the California Current Large Marine Ecosystem (CCLME), the long-term goal of our modeling approach is to better understand and characterize biological “hotspots” (i.e., the aggregation of multiple marine organisms over multiple trophic levels) off the U.S. west coast and in other regions where similar fully-coupled ecosystem models may be implemented. As such, our research represents a major step towards a predictive model that can provide fundamental knowledge about: (1) the spatial and temporal distribution of key marine organisms over multiple trophic levels, and (2) natural and anthropogenic variability in ecosystem structure and trophic interactions. Objectives The main research objective is to quantify habitat utilization and trophic interactions in the CCLME by considering patterns of covariability between environmental variables (e.g., temperature, primary production) and foraging patterns and success of middle (sardine and anchovy) and higher (sea lions) trophic level organisms. To this end, our numerical experiments are designed to isolate patterns of variability on seasonal to interannual timescales during “normal” and “extreme” years by identifying shifts in habitat utilization (e.g., shelf vs. offshore foraging). As a corollary, we also seek to determine which environmental properties (e.g., onset and duration of upwelling season on the shelf, eddy variability) control foraging success in different sub-regions of the CCLME. Methods We use a fully-coupled ecosystem modeling framework consisting of a lower trophic level ecosystem model (NEMURO) embedded in a regional ocean circulation model (ROMS), and both coupled with a multi-species individual-based model (IBM) for forage fish and higher
trophic level species. The IBM for forage fish focuses on two coastal pelagic species (sardine and anchovy), with growth based on bioenergetics, temperature and prey generated from the ROMS and NEMURO models. The IBM for higher trophic level predatory species focuses on bioenergetics and behavior of CSL in the CCLME, and incorporates available information on their foraging patterns and diet from tracking data. The numerical experiments with the fully-coupled ecosystem model are designed to identify patterns of trophic interactions and habitat utilization on various timescales, including periods of extreme variability such as El Niño or La Niña events. Results a) Baseline simulation. We used a 50-year (1959-2008) simulation of the fully coupled end-to-end ecosystem model to investigate how environmental processes control sardine and anchovy population dynamics in the CCLME. Simulated abundances indicate anchovy peaking during the early 1970’s and the 1980’s, while sardine remained relatively low until steadily increasing from the mid 1990’s to the end of the model run. The low frequency variability in simulated adult biomass for each species compares favorably with historical observations, especially in their ability to reproduce the overall increase (decrease) of sardine (anchovy) population abundance starting in the early 1990’s. Simulated adult population fluctuations are associated with prey availability for anchovy via growth and egg production, while they depend primarily on temperature for sardine via egg survival. The analysis also hints at potential linkages to known modes of climate variability (PDO and ENSO), which is consistent with modes of interannual and decadal variability that would alternatively favor anchovy during years of cooler temperatures and higher prey availability, and sardine during years of warmer temperatures and lower prey availability.
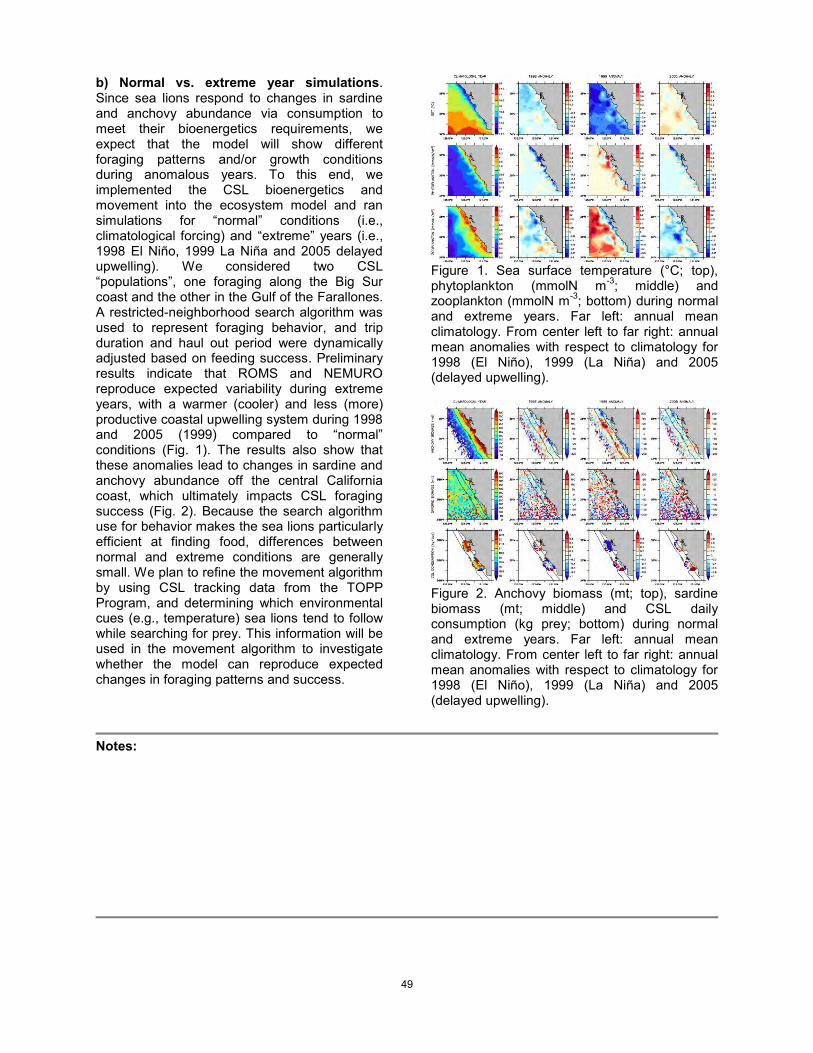
49
b) Normal vs. extreme year simulations. Since sea lions respond to changes in sardine and anchovy abundance via consumption to meet their bioenergetics requirements, we expect that the model will show different foraging patterns and/or growth conditions during anomalous years. To this end, we implemented the CSL bioenergetics and movement into the ecosystem model and ran simulations for “normal” conditions (i.e., climatological forcing) and “extreme” years (i.e., 1998 El Niño, 1999 La Niña and 2005 delayed upwelling). We considered two CSL “populations”, one foraging along the Big Sur coast and the other in the Gulf of the Farallones. A restricted-neighborhood search algorithm was used to represent foraging behavior, and trip duration and haul out period were dynamically adjusted based on feeding success. Preliminary results indicate that ROMS and NEMURO reproduce expected variability during extreme years, with a warmer (cooler) and less (more) productive coastal upwelling system during 1998 and 2005 (1999) compared to “normal” conditions (Fig. 1). The results also show that these anomalies lead to changes in sardine and anchovy abundance off the central California coast, which ultimately impacts CSL foraging success (Fig. 2). Because the search algorithm use for behavior makes the sea lions particularly efficient at finding food, differences between normal and extreme conditions are generally small. We plan to refine the movement algorithm by using CSL tracking data from the TOPP Program, and determining which environmental cues (e.g., temperature) sea lions tend to follow while searching for prey. This information will be used in the movement algorithm to investigate whether the model can reproduce expected changes in foraging patterns and success.
Figure 1. Sea surface temperature (°C; top), phytoplankton (mmolN m-3; middle) and zooplankton (mmolN m-3; bottom) during normal and extreme years. Far left: annual mean climatology. From center left to far right: annual mean anomalies with respect to climatology for 1998 (El Niño), 1999 (La Niña) and 2005 (delayed upwelling).
Figure 2. Anchovy biomass (mt; top), sardine biomass (mt; middle) and CSL daily consumption (kg prey; bottom) during normal and extreme years. Far left: annual mean climatology. From center left to far right: annual mean anomalies with respect to climatology for 1998 (El Niño), 1999 (La Niña) and 2005 (delayed upwelling).
Notes:

50
2014 Marine Mammal & Biology Program Review Sponsor: ONR Status: COMPLETED
GENEGIS: COMPUTATIONAL TOOLS FOR SPATIAL ANALYSES OF DNA
PROFILES WITH ASSOCIATED PHOTO-IDENTIFICATION AND TELEMETRY RECORDS OF MARINE MAMMALS
C. Scott Baker
Marine Mammal Institute, Oregon State University email: [email protected], phone: 541-867-0255
Background A growing number of large-scale studies of marine mammals and other marine megafauna (e.g., sharks, and turtles) are collecting spatially explicit records linked through individual identification to genetic samples, photo-identification and telemetry. These spatio-temporal records have been used to track the migration and life history parameters of individuals, to estimate the abundance and trends of populations and, in the case of genetic markers, to infer close kinship (e.g., parent/offspring relationships) and define management units, or Distinct Population Segments. To date, however, there has been a conspicuous absence of computational tools for integration and spatial exploration of these individual records, particularly the potential for linking photo-identification to genetic information (e.g., DNA profiles) and for extending genetic identity to include close kinship. To address this emerging need, we have developed geneGIS. Tools implemented in geneGIS provide the ability to browse, filter and summarize spatially selected subset of photo-identification records and DNA profiles (e.g., allele or haplotype frequencies, total number of identification photographs or genetic samples) and map the spatial or temporal relationship of individual-based records (e.g., multiple locations from matching genotypes and photographs or telemetry tracks). The system provides options to export spatially selected data subsets in most standard formats (e.g. XLS, CSV, MDB, KML), as well as to specialized programs for statistical analyses of genetic diversity and differentiation (e.g., Genepop), capture-recapture estimates of abundance (e.g., Mark), population assignment of individuals and estimates of kinship or parentage (e.g., GenAlEx). The computational enhancements of geneGIS will contribute to community standards for inter-operability and accessibility of other spatially explicit records linked to individuals, e.g., biopsy-based ecological markers, acoustic recordings and data loggers. The software architecture is compatible with the widely adopted Arc Marine Data Model, allowing integration with other datasets and tools needed for marine ecosystem research (e.g., OBIS) and public outreach, including converting geneGIS data layers to KML format (now an international OGC standard) for use with Google Earth. Objectives
• Task 1: Develop database architecture following the Arc Marine data model for integration and display of DNA profiles with photo-identification and telemetry records in a stand-alone ArcGIS framework, and enhanced features of a web-based application (now referred to as Wildbook) initially designed for display and exploration of photo-identification catalogues. • Task 2: Develop ArcGIS tools for data query, visual exploration and basic statistical summaries for spatial and temporal partitions of individual-based records (DNA profiles, photo-identification records and telemetry tracks). • Task 3: Enhance user-directed spatial/temporal selection and export of individual-based records for advanced statistical analyses. This includes tools to export data compatible with existing software used for genetic analyses and capture-mark-recapture. • Task 4: Demonstrate functionality of geneGIS and web-based application through importation and integration of existing large-scale datasets of photo-identification records from the Structure of Populations, Levels of Abundance and Status of Humpbacks program in the North Pacific (SPLASH) and associated DNA profiles from biopsy samples (geneSPLASH). • Task 5: Prepare a comprehensive user guide(s) for all software functions and analyses implemented in the system. Methods and Results The computational developments followed two approaches: 1) tools and software enhancements within a web-based application for displaying individual identification photographs and information from linked DNA profiles, referred to as geneGIS in Wildbook (Fig. 1); and 2) tools within ArcGIS, the most powerful widely-used software for GIS and advanced spatial analysis, referred to as geneGIS in ArcGIS (Fig. 2). The resulted benefited from the strengths of each approach while assuring compatibility and interoperability through a common database architecture and simplified import/export functions. The web-based approach was developed under subcontract to Jason Holmberg of Wildbook (formerly the Shepherd Project), with the support of John Calambokidis and Erin Falcone of Cascadia Research Collective. This approach takes advantage of an existing open-source software framework supporting capture-mark-recapture (CMR) studies of marine

51
megafauna by the Shepherd Project (Holmberg et al. 2008). This software framework provides a scalable, web-based platform for CMR data management and was selected by Cascadia Research Collective to develop and host the SPLASH photo-identification catalog (on-line catalog created with the support of Pacific Life Foundation. With support from the geneGIS initiative, the software framework of Wildbook was modified to include DNA profiles, providing a computational environment suitable for integrated studies of molecular ecology and CMR. The ArcGIS approach was directed by the PI through Oregon State University (OSU), with support from Professor Dawn Wright (currently Esri Chief Scientist and adjunct professor at Oregon State University), Dori Dick, PhD candidate at OSU, Shaun Walbridge, Esri, Ocean GIS Engineer, and members of the Marine Mammal Institute (MMI), including Tomas Follett and Debbie Steel. This approach took advantage of previous experience with management of a whale telemetry database under the Arc Marine data model (Lord-Castillo et al. 2009; Wright et al. 2007). With support from the geneGIS initiative, we developed tools to import and visualize spatial distributions and selection of individual identification records, as well as raster-based data extraction from environmental layers available in the ArcGIS environment.
Figure 1. A conceptual framework illustrating how encounter records of identified individuals and associated genetic data (e.g., DNA profiles) are integrated through geneGIS developments of the web-based software application, Wildbook (http://www.wildme.org/wildbook/).
Figure 2. A conceptual framework illustrating how data for individual whales with associated DNA profiles, can be integrated with spatio-temporal and environmental variables for studies of habitat use, population structure and seascape genetics using the geneGIS toolbox in ArcGIS (http://genegis.org/, Dick et al. 2014).
Notes: Baker, C.S., D. Steel, J. Calambokidis, E.A. Falcone, U. Gozález-Peral, J. Barlow, A.M. Burdin, P.J. Clapham, J.K.B. Ford, C.M. Gabriele, U. Gozález-Peral, D. Mattila, L. Rojas-Bracho, J.M. Straley, B.L. Taylor, J. Urbán-R., P. Wade, D. Weller, B.H. Witteveen and M. Yamaguchi. 2013b. Strong maternal fidelity and natal philopatry shape genetic structure in North Pacific humpback whales. Marine Ecology - Progress Series 494:291-306. Dick, D.M., S. Walbridge, D.J. Wright, J. Calambokidis, E.A. Falcone, D. Steel, T. Follett, J. Holmberg and C.S. Baker. 2014. geneGIS: Geoanalytical Tools and Arc Marine Customization for Individual-Based Genetic Records. Transactions in GIS. 18: 324-350.
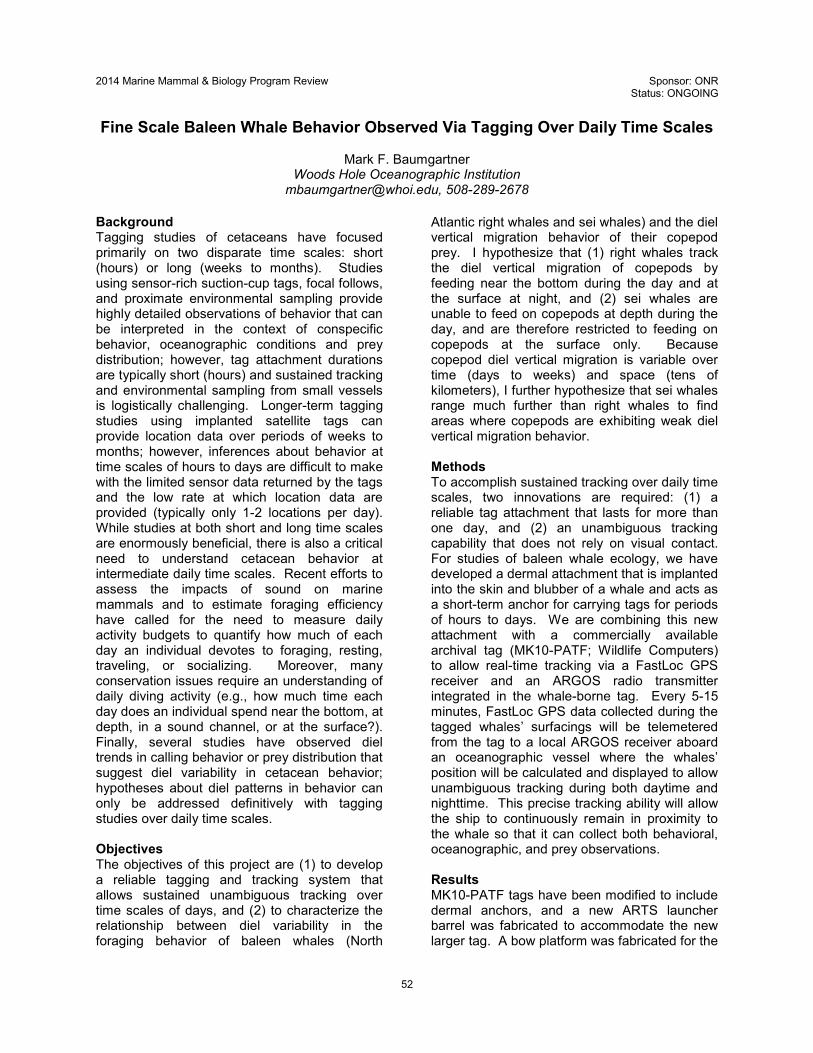
52
2014 Marine Mammal & Biology Program Review Sponsor: ONR Status: ONGOING
Fine Scale Baleen Whale Behavior Observed Via Tagging Over Daily Time Scales
Mark F. Baumgartner
Woods Hole Oceanographic Institution [email protected], 508-289-2678
Background Tagging studies of cetaceans have focused primarily on two disparate time scales: short (hours) or long (weeks to months). Studies using sensor-rich suction-cup tags, focal follows, and proximate environmental sampling provide highly detailed observations of behavior that can be interpreted in the context of conspecific behavior, oceanographic conditions and prey distribution; however, tag attachment durations are typically short (hours) and sustained tracking and environmental sampling from small vessels is logistically challenging. Longer-term tagging studies using implanted satellite tags can provide location data over periods of weeks to months; however, inferences about behavior at time scales of hours to days are difficult to make with the limited sensor data returned by the tags and the low rate at which location data are provided (typically only 1-2 locations per day). While studies at both short and long time scales are enormously beneficial, there is also a critical need to understand cetacean behavior at intermediate daily time scales. Recent efforts to assess the impacts of sound on marine mammals and to estimate foraging efficiency have called for the need to measure daily activity budgets to quantify how much of each day an individual devotes to foraging, resting, traveling, or socializing. Moreover, many conservation issues require an understanding of daily diving activity (e.g., how much time each day does an individual spend near the bottom, at depth, in a sound channel, or at the surface?). Finally, several studies have observed diel trends in calling behavior or prey distribution that suggest diel variability in cetacean behavior; hypotheses about diel patterns in behavior can only be addressed definitively with tagging studies over daily time scales. Objectives The objectives of this project are (1) to develop a reliable tagging and tracking system that allows sustained unambiguous tracking over time scales of days, and (2) to characterize the relationship between diel variability in the foraging behavior of baleen whales (North
Atlantic right whales and sei whales) and the diel vertical migration behavior of their copepod prey. I hypothesize that (1) right whales track the diel vertical migration of copepods by feeding near the bottom during the day and at the surface at night, and (2) sei whales are unable to feed on copepods at depth during the day, and are therefore restricted to feeding on copepods at the surface only. Because copepod diel vertical migration is variable over time (days to weeks) and space (tens of kilometers), I further hypothesize that sei whales range much further than right whales to find areas where copepods are exhibiting weak diel vertical migration behavior. Methods To accomplish sustained tracking over daily time scales, two innovations are required: (1) a reliable tag attachment that lasts for more than one day, and (2) an unambiguous tracking capability that does not rely on visual contact. For studies of baleen whale ecology, we have developed a dermal attachment that is implanted into the skin and blubber of a whale and acts as a short-term anchor for carrying tags for periods of hours to days. We are combining this new attachment with a commercially available archival tag (MK10-PATF; Wildlife Computers) to allow real-time tracking via a FastLoc GPS receiver and an ARGOS radio transmitter integrated in the whale-borne tag. Every 5-15 minutes, FastLoc GPS data collected during the tagged whales’ surfacings will be telemetered from the tag to a local ARGOS receiver aboard an oceanographic vessel where the whales’ position will be calculated and displayed to allow unambiguous tracking during both daytime and nighttime. This precise tracking ability will allow the ship to continuously remain in proximity to the whale so that it can collect both behavioral, oceanographic, and prey observations. Results MK10-PATF tags have been modified to include dermal anchors, and a new ARTS launcher barrel was fabricated to accommodate the new larger tag. A bow platform was fabricated for the

53
tagging boat to allow tag attachment high on the back of a whale where the ARGOS antenna will clear the water when the whale surfaces. A custom receiving system was built based on specifications from Ed Bryant (Wildtrack Telemetry Systems, Ltd), and an off-the-shelf receiving system was purchased from Wildlife Computers (spicyTalk). Each system was packaged in a watertight housing so that they could be mounted on the tall mast of a ship along with their integrated ARGOS antennas. Powered cabled telemetry was included in the watertight housing so that data encoded in ARGOS messages could be sent to computers in the ship’s dry laboratory where the position of the tagged whale could be calculated and displayed. The tagging and reception systems were readied for fieldwork in the spring seasons of
2013 and 2014. Unfortunately, no data was collected during either effort. During the May 2013 NOAA Northeast Fisheries Science Center (NEFSC) annual cruise to the southwestern Gulf of Maine, we were unable to tag even a single whale because of very low whale abundance and poor weather. We spent a total of 24 days at sea, and only deployed our small boat on one occasion to approach whales for tagging; on that single day, we spent very little time on the water because the weather deteriorated shortly after we launched. I prepared the tagging and reception systems again for the May 2014 NOAA NEFSC annual cruise aboard the NOAA Ship Gordon Gunter, only to learn while loading the ship that the cruise was cancelled because the ship’s rudder was damaged. As a result, no data has been collected in the field for this project.
Notes:

54
2014 Marine Mammal & Biology Program Review Sponsor: ONR Status: ONGOING
Zooplankton and Micronekton Distribution and Interaction with Predators at the
Northwest Atlantic Shelf Break and its Canyons
Gareth Lawson, Andone Lavery, Peter Wiebe Woods Hole Oceanographic Institution, Woods Hole, MA 02543
email: [email protected], phone: (508) 289-3713
Background Submarine canyons constitute important habitat for predators, notably marine mammals, seabirds, and large pelagic fishes, throughout the world’s oceans. Our interest is in the northwest Atlantic continental shelf break off New England (Fig. 1), a region where numerous marine mammal species are seasonally abundant, including acoustically sensitive species of particular naval interest such as beaked whales. Previous data used to examine whether marine mammals preferentially occupy canyons in this region have been few and equivocal, but at least beaked whales appear to be more abundant in canyons. Large and dense aggregations of euphausiids have also been observed in New England shelf break canyons, and multi-species assemblages of baleen whales have anecdotally been reported feeding on euphausiids, suggesting that the aggregation of prey may play a role in generating favorable habitat for higher trophic levels in these canyon regions.
Overall, however, canyons and associated bio-physical processes have received little attention off New England relative to shelf break regions elsewhere, perhaps in part because of the comparatively wide shelf and difficulties associated with reaching the shelf edge. This
region is particularly interesting, however, because of the western boundary current system and the likely role played by the Gulf Stream and associated warm-core rings in modulating the abundance and composition of shelf break organisms. Objectives Our long-term goal is to understand the interaction of physical and biological processes determining the distribution, abundance, and community composition of zooplankton and micronekton and their association with predators (including marine mammals, seabirds, and fish) at the northwest Atlantic continental shelf break and its canyons. The specific objective of this project is to examine a variety of existing samples and datasets in order to provide a synthesis of spatial and inter-annual patterns of variability in zooplankton and micronekton distribution at New England shelf break canyons, and, where feasible, associations with marine mammals and other predators. Methods Our approach has been to synthesize existing net, high-frequency acoustic, environmental, and top predator visual survey data collected by our group and collaborators during previous cruises to northwest Atlantic shelf break canyons, in order to examine statistically how the abundance and community composition of zooplankton and micronekton vary within and between canyons and time periods. These datasets include (A) depth-stratified zooplankton net samples, multi-frequency acoustic, hydrographic, and visual top predator survey data collected both within and away from Atlantis and Veatch Canyons during summer of 2010, at a time when Atlantis was under the influence of a warm-core ring, but Veatch was outside the ring; (B) net samples and acoustic data collected during winter 2005 at Hudson Canyon; and (C) a time-series of depth-stratified zooplankton net samples collected in Atlantis Canyon during the summers of 2009-2013 by colleagues at the Sea Education Association.

55
Results Net samples were processed for the lengths, abundance, and biomass of different zooplankton taxa as well as the species composition of euphausiids. Biomass and abundance was greater in canyon heads than at canyon mouths and than at non-canyon sites (Fig. 2), particularly for the large cold water euphausiid species Meganyctiphanes norvegica. Bottom depth was the strongest environmental correlate of euphausiid abundance. Strong inter-annual variability in euphausiid abundance, biomass, and species composition was observed during the 2009-2013 time period, but not clearly related to temperature.
Acoustic data indicated extensive and dense scattering layers especially prominent at canyon heads, both in the summer 2010 and winter 2005 cruises. Net tows conducted concurrent to acoustic data collection sampled large numbers of copepods and lesser numbers of euphausiids; taxon- and size-specific scattering models, coupled with net samples of animal size and abundance, however, suggested that euphausiids were the dominant scatterer in these acoustic layers. Shallow non-migratory
layers were also evident, particularly at the edge of the warm-core ring in Atlantis Canyon, consistent with large abundances of meso-pelagic fishes.
Ongoing statistical analyses are examining the distribution of top predators observed during the 2010 cruise. Odontocetes were more abundant at the canyon heads than at canyon mouths or non-canyon sites (Fig. 3). The density of seabirds did not differ as clearly between study sites, but did show strong patchiness and indicator species analysis found shearwaters to be most concentrated at the mouth of Veatch Canyon. Currently we are conducting multi-variate modeling, relating odontocete, shearwater, and storm petrel abundance to environmental conditions, including acoustically-derived indices of prey.
Notes:

56
2014 Marine Mammal & Biology Program Review Sponsor: ONR Status: ONGOING
Integration of a miniaturized conductivity sensor into an animal-borne instrument
Lars Boehme
Sea Mammal Research Unit, Scottish Oceans Institute, University of St Andrews, UK [email protected]; (44)-1334-462677
Background Habitat changes affecting marine mammals can range from small scale cyclic changes (e.g. tides) and natural physical processes (e.g. fronts and eddies) to changes on an ecological scale that range from years to decades and from tens to thousands of kilometers. These habitat changes can be natural or anthropogenic (e.g. pollution, sound). For example, short-term changes of the physical environment can cause changes in marine mammal populations by affecting pup survival, while long-term unidirectional changes can result in permanent habitat change or even habitat loss that may have a significant impact on entire populations. Population consequences of the foraging behavior of marine mammals depend on the availability of prey, which in turn is in part driven by the way animals react to the quality and dynamics of their immediate environment at the scale they are able to sample it. Predicting how marine mammal populations respond to habitat changes is also essential for developing conservation management strategies. To investigate such links, we need the appropriate environmental information at the relevant scales and, while large scale monitoring of environmental change can be accomplished cost-effectively by approaches such as remote sensing, getting fine scale information from the marine mammal’s immediate environment requires local in-situ monitoring. One rapidly developing approach to gather such fine scale information has been the use of the animals themselves to carry the required instruments to collect in-situ environmental data. Such data is necessarily at an appropriate scale to link changes in animal behavior to changes in their environment. However, existing instruments capable of providing data at the necessary accuracy are limited in available attachment methodologies and the size of instruments can render other approaches difficult. This project aims to be a stepping stone in developing an instrument enabling accurate
measurements while the instrument is rotating around a barb attachment as it is used to tag large cetaceans. Such methodology would provide for ecosystem studies of large cetaceans that are not currently feasible. Objectives The objective of this project is to modify and improve an existing miniature conductivity-temperature sensor and incorporate this sensor into the proven design of a Satellite Relay Data Logger (SRDL) and show that oceanographic conditions can be monitored. After the design and proof-of-concept stages the performance of the instrument package will be tested by using it to collect data to demonstrate it can obtain data of sufficient quality to investigate the links between animal behavior and local physical conditions. Methods The non-rigid attachment of the instrument to the animal requires a conductivity sensor, which has no or only a minimal external field. We will use electrodes to measure water conductivity, which will minimize measurement errors due to the variable proximity of the animal carrying the tag as a result of the attachment method. An electrode based conductivity sensor also tends to be smaller in size than an inductive sensor decreasing the size of the CTD package and opening up space for more sensors. However, there is a trade-off between size and accuracy. Decreasing size often results in a decreased accuracy and by minimizing the energy consumption the signal to noise ratio decreases as well. Therefore, an optimum has to be found between size, energy consumption and accuracy to design a working electrode based conductivity sensor within the constraints of animal-borne instruments. Within this project, we adapt the hardware and software of an existing NOCS sensor package for easy integration into the SRDL design, so that data can be relayed via telemetry enabling long term deployments on marine mammals.
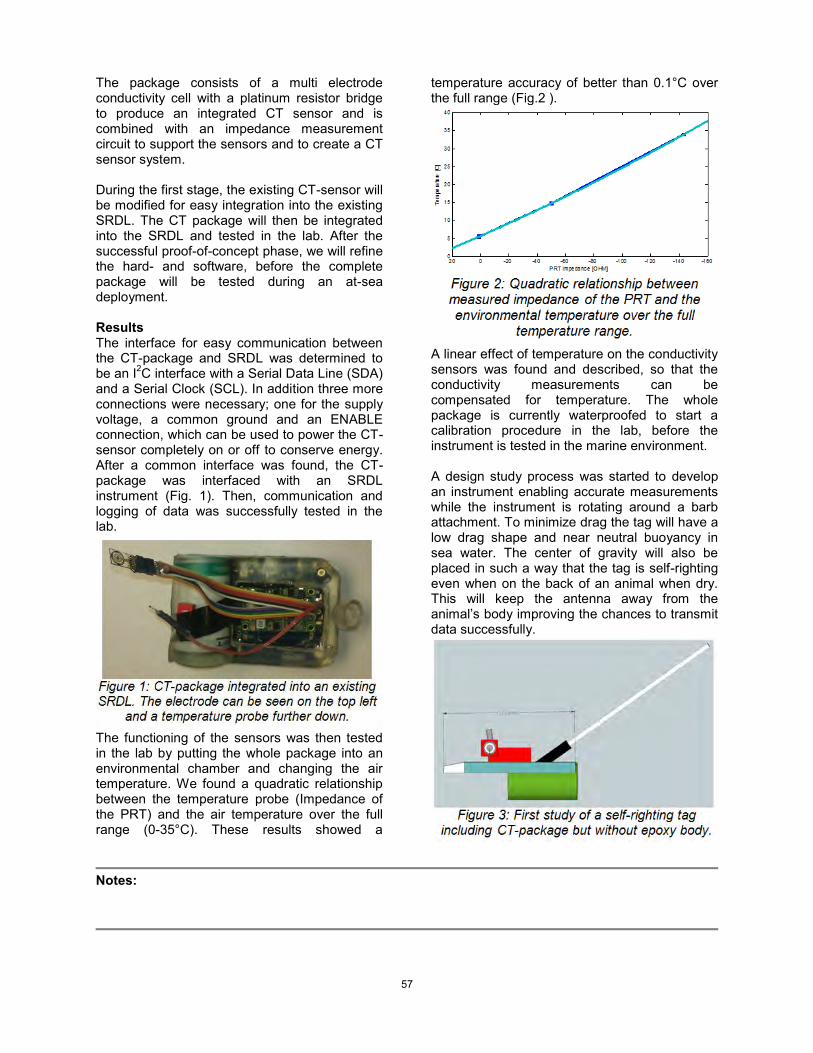
57
The package consists of a multi electrode conductivity cell with a platinum resistor bridge to produce an integrated CT sensor and is combined with an impedance measurement circuit to support the sensors and to create a CT sensor system. During the first stage, the existing CT-sensor will be modified for easy integration into the existing SRDL. The CT package will then be integrated into the SRDL and tested in the lab. After the successful proof-of-concept phase, we will refine the hard- and software, before the complete package will be tested during an at-sea deployment. Results The interface for easy communication between the CT-package and SRDL was determined to be an I2C interface with a Serial Data Line (SDA) and a Serial Clock (SCL). In addition three more connections were necessary; one for the supply voltage, a common ground and an ENABLE connection, which can be used to power the CT-sensor completely on or off to conserve energy. After a common interface was found, the CT-package was interfaced with an SRDL instrument (Fig. 1). Then, communication and logging of data was successfully tested in the lab.
The functioning of the sensors was then tested in the lab by putting the whole package into an environmental chamber and changing the air temperature. We found a quadratic relationship between the temperature probe (Impedance of the PRT) and the air temperature over the full range (0-35°C). These results showed a
temperature accuracy of better than 0.1°C over the full range (Fig.2 ).
A linear effect of temperature on the conductivity sensors was found and described, so that the conductivity measurements can be compensated for temperature. The whole package is currently waterproofed to start a calibration procedure in the lab, before the instrument is tested in the marine environment. A design study process was started to develop an instrument enabling accurate measurements while the instrument is rotating around a barb attachment. To minimize drag the tag will have a low drag shape and near neutral buoyancy in sea water. The center of gravity will also be placed in such a way that the tag is self-righting even when on the back of an animal when dry. This will keep the antenna away from the animal’s body improving the chances to transmit data successfully.
Notes:

58
Day 2: Tuesday May 21, 2014
POSTER SESSION
2014 ONR
Marine Mammal & Biology
Program Review

59
2014 Marine Mammal & Biology Program Review Sponsor: ONR Status: ONGOING
Cetacean Community Ecology in the Waters of Sri Lanka and the Bay of Bengal
Mark F. Baumgartner
Woods Hole Oceanographic Institution [email protected], 508-289-2678
Background The Indian Ocean contains arguably the highest diversity of cetaceans in the world’s oceans, yet research in this region is extremely limited. The strong environmental variability imposed on the northern Indian Ocean by the seasonal monsoons likely causes a wide variety of niches in both space and time that support the observed diversity of cetaceans. Objectives We hypothesize that the cetacean community of the oceanic Bay of Bengal and the waters of Sri Lanka varies with seasonal changes in water masses and circulation associated with the monsoons. To address this hypothesis, we will take advantage of an extraordinary opportunity to participate in a physical oceanographic field program to characterize (1) the cetacean community in the waters around Sri Lanka and in the oceanic Bay of Bengal, (2) the relationship between cetacean spatial distribution and mesoscale oceanographic features, and (3) the relationship between cetacean community composition and seasonal oceanographic conditions associated with the monsoons. Methods We are participating in the Air-Sea Interactions in the Northern Indian Ocean (ASIRI) project sponsored by the ONR Physical Oceanography program and the Naval Research Laboratory (NRL). This program is providing us with the opportunity to combine marine mammal observations with physical oceanographic measurements in the Bay of Bengal. We will
participate in ASIRI cruises, and we will use ASIRI-related travel and meeting opportunities to build scientific collaborations with Indian and Sri Lankan scientists interested in marine mammal research. Within the framework of these collaborative relationships, we hope to expand our observing capability to include sighting surveys on foreign vessels and passive acoustic monitoring. Results During late November and early December 2013, we conducted a cetacean sighting survey aboard the R/V Roger Revelle as part of the ASIRI pilot cruise. An international team of eight observers collected visual observations using 25×150 mounted “big-eye” binoculars, 7×50 handheld binoculars, and the naked eye using standard marine mammal survey methodology. The sighting team consisted of 4 experienced observers and 4 novices; the experienced observers provided extensive training to the novice observers. We surveyed 1,669 km of trackline in Beaufort 5 or less sea conditions, and recorded 52 sightings of 12 different species. Sightings were mostly concentrated in the southern Bay of Bengal, with few cetaceans encountered in the central and northern Bay. Sighting conditions tended to be better in the southern Bay when compared to the central and northern Bay, but we suspect the observed difference in cetacean occurrence is likely real. Future cruises will help elucidate this north-south difference.
Notes:

2014 Marine Mammal & Biology Program Review Sponsor: ONR Status: ONGOING
MEASURING COMPARTMENT SIZE AND GAS SOLUBILITY IN MARINE MAMMALS
Michael Moore, Andreas Fahlman, Yara Bernaldo de Quiros
Woods Hole Oceanographic Institution, [email protected]: 508-289-3228
Background Gas bubble lesions consistent with Decompression Sickness (DCS) similar to human divers have been described in beaked whales stranded in temporal and spatial association with military exercises. There is a growing consensus that exposure to military sonar may trigger a behavioral response in beaked whales that may lead to bubble growth through decompression as the whales alter their diving behavior. Theoretical studies can be used to model different scenarios and to estimate tissue gas burden, thus pointing out those behavioral changes that may affect risk. The principal challenge of these models is to incorporate realistic parameters for the different species and to be calibrated against empirical data. Parameters that require further study for marine mammals include compartment size and gas solubility in the different tissues. Objectives 1: To improve available morphometrics data of marine mammal compartments 2: To develop methods for the determination of gas solubility for various tissues of marine mammals 3: To develop methods to measure gas content in tissues of marine mammals and to relate this content with amount and gas composition of bubbles. Methods Access to different marine mammal species is achieved through collaborations with IFAW, NE NOAA fisheries program, University of North Carolina Wilmington, The Marine Mammal Center and the University of Las Palmas de Gran Canaria. Only fresh dead animals (code two) are used in this study. Our ideal study cases are robust adults. 1. Morphometric data. Dissections are carried out according to McLellan et al. (2002). Tissues are weighed separately. Volume of the tissues is measured by displacement of distilled water. Muscle samples are taken from different muscle groups to quantify myoglobin content. 2. Methods for the determination of gas solubility in tissues of marine mammals. Solubility studies are carried out following Zhou and Liu (2001) but inside a
glove box filled with argon, and using evacuated tubes to prevent atmospheric nitrogen contamination. 3. Methods to determine gas content in tissues of marine mammals. Tissues from different intact organs are sampled anaerobically by using an anaerobic excision system, which couples into a tissue grinder invented by Scholander (1942). Anaerobic conditions are achieved by using argon bells. Tissue extrudes from the grinder through a needle and is collected into an evacuated vial. Results 1. Data from one harbor porpoise, three common dolphin, one spotted dolphin, one bottlenose dolphin, one elephant seal, three sea lions, and two grey seals have been collected. 2. Regarding the gas solubility study, we have made some significant progress in the methods, although we don’t have any results yet. We optimized tissue homogenization and preservation. We have found the best tubes for the incubation in order to maximize gas exchange surface area at the same time as degassing the tissue. We have also tested the blanks, and made sure that the vacuum is preserved. We have tested our method using olive oil in order to validate the method. In four assays we were able to obtain results within the numbers published in the literature, but we haven’t been able to reproduce the assays. We are working to figure out where the problem is. 3. We have built a system that allows the tissue to be ground with no atmospheric air contamination. It still needs some adjustments to maximize sample size. We might need to use a GC-MS instead of just a GC. McLellan WA, et al 2002. Ontogenic allometry and body composition of harbout porpoises (Phocoena phocoena, L.) from the western North Atlantic. Journal of Zoology 257(4):457-471. Zhou JX, Liu J. 2001. The effect of temperature on solubility of volatile anesthetics in human tissues. Anesth. and Analgesia 93(1):234-238. Scholander PF. 1942. Method for the determination of the gas content of tissue. Journal of Biological Chemistry 142(1):427-430.
Notes:

61
2014 Marine Mammal & Biology Program Review Sponsor: ONR Status: ONGOING
Exploring the thermal limits of IR-based automatic whale detection
Daniel P. Zitterbart & Olaf Boebel
Alfred-Wegener Institut Helmholtz Centre for Polar and Marine Research [email protected]; [email protected]; +4947148311879
Background Growing concerns, that aquatic noise produced during naval exercises and offshore seismic surveys may be harmful to marine mammals, have led an increasing number of regulating agencies to request mitigation measures when issuing permits for such surveys in their nations’ EEZ. The most common measure is to implement a “marine mammal watch”, a team of observers that scans the ship’s environs for signs of presence of marine mammals to trigger a shutdown of the hydroacoustic source when marine mammals are entering a predefined exclusion zone. Marine mammal observers usually scan the ship’s environs for whales using binoculars or the naked eye. Sightings mostly rely on spotting a whale’s blow, which might rise to a height of several meters but is visible for a few seconds only. Hence, in combination with the whales’ prolonged dives, sighting opportunities are rare, which, in addition to the limited field of view and finite attention span of human observers, renders this method personnel-intensive and difficult, even during fair weather and daytime. During darkness it is not feasible. Our long-term goal is to overcome these difficulties and to develop a reliable, automatic whale detection system for the full range of oceanic environmental conditions (wind, sea surface temperature) and species. To this end, we developed a ship-based thermal imaging system for automated marine mammal detection, consisting of an actively stabilized, spinning IR camera and an algorithm that detects whale blows on the basis of their thermal signature. So far, this technology has been tailored to and tested under cold (SST < 10°C) water conditions only, as this is where the technology was expected to perform best. To adapt the technology to warmer environments and to test its performance there is the specific goal of this proposal. Objectives This project aims at a cost-efficient test of the thermal limits of the abovementioned IR based
automatic whale detection technology by attempting to capture whale spouts during the northward humpback whale migration, which occurs annually rather close to shore near North Stradbroke Island, Queensland, Australia. Based on the collected data, detector/classifier optimization shall be performed and ensuing system performance be tested by subsequent comparisons with concurrent visual observations. Results The primary goal of this field season was to acquire sufficient data to be able to train machine learning algorithms under warm water conditions. This goal (the collolafection of sufficient data) has been fully achieved. In a first screening of the IR imagery, we visually identified 2330 cues (mostly blows) in a total of 511 encounters (pods). The high abundance of blows/whales also allowed allocating 6 days to acquire a first data set for (double blind) visual-MMO/IR comparisons. Generally, the data shows that within 2 km of the sensor more than 90% of the observed pods could also be detected by visual screening of the IR footage on computer displays. On occasion, whales were detectable at distances of up to 10 km. The observers considered the detectability of blows in the IR to generally be better during night than during the day. This is probably due to a reduction of the overall contrast in the images during night time due to the absence of reflections of sunlight. Glare, i.e. the reflection of the sun on the sea surface, is a problem for marine mammal observations. The probability to detect a surfacing marine mammal in sea patches with glare is practically nil. The angle of sea surface which is not observable by an MMO is depended on the suns position. IR imaging is also impeded by glare, but to a much lesser extent. We found that while the visual observations are not possible in an angular section of 15° – 25°, IR is impeded much less by glare with 5° – 7° degrees of non-observable section.

62
2014 Marine Mammal & Biology Program Review Sponsor: ONR Status: ONGOING
IMPROVING THE NAVY’S PASSIVE UNDERWATER ACOUSTIC MONITORING OF
MARINE MAMMAL POPULATIONS
Gerald L. D’Spain, Tyler A. Helble, and Heidi H. Batchelor Marine Physical Laboratory, Scripps Institution of Oceanography
[email protected], 858-534-5517
Background Passive underwater acoustic monitoring of marine mammal sounds is the Navy’s primary method for characterizing the presence, distribution, and number of marine mammal species in several different environments, particularly those associated with Navy training ranges. This project addresses several aspects of this monitoring effort in order to improve the scientifically relevant information that can be obtained from the recordings. Objectives The overall objective of this research project is to improve the Navy’s passive underwater acoustic monitoring of marine mammal populations, with the primary focus on further enhancing the ability to estimate environmentally calibrated call densities (calls per unit area per unit time) and animal densities from the time series of raw detections of calls in underwater acoustic recordings.
Methods The methods used in this project are a combination of sonar signal/array processing, ocean acoustic modeling, and statistical analysis techniques. Results A statistical framework for calculating the bias and variance in the estimates of environmentally calibrated baleen whale call counts has been developed. One conclusion from this effort is that setting the detection threshold at a higher level in order to reduce the uncertainty in the estimated probability of detection (by reducing the areal coverage and therefore the impact of the uncertainty in ocean bottom properties) does not reduce the overall uncertainty in the environmentally calibrated call counts. Rather, it only increases the uncertainty in the false alarm estimate. In addition, a semi-automated method for localizing calling marine mammals using the Navy range hydrophones reduces significantly the uncertainties in the estimated animal densities obtained from passive acoustic recordings.
Notes:

Fig 1. Photo showing bottlenose dolphin stationed measurements of respiratory flow-rates and gas composition.
2014 Marine Mammal & Biology Program Review Sponsor: ONR Status: ENDED
Lung mechanics in marine mammals.
Andreas Fahlman
Department of Life Sciences Texas A&M- Corpus Christi 6300 Ocean Dr Unit 5892 Corpus Christi, TX 78412, Ph. +1-361-825-3489 e-mail: [email protected]
Background Breath-hold diving mammals live a life of dual constraints. On the one hand, time underwater needs to be maximized to enhance foraging efficiency; on the other hand, O2 stores are finite, and the animal must eventually return to the surface to exchange metabolic gases. August Krogh, the Nobel laureate and grandfather of comparative physiology, first said, “For every defined physiological problem, there is an optimally suited animal that would most efficiently yield an answer.” Cetaceans are a supreme example of that principle when it comes to understanding the physiological extremes of diving. Understanding the respiratory and cardiovascular traits required by marine mammals to manage life in an extreme environment and cope daily with atelectasis, transient hyperoxia, extreme hypoxia (arterial PO2 as low as 12 mmHg), ischemia/reperfusion, hyper- and hypotension, acid-base balance disturbances, intravascular gas bubbles, and inert gas narcosis is vital to understanding the physiological constraints imposed on these animals, and how these limitations may affect survival. In addition, respiratory disease is a significant problem and cause of mortality in both captive and wild cetaceans. Lung function studies may help improve care for animals within the Navy’s Marine Mammal program. Objectives The long-range goal of our research is to improve understanding of basic diving and respiratory physiology in captive and free-ranging marine mammals with special interest on cetaceans. In the proposed research, we aim to investigate the mechanical properties of the respiratory system in different marine mammals, measure the effect of breathing strategy on gas exchange, and estimate field-metabolic rates of free ranging cetaceans. The specific objectives of this project are to: Collect baseline data on pulmonary function, lung volume, and total lung capacity in healthy, awake pinnipeds and odontocetes (Aims 1 and 2). Measure how exercise and breath-
holding affect ventilation patterns, oxygenation and metabolic rates (Aim 3). Determine the respiratory consequences (end-tidal O2 and CO2, and ventilatory flow-rates) and additional metabolic costs when cetaceans are beached (Aim 4). Test variation in breathing patterns in anesthetized pinnipeds to determine if variation in breathing strategy has an impact on alveolar ventilation and maintenance of blood gases (Aim 5). Measure respiratory flow-rates and expired gas composition in free ranging cetaceans (Aim 6). Methods Aims 1-4: These aims will be performed on captive, trained odontocetes and pinnipeds with a number of collaborators at various locations (Julie Rocho-Levine and Gregg Levine, Dolphin Quest-Oahu; Martin Haulena, Vancouver Aquarium; Daniel Garcia, L'Oceanogràfic; Leonardo Ibarra and Carlos Camarena, Dolphinaris). Possible species include bottlenose dolphins, Pacific white-sided dolphins, harbor porpoise, and beluga whale,
California sea lions, Patagonian sea lions, harbor seals, and walruses. During these trials we will study unsedated marine mammals, providing important information on lung function

and mechanics in odontocetes and pinnipeds in a normal physiological state through voluntary participation of trained animals. We will use our custom-made system to measure respiratory air-flows, expired O2 and CO2 content Aim 5: In these experiments we will test how variation in breathing strategy affects gas exchange and maintenance of end-tidal gases in pinnipeds that are scheduled for an anesthetic procedure. The work will be conducted in collaboration with Shawn Johnson, at The Marine Mammal Center, where common species undergoing a procedure are California sea lion, harbor seal, and elephant seal. Aim 6: Humpback whales will be studied with a non-invasive approach to estimate expiratory flow rates and volumes, and expired gas composition using a pole-held flow meter over the blow-hole. The data will be used to estimate
the metabolic rate. The results will be combined with audio and 3-axis acceleration data to determine if respiratory flow noise can be used to estimate respiratory tidal volume and if activity correlates with diving metabolic rate Results -Preliminary data on bottlenose dolphins indicate a remarkable respiratory capacity with expiratory flow-rates > 140 l sec-1, and inspiratory flow-rates ranging from 5 to 40 l sec-1. -Esophageal pressures suggest passive expiration during voluntary breaths but active expiration during maximal efforts.
Notes:
Figure 2. Preliminary data showing A) respiratory flow-rate, tidal volume, and either esophageal pressure, and B) expired O2 during voluntary or maximal respiratory effort in an adult bottlenose dolphin.

65
2014 Marine Mammal & Biology Program Review Sponsor: ONR Status: ONGOING
PHYSIOLOGICAL MONITORING IN DIVING MAMMALS
Andreas Fahlman, Peter L. Tyack, Michael Moore, Warren Zapol, Richard Anderson, and Steve Trumble
Department of Life Sciences, Texas A&M University-Corpus Christi email: [email protected] ph. +1 (361) 825-3489
Background This study aims to develop and calibrate an invasive data logger to measure muscle O2 saturation in large, freely diving whales. We intend to use this data logger to measure muscle O2 saturation and determine how blood flow to muscle is altered during diving. The data logger was initially tested in the Northern elephant seals (Mirounga angustirostris) before deployment in free-ranging whales is considered. We also compared the hemoglobin spectra among marine mammals to test one of the key assumptions for oximetry. These data will be important to determine if muscle blood flow is altered during diving, to estimate how the dive response affects muscle N2 levels and the risk of decompression sickness (DCS), and to provide information about the optical properties of hemoglobin in diving vertebrates. Objectives This part of the project is separated into 2 aims: Aim 1: Determine if the absorption spectra for oxy- and deoxy-hemoglobin in diving vertebrates is the same as those in humans and determine if the assumptions used for human oximeters are valid for use in marine animals. Aim 2: Following the spring 2013 field season, develop a new generation of tags/data logger for marine mammals that will contain a sensor to be implanted into the muscle of freely diving marine mammals to collect physiological data from muscle tissue. Methods Aim 1: Whole blood samples were opportunistically obtained during health assessment blood collection and the hemoglobin isolated with centrifugation, dialysis, and filtration steps. The isolated Hb was oxygenated or deoxygenated using 5% CO2 in and 95% O2 or N2, respectively. Under gas-tight conditions. The oxy- and deoxygenated samples were
placed in a UV-visible light spectrophotometer and the absorption spectra measured from 600 nm to 1000 nm. The absorption spectra were overlaid and the isobestic point determined. Aim 2: Following the 2013 field season, the first generation of sensors with data loggers that were implanted in northern elephant seals were assessed and collected data were analyzed using Matlab. Results Absorption spectra were overlaid and the isobestic point determined. The results indicate that the absorption spectra are similar between the species we investigated and the isobestic point for hemoglobin is ~800 nm. Data collected from the first field season indicated a need for improvements to the data loggers. It was concluded that a second elephant seal translocation experiment is warranted following implementation of those improvements.
Figure 1. A comparison of the hemoglobin absorption spectra of four marine mammals as compared with humans. The isobestic point, where oxy- and deoxygenated curves cross are ~800 nm for all species]
Notes:
Oxygenated
Deoxygenated

66
2014 Marine Mammal & Biology Program Review Sponsor: ONR Status: ONGOING
Application of Density Estimation Methods to Datasets Collected from a Glider
Elizabeth T. Küsel(1), Martin Siderius(1), David K. Mellinger(2), and Sara Heimlich(2)
(1) Portland State University, (2) Oregon State University [email protected], (503) 725-3223
Background Population density estimation methods have been developed for fixed sensors. Moving platforms such as ocean gliders, can provide an inexpensive alternative for marine mammal population density studies. Using gliders it is possible to monitor a bigger spatial area than using a fixed passive acoustic recorder. It is a low-noise, low-speed platform, easy to set up, maneuver and transport on land, deploy, and recover. Furthermore, gliders can sense the environmental conditions of the survey area, which are important for estimating detection distances through propagation modeling. Objectives The main objective of this work is to evaluate the use of moving, unmanned platforms, such as an ocean glider, for population density estimation. Current methodologies developed for fixed sensors will be extended to these platforms. A secondary objective is to test an inexpensive acoustic recording system comprising of two hydrophones connected to an off-the-shelf voice recorder installed inside the glider. Methods A first generation Slocum glider (Teledyne Webb Research) named Clyde, was equipped with two High Tech Inc. hydrophones (model # HTI-92-WB) mounted one on each wing at a separation of 3 ft. (Fig. 1), and connected to a linear PCM recorder manufactured by Tascam (model # DR-07 MKII). The data acquisition system offers a sample frequency of 96 kHz, and is capable of continuous recording of two
channels of data at 16-bit resolution for up to 24 hours. To test the glider’s operation and the acoustic acquisition system, an opportunistic preliminary experiment was conducted in June 2014 in the Mediterranean Sea, off the west coast of the Island of Sardinia. Several gliders were deployed perpendicular to the coast at regular intervals in order to collect oceanographic and/or acoustic data, as part of a major oceanographic and acoustics experiment (REP14-MED). Each glider dove along its own transect back and forth from deep to shallow water for approximately 2 weeks, until they were recovered. Results The preliminary experiment was very useful to evaluate the technical operations of the glider and of the acoustic recording system. Even though Clyde presented hardware malfunction after the first day in the water and could not complete its mission, the acoustic acquisition system was able to record approximately 20 hours of continuous data while diving in waters deeper than 1500 m. The acoustic data is currently being analyzed for the presence of marine mammal calls. Preliminary results indicate the presence of dolphin sounds (Fig. 2). Overall, the quality of the acoustic files recorded with the off-the-shelf acquisition system look promising for future deployments to study marine mammal population density. Files containing dive and CTD information were lost, and/or have been renamed with erroneous time stamps due to the hardware malfunction, which was also diagnosed during the cruise.
Notes:
Figure 1. Slocum glider “Clyde” at the Northwest Electromagnetic and Acoustics Research
Laboratory’s (NEAR Lab) water tank at Portland State University (PSU), showing the
configuration of the hydrophones attached to each of its wings. Photo by: Elizabeth T. Küsel.
Figure 2: Acoustic data sample (10s long) recorded by Clyde on channel 1. Top:
spectrogram plotted up to 25 kHz where the thin vertical lines correspond to marine
mammal clicks, most likely dolphins, and the central part corresponds to glider noise,
probably buoyancy pump. Bottom: time series data. Plots were done using the software
Triton.

67
2014 Marine Mammal & Biology Program Review Sponsor: ONR Status: ONGOING
Large Scale Density Estimation of Blue and Fin Whales (LSD)
Jennifer L. Miksis-Olds
Applied Research Laboratory, The Pennsylvania State University [email protected], (814) 865-9318
Len Thomas, Danielle Harris
Centre for Research into Ecological and Environmental Modelling, University of St Andrews [email protected], (0)1334-461801
Background The goal of this research is to develop and implement a new method for estimating blue and fin whale density that is effective over large spatial scales and is designed to cope with spatial variation in animal density utilizing sparse array data from the Comprehensive Nuclear Test Ban Treaty Organization International Monitoring System (CTBTO IMS) and Ocean Bottom Seismometers (OBSs). The density estimation method developed here for the targeted low frequency vocalizations of blue and fin whales will be directly applicable to other species and frequency ranges using sparse arrays of fixed or remotely deployed PAM systems. Outputs will be of direct relevance to Navy risk assessment models. Objectives 1. Develop and implement methods for estimating detection probability of vocalizations based on bearing and source level data from sparse array elements. 2. Validate using OBS data, where additional independent information on detectability is available. 3. Use all available and relevant data to develop multipliers for converting calls-per-unit-area to blue and fin whale density – i.e., estimates of average call rate. 4. Estimate the regional density and spatial distribution of blue and fin whales in the Equatorial Pacific Ocean, using CTBTO data from Wake Island.
5. Estimate regional density and spatial distribution of blue and fin whales in the Indian Ocean, using CTBTO data from Diego Garcia. Methods We plan to use the bearing data, coupled with estimates of call source levels and sound propagation models in the study area, to estimate the distribution and density of calling whales in the monitored area. To do this, we will use the bearing, received signal-to-noise ratio (SNR), and transmission loss estimates to estimate the location of each call and range over which calls can be detected (together with estimates of uncertainty on these quantities). A detailed detector characterization will give probability of detection as a function of SNR, and hence we can estimate probability of detection for each received call. Spatio-temporal variability in the efficiency of the automatic detector will also be considered. Call “abundance” at the location of each call can then be estimated, where each detected call is scaled by its associated probability of detection to account for undetected calls also produced at that location. The resulting estimates will be smoothed in space with a Generalized Additive Model to give an estimated density surface. Taken together, this represents a novel approach to density estimation that has wide applicability. Results This is a new project. Pilot study results are anticipated in mid-2015.
Notes:

68
2014 Marine Mammal & Biology Program Review Sponsor: ONR Status: ONGOING
IMPROVING ATTACHMENTS OF NON-INVASIVE (TYPE III) ELECTRONIC DATA
LOGGERS TO CETACEANS
K. A. Shorter, G.Fiore, L.E. Howle, M. Bowers, D. Nowacek,T. Hurst, M. Johnson, M.Murray, L. Ojeda, J Rocho-Levine, J. van der Hoop, R. S. Wells and M. Moore
University of Michigan [email protected]
Background Here we are working to both increase the longevity of short-term archival tag attachments, and to develop quantitative metrics and analysis tools to assess the impact of a tag on the animal. We will present: 1) the characterization of the mechanical properties of dolphin skin (T. truncatus); 2) the development of surface treatments that facilitate adhesives for tag attachment; 3) tag body designs that reduce net hydrodynamic loading; and 4) algorithm development and experimental design for fine scale motion analysis of swimming animals. Mechanical Measures of Dolphin Skin It is essential to measure skin’s mechanical properties in vivo, as surface deformations reduce cup performance and can lead to cup failure. The amount of skin creeping into the cup will depend on vacuum force, cup stiffness, and the material properties of the skin at the attachment site. Here we present the design and experimental demonstration of a custom measurement tool, termed the Static Suction Cup (SSCup). We hypothesize that bulk properties of skin will vary at different body locations, and that ingress of tissue into the cup will reduce the cup’s attachment force. Mechanical properties of skin under vacuum loading on eleven live bottlenose dolphins (T. truncatus) were measured. The results demonstrate location dependent variability of both suction cup performance and the bulk skin properties. Surface Treatments for Adhesion Adhesives have the potential to serve as an alternative tag attachment method for cetaceans, but appropriate material selection and surface treatments for this application are not currently well understood. We investigate the use of bio-compatible glues in conjunction with micro-textures and surface treatments for improved performance of an adhesive attachment. A tag housing with an adhesive base was tested to failure on a common dolphin cadaver. The results demonstrated that the texture and surface treatment uniformly distributed the glue over the attachment surface and significantly improved adhesion to the cadaver. Importantly, the adhesive
bond of the textured assembly resisted forces in excess of 70 N, more than twice the drag force predicted for this tag in 10 m/s flow. Hydrodynamic Design Superficial tags increase hydrodynamic loading on the animal. Reducing this load will improve tag attachment longevity and reduce animal impact. Streamlined forms have been used to reduce drag loading, but these designs can accelerate flow over the top of the tag, resulting in large lift forces (normal to the animal) that dominate net loading at high speeds. To reduce lift, and minimize total hydrodynamic loading, this work presents a comparison of design features that equalize fluid speed above and below the housing (e.g., channels) and redirect flow to counter lift (e.g., fins). Hydrodynamic loading of four tag designs were compared using computational fluid dynamics (CFD) simulations. The results demonstrate that flow control elements can generate up to 80 N of downward force in simulated 10 m/s aligned flow with only a small increase in drag. Motion Analysis Finally, to estimate increased energetic requirements or behavioral modifications that may result from drag of the tag package, we have developed the hardware, software algorithms, and experimental setup to enable enhanced fine scale motion analysis of swimming animals. A full set of inertial sensors (three axis accelerometers, magnetometers, and gyroscopes), were attached to managed bottlenose dolphins at Dolphin Quest (DQ) Oahu. The algorithms developed and applied in this work to these data provide an improved estimate over current techniques of animal orientation and inertial accelerations. Additionally, the constraints imposed on the animals during the experiment enable accurate estimates of work performed on the center of mass (COM) during a prescribed swimming task for the first time. COM work is a key component of net energetic cost, and these data will be key to improving our understanding of the impact tags have on the animal.
Notes:

69
2014 Marine Mammal & Biology Program Review Sponsor: ONR Status: ONGOING
ACQUISITION OF OCEANOGRAPHIC MEASUREMENTS FROM BALEEN WHALES
Jonas Teilmann1, Mads Peter Heide-Jørgensen2
Institute for Bioscience, University of Aarhus, Frederiksborgvej 399, 4000 Roskilde, Denmark [email protected] Greenland Institute of Natural Resources, c/o Greenland Representation, Strandgade 91, 1016
Copenhagen K, [email protected]
Background Diving ocean predators can be fitted with instruments that record the animal’s location, diving depth, and concurrent oceanographic parameters creating a “real-time autonomous sampling platform” allowing for data collection from remote or ice covered waters where sampling by conventional ship-based techniques is expensive or impossible. Sampling of oceanographic data, including salinity (conductivity), temperature and depth, by use of instrumented marine mammals is an attractive technique that has been used widely with seals and to a lesser extent with narwhals and belugas. The oceanographic data collected by marine mammals can be incorporated into existing oceanographic monitoring of ocean trends and variability or they can be used as proxies for prey availability and habitat preferences, but also for real-time operational purpose where for instance the effects of salinity on sound transmission is important. Objectives The objectives of this project are: To develop satellite transmitters for baleen whales that can collect and transmit data on location, depth, temperature and salinity. To develop and test the deployment techniques for two tag designs on bowhead whales in West Greenland and on blue and humpback whales in Iceland. To evaluate the reliability and quality of oceanographic data collected in arctic ice
covered waters by slow swimming bowhead whales and from the open ocean by fast swimming blue whales. Project schedule January-June 2014: Discussion and meetings with manufacturers about design and specifications for the development of a CTD tag. Decision on sampling schedule (Levithus scale). November: Prototypes of CTD tags for baleen whales will be available for testing measurement accuracy at an oceanographic field site Sweden. December 2014: Tags will be tested for deep water (1000m) performance. November 2014-February 2015: Test of long-term drift in conductivity measurements. February 2015: Test of transmission of sampled data through Argos and decision on what to transmit. Development of delivery systems for tags. March 2015: Final decision on shape of tags and development of the final field tag models. April-May 2014: Deployment of tags on bowhead whales in Disko Bay. June-July 2015: Deployment of tags on blue and humpback whales in Iceland. July-December 2015: Collection of data via satellite from the tagged whales. January-September 2016: Analysis of data and preparation of scientific paper.
Notes:
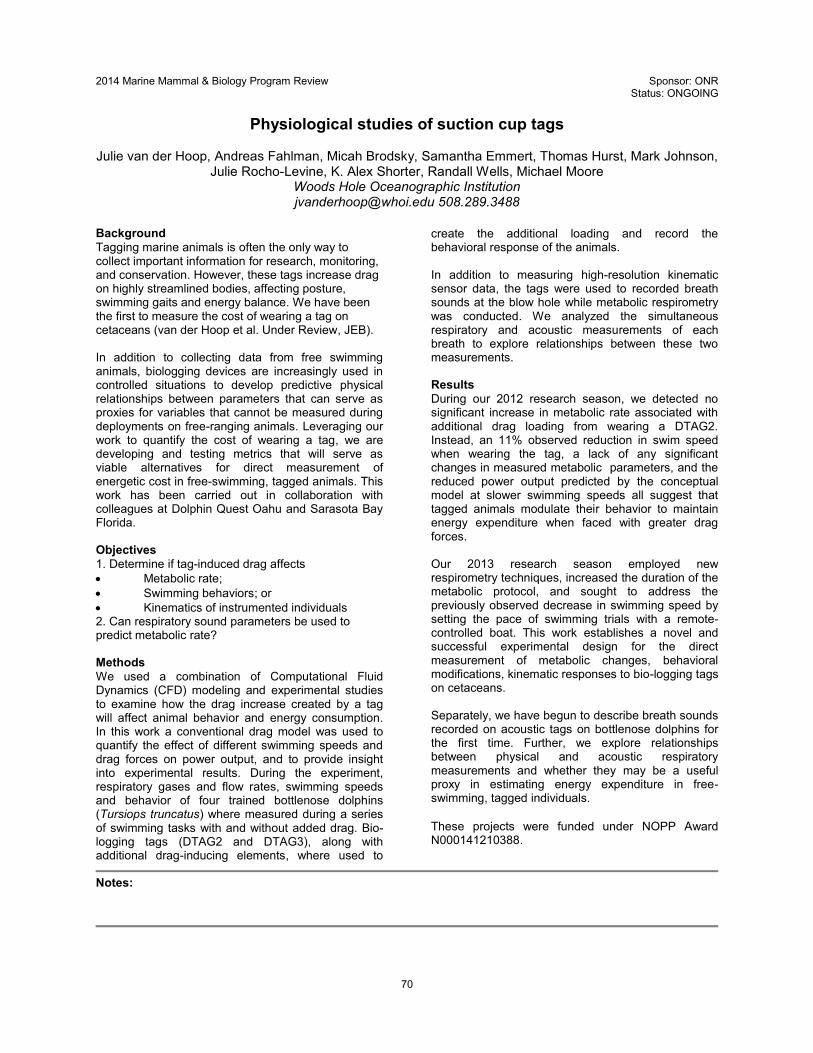
70
2014 Marine Mammal & Biology Program Review Sponsor: ONR Status: ONGOING
Physiological studies of suction cup tags
Julie van der Hoop, Andreas Fahlman, Micah Brodsky, Samantha Emmert, Thomas Hurst, Mark Johnson,
Julie Rocho-Levine, K. Alex Shorter, Randall Wells, Michael Moore Woods Hole Oceanographic Institution [email protected] 508.289.3488
Background Tagging marine animals is often the only way to collect important information for research, monitoring, and conservation. However, these tags increase drag on highly streamlined bodies, affecting posture, swimming gaits and energy balance. We have been the first to measure the cost of wearing a tag on cetaceans (van der Hoop et al. Under Review, JEB). In addition to collecting data from free swimming animals, biologging devices are increasingly used in controlled situations to develop predictive physical relationships between parameters that can serve as proxies for variables that cannot be measured during deployments on free-ranging animals. Leveraging our work to quantify the cost of wearing a tag, we are developing and testing metrics that will serve as viable alternatives for direct measurement of energetic cost in free-swimming, tagged animals. This work has been carried out in collaboration with colleagues at Dolphin Quest Oahu and Sarasota Bay Florida. Objectives 1. Determine if tag-induced drag affects Metabolic rate; Swimming behaviors; or Kinematics of instrumented individuals 2. Can respiratory sound parameters be used to predict metabolic rate? Methods We used a combination of Computational Fluid Dynamics (CFD) modeling and experimental studies to examine how the drag increase created by a tag will affect animal behavior and energy consumption. In this work a conventional drag model was used to quantify the effect of different swimming speeds and drag forces on power output, and to provide insight into experimental results. During the experiment, respiratory gases and flow rates, swimming speeds and behavior of four trained bottlenose dolphins (Tursiops truncatus) where measured during a series of swimming tasks with and without added drag. Bio-logging tags (DTAG2 and DTAG3), along with additional drag-inducing elements, where used to
create the additional loading and record the behavioral response of the animals. In addition to measuring high-resolution kinematic sensor data, the tags were used to recorded breath sounds at the blow hole while metabolic respirometry was conducted. We analyzed the simultaneous respiratory and acoustic measurements of each breath to explore relationships between these two measurements. Results During our 2012 research season, we detected no significant increase in metabolic rate associated with additional drag loading from wearing a DTAG2. Instead, an 11% observed reduction in swim speed when wearing the tag, a lack of any significant changes in measured metabolic parameters, and the reduced power output predicted by the conceptual model at slower swimming speeds all suggest that tagged animals modulate their behavior to maintain energy expenditure when faced with greater drag forces. Our 2013 research season employed new respirometry techniques, increased the duration of the metabolic protocol, and sought to address the previously observed decrease in swimming speed by setting the pace of swimming trials with a remote-controlled boat. This work establishes a novel and successful experimental design for the direct measurement of metabolic changes, behavioral modifications, kinematic responses to bio-logging tags on cetaceans. Separately, we have begun to describe breath sounds recorded on acoustic tags on bottlenose dolphins for the first time. Further, we explore relationships between physical and acoustic respiratory measurements and whether they may be a useful proxy in estimating energy expenditure in free-swimming, tagged individuals. These projects were funded under NOPP Award N000141210388.
Notes:

71
2014 Marine Mammal & Biology Program Review Sponsor: ONR Status: ONGOING
HIGH RISK BEHAVIORS IN MARINE MAMMALS: Linking biomechanics to cardiac
variability in fast and slow swimmers
Terrie M. Williams1, Nicole Thometz1, Susanna Blackwelll2, J. John1, and Mads Peter Heide- Jørgensen3 Department of Ecology and Evolutionary Biology, University of California, Santa Cruz, CA
[email protected], 831-459-5123
Background This project focuses on the physiological costs and potential risks of three common responses by cetaceans to anthropogenic noise, 1) high-speed swimming, 2) elevated stroke frequencies, and 3) rapid ascent from depth. By combining data from previous studies with experiments on cetaceans that differ in their locomotor performance capabilities, we intend to conduct a comprehensive evaluation of biological safety zones for diving marine mammals. This will be accomplished by identifying high and low risk behaviors when submerged as well as the specific triggers for tissue injury and cardiac instability when descending and ascending. Integrating the results across a 3-dimensional dive space will enable us to achieve our overall objective of predicting potential conflict points between marine species and naval operations and facilitate the development of species-specific operational schedules that will maximize the safety of marine mammals. Objectives In this part of the project, we report on recent studies to determine cardiovascular responses of cetaceans exercising at depth. Specifically, we evaluated the interrelationship between stroke mechanics (frequency and amplitude), heart rate variability, and submergence depth in trained and wild cetaceans.
Fig. 1. ECG-Accelerometer deployed on a wild narwhal.
Methods Heart rate, stroke frequency and depth were simultaneously monitored with custom-designed instrumentation (Fig. 1) deployed on fast (bottlenose dolphins, Tursiops truncatus) and slow (narwhals, Monodon monoceros) cetaceans diving to routine depths at sea.
Results Our research indicates two critical factors, diving depth and exercise, can affect cardiac function in diving cetaceans, and may interact with responses to anthropogenic disturbances.
Maximum dive depth (m)0 50 100 150 200 250
Min
imum
hea
rt ra
te (b
pm)
0
10
20
30
40
50
(8)
(24)
(24)(2)
(5)(4) (7)
Fig 2. Depth matters. Minimum heart rate (bradycardia) developed by cetaceans during submergence depended on dive depth.
Fig 3. Exercise matters. Heart rate during diving by cetaceans depends on the level of exercise as observed in the narwhal.
Notes: 1UC- Santa Cruz, 2Greeneridge Sciences Inc., 3Greenland Institute of Natural Resources

72
2014 Marine Mammal & Biology Program Review Sponsor: ONR Status: ONGOING
Improving Large Cetacean Implantable Satellite Tag Designs to Maximize Tag Robustness and Minimize Health Effects to Individual Animals: Initial Results
A.N. Zerbini, M. Moore, J. Calambokidis, M. Double, R. Andrews, V. Andrews-Goff, M. Baumgartner, P.
Clapham, A. Fahlman, M. Holland, T. Hammar, A. Kennedy, J. Robbins, and G. Schorr Cascadia Research Collective, 218 ½ W 4th Ave. Olympia, WA 98501/National Marine Mammal
Laboratory, Alaska Fisheries Science Center, NOAA, 7600 Sand Point Way NE, Seattle, WA. Email: [email protected], [email protected], Phone: (206) 526-4511.
Background Satellite tracking of large cetaceans is often conducted with intramuscular tags, raising concerns regarding their potential to cause long-term health effects to tagged individuals due to shearing forces at the blubber-muscle interface. Also, tag design flaws seen in recent tagging follow-up studies may explain their relatively short and variable duration and strengthen the need to develop new, more robust tags. Objectives The objectives of this project include: (1) to conduct experiments in cetacean carcasses to evaluate the magnitude of tissue trauma caused by shearing in muscle-penetrating tags, (2) use results from these experiments along with existing or new information on tag vulnerability and flaws to inform the development of new designs expected to minimize health impacts to individual animals. Because this project recently started, we will only address objective (1) in this abstract. Methods Scaled, intramuscular tags were modeled after full size baleen whale satellite transmitters. Miniature tags (n=9) were inserted into the blubber and muscle on the dorsal midline and right dorsolateral side of a common dolphin carcass at stations that are exposed to the air during normal cetacean swimming. A reciprocating oscillator was fabricated to mimic swimming movements. The cadaver was floated in a water tank and the peduncle was moved by the oscillator for 18 hours (~3240 oscillations). After completion of this experiment, 1.5mm diameter needles (n=4 per station) were inserted on the midline and left side at stations equivalent to the tag implant sites with the purpose of measuring shearing. The needles were inserted penetrating depths of 1cm (only in the blubber), and 1.5cm, 3cm, and 4cm (through the blubber into the sub-dermal sheet/muscle). The angle of penetration was measured for each needle using a protractor, with the animal in the relaxed, dorsal flexed and ventral flexed positions. The change in angle for each needle was calculated between dorsal and ventral flexion. Subsequently, each tag site was excised and dissected. The extent to which the retention features had deployed and the orientation of the tip were
recorded. The height and width of any cavity present around the tag was measured. Results The shearing experiment indicated that angles of penetration of needles vary according to (1) the depth of implantation and (2) the region of the body where needles were placed. Measured angles were smaller for penetration at 1 and 1.5cm, but substantially greater at 3 and 4cm, indicating shearing forces to be greater at higher depths of penetration. Larger angles were observed in stations located in the posterior (closer to the peduncle) and in the dorsolateral regions of the body. Differences in angles between relaxed and flexed were smaller in areas of the body where tags are typically deployed (e.g. near the anterior insertion of the dorsal fin), but results indicate that shearing occurs to some extent in such areas. Dissection of the tag sites after 18 hours of oscillation indicated variable results. Muscle cavities were found in six out of nine deployment stations, with the largest ones associated with deployments in the posterior portion of the body. Detachment of one of the retention flaps from the model tag body resulted in a relatively larger cavity with torn and shredded edges. Retention flaps did not fully deploy in six of the stations and changes of orientation in the tag position (rotation) were observed in fixed stations. Initial results indicated there is potential to improve animal welfare with the use of intramuscular tag designs that are robust and can compensate for shearing, and that minimize the use of cutting edges.

73
Day 3: Wednesday May 22, 2014
2014 ONR
Marine Mammal & Biology
Program Review

74
2014 Marine Mammal & Biology Program Review Sponsor: ONR Status: COMPLETED
A multi-week behavioral sampling tag for sound effects studies: design trade-
offs and prototype evaluation
Mark Johnson, Peter Tyack, Doug Gillespie, and Bernie McConnell
University of St. Andrews, St. Andrews, Fife KY16 8LB, UK
Phone: +44 1334 462624, E-mail: [email protected]
Background Studies of the impact of human-sourced sound on marine mammals require tags that simultaneously sample the sounds experienced by animals and their resulting behavior. Archival sound tags such as the DTAG can record exposures and responses with high resolution for up to two days but have limited utility for more authentic long exposures such as Navy sonar exercises. To sample behaviour before, during, and after exercises, a tag duration of 2-3 weeks is required, a ten-fold increase over the state of the art. Tags attached for this interval may be inordinately expensive to recover requiring that essential information be transmitted via satellite telemetry. But there is a six order of magnitude mis-match between the data rates that can be collected on a tag and the throughput rates of low-power global telemetry systems, and so massive data compression is required. Power consumption is another limiting factor in a multi-week device. Thus, the key challenges are to identify meaningful behavioral and environmental metrics that can be (i) acquired with low power by a tag and (ii) represented by very few data bytes for satellite telemetry. This project sought to examine the practicality of producing a disposable ‘smart tag’ that computes behaviour and exposure metrics in real-time while attached for multiple weeks to an animal. Upon release from the animal, this tag would float at the surface transmitting the summary data via satellite radio. This device would provide critical information for models predicting the population-level disturbance of Naval activities on protected species. Objectives We seek to conceptualize and develop new tag technology needed to study the behavioral effects of sound on wild marine mammals over extended time intervals. Specific goals are to: (i) develop robust data summary algorithms to deliver compact information about the behavior of tagged animals via satellite telemetry, and (ii) develop a prototype multi-week behavioral
sampling tag with archival and telemetry capabilities to enable field evaluation of the data summary algorithms. Methods To define the new technology required for this project, we held a workshop with international experts on marine mammal behaviour, responses to sound, statistical inference, and tag design. Goals of the workshop were to define a minimal set of information needed from a tag to detect and intrpret animal responses to disturbance, and to explore the potential for in situ data processing to extract this information from animal-borne sensors. In preparation for the workshop, we produced an orientation document summarizing the motivation for the smart tag concept and the inherent design trade-offs. Following the workshop, we progressed on two parallel tasks. The first was to develop and implement robust autonomous algorithms for the metrics identified during the workshop. Algorithms were initially coded in Matlab and tested with high resolution sound and movement data from the DTAG archive. Performance was assessed by comparison with existing expert-supervised methods. The autonomous algorithms were improved iteratively to reduce their dependence on predefined parameters while also enhancing their robustness to inaccurate sensor calibrations and unknown tag placements on the animal. The second task involved the development of a prototype smart tag to act as a test platform for field evaluation of the new algorithms. The protoype was based on the WHOI/SMRU DTAG-3 a low-power multi-sensor sound recording tag. The prototype smart tag required the addition of a fast acquisition GPS, a combined ARGOS and VHF transmitter, and a new battery management circuit to radically extend the duration of the tag. Two versions of the prototype tag were produced. The first contains the GPS and Argos/VHF but is otherwise similar to the DTAG-3 allowing

75
algorithm and telemetry evaluation within familiar short-term suction cup attachments to whales. The second design extends operation for up to 21 days. The greater size and longevity of this tag call for a different attachment method and we have focused on glue attachments to pinnipeds for initial evaluation. Results The ‘smart tags’ workshop was held in February 2013 with 16 attendees from the USA, UK, and France. Key outcomes were: (i) the identification of a set of metrics for behavioral response studies that may be possible to measure in real-time on a tag, and (ii) an estimate of the total data size within which these behavioural metrics must be encoded to be telemetered from a tag under realistic conditions. Participants agreed that Argos-2 is the only viable global telemetry system for data delivery from a smart tag and that a total data limit of 250 kB is to be expected. This means a best effective data throughput of about 240 bytes per hour of animal attachment. Short-term sound and movement tags currently collect more than 1.5GB per hour requiring a compression ratio of 7 million to 1 to meet the telemetry bottleneck. To achieve this, we developed a set of real-time processing algorithms implementing all but one of the high priority metrics identified at the workshop (an algorithm for body condition is being developed by Miller et al. under separate SERDP funding). These algorithms include proxies for prey capture attempts, time spent foraging, energy expended in transport, straightness of travel and ambient noise levels (Fig. 1) as well as processing methods for fast-acquisition GPS data. Comparison with existing supervised methods show that the algorithms are reliable
and robust, and can be applied to a range of marine mammal species.
Figure 1: Performance of in situ data processing
algorithms for dive phase (upper), respiration (left) and fluke strokes (right) using DTAG data
collected from a Blainville's beaked whale. A number of significant issues were encountered in producing the prototype tags primarily associated with the telemetry and GPS sub-systems. These have now been solved and two short-term smart tag prototypes have been deployed successfully on wild harbour porpoise. The long-term prototype is almost complete and will be trialled on harbour seals late in 2014. Field work is being performed by colleagues at Aarhus University, Denmark with leverage funds from the German Environmental Ministry (BfN) and no cost to the current program. The algorithms and hardware developed in this project provide a substantial step towards the goal of a disposable behaviour response tag. In addition to continued field testing, follow-on tasks would be to (i) develop a lower cost production tag integrated with species-specific attachment and release mechanisms, and (ii) develop behavioural response study designs that make the best use of the sparse summary data returned by these tags.
Notes:

76
2014 Marine Mammal & Biology Program Review Sponsor: ONR Status: ONGOING
Development and Testing of an Ultra Low Power System-On-Chip (SOC)
Platform for Marine Mammal Tags and Passive Acoustic Signal Processing
B. H. Calhoun, B. Otis, D. Mann University of Virginia
[email protected], (434) 243-2076
Background This project seeks to develop and build an ultra-low power system-on-chip (SoC) that will increase the useful lifetime of animal tags for monitoring marine mammals to weeks or months and to integrate that chip into a new monitoring tag, called Nano-power Electronics MOdule (NEMO). The NEMO tag has the specific application goal of determining the response of deep diving whales to human generated acoustic events, although the tag and SoC will be programmable to support numerous other monitoring applications. Objectives Provide a low power processing platform for marine mammal tags. Develop power saving schemes for on chip computation to save energy related to data storage in an off chip non volatile memory (NVM) Demonstrate an integrated SoC for marine mammal tags Integrate the SoC into a prototype tag (called NEMO) Methods Our approach to lowering marine mammal tag power consumption is to develop a programmable ultra low power (ULP) SoC to enable intelligent data collection, event detection, feature extraction, and power management in marine mammal monitoring tags. This SoC reduces processor power by implementing a custom ULP processor using sub-threshold operation, and it reduces NVM power and capacity limitations by allowing for programmable event detection and information extraction on chip to cut the volume of data going to the NVM by many orders of magnitude. Results We have successfully taped out and tested both the SoC and a companion chip that contains the analog front end (AFE) interfaces to sensors with an analog to digital converter (ADC). Fig. 1
shows a block diagram illustrating how the two chips interact to provide the functionality required for the sensor node. The AFE chip provides a low power interface (524 µW active power) to the hydrophone and piezo sensors with integrated programmable gain and an ADC. The AFEs can be power gated when not in use for power savings.
Measurements of the AFE chip confirm the functionality and performance of all blocks. The hydrophone AFE gives a maximum gain of 78.8 dB with 18.1 nV/√Hz of input referred noise at 10 kHz. Fig. 2 shows a measured waveform for the voltage gain of the hydrophone across frequency, and it also gives a die photograph of the chip, which was fabricated in a 130nm bulk CMOS technology. The chip includes signal digitization and the ability to digitally configure gain, power gating (for low-power mode), and frequency scaling. These features make the chip ideal for integration with the SoC into the NEMO tag.
The AFE chip is designed to interface to an SoC that will manage and control the functions of the
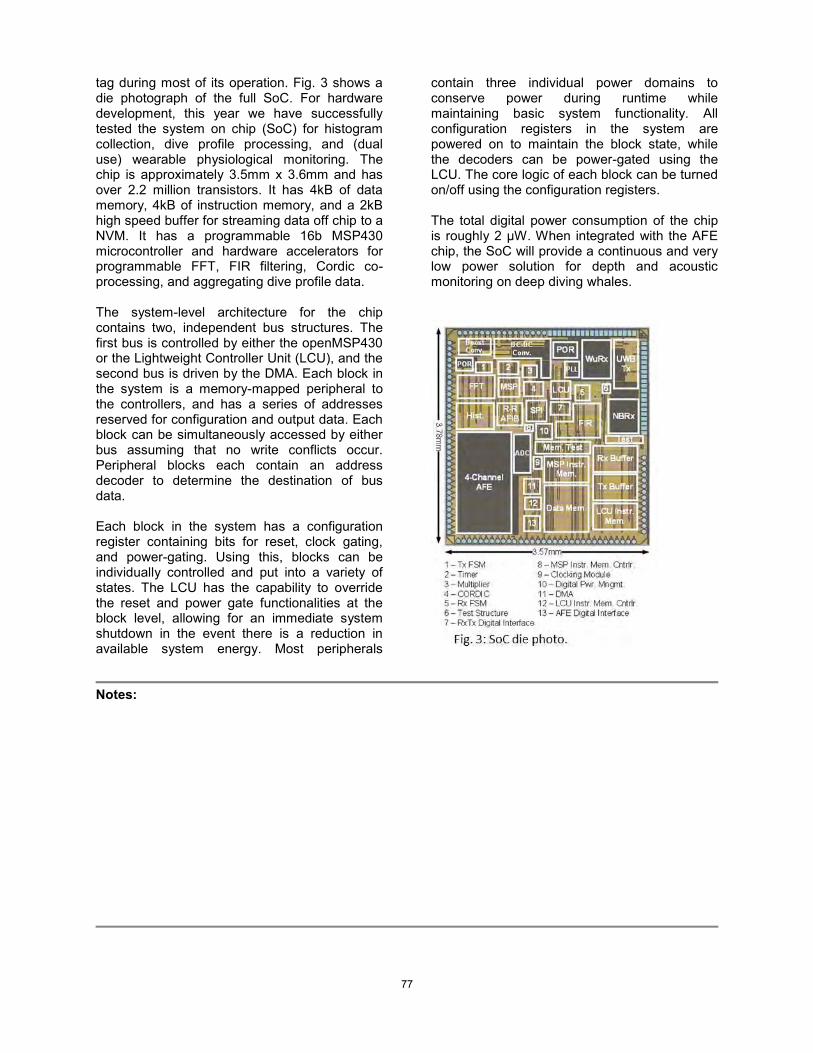
77
tag during most of its operation. Fig. 3 shows a die photograph of the full SoC. For hardware development, this year we have successfully tested the system on chip (SoC) for histogram collection, dive profile processing, and (dual use) wearable physiological monitoring. The chip is approximately 3.5mm x 3.6mm and has over 2.2 million transistors. It has 4kB of data memory, 4kB of instruction memory, and a 2kB high speed buffer for streaming data off chip to a NVM. It has a programmable 16b MSP430 microcontroller and hardware accelerators for programmable FFT, FIR filtering, Cordic co-processing, and aggregating dive profile data. The system-level architecture for the chip contains two, independent bus structures. The first bus is controlled by either the openMSP430 or the Lightweight Controller Unit (LCU), and the second bus is driven by the DMA. Each block in the system is a memory-mapped peripheral to the controllers, and has a series of addresses reserved for configuration and output data. Each block can be simultaneously accessed by either bus assuming that no write conflicts occur. Peripheral blocks each contain an address decoder to determine the destination of bus data. Each block in the system has a configuration register containing bits for reset, clock gating, and power-gating. Using this, blocks can be individually controlled and put into a variety of states. The LCU has the capability to override the reset and power gate functionalities at the block level, allowing for an immediate system shutdown in the event there is a reduction in available system energy. Most peripherals
contain three individual power domains to conserve power during runtime while maintaining basic system functionality. All configuration registers in the system are powered on to maintain the block state, while the decoders can be power-gated using the LCU. The core logic of each block can be turned on/off using the configuration registers. The total digital power consumption of the chip is roughly 2 µW. When integrated with the AFE chip, the SoC will provide a continuous and very low power solution for depth and acoustic monitoring on deep diving whales.
Notes:

78
2014 Marine Mammal & Biology Program Review Sponsor: ONR Status: COMPLETED
EXPERIMENTAL TESTS OF SMALL ELECTRONIC TAGS FOR DOLPHINS
Randall S. Wells, Brian C. Balmer, Laurens E. Howle, Michael D. Scott, Deborah A. Fauquier, Aaron A. Barleycorn, Katherine A. McHugh, Jason B. Allen, A. Blair Irvine, Forrest I. Townsend, Jay C. Sweeney,
Andrew Westgate, and Shawn Wilton Chicago Zoological Society
[email protected],Sarasota Dolphin Research Program, c/o Mote Marine Laboratory, 1600 Ken Thompson Parkway, Sarasota, FL 34236 USA; (941) 388-2705
Background Telemetry provides much information about the behavior of small cetaceans that cannot be learned in any other way. Tag designs are compromises between minimizing: 1) risk of injury to the animal, 2) behavioral changes, 3) drag, 4) mass, and 5) thermoregulatory effects, while attempting to maximize: 1) signal strength, 2) range and accuracy, 3) sensor information, and 4) transmission and attachment longevity. Until recently, electronic tags were large and required multiple pins to secure them to dorsal fins, sometimes leading to fin injuries and reduced deployment durations. Efforts since 1975 by the Sarasota Dolphin Research Program and collaborators to develop safe and effective tags have led toward a hydrodynamic tag design that trails behind the dorsal fin, mounted low on the fin with a single attachment pin. Objectives Our primary objectives included: 1) Refine specific hypotheses for laboratory tests of tags and attachments, through review and assessment of previous single-pin tag deployments for which post-deployment observations are available; 2) Evaluate hydrodynamics of currently available satellite-linked tags and attachments; 3) Determine effectiveness of changes to tags and attachments through hydrodynamic modeling; 4) Perform, under controlled circumstances, field tests of new tag designs resulting from laboratory studies conducted as part of this project.
Methods Fluid dynamics modeling refined the tag shape, size, and attachment of Wildlife Computers SPLASH TDR tag, reducing drag by about 50%. The new design was field-tested during May-August 2012, involving health assessment, tagging, monitoring and recapture of long-term resident bottlenose dolphins in Sarasota Bay, FL. Ten dolphins were tagged in May, half receiving tags treated with an experimental antifouling coating. The dolphins were observed, photographed, and video-recorded over the 69-92 days they carried tags. Eight were recaptured in July, the tags were removed, and health was evaluated. The remaining male pair was observed until the tags came off as designed. Results Attachment pin migration through the fin did not occur. The dolphins continued their normal respiration, ranging, and social patterns. Both adult females became pregnant while tagged. No health problems were found. Minimal biofouling occurred on coated tags, with heavy growth on uncoated tags. The tag design, attachment, and coating combination developed during this project is a significant improvement over previous designs. Tags incorporating these design features have functioned on bottlenose dolphins, franciscanas, harbor porpoises, common dolphins, and/or Guiana dolphins for as long as 260 days, and remained attached for up to 11 months, without evidence of damage to the dorsal fin, or any behavioral changes.
Notes: Figure caption: Adult males F164 (left) and F242 (right) 92 days post-deployment, showing heavy biofouling on F164’s uncoated tag, and no growth on F242’s coated tag. Photo by Sarasota Dolphin Research Program, taken under NMFS Scientific Research Permit No. 15543.

79

80
2014 Marine Mammal & Biology Program Review Sponsor: ONR Status: ONGOING
Building a Virtual Model of a Baleen Whale - Phase 2:
Baleen Whales Hear Best by Bone Conduction
Ted W. Cranford and Petr Krysl Quantitative Morphology Consulting, Inc.
[email protected], 858-573-6144
Background Sound reception mechanisms in baleen whales (Mysticeti) are essentially unknown but their vocalization frequencies overlap with anthropogenic sound sources. The pelagic balaenopterids may reach 30 meters in length and produce low-frequency sounds in the range of 10-200 Hz. Our computerized finite element modeling toolkit (VATk) allowed us to visualize what occurs when sounds interact with the anatomic geometry of a fin whale's head. In addition, the toolkit provides a means to generate synthetic audiograms for the whale by applying finite element modeling tools to X-ray computed tomography (CT) scans. Simulations reveal two mechanisms that excite both bony ear complexes Our previous work using the VATk indicates that the anatomic geometry of the cetacean head acts in complex ways to both filter out and amplify sounds according to frequency, incident amplitude, angle of incidence, tissue geometry, and perhaps other factors. The din of man-made ocean noise has risen steadily over the last half century. In the fin whale, we found that the predominant mechanism for low-frequency sound reception sensitivity is through bone conduction, as the skull interacts with incident sound waves. Consequently, there are significant implications for assessing mysticete exposure levels to anthropogenic sounds. This work informs Navy compliance standards by providing estimates of hearing sensitivity and directional hearing in selected mysticetes and odontocetes. Our results also provide valuable data for U.S. regulatory agencies and concerned large-scale industrial users of the ocean environment. This study transforms our understanding of baleen whale sound reception and provides a means to
predict auditory sensitivity across a broad spectrum of frequencies. Objectives 1) Investigate sound reception mechanisms in a fin whale using computer modeling simulations. 2) Produce a synthetic audiogram based on sound reception simulations in a fin whale head. Methods We CT scanned the head of a small postmortem fin whale (Balaenoptera physalus) in a scanner designed for solid-fuel rocket motors.
Figure 1. Anatomy of a fin whale head reconstructed from CT scans, showing skull, jaws, left eye, and left ear complex.
Figure 2. Hearing apparatus of a fin whale.

81
The vibroacoustic toolkit (VATk) was developed by us and is based on the finite element modeling techniques that have long been used by engineers to simulate the propagation of disturbances through complicated structures. We developed this innovative technology to incorporate the anatomic geometry of the entire cetacean head and/or body, and to produce valuable metrics of the hearing mechanisms and sensitivities. The VATk allows us to compute the seawater-to-stapes-footplate transfer functions using the entire head in a diverse group of cetaceans, for which we already have CT scan data. These transfer functions also provide a means to predict audiograms and calculate directional hearing parameters. Results Reconstructions of the anatomic geometry in a fin whale (Figures 1 and 2) show that the bony ear complex is rigidly anchored to the skull from processes that project into the skull from the periotic bones, which contain the cochleae. The tympanic bullae hang from the periotic bones by tabs of bone, an arrangement that resembles a lever arm. Since the malleus is fused to the tympanic bulla, any motion of the lever arm is transmitted through the ossicular chain to the stapes and the fluids within the cochlea. Simulations reveal two mechanisms that excite both bony ear complexes, (1) the skull-vibration enabled bone conduction mechanism, and (2) a pressure mechanism transmitted through soft tissues. Bone conduction is the predominant mechanism. The mass density of the bony ear complexes and their rigid attachments to the skull are universal across the Mysticeti, suggesting that sound reception mechanisms are similar in all baleen whales. Interactions between incident sound waves and the skull cause deformations that induce motion in each
bony ear complex, resulting in best hearing sensitivity for low-frequency sounds.
Figure 3. Predicted audiograms for the fin whale calf. The solid blue line represents the audiogram for the pressure mechanism. The red dashed line represents the audiogram for the bone conduction mechanism. The solid black line shows the combined audiograms for the pressure and bone conduction mechanisms. According to the synthetic audiograms generated by our finite element models (Fig. 3), the bone conduction audiogram is approximately four times more sensitive (lower threshold) between 1-2 kHz than the pressure audiogram. More significantly, the predicted difference in auditory sensitivity over the range (10 Hz to 130 Hz) of the lowest frequencies used by fin whales in Fig. 3, is between 10 to 30 dB (i.e. up to 10 times) more sensitive for the bone conduction mechanism than for the pressure mechanism. Since the bony ear complexes are rigidly anchored to the skull in all baleen whales, the bone conduction mechanism is likely the dominant component in mysticete hearing.
Notes:

82
2014 Marine Mammal & Biology Program Review Sponsor: ONR Status: ONGOING
Development of system for determination of in vivo soft tissue properties
Peter H. Rogers, Michael D. Gray
Woodruff School of Mechanical Engineering, Georgia Institute of Technology, Atlanta, GA 30332-0405 [email protected]
Background A broad range of research activities has sought to improve the understanding of cetacean biology and behavior, both under “normal” conditions and in response to anthropogenic sound. To understand mechanical responses of tissues and biological systems to incident sound, basic knowledge of the viscoelastic properties of the constituent tissues is required. Unfortunately, these properties are unknown in live cetaceans, and there is considerable evidence of post mortem change, making in vitro data of questionable validity. Objectives The primary objective of this project is to develop an ultrasound-based system for non-invasive determination of in vivo shear and bulk properties of cetacean soft tissues, including jaw fats and brain. The ultimate goal is to field a prototype system for examinations of stranded animals. Data collected with this system is intended to provide: 1) basic knowledge of in vivo tissue viscoelastic properties, and 2) a potential basis for diagnostics of tissue pathologies. Methods This work builds upon the principles of ultrasonic elastography, wherein ultrasound is used to both generate and observe low frequency vibration in soft tissues. While current methods have been successfully applied for human subjects, they are limited to tissue depths in the range of 5 cm, and cannot be directly extended deeper or through bone while conforming to federally mandated safety restrictions for ultrasound exposure. The focus of the present research is to overcome these limitations through reconsideration of the methods by which wave motion in soft tissues is generated and measured. The measurement concept thus developed, called convergent field elastography (CFE), uses a specially shaped ultrasonic field to safely generate larger soft tissue displacements at extended depths. The current
CFE prototype uses a pair of nested transducers designed for operation at tissue depths of 11-13 cm. An outer, annular transducer produces a tube-like force distribution in the focal region in soft tissue. The response to this force is primarily observable as an inwardly propagating shear wave field that grows in amplitude as it converges to the center of the force pattern. A second ultrasonic transducer nested inside the force generator monitors the tissue displacement along the ultrasound beam axis. This inner transducer supports an enhanced embodiment of an ultrasonic vibrometry concept (non invasive vibration measurement system - NIVMS) originally developed at Georgia Tech over 20 years ago. Shear tissue properties are determined through control of the forcing field’s mean radius and modulation rate. Variation of mean radius provides information on propagation delay, which is used to estimate shear wave speed at a single frequency. By modulating the forcing beam at a controlled rate, the frequency dependence of shear speed can be determined, and the shear loss subsequently found through a model fit to the observed dispersion. Bulk wave speed is coupled to the shear wave measurement problem through beam refraction, which impacts force radius, and beam width, which impacts the frequency dependence of shear displacement amplitude. Bulk wave speed is estimated by fitting a viscoelastic model to CFE shear wave measurement data. Ultrasonic attenuation is estimated through evaluation of the frequency and depth dependencies of internal backscatter. Specifically, tissue backscatter is compared with that from a homogeneous tissue mimicking material (“phantom”) whose properties have been independently determined. Prototype CFE system evaluation is conducted with tissue phantoms, at first with homogeneous construction and subsequently with spherical inclusions of contrasting shear stiffness. A

83
subset of the phantom testing will be repeated with samples of cetacean mandibular and cranial bone obscuring the ultrasonic beam paths. Successful completion of lab experiments will be followed as funding allows by in vivo testing on Navy dolphins and stranded animals, for which permits and approvals have been obtained. Results Prototype demonstration The CFE prototype was successfully demonstrated on a tissue phantom whose properties are in the range of published values for mammalian muscle tissues. Follow up testing has begun with a phantom whose properties are in the range of published values for human brain.
In vivo attenuation measurement In vivo extracranial ultrasonic attenuation was estimated in two Tursiops truncatus and one Delphinapterus leucas. The values calculated from data sets collected over the proximal mandible and temporal regions were at the low end of the range of reported values for in vitro mammalian fatty and connective tissues. Simulation development Simulations were developed to evaluate the impact of bulk sound speed on CFE transducer patterns and shear speed estimation. These results will be used in an iterative model for estimation of bulk speed and refinement of shear speed calculations.
Notes:
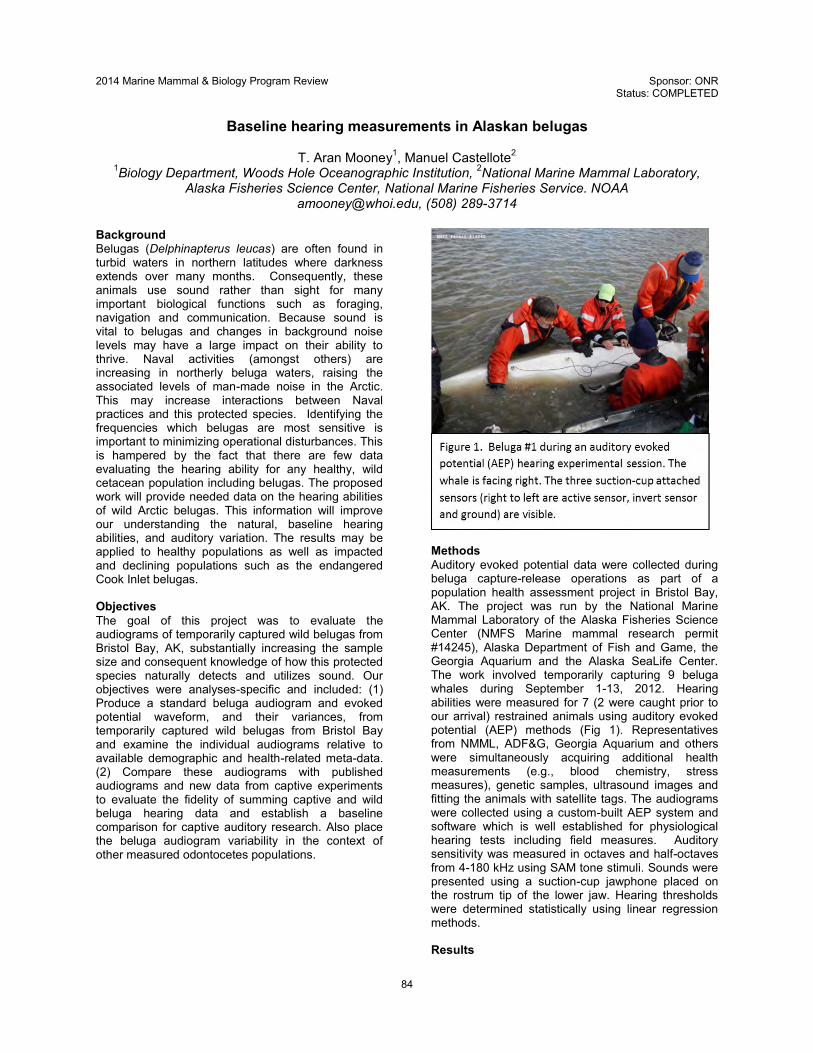
84
2014 Marine Mammal & Biology Program Review Sponsor: ONR Status: COMPLETED
Baseline hearing measurements in Alaskan belugas
T. Aran Mooney1, Manuel Castellote2
1Biology Department, Woods Hole Oceanographic Institution, 2National Marine Mammal Laboratory, Alaska Fisheries Science Center, National Marine Fisheries Service. NOAA
[email protected], (508) 289-3714
Background Belugas (Delphinapterus leucas) are often found in turbid waters in northern latitudes where darkness extends over many months. Consequently, these animals use sound rather than sight for many important biological functions such as foraging, navigation and communication. Because sound is vital to belugas and changes in background noise levels may have a large impact on their ability to thrive. Naval activities (amongst others) are increasing in northerly beluga waters, raising the associated levels of man-made noise in the Arctic. This may increase interactions between Naval practices and this protected species. Identifying the frequencies which belugas are most sensitive is important to minimizing operational disturbances. This is hampered by the fact that there are few data evaluating the hearing ability for any healthy, wild cetacean population including belugas. The proposed work will provide needed data on the hearing abilities of wild Arctic belugas. This information will improve our understanding the natural, baseline hearing abilities, and auditory variation. The results may be applied to healthy populations as well as impacted and declining populations such as the endangered Cook Inlet belugas. Objectives The goal of this project was to evaluate the audiograms of temporarily captured wild belugas from Bristol Bay, AK, substantially increasing the sample size and consequent knowledge of how this protected species naturally detects and utilizes sound. Our objectives were analyses-specific and included: (1) Produce a standard beluga audiogram and evoked potential waveform, and their variances, from temporarily captured wild belugas from Bristol Bay and examine the individual audiograms relative to available demographic and health-related meta-data. (2) Compare these audiograms with published audiograms and new data from captive experiments to evaluate the fidelity of summing captive and wild beluga hearing data and establish a baseline comparison for captive auditory research. Also place the beluga audiogram variability in the context of other measured odontocetes populations.
Methods Auditory evoked potential data were collected during beluga capture-release operations as part of a population health assessment project in Bristol Bay, AK. The project was run by the National Marine Mammal Laboratory of the Alaska Fisheries Science Center (NMFS Marine mammal research permit #14245), Alaska Department of Fish and Game, the Georgia Aquarium and the Alaska SeaLife Center. The work involved temporarily capturing 9 beluga whales during September 1-13, 2012. Hearing abilities were measured for 7 (2 were caught prior to our arrival) restrained animals using auditory evoked potential (AEP) methods (Fig 1). Representatives from NMML, ADF&G, Georgia Aquarium and others were simultaneously acquiring additional health measurements (e.g., blood chemistry, stress measures), genetic samples, ultrasound images and fitting the animals with satellite tags. The audiograms were collected using a custom-built AEP system and software which is well established for physiological hearing tests including field measures. Auditory sensitivity was measured in octaves and half-octaves from 4-180 kHz using SAM tone stimuli. Sounds were presented using a suction-cup jawphone placed on the rostrum tip of the lower jaw. Hearing thresholds were determined statistically using linear regression methods. Results

85
Our system to measure AEP responses was quite robust for establishing the audiograms of wild belugas. Envelope following responses were typically quite distinct from the background electrophysiological noise even though we used a limited number of sweeps per record. Thresholds were collected in approximately 3-5 min in order to minimize overall handling time of the animals. A mean of 9 (± 2.4 s.d., range 5-12) and a median of 10 thresholds were obtained per animal. It took an average of 45 min (range 31-55) to record each audiograms although recordings were often paused as the animal was repositioned, relocated to adjust for the tide, to move electrodes or while another sample type was obtained. Thus, 36-38 min was a good assessment of how quickly the procedure could be accomplished in these particular environmental and contextual conditions. All audiograms had a general U-shape typical of mammals and odontocetes with a steeper slope at the high frequency cut-offs, and a more gradual increase in thresholds a the lower range of hearing (Fig. 3). Two composite audiograms were created using the highest and lowest thresholds for each frequency (Fig. 3B). The standard deviation (sd) difference of thresholds at measured hearing frequencies and fitted power trend line showed an increase with frequency. Greatest s.d. values were at the highest frequency (128 kHz) and frequencies of maximum sensitivity (54 and 80 kHz). A best-fit fourth order polynomial was fit to the threshold data (Fig. 3D) to characterize a general audiometric curve and provide a view of the associated variability. This metric provided a composite audiogram that was less influenced by variability at certain frequencies (as found in the mean of seven animals) and may provide a valuable way to identify the general hearing abilities of a population. The mean audiogram of the wild belugas from this study was compared to those of laboratory animals from other studies. In general, the mean audiogram of the wild animals fell within the spread of those from laboratory animals, although those belugas often had more sensitive hearing at many frequencies. The wild animals tested here heard comparatively well at higher frequencies, including demonstrated responses at 140 and 150 kHz, which is the highest recorded frequency range for beluga whales.
Overall, these animals heard well in the upper frequencies. Based on the size of some animals, we assume that not all animals were very young. Thus, there appeared to be little sensorineural high-frequency hearing loss associated with age (i.e., presbycusis). Why these belugas demonstrated generally good high-frequency hearing, and whether this trend would continue in other beluga or other wild populations, is uncertain. This result further supports the need for larger sample sizes. Except for the relatively small differences in the upper auditory limit, there was little difference between female (n =3) and male (n=4) audiograms. Overall Bristol Bay belugas are a good subject population for approximating the baseline hearing for comparison with other populations inhabiting other regions impacted by anthropogenic noise. This method to measure odontocete hearing during a capture-and-release health assessment project was successful. The success of this challenging methodology supports further efforts to gather hearing and related data during capture-release events at Bristol Bay and elsewhere.
Notes:

86
2014 Marine Mammal & Biology Program Review Sponsor: ONR Status: COMPLETED
ESME Workbench
David Mountain, David Anderson, Graham Voysey
Boston University Hearing Research Center Email: [email protected] Phone:617-353-4343
Background The ESME Workbench is a risk assessment tool that is designed to predict the received levels for populations of marine mammals from naval sound sources. Objectives The objectives of this project is to use physics-based acoustic propagation algorithms along with location specific environmental parameters to predict the sound fields produced by naval sound sources including sonar and explosives. These sound fields are then used to compute received sound levels for simulated animals as they swim and dive in the area around the sound source. Methods CW sound sources are specified in terms of frequency, source level, beam pattern, and ping duration and repetition rate. These parameters can be stored in a sound-source database that includes the type of platform carrying the sound source. A platform can have multiple sound sources and a sound source can have multiple modes. Environmental parameters including sound-speed profiles, bathymetry, sediment types, and wind speed are used with propagation algorithms such as RAMgeo (a parabolic equation solver)
1 or BELLHOP (a ray-tracing algorithm) 2 to compute the resulting sound fields. The environmental parameters are typically derived from the US Navy’s Oceanographic and Atmospheric Master Library (OAML). Explosive sources are modeled using a linear approximation where and equivalent source waveform is convolved the impulse response of the propagation channel between the source and the receiver. The sound fields are computed by specifying a number of analysis points where 2D transmission loss profiles are computed for multiple radial transects. The resulting 3D transmission loss (TL) field is then used with the source level to compute the sound field. For moving sources, the TL field for the analysis point closest to the current source location is shifted to the source location before computing the received level at each of the simulated animals. For ship mounted sources, ship movement can be modeled by a random walk within prescribed boundaries or by a user specified ship track. Animal movements are modeled using the 3MB animal behavior model 3. The received levels for each
simulated animal and for each ping or explosion are logged during the simulation for subsequent analysis. Multiple sound sources and multiple animal species can be simulated simultaneously. Summary statistics such as cumulative exposure for each species for each source are computed during the simulation for quick analysis. A GIS-like user interface displays the simulation area with layers representing environmental parameters such as bathymetry. In addition, layers showing analysis point, source, and animal locations are available. Results Figure 1 illustrates the ESME Workbench user interface.
Figure 8 ESME Workbench user interface illustrating the
bathymetry layer. Location: Hawaiian Islands.
Analysis points are specified by their location, number and lengths of the radials to be computed and the sound source modes to be simulated. Figure 2 illustrates an example of some analysis points.

87
Figure 9. The circles indicate the location of the analysis
points.
After the transmission loss fields have been computed, they can be visualized using the Transmission Loss Viewer (Figure 3).
Figure 10. Transmission Loss Viewer. The slider alows the
user to switch from one radial to another.
Color is used to indicate the loss in dB and the color scale can be used by sliding the color bar on the right up and down or expanding and contracting it with the mouse. Some basic statistics are computed during the scenario simulation. Others are computed offline from the log file. Figure 4 shows the results from a simulation with 4 sources and three different species.
Figure 11. Summary histograms for exposure levels by
species for each of 3 sound sources on 3 different
platforms.
For more information or to download the current release, visit http://esme.bu.edu.
Notes: 1 Collins, M. D. (1993). “A split-step Pad solution for the parabolic equation method,” The Journal of the Acoustical Society of America, 93, 1736. doi:10.1121/1.406739 2 Porter, M. B. (1987). “Gaussian beam tracing for computing ocean acoustic fields,” The Journal of the Acoustical Society of America, 82, 1349. doi:10.1121/1.395269 3 Houser, D. S. (2006). “A Method for Modeling Marine Mammal Movement and Behavior for Environmental Impact Assessment,” IEEE Journal of Oceanic Engineering, 31, 76–81. doi:10.1109/JOE.2006.872204

88
2014 Marine Mammal & Biology Program Review Sponsor: ONR Status: ONGOING
Markers of Decompression Stress of Mass Stranded/Live-Caught and Released vs. Single
Stranded Marine Mammals
Michael Moore, Stephen Thom, Andrew Trites, David Rosen, Troy Neale, Nigel Waller, Randall Wells, Brian Sharp, Sophie Dennison-Gibby and Andreas Fahlman
Woods Hole Oceanographic Institution [email protected] 508 289 3228
Background The long-term goal of this study is to develop a biomarker of decompression stress in cetaceans to better understand the link between anthropogenic interactions and barometric stress. We aimed to analyze blood samples from captive, wild-caught-released, and stranded marine mammals in order to compare concentrations of Microparticles (MPs). If confirmed as an indicator of decompression stress, the use of MPs could be applied as a diagnostic tool for stranding events. Development of an effective diagnostic tool has significant implications to the military when the cause of strandings is in question. Objectives Recent necropsy reports have suggested a link between mass stranding of beaked whales and the use of naval mid-frequency sonar [1]. The whales experienced symptoms that were similar to those caused by inert gas bubbles in human divers. These reports have increased concern that anthropogenic sound, such as that created by military sonar or during seismic exploration, may harm marine animals. It has been suggested that alteration in physiology or diving behavior may increase the risk of decompression sickness (DCS). Bubble formation is believed to be the crucial event in the etiology of DCS, but the role that bubbles play in the disease process remains unclear. As more is learned about DCS, it has become apparent that some of the symptoms are similar to those of other disease states [2, 3]. Recent studies have shown that MPs correlate with the level of decompression stress in both the mouse [4] and human [5]. MPs are particles between 0.3 to 3 um in diameter that are shed from various cells. MPs derived from platelets are known to activate leukocytes and cause aggregation, and can stimulate pro-inflammatory cytokines. MPs derived from decompression stress have also been shown to activate neutrophils and cause vascular damage [4]. MPs are present in stranded odontocetes and phocids and can be detected by standard assays. Thus, MPs may be suitable biomarkers to assess decompression stress. The study is designed to verify a relationship between decompression stress and MPs in sea lions—and yield knowledge needed to assess decompression stress of cetaceans in the field.
Aim 1: The relationship between decompression stress and MPs was calibrated by conducting voluntary dive trials with Steller sea lions housed at the UBC Open Water (OW) Research Station in Vancouver, Canada. By analyzing blood samples before and after a dive bout to depths of 5m and 50m, we aimed to verify if a correlation exists between MPs and decompression stress (number of dives, duration and depth) in marine mammals. In addition, we measured the metabolic cost (using respirometry), activity (3-axis acceleration data loggers), and environmental variables during each dive series. B-mode ultrasound was also used to determine whether bubbles are present before and after the dive bout—and whether the presence of bubbles correlated with the measured decompression stress and MPs. The first experiment started on June 12 2012 when the animals dove to 5 m, while the second and third experiments were conducted on June 18 and 21 2012 to 50 m depths. For each experiment, blood samples were taken the morning of the dive experiment before the animal had been fed and had not been diving for at least 3 days. The sea lion was then transported to the dive site and allowed to dive for a pre-determined duration, approximately 30 min in total. Blood samples were again taken 3 and 24 hours after the sea lion had surfaced after the last dive. Aims 2 and 3: We sampled and analyzed single and mass stranded dolphins (Aim 2) and live-restrained dolphins (Aim 3) for MPs. We also collected associated data to determine which stressors correlate with changes in MPs. Methods Aim 1: In the first year, four adult female Steller sea lions participated in experimental dive bouts to depths of either 5m or 50m at the UBC OW Research Station. For each experimental dive bout, we collected and analyzed blood samples from each animal pre-dive and post-dive. In the second year, surface swim trials were conducted to estimate the effects of exercise on MPs levels. By isolating feeding and exercise impacts, the effects of diving to depth on MPs concentrations can be assessed. Statistical analyses of surface swim MPs data are currently in progress. Aim 2: Blood samples from single and mass stranded marine mammals in Cape Cod were collected and analyzed for MPs concentrations.

89
Aim 3: Blood samples from wild-caught-released bottlenose dolphins in Sarasota Bay, Florida were collected and analyzed for MPs concentrations for Pre-, Mid-, and deck restraint for health assessment. Results
Aim 1: There was a significant difference in pre-dive blood MP levels between experimental trials (AICnull = 192.6, AICtime = 151.5, P < 0.01). There was a trend toward a 26% decrease in MP levels from the first (2604 +- 352 MPs ul-1) to the second experiment (1935 +- 163 MPs ul-1, P < 0.1) and then a 57% increase from the first to the last experiment (4082 +- 788 MPs ul-1, P < 0.05). Diving induced a significant increase in MP levels following a dive (AICnull = 485.7, AICtime = 446.0, P < 0.01). Three hours following a dive bout the blood levels had increased by 170% and after 24 hours by 536% (Fig. 1). Aim 2: Samples from a total of 9 stranded animals from 3 dolphin species were analyzed, serially when practical, with approximately one hour between
sampling. No signficant trends were observed comparing species, time since stranded or mass versus single stranded. Aim 3: A total of 123 blood samples from 58 wild-caught-released dolphins in Sarasota Bay were analyzed for MPs. The samples were obtained Pre-, Mid-, and Post-procedure. Analysis of MP counts for this study (Table 1) showed no significant impact of removal from, or return to the water (Table 1). In 2014 an additional MP size fraction (1 – 3 µm) was analyzed-no significant differences were found. Table 1 - Microparticle counts (/µl plasma) in Tursiops truncatus during temporary restraint on deck for health assessment
At Capture in Water
On Boat
Before Release in Water
<1 µm
Mean 5461 5607 5891
St Dev 5296 2360 4816
N 58 25 40
1 to 3 µm
Mean 699 531 628
St Dev 703 704 1167
N 19 13 14
Thus MP analysis may be a biomarker for decompression stress in marine mammals but we need data from deeper diving animals to clarify this.
Notes:
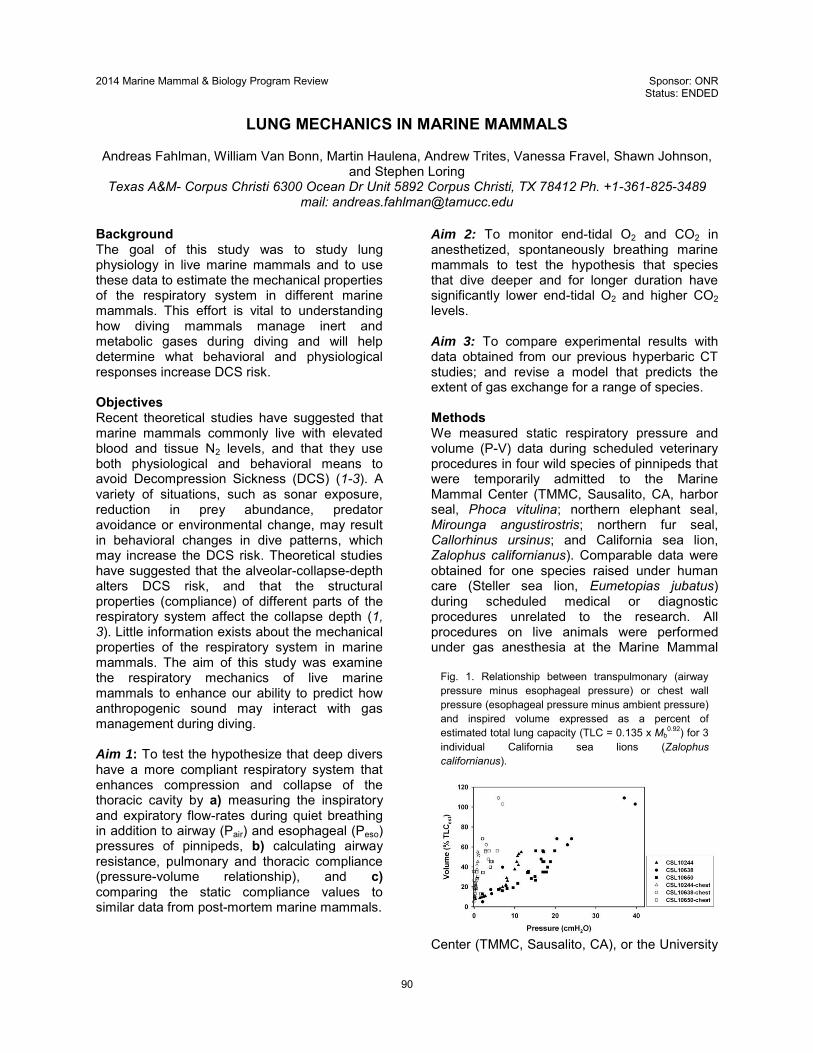
90
2014 Marine Mammal & Biology Program Review Sponsor: ONR Status: ENDED
LUNG MECHANICS IN MARINE MAMMALS
Andreas Fahlman, William Van Bonn, Martin Haulena, Andrew Trites, Vanessa Fravel, Shawn Johnson,
and Stephen Loring Texas A&M- Corpus Christi 6300 Ocean Dr Unit 5892 Corpus Christi, TX 78412 Ph. +1-361-825-3489
mail: [email protected] Background The goal of this study was to study lung physiology in live marine mammals and to use these data to estimate the mechanical properties of the respiratory system in different marine mammals. This effort is vital to understanding how diving mammals manage inert and metabolic gases during diving and will help determine what behavioral and physiological responses increase DCS risk. Objectives Recent theoretical studies have suggested that marine mammals commonly live with elevated blood and tissue N2 levels, and that they use both physiological and behavioral means to avoid Decompression Sickness (DCS) (1-3). A variety of situations, such as sonar exposure, reduction in prey abundance, predator avoidance or environmental change, may result in behavioral changes in dive patterns, which may increase the DCS risk. Theoretical studies have suggested that the alveolar-collapse-depth alters DCS risk, and that the structural properties (compliance) of different parts of the respiratory system affect the collapse depth (1, 3). Little information exists about the mechanical properties of the respiratory system in marine mammals. The aim of this study was examine the respiratory mechanics of live marine mammals to enhance our ability to predict how anthropogenic sound may interact with gas management during diving. Aim 1: To test the hypothesize that deep divers have a more compliant respiratory system that enhances compression and collapse of the thoracic cavity by a) measuring the inspiratory and expiratory flow-rates during quiet breathing in addition to airway (Pair) and esophageal (Peso) pressures of pinnipeds, b) calculating airway resistance, pulmonary and thoracic compliance (pressure-volume relationship), and c) comparing the static compliance values to similar data from post-mortem marine mammals.
Aim 2: To monitor end-tidal O2 and CO2 in anesthetized, spontaneously breathing marine mammals to test the hypothesis that species that dive deeper and for longer duration have significantly lower end-tidal O2 and higher CO2 levels. Aim 3: To compare experimental results with data obtained from our previous hyperbaric CT studies; and revise a model that predicts the extent of gas exchange for a range of species. Methods We measured static respiratory pressure and volume (P-V) data during scheduled veterinary procedures in four wild species of pinnipeds that were temporarily admitted to the Marine Mammal Center (TMMC, Sausalito, CA, harbor seal, Phoca vitulina; northern elephant seal, Mirounga angustirostris; northern fur seal, Callorhinus ursinus; and California sea lion, Zalophus californianus). Comparable data were obtained for one species raised under human care (Steller sea lion, Eumetopias jubatus) during scheduled medical or diagnostic procedures unrelated to the research. All procedures on live animals were performed under gas anesthesia at the Marine Mammal
Center (TMMC, Sausalito, CA), or the University
Fig. 1. Relationship between transpulmonary (airway pressure minus esophageal pressure) or chest wall pressure (esophageal pressure minus ambient pressure) and inspired volume expressed as a percent of estimated total lung capacity (TLC = 0.135 x Mb
0.92) for 3 individual California sea lions (Zalophus californianus).
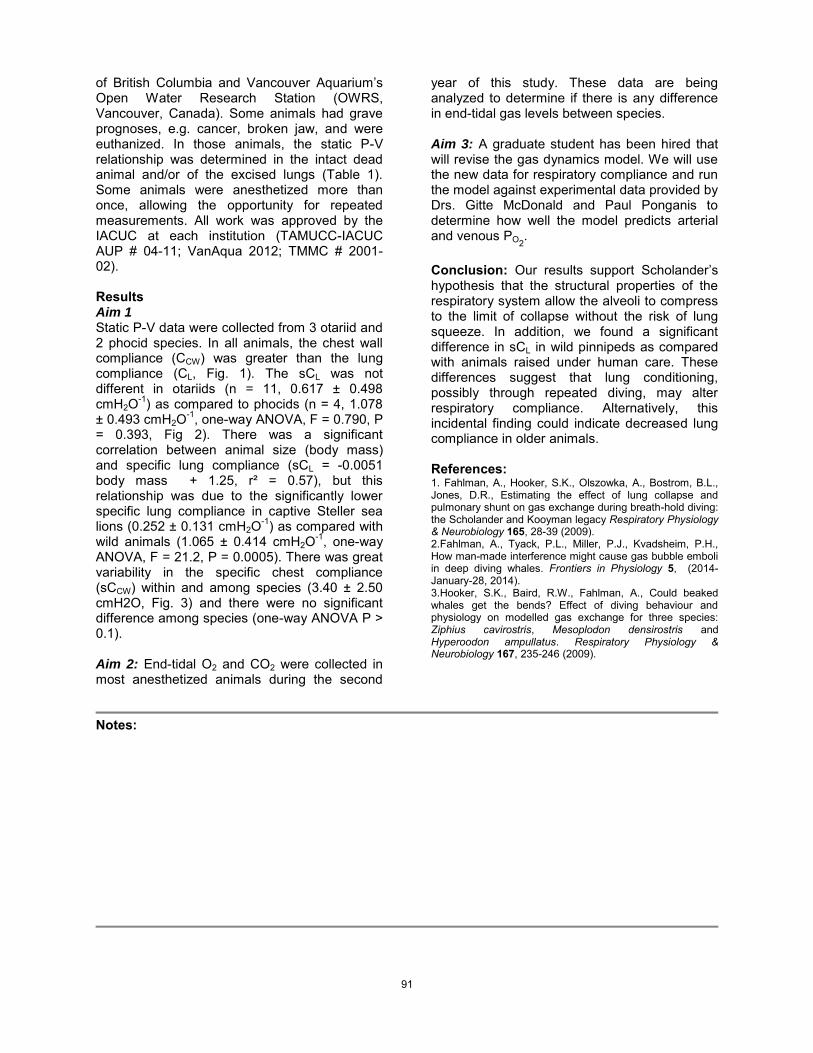
91
of British Columbia and Vancouver Aquarium’s Open Water Research Station (OWRS, Vancouver, Canada). Some animals had grave prognoses, e.g. cancer, broken jaw, and were euthanized. In those animals, the static P-V relationship was determined in the intact dead animal and/or of the excised lungs (Table 1). Some animals were anesthetized more than once, allowing the opportunity for repeated measurements. All work was approved by the IACUC at each institution (TAMUCC-IACUC AUP # 04-11; VanAqua 2012; TMMC # 2001-02). Results Aim 1 Static P-V data were collected from 3 otariid and 2 phocid species. In all animals, the chest wall compliance (CCW) was greater than the lung compliance (CL, Fig. 1). The sCL was not different in otariids (n = 11, 0.617 ± 0.498 cmH2O-1) as compared to phocids (n = 4, 1.078 ± 0.493 cmH2O-1, one-way ANOVA, F = 0.790, P = 0.393, Fig 2). There was a significant correlation between animal size (body mass) and specific lung compliance (sCL = -0.0051 body mass + 1.25, r² = 0.57), but this relationship was due to the significantly lower specific lung compliance in captive Steller sea lions (0.252 ± 0.131 cmH2O-1) as compared with wild animals (1.065 ± 0.414 cmH2O-1, one-way ANOVA, F = 21.2, P = 0.0005). There was great variability in the specific chest compliance (sCCW) within and among species (3.40 ± 2.50 cmH2O, Fig. 3) and there were no significant difference among species (one-way ANOVA P > 0.1). Aim 2: End-tidal O2 and CO2 were collected in most anesthetized animals during the second
year of this study. These data are being analyzed to determine if there is any difference in end-tidal gas levels between species. Aim 3: A graduate student has been hired that will revise the gas dynamics model. We will use the new data for respiratory compliance and run the model against experimental data provided by Drs. Gitte McDonald and Paul Ponganis to determine how well the model predicts arterial and venous PO2
. Conclusion: Our results support Scholander’s hypothesis that the structural properties of the respiratory system allow the alveoli to compress to the limit of collapse without the risk of lung squeeze. In addition, we found a significant difference in sCL in wild pinnipeds as compared with animals raised under human care. These differences suggest that lung conditioning, possibly through repeated diving, may alter respiratory compliance. Alternatively, this incidental finding could indicate decreased lung compliance in older animals. References: 1. Fahlman, A., Hooker, S.K., Olszowka, A., Bostrom, B.L., Jones, D.R., Estimating the effect of lung collapse and pulmonary shunt on gas exchange during breath-hold diving: the Scholander and Kooyman legacy Respiratory Physiology & Neurobiology 165, 28-39 (2009). 2.Fahlman, A., Tyack, P.L., Miller, P.J., Kvadsheim, P.H., How man-made interference might cause gas bubble emboli in deep diving whales. Frontiers in Physiology 5, (2014-January-28, 2014). 3.Hooker, S.K., Baird, R.W., Fahlman, A., Could beaked whales get the bends? Effect of diving behaviour and physiology on modelled gas exchange for three species: Ziphius cavirostris, Mesoplodon densirostris and Hyperoodon ampullatus. Respiratory Physiology & Neurobiology 167, 235-246 (2009).
Notes:

92
2014 Marine Mammal & Biology Program Review Sponsor: ONR Status: ONGOING
Proof of concept to isolate and culture primary muscle cells from northern
elephant seals to study the mechanisms that maintain aerobic metabolism under the hypoxic conditions of breath-hold diving
Shane B. Kanatous
Department of Biology, Colorado State University [email protected], 970-491-0782
Background Diving mammals are known to have increased internal stores of oxygen, specifically as a result of increased expression of oxygen-binding heme proteins, such as hemoglobin and myoglobin. These oxygen stores allow diving mammals to maintain aerobic metabolism under hypoxic conditions and can vary from species to species, depending on diving behavior and activity. We have shown this results in varied intra-muscular levels of myoglobin which are directly correlated to dive depth and duration (Kanatous et al., 1999, Kanatous et al., 2002, Kanatous et al., 2008). The overarching question in my research asks: what are the molecular pathways that regulate the specific adaptations that allow diving mammals to sustain aerobic metabolism during breath-hold exercise? A novel approach to study the development and molecular pathways that regulate the increased expression of myoglobin in skeletal muscles is to isolate and culture primary muscle cells (muscle satellite cells or progenitor cells) that replicate the phenotype. Previous work with muscle satellite cells has shown that these progenitor cells do not have the same phenotype as adult tissue but when activated by the appropriate stimuli replicate the adult phenotype found within that organism. Thus, the final phenotypic outcome of the muscle is determined by the environment in which the cells grow. This property of satellite cells will allow us to culture the primary cells isolated from diving mammal muscle and then determine the appropriate stimuli necessary to develop myotubes with the same adaptations to function under hypoxic conditions as seen in the skeletal muscles of the whole animal. While it has been shown that the final phenotypic outcome of satellite cells is directly influenced by the conditions in which they develop, that does not address the potential differences in phenotype seen between different organisms.
Implications and application beyond our current research: The techniques being developed here will have broad applications to other non-model organisms which cannot easily be exposed to different experimental conditions. The use of primary cells can be expanded to other cell types that could be obtained safely from animals using biopsy techniques. In addition, an unexplored area that could evolve from this technique is to expose the cultured cells to other environmental stresses such as the different aspects of climate change (i.e. temperature, salinity, pH, oxygen and carbon dioxide tensions), changes in substrate utilization or exposure to different contaminants to determine their effect on growth and development. Objectives To develop a protocol for the isolation and culturing of primary muscle cells from northern elephant seals (Mirounga angustirostris). Methods This work will be carried out in collaboration with Drs Daniel Costa, and Daniel Crocker. We will collect muscle biopsies from animals that are being sedated for their labs’ respective projects. By utilizing the same animals and working with these collaborators, we will minize the impact and number of animals being handled at Año Nuevo State Reserve. Muscle sampling Biopsy samples of approximately 50 mg will be collected with a 6-mm biopsy cannula (Depuy, Warsaw, Indiana) from the swimming (M. longissimus dorsi) muscle. Before the biopsy is taken, the skin is first cleaned with betadine scrub. A small area the size of a dime is shaved and one ml of 2% Lidocaine is then injected beneath the skin around the biopsy site to minimize the trauma to the biopsy site. The skin is punctured with a #10 scalpel and the biopsy needle inserted to a depth of 3-4 inches (the blubber layer is typically 2 inches thick). Once

93
collected, the biopsy will be dipped in 100% ethanol for sterilization then placed into culture media (F10 or F10 plus lipids) and stored on ice. After collection the biopsy site will be cleaned with betadine scrub. Slight pressure is applied to the biopsy site after flushing with 4x4 gauze pads to stop any minor bleeding. The biopsy samples will then be shipped overnight on ice to the lab at Colorado State University for primary cell isolation and culturing.
Results In summary, we have successfully isolated and grown primary muscle cells from all age classes of northern elephant seals. In addition, we have been able to freeze down multiple samples from each age class and subsequently regrown and differentiated the cells from the frozen stocks. Our results provide a method for shipping viable muscle samples and subsequently isolating primary muscle cells from muscle biopsies from the uniquely-adapted, free-ranging northern elephant seal. .
Notes:
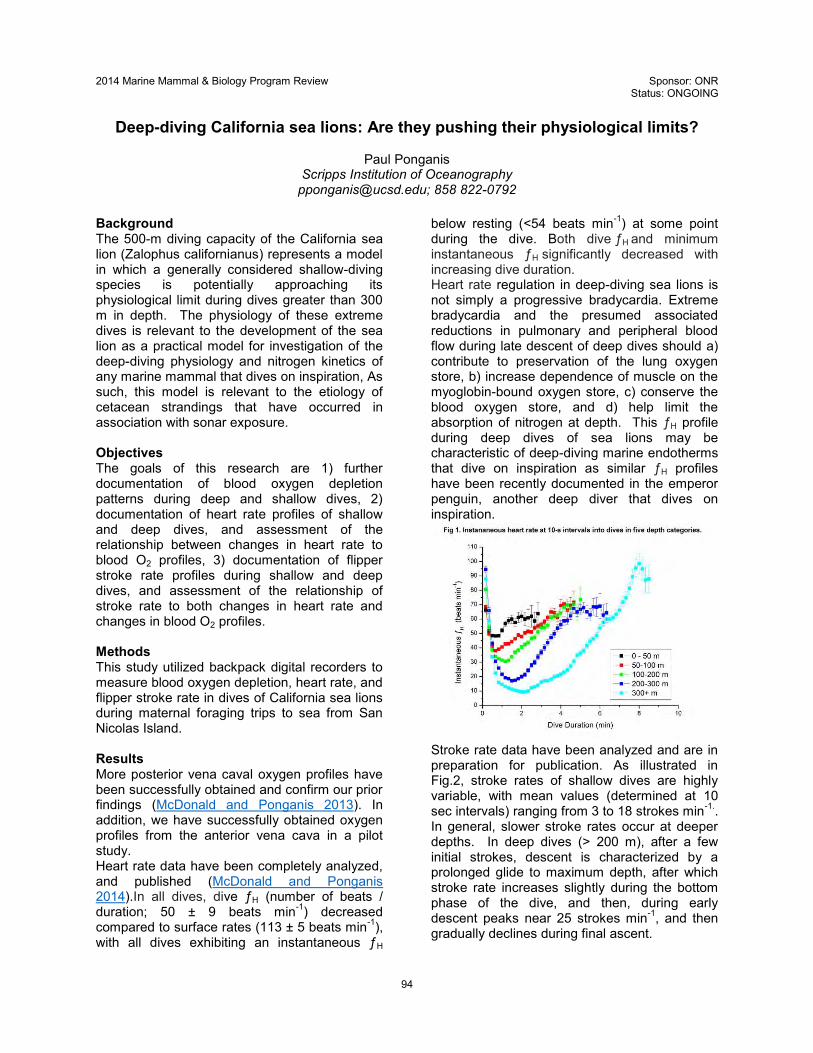
94
2014 Marine Mammal & Biology Program Review Sponsor: ONR Status: ONGOING
Deep-diving California sea lions: Are they pushing their physiological limits?
Paul Ponganis
Scripps Institution of Oceanography [email protected]; 858 822-0792
Background The 500-m diving capacity of the California sea lion (Zalophus californianus) represents a model in which a generally considered shallow-diving species is potentially approaching its physiological limit during dives greater than 300 m in depth. The physiology of these extreme dives is relevant to the development of the sea lion as a practical model for investigation of the deep-diving physiology and nitrogen kinetics of any marine mammal that dives on inspiration, As such, this model is relevant to the etiology of cetacean strandings that have occurred in association with sonar exposure. Objectives The goals of this research are 1) further documentation of blood oxygen depletion patterns during deep and shallow dives, 2) documentation of heart rate profiles of shallow and deep dives, and assessment of the relationship between changes in heart rate to blood O2 profiles, 3) documentation of flipper stroke rate profiles during shallow and deep dives, and assessment of the relationship of stroke rate to both changes in heart rate and changes in blood O2 profiles. Methods This study utilized backpack digital recorders to measure blood oxygen depletion, heart rate, and flipper stroke rate in dives of California sea lions during maternal foraging trips to sea from San Nicolas Island. Results More posterior vena caval oxygen profiles have been successfully obtained and confirm our prior findings (McDonald and Ponganis 2013). In addition, we have successfully obtained oxygen profiles from the anterior vena cava in a pilot study. Heart rate data have been completely analyzed, and published (McDonald and Ponganis 2014).In all dives, dive ƒH (number of beats / duration; 50 ± 9 beats min-1) decreased compared to surface rates (113 ± 5 beats min-1), with all dives exhibiting an instantaneous ƒH
below resting (<54 beats min-1) at some point during the dive. Both dive ƒH and minimum instantaneous ƒH significantly decreased with increasing dive duration. Heart rate regulation in deep-diving sea lions is not simply a progressive bradycardia. Extreme bradycardia and the presumed associated reductions in pulmonary and peripheral blood flow during late descent of deep dives should a) contribute to preservation of the lung oxygen store, b) increase dependence of muscle on the myoglobin-bound oxygen store, c) conserve the blood oxygen store, and d) help limit the absorption of nitrogen at depth. This ƒH profile during deep dives of sea lions may be characteristic of deep-diving marine endotherms that dive on inspiration as similar ƒH profiles have been recently documented in the emperor penguin, another deep diver that dives on inspiration.
Stroke rate data have been analyzed and are in preparation for publication. As illustrated in Fig.2, stroke rates of shallow dives are highly variable, with mean values (determined at 10 sec intervals) ranging from 3 to 18 strokes min-1.. In general, slower stroke rates occur at deeper depths. In deep dives (> 200 m), after a few initial strokes, descent is characterized by a prolonged glide to maximum depth, after which stroke rate increases slightly during the bottom phase of the dive, and then, during early descent peaks near 25 strokes min-1, and then gradually declines during final ascent.

95
From review of the heart rate and stroke rate profiles of the dives, the closest linkage of heart rate to stroke rate occurs during shallow, short duration dives, During deep dives, heart rate does not appear to correlate with stroke rate especially during late ascent. However, during early ascent, heart rate does increase slowly during this most active phase of the dive. Once again, such poor correlation of heart rate and stroke rate during deep dives suggests that muscle is most reliant on its endogenous myoglobin-bound oxygen store for aerobic metabolism.
As illustrated in Fig. 3, the decline in venous hemoglobin (Hb) saturation during descent appears primarily associated with the decline in heart rate during this phase of the dive, presumably reflecting decreased peripheral blood flow and near complete blood oxygen extraction by poorly perfused tissues..The increase in venous hemoglobin saturation during late ascent accompanies the increase in heart rate and reflects the increased peripheral oxygen delivery during this phase of the dive We are pursuing collection and analysis of simultaneous records of these variables in the
newest phase of our ONR-funded research. Documentation of these patterns will establish
the deep-diving California sea lion as an diving marine mammal. As such, the sea lion represents the best available model in which to collect data to understand the physiology and gas kinetics of a deep-diving marine mammal. This is pertinent to the understanding of beaked whale stranding associated with sonar exposure and to the many mathematical models of nitrogen uptake and distribution in these animals Publications McDonald, B.I., and P.J. Ponganis. 2013. Insights from venous oxygen profiles: oxygen utilization and management in diving California sea lions. Journal of Experimental Biology 216: 3332-3341. McDonald, B.I., and P.J. Ponganis. 2014. Deep-diving sea lions exhibit extreme bradycardia in long-duration dives. Journal of Experimental Biology 217: 1525-1534.
.
Notes:

96
2014 Marine Mammal & Biology Program Review Sponsor: ONR Status: ONGOING
Arteriovenous Patterns in Beaked Whales
Alexander M. Costidis
Sentiel A. Rommel University of North Carolina Wilmington [email protected]; (910) 962-2678
Background Blood vessels support a host of physiological functions (e.g. oxygen and nutrient transport, waste elimination, thermo-regulation), some of which are crucial in determining and animal’s ability to cope with environmental challenges (e.g. hypothermia, hypoxia, etc.). Additionally, blood vessels can play important roles in the manifestation and dissemination of pathologies such as metastatic cancers and emboli (Batson, 1940; Fernandez et al. 2005). One of the dominant current theories regarding the pathogenesis of sonar-related beaked whale strandings involves the development of lesions consistent with decompression sickness (DCS) (Jepson et al. 2003). The resultant lesions have involved widely disseminated intravascular gas and fat emboli (Fernandez et al. 2004; 2005). To date however, the source of those emboli has not been identified and the mechanisms causing nitrogen embolus formation and dissemination are not known. A better understanding of the vascular system can not only help elucidate potential sources of such emboli, but also reveal other structures with significant physiologic implications. Objectives The goal of this research was to investigate the gross and microscopic anatomy of the extracranial vascular system in the head of beaked whales. A general understanding of the cephalic vascular anatomy was deemed important for comparing to other mammalian species and for targeting future research needs. Of greatest interest was the anatomy of blood vessels associated with the ventral air sinuses (e.g. pterygoid sinus) and the mandibular acoustic fat bodies. Large pterygoid venous structures have been previously described abutting the pterygoid sinuses of beaked whales (Cranford et al. 2008) and other odontocetes (Costidis & Rommel, 2012; Fraser & Purves, 1960). Additionally, extensive vasculature has been observed within the intramandibular acoustic fat bodies (IMFBs) of numerous odontocete species (Costidis & Rommel, 2012;
Fraser & Purves, 1960; Murie, 1873). The pterygoid air sinuses and mandibular fat bodies have been hypothesized to play important roles in diving and acoustic physiology, respectively, and were therefore considered important structures to investigate. The morphology of these anatomic regions as it may relate to pathogenesis of DCS lesions was also investigated. Methods The methods employed for this research involved a combination of traditional anatomical investigation (e.g. gross dissection and histology) and modern imaging (e.g. computed tomographic contrast angiography). Post-mortem specimens from 5 different beaked whale species (n=17) were obtained from the U.S and New Zealand marine mammal stranding networks. Prior to receiving vascular catheters and being flushed with either water or phosphate buffered saline, many of the specimens were imaged via computed tomography (CT). One adult female was also imaged via magnetic resonance imaging (MRI) to obtain high resolution soft tissue images. The vascular system of the specimens was subsequently injected with a mixture of liquid latex and barium sulfate suspension to render their blood vessels radiopaque. Specimens were imaged via CT and following post-processing of data were manually dissected. Histologic tissue samples were collected from 2 specimens and processed with standard histologic techniques. Duplicated slides were created using hematoxylin and eosin and Mason’s trichrome. Results The anatomy of the extracranial blood vessels of 5 beaked whale species was examined. We found the arterial system to exhibit considerable similarity to that of terrestrial mammals, with certain notable exceptions. A robust arteriovenous plexus (corpus cavernosum nasalis) was found investing the lining of the bony nares. The gross and histologic morphology were strongly suggestive of tissue

97
capable of engorging with blood and distending (e.g. erectile tissue) similar to the corpus cavernosum of the mammalian penis. This tissue was thought capable of passively sealing the upper respiratory tract during a dive and separating the respiratory and vocal structures. Considerable arterial investment was also found within the pterygoid venous region and IMFB regions. Arteries investing these regions do so as small arteries traveling through delicate, thin-walled, fatty and connective tissue trabeculae suspended in or in close apposition to sizable venous sinuses and sinusoids. These trabeculae are bathed by venous blood and the thin walls separating venous blood from arterial blood and adipocytes warrant further research into the potential for exchange of nitrogen gas during diving as well as the intravascular introduction of emboli. As described by Cranford et al. (2008) in Cuvier’s beaked whales, all species examined have large bilateral pterygoid venous lakes (fibrovenous plexuses) juxtaposed to the pterygoid air sinuses. Imaging before and after injection of contrast into the venous system showed substantial compression of the pterygoid air sinuses by the adjacent venous lakes, with the venous lakes occupying much of the region previously invested with air. This finding provides further evidence that the venous system associated with the accessory sinus system functions as a compensatory structure that accommodates pressure changes and facilitates volume changes within the air sinuses (Fraser & Purves, 1960). The large displacement of the air sinuses by venous
volume also suggests that pathways of sound propagation through the region may change depending on the degree of venous engorgement. Finally, all peripheral arteries in the head of beaked whales were found intimately associated with anastomosing paired veins or completely encased in venous retia. This morphology is consistent with that associated with vascular counter-current heat exchange (Scholander, 1958; Scholander & Schevill, 1955). Vascular counter-current heat exchange structures were especially prominent in the lingual and oral region, in a manner reminiscent of the corpus cavernosum maxillaris of bowhead whales (Ford et al. 2014). We believe this morphology suggests that all peripheral vasculature in the head of beaked whales has the potential to limit heat loss to the environment. Although the degree of peripheral vasoconstriction and tissue ischemia in diving beaked whales are not known, their often protracted dive times may necessitate periodic blood supply to the periphery even during deep dives. The observed counter-current vascular morphology may afford beaked whales the ability to supply oxygen and nutrients to their periphery during protracted dives, while simultaneously limiting the amount of heat lost to the environment. The anatomy described herein suggests that the vascular system in the head of beaked whales is adapted is such a way as to afford the capability to manage the barometric and thermal challenges encountered during the prolonged and deep dives characteristic of this cetacean family.
Notes:
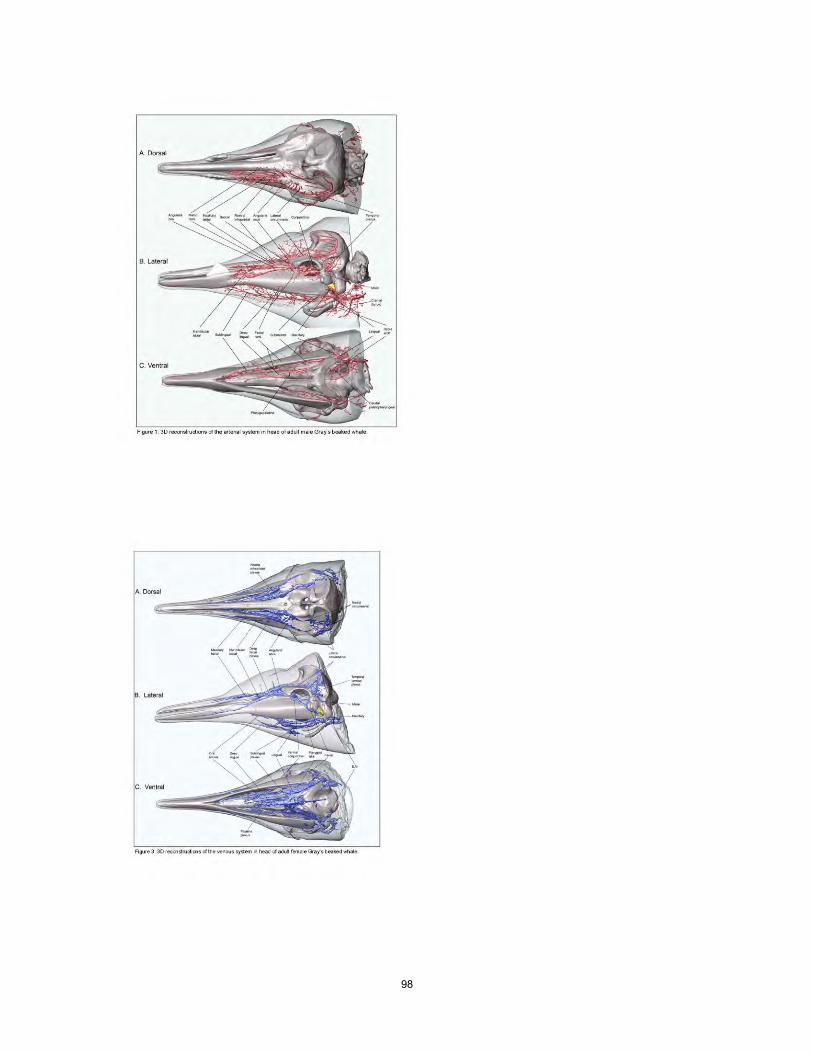
98

99
2014 Marine Mammal & Biology Program Review Sponsor: ONR Status: COMPLETED
THE METABOLIC COST OF CLICK PRODUCTION IN BOTTLENOSE DOLPHINS
Marla M. Holt, Dawn P. Noren, Robin C. Dunkin, and Terrie M. Williams
NOAA NMFS Northwest Fisheries Science Center [email protected], 206-860-3261
Background Animals often vocally respond to increased environmental noise. Studies on the energetic costs of such noise-induced vocal modification are limited in most animal taxa. To date, the only empirical data on the metabolic cost of sound production and costs of vocal modification in any marine mammal species have been collected in bottlenose dolphins during previously ONR-supported work. The previous studies focused on communicative sound production in bottlenose dolphins. There is currently no information on energy expenditure during click production in odontocetes. Captive bottlenose dolphins modify these sound types in the presence of masking noise during echolocation tasks. Given that changes in acoustic behavior in response to noise have been documented in several species, assessing the biological significance of these vocal changes is paramount, but this task is also very difficult, given the life histories of marine mammals. Data on the energetic cost of click production in dolphins from the current study can be used to assess the biological significance of vocal compensation in response to noise and to inform inputs into the models that aim to address the biological significance of anthropogenic sound exposure in marine mammals, such as PCAD/PCoD. Objectives The objective of this study was to measure oxygen consumption during click production in bottlenose dolphins to determine the metabolic cost of sound production during echolocation. The metabolic cost of click production was also compared to resting metabolic rates (RMR), the metabolic cost of producing whistles and other communicative sound, and the metabolic costs of other activities. Methods The metabolic cost of click production was measured in two captive male Atlantic bottlenose dolphins (Tursiops truncatus) maintained at the University of California, Santa Cruz, Long Marine Laboratory. The individuals were trained to rest and produce clicks on command while stationed under a metabolic hood to measure oxygen consumption. Each trial consisted of the following consecutive periods: (1) a 10 min baseline resting period at the surface, (2) a sound production period which consisted of a 1 min continuous click bout while submerged, a 15 sec break at the surface and another 1 min continuous click bout while submerged and, (3) a 10 min resting recovery period on the surface. With the exception of being submerged while clicking, the methods used to
determine metabolic rates (MRs) in the current study were the same as those used in the previous study on the metabolic cost of communicative sound production in the same subjects (Noren et al. 2013). Control trials in which the animals remained silent during all trial periods were also run in a manner that mimicked the total trial duration and submergence pattern of click production trials. Control trials were conducted to quantify the difference in MR during silent submergence and clicking submergence so that the metabolic cost of click production could be isolated. All click production trials were recorded using a calibrated suction cup hydrophone placed on the dolphin’s melon to carefully quantify a variety of click parameters for comparison of acoustic performance across trials. The received peak-to-peak sound pressure level (SPL in dB re: 1 µPa pp), duration (in µsec), inter-click interval (in msec), and received energy flux density level (EFD in dB re: 1 µPa2s, based on the 95% accumulated energy) of each click along with the cumulative energy of all clicks per trial (cEFD) were then determined using custom written routines in MATLAB. Results For Primo (Dolphin A), a total of 17 control and 25 click production trials were included in the analysis. A total of 19 and 29 control and click production trials, respectively were included in the analysis for Puka (Dolphin B). There was a significant negative relationship between the number of clicks produced and SPL, and click duration and SPL in both dolphins, although the effects were more pronounced in Dolphin A. On average, Dolphin B produced clicks with higher SPL and EFD levels with less variability among trials than Dolphin A. Across trials, the difference between the minimum and maximum value of the click cEFD level on a per trial basis was 8.0 dB re 1 µPa2s in Dolphin B compared to 20.5 dB re 1 µPa2s in Dolphin A. Assuming that the received levels recorded from the contact hydrophone are close to the true free-field source levels, SPLs are consistent with values reported for bottlenose dolphins performing echolocation tasks in tanks. The metabolic and respiratory response to submergence and click production were similar for the two dolphins, though more marked in Dolphin A. Not surprisingly, MRs decreased upon submergence during both trial types. There was a significant increase (P < 0.05) in MR above resting values during the 2 min post submergence period indicating that the dolphins increase metabolism to recover from the small oxygen debt of submergence. Because MR can vary daily due to physiological and external factors, the cost of
100
submergence and clicking is assessed as the change in metabolism, relative to baseline, for each trial. For both dolphins, the reduction in MR relative to baseline) was less while clicking during submergence, compared to the reduction in MR during silent submergence. This indicates that there is a metabolic cost to click production. However, the difference in metabolic reduction during submergence between the control and click trials was only significant for Dolphin B (P < 0.05), likely reflecting the higher energy levels of the clicks produced by Dolphin B relative to Dolphin A. There was no significant difference in the increase in MR, relative to baseline, during 2 min post submergence across the two trial types for either dolphin. Thus, the increased MR resulting from click production does not appear to extend beyond the active clicking period. Dolphin B recovered completely from the metabolic costs associated with submergence and clicking by the end of the recovery period. In contrast, Dolphin A’s MR remained slightly elevated (P < 0.05) during the recovery period of both control and click trials. Because there was no significant difference in “recovered MR” across the two trial types, it is evident that the prolonged elevation in Dolphin A’s metabolism was due to submergence, not click production. The average metabolic cost of click production alone was estimated for each dolphin according to the following equation: MCclick = 2.25 * (MRclick – MRsilent) Eq. 1 Where 2.25 is the click duration in min, MRclick is the average metabolic rate during the submerged click period in ml O2 min-1, MRslient is the average metabolic rate during the submerged silent period in ml O2 min-1, and MCclick is the metabolic cost of the click bout in ml O2. For Dolphin B, the isolated cost of producing clicks was 0.7 kcal (equivalent to approximately 0.030 small fish). The cost for Dolphin A was about half of
this cost (0.4 kcal, equivalent to approximately 0.017 small fish). The higher cost of producing clicks for Dolphin B, again, seems to be related to the higher energy levels of the clicks he produced, relative to Dolphin A. Respiration rates mirrored MRs during click production and control trials. These results demonstrate that there is a small, but measurable metabolic cost to clicking during submergence, yet this cost is negligible in diving dolphins. Metabolic rates increased linearly with increasing cumulative energy flux density levels of clicks produced per trial in both dolphins. For combined data of both dolphins, this relationship was significant (r2 = 0.4, F = 43.0, P < 0.001, n = 54) and described by the following equation: MRclick = (0.1 * cEFD) – 13.7 Eq. 2 Where MRclick is the mass-specific metabolic rate during the submerged click production in ml O2 min-1 kg-1 and cEFD is the cumulative energy flux density in dB re 1 µPa2 s. It is important to note that although MRs during click production increase with the cumulative energy level of the clicks produced, the mass-specific MRs of dolphins clicking while submerged fall within the range measured for submerged dolphins that are silent. This again suggests that additional metabolic expenditure due to click production, and even exerting more effort into click production, is somewhat negligible in submerged dolphins. Empirical data collected from this study illustrate that there is a very small metabolic cost of click production in bottlenose dolphins that is related to the energy content of the signals produced. Overall, the metabolic cost of click production appears to be considerably smaller than the metabolic cost of communicative signal production and is negligible to the total energetic demands of diving and swimming in bottlenose dolphins.
Notes: