Embed Size (px)
Citation preview

Isolation and characterization of antibacterial and
antioxidant compounds present in Combretum
collinum subspecie suluense
M.Sc. (Chemistry)
TE Ramurafhi
2011
Isola
tion
an
d ch
ara
cterizatio
n o
f an
tibacteria
l an
d a
ntio
xid
an
t com
pou
nd
s presen
t in C
om
bretu
m co
llinu
m su
bsp
ecie
sulu
ense
TE
Ram
ura
fhi
2011
sulu
ense

ii
DECLARATION
I declare that the chemistry dissertation
hereby submitted to the University of
limpopo, for the degree of Master of
chemistry in phytochemistry has not
previously been submitted by me for a
degree at this of any other university; that is
my work in design and in execution, and that
all material contained herein has been duly
acknowledged.
________________ ____________
Initials & Surname(Title) Date
Student Number: 210437860
Isolation and characterization
of antibacterial and
antioxidant compounds
present in Combretum
collinum subspecie suluense
by
THINASHAKA EPHRAIM
RAMURAFHI
RESEARCH DISSERTATION
Submitted in fulfilment of the
requirements for the degree of
MASTER OF SCIENCE
in
Chemistry
in the
FACULTY OF SCIENCE AND
AGRICULTURE
School of Physical and
Mineral Sciences
at the
UNIVERSITY OF LIMPOPO
SUPERVISOR: Prof SP Songca
2011
iii
Acknowledgement
I am grateful to the almighty God who has given me strength to complete this programme.
The University of Limpopo Research Committee funded this project, and also thanks
to the bursary of the University of Limpopo for the financial support and University
of South Africa library.
I am also grateful to the following people:
Prof S.P.Songca, my supervisor for his guidance towards the comple-
tion of this programme.
Prof J. N. Eloff for giving me the list of different medicinal plants to work on them.
Mr. N.F.H. Makhubela at University of Limpopo (Medunsa campus), Dr. E. Mudau at University of Pretoria (Hatfield Campus), Mr. Clement Stander at Council of Science and Industrial Research
(CSIR), for running Nuclear Magnetic Resonance (NMR), and Infra-red (IR), mass spectra respectively.
Phytomedicine students at University of Limpopo for their invaluable assistance and encouragement.
University of Pretoria (Hatfield campus) for providing use of instrumen-tal laboratory.
University of Limpopo (Medunsa campus) for financial assistance.
Department of Chemistry and Biochemistry for sponsoring the project.
University of South Africa for allowing me to use the library
Family, especially my mother for love, prayers and encouragement.
Friend, Mutshinyalo Nwamadi for his superb support and encourage-ment

iv
Table of contents
Cover page i Student name i
Declaration ii
Acknowledgement iii
Table of contents iv
Introduction v
Material and Methods vi Purpose of the research vi
Results and Discussion vii
Conclusion viii Reference viii
List tables ix
List figures xi
List of abbreviation used xiv Abstract xvi

v
Chapter 1
1. Introduction
1.1 Overview 1 1.2 Informant Consensus Factor (ICF) for category of ailments and fidelity
Level of medicinal plants 1
1.3 Secondary plant metabolites 2 1.4 Alkaloids 4
1.5 Stilbenes, phenanthrenes, terpenoids and steroids 5
1.6 Saponins 8 1.7 Combretaceae 14
1.7.1 Combretum collinum sub specie suluense 14
1.7.2 Combretum bracteosum 18 1.7.3 Combretum apiculatum 19
1.7.4 Combretum zeyheri 20
1.8 Calpurnia aurea 22
1.9 Ficus ingens 26 1.10 Filicium decipiens 28
1.11 Adina microcephala var.galpinii 30
1.12 Introduction of bacteria used 31 1.13 Isolation of compounds by preparative thin-layer chromatography 32
1.14 Column chromatography 33
1.15 Antioxidant activities 34 1.16 Antioxidant due to free radical scavenging 35
1.17 Structural elucidation by mass spectrometry 36
vi
1.18 Infrared spectroscopy 38
1.19 p-Iodonitrotetrazolium violet (INT) reaction 39
Chapter 2 Materials and Methods
2.1 Plant collection 41
2.2 Plant drying and storage 41
2.3 Extraction 41 2.4 Antimicrobial activity 42
2.4.1 Chromatogram development 42
2.4.2 Bacterial cultures 42 2.4.3 Bioautographic method 42
2.4.4 Minimum inhibitory concentration determination 43
2.5 Screening of antioxidant compounds 43 2.6 The instruments used 43
Chapter 3 Purpose of the research
3.1 Problem statement 45
3.2 Aim 45 3.3 Objectives 46
vii
Chapter 4
Results and discussion 4.1 Extraction for preliminary screening 47
4.2 Preliminary screening of medicinal plants 47
4.3 Serial extraction 51
4.4 Preparative thin layer chromatography (PTLC) 52 4.5 Scrapped layers 53
4.6 Thin layer chromatography 54
4.7 Chromatogram investigation 54 4.8 Bioautography 55
4.9 Antioxidant activity 56
4.10 Summary of the extraction process 57 4.11 Retardation factor (rf) value 57
4.12 Minimum inhibitory concentration 59
4.13 Proposed structure of the isolated unknown compound from vial A 61
4.14 1HNMR analysis of unknown compound from vial A 64 4.15 FTIR analysis of unknown compound from vial A 66
4.16 GC-MS fragmentation results of unknown compound A 66
4.17 Proposed structure of unknown compound from vial E 70 4.18 1HNMR analysis of second unknown compound E 73
4.19 FTIR analysis of second unknown compound E 75
4.20 The GC-MS analysis of second unknown compound 76

viii
Chapter 5
Conclusion 5.1 Background 79
5.2 Antioxidant Activity 79
5.3 Inhibition of bacterial strain by two isolated compounds 79
Chapter 6 References 81
Tables
Table 1: Diverse chemical types of secondary metabolites 3 Table 2: Chemical characteristics of secondary metabolites 3
Table 3: Structure of alkaloids previously isolated from different plants 5
Table 4: Chemical structures of phenanthrene and dihydrophanthrene 5 Table 5: Chemical structure of 1-(2-iodo-5-methoxy)-phenyl ethanol 6
Table 6: Structure of compounds 10-15 7
Table 7: Disease treated by traditional healers using combretum species 8
Table 8: Structure of compounds 15-18 9 Table 9: Antioxidant and anticancer compounds from vegetables and fruits 10
Table 10: The structure of antioxidant and anticancer compounds 10
Table 11: The structures of anthocyanin and reservatrol compounds 12 Table 12: Saponins isolated from extracts of the dried bark of Hippocratea excel 13
Table 13: 1HNMR (400 MHz) spectroscopic data for compounds in CDCl3 14
Table 14: Some chemical compounds isolated from combretum species 18 Table 15: Compounds previously isolated from Calpurnia aurea 26
Table 16: Compounds previously isolated from Calpurnia aurea 27
ix
Table 17: Structure of chemical compounds isolated from Ficus moraceae 29
Table 18: Structure of α and γ-tocopherol 34 Table 19: Mass of extracts from a gram of each of six different plants and the
% yield of each extract 47 Table 20: Represent the names of isolated active compounds and their
retardation factor values (Rf) 59
Table 21: Summary of diluted solutions of compounds tested against Staphylococcus aureus 60
Table 22: Summary of the diluted solutions of compounds tested against Escherichia Coli 61
Table 23: 1HNMR results of compound A 64
Table 24: FTIR spectrum in (cm-1) of unknown from vial A 67 Table 25: GC-MS fragmentation unknown compound from vial A 66
Table 26: Interpretation of 1HNMR results second unknown compound 74
Table 27: FTIR spectrum results of compound E wave number in (cm-1) 76 Table 28: GC-MS fragmentation of compound E 77
Figures
Figure 1: A fresh twig of Combretum collinum sub specie suluense 15 Figure 2: Trunk of Combretum collinum sub specie suluense 16
Figure 3: A map of the distribution of Combretum collinum 16
Figure 4: Leaves and flowers of Combretum bracteosum 19 Figure 5: A branch of Combretum apiculatum 20
Figure 6: A small branches and leaves of Combretum zeyheri 21
Figure 7: Distribution map of Combretum zeyheri 22
Figure 8: A small Calpurnia aurea leaf 23
x
Figure 9: A Calpurnia aurea tree 23
Figure 10: A fruit of Calpurnia aurea 24
Figure 11: Flowers of Calpurnia aurea 24 Figure 12: Distribution map of Calpurnia aurea 25
Figure 13: Branch and fruit of Ficus ingens 28
Figure 14: Distribution map of Ficus ingens 28
Figure 15: Fern tree 30 Figure 16: A painted Adina microcephala 30
Figure 17: Distribution of A. microcephala 31
Figure 18: Conversion reaction of 1,1-diphenyl-2-picrylhydrazine to 1,1-diphenyl-2-picrylhydrazyl 35
Figure 19: Schematic representation of mass spectrometer 36 Figure 20: Equilibrium reaction of p-iodonitrotetrazolium violet red (ITVr) and
p-iodonitrotetrazolium violiox (ITVox) 40 Figure 21: Chromatogram of dichloromethane; extract against S.aureus, Fm: Ficus ingens (moreceae); Am: Adina microcephala; Fd: Filicium decipiens; Cc: Combretum collinum; Cb: Combretum bracteosum; Ca: Calpurnia aurea 48
Figure 22: Hexane extract against S.aureus: Fm: Ficus ingens (morecea); Am: Adina microcephala; Fd: Filicium decipiens;
Cc: Combretum collinum; Cb: Combretum bracteosum; Ca:Calpurnia aurea 49 Figure 23: Hexane extract against Escherichia coli 49 Figure 24: Dichloromethane extract against Escherichia coli 50
Figure 25: Acetone extract against Escherichia coli 50
Figure 26: Acetone extract against S.aureus. White zones on chromatogram indicate active compounds against bacteria. Adina microcephala, Filicium decipiens, Combretum collinum, Combretum bracteosum
, Calpurnia aurea and Ficus ingens 51
Figure 27: Graph of percentage yield extracted from Combretum collinum

xi
ssp suluense 51
Figure 28: The preparative TLC plate of 2 mm thickness was developed using hexane and ethyl acetate in 2:1 ratio 52
Figure 29: Compounds separated by thin layer chromatography from Combretum collinum using chloroform, ethyl acetate and formic acid 53
Figure 30: Shows the layers that were scrapped from the preparative layer plate. The scrapped layers are indicated from layer A-D 53
Figure 31: The compounds which were on the thin layer chromatography plate were placed under the uv light at 254 nm to display even the invisible
compounds 55 Figure 32: Bioautograms of acetone extract of Combretum collinum sub specie
suluense 56 Figure 33: DPPH sprayed on compounds or fractions isolated from acetone
Extract 56 Figure 34: Schematic flow chart of extraction procedure of Combretum collinum
ssp suluense 58 Figure 35: Structure of unknown compound from vial A 61
Figure 36: Mass spectrum of unknown compound from vial A 62 Figure 37: 1HNMR spectrum of unknown compound from vial A from 0.7 to 1.7 62
Figure 38: 1HNMR spectrum of unknown compound from vial A from 0.7 to 3.1 63
Figure 39: 1HNMR spectrum of unknown compound from vial A from 3.6 to 5.4 63
Figure 40: Numbered structure of unknown compound from vial A 64 Figure 41: FTIR spectrum of compound A from 500 to 4000 cm-1 65
Figure 42: Structure of pollutant which masked the compound from vial E 71
Figure 43: Mass spectrum of second unknown compound from vial E 71 Figure 44: Mass spectrum of second unknown compound from vial E 72
Figure 45: 1HNMR of second unknown compound from vial E from chemical shift 3.2 to 3.9 ppm 72
Figure 46: 1HNMR spectra from the region of 7.3 to 8.4 ppm 73

xii
Figure 47: Numbered structure of compound E 73
Figure 48: FTIR spectrum of second unknown compound 75 List of abbreviation used
WHO : World Health Organization
UV : Ultraviolet light 13CNMR : Carbon-13 nuclei magnetic resonance
1HNMR : Hydrogen nuclei magnetic resonance
Ms : Mass spectrometry TLC : Thin layer chromatography
E. coli : Escherichia coli
CEF : Chloroform Ethyl acetate Formic acid INT : P-iodonitrotetrazolium violet
TDH : Threonine dehydrogenase
PLC : Preparative layer chromatography
IR : Infrared spectroscopy TMS : Tetramethylsilane
MIC : Minimum inhibitory concentration
DPPH : 1,1-diphenyl-2-picrylhydrazyl FTIR : Fourier transformation infrared spectroscopy
Hex : Hexane
Chloro : Chloroform DCM : Dichloromethane
Am : Adina microcephala

xiii
Fm : Ficus morecae Cb : Combretum bracteosum
Cc : Combretum collinum
Fd : Filicium decipiens Ca : Calpurnia aurea
Ppm : Parts per million
MHz : Mega Hertz
NADH : Reduced form of nicotinamide adenine dinucleotide
NAD : Nicotinamide adenine dinucleotide Ssp : Sub specie

xiv
Abstract
Isolation and characterization of antibacterial and antioxidant compounds present in Combretum collinum Sub specie Suluense
Leaf extracts of six different plants, many of which are used by traditional healers, were screened for antibacterial activity. Ethyl acetate and Methanol extracts of Adina microcephaha, Combretum aurea, Combretum bracteosam, Combretum collinum, Filicium decipiens and Ficus moraceae were screened. Of these acetone extracted the highest mass of 118 mg from Filicium decipiens as compared to the extracts
from the Adina microcephala, Combretum aurea, Combretum bracteosum, Combretum collinum and Ficus decipiens. Two unknown compounds were isolated, characterized
and their minimum inhibitory concentrations were determined; compound A = 0.5689 mg/ml and compound E = 1.479 mg/ml. The chemical structure proposed for unknown compound A from Combretum collinum subsp suluense was determined by
correlation of HNMR, FT-IR and GC-MS data. The chemical structure of compound E was not proposed because it was masked by a phthalate pollutant, the structure of which was confirmed by correlation of GC-MS, FT-IR and 1HNMR data.
O
O
O
O
Proposed structure of compound from vial A Proposed structure of phthalate pollutant
O
1
CHAPTER 1
Introduction
1.1 Overview
Traditional medicine based on plant-derived remedies is the primary source of relief
from a variety of diseases in Southern African cultures, it should be promoted,
investigated and its potential developed for wider use and benefit to mankind (WHO,
1978). Primary health care has been adopted by all WHO member states, including
those in the African continent, as the appropriate strategy, for developing national
health systems (Akerele, 1988). In South Africa, about 60-80% of the population
relies on medicinal plants to treat various illnesses (Hutchings &Van Staden, 1994).
In South Africa, traditional medicine is not yet fully accepted in the mainstream
primary health care system. For its full acceptance, the chemical contents in the
medicines, the safety of the preparations and their quality must be investigated and
thoroughly validated to comply with the Medicines and Related Substances (MRS)
Act 101 of 1965.
1.2 Informant Consensus Factor (ICF) for category of ailments and
fidelity level of medicinal plants
The Informant Consensus Factor (ICF) is a formula used to estimate the use of
various medicinal plants and to determine plants which are to be further investigated
in the search for bioactive compounds. The Informant Consensus Factor is calculated
using the following formula:
ICF = nur – nt/ nur – 1 Equation 1 where nur = number of use-reports in each category and nt = number of taxa. The product of this factor ranges from 0 to 1. A high value (close to 1) indicates that relatively few taxa, usually species, are used by more people. A small value (close to zero) indicates that the informants disagree on the taxa to be used in the treatment in the group of illness (Heinrich et al., 1998a).

2
The Informant Consensus Factor (ICF) and the Fidelity Level (FL) of medicinal plants
were determined by Teklehaymanot et al. (2007). Sixty-seven medicinal plants used
as cures for 52 ailments were documented; they are distributed across 42 families
and 64 genera. The most frequently utilized plant part was the underground part
(root/rhizome/bulb) (42%). The largest number of remedies was used to treat
gastrointestinal disorders and parasitic infections (22, 8%) followed by external
injuries (22, 1%). The administration routes were orally (51, 4%), externally (38,
6%), nasal (7, 9%) and in the ear (2, 1%) (Teklehaymanot et al., 2007).
Several plants e.g. Acokanthera schimperi and Calpurnia aurea have so far been
tested for anti-bacterial properties(Asfaw et al., 1993). Hydro alcoholic extracts of
eight species of medicinal plants, namely Acokanthera schimperi (Apocynaceae),
Combretum aurea (Leguminosae), Lippia adoensis (Verbenaceae), Malva parviflora
(Malvaceae), Olinia rochetiana (Oliniaceae), Phytolacca dodecandra (Phytolaceaceae)
and Verbascum sinaiticum (Scrophulariaceae), traditionally used in the treatment of
various skin disorders were screened for antimicrobial activity against different
strains of bacteria and fungi, known to cause different types of skin infections
(Asfaw et al., 1993).
1.3 Secondary plant metabolites
Primary metabolites are present in every living cell capable of mitosis. Secondary
metabolites are present only incidentally and are not for plant life. They are used by
humans for medicinal, nutritive and cosmetic purposes (Kossel; 1891). Plants release
secondary metabolites depending on the environmental conditions they are exposed
to. It has been postulated that African plants, which are exposed to harsh conditions
such as infections, herbivory foraging and competition are the best candidates for
potential anti-infection drugs (Geissman et al., 1963). Secondary metabolites use the
availability of hydroxyl (–OH), amino (-NH2) and thiol (–SH) groups, as well as
aromatic nuclei and unsaturated aliphatic chains for antioxidant and antiradical
activity (Edreva et al., 2008). Secondary metabolites such as flavonoids, terpenoids
and other volatile compounds give colour and scent for attraction or repulsion of

3
herbivores to encourage or prevent them from eating those plants (Hadacek, 2002)
(table 1). Carotenoids are the best candidates to protect lipophilic surfaces such as
membranes (Dixon et al., 2002) (table 9). An ortho-dihydroxy substitution in the B-
ring of anthocyanins, pontentiating its antioxidant capacity was proposed as a
protective mechanism in a physiological leaf reddening disorder of cotton due to
oxidative stress caused by Na+/K+ imbalance (Edreva, 2005).
Table 1: Diverse chemical types of secondary metabolites (Edreva et al., 1998)
# Chemical types Formulae Representatives
1 Hydroaromatic
Terpenoids
2 Heterocyclic
Flavonoids
Table 2: Chemical characteristics of secondary metabolites (Edreva et al., 1998)
characteristics Interactions Functions
Availability of electrical charge Electrostatic Structure-stabilizing
Presence of –COOH,
-OH, -NH2
Covalent bonding; Polymerisation,
Condensation, Complexation
Structure-stabilizing
(Cellwall-strenghtening) Antimicrobial
(blocking of active sites) Hypersensitive
response (HR)
Availability of conjugated
double bonds (delocalized π-electrons)
Light and UV-absorbance.
Energy dessipation
Photoprotective
Availability of –NH2,
–SH, –OH
-CH=CH-CH=CH-
(Unsaturated carbon chains)
H and electron transfers Antioxidant. Antiradical
O O
O
O
OH
OOH
HO
OH
OH
OH
OH
OH
OH

4
1.4 Alkaloids
Alkaloids have been of interest to chemists for nearly two centuries, and in that time
thousands of alkaloids have been isolated. Extracts from the bark, root, leaves,
berries, and fruits often produce nitrogen containing bases called alkaloids. These
compounds are ’alkali-like’’, hence the name alkaloids. Hence alkaloids are mostly
amines. They can react with acids to yield soluble salts (Solomons, 1996). The
nitrogen atoms of most alkaloids are present in heterocyclic rings. In a few
instances, however, nitrogen may be present as a primary or secondary amine or as
a quaternary ammonium group. In animals, most alkaloids produce striking
physiological effects that vary greatly. Some alkaloids stimulate the central nervous
system; others cause paralysis; while some modulate blood pressure (Southon &
Buckingham, 2003). Others act as pain relievers, and antimicrobials (Goodman &
Morehouse, 1973). For instance, berberine, an important representative of the
alkaloid group, is effective against Trypanosomes and plasmodia bacteria. Berberine
was isolated from Alchornea cordifora (Omulokoli et al., 1997) and structure of
berberine is shown on table 3. Most alkaloids are toxic at high doses, although with
some this toxic dosage is very low. Despite the toxicity, many alkaloids are used in
medicine. Most of these have had their structures determined through the
application of chemical and physical methods, and in many instances these
structures have been confirmed by independent synthesis. Compound 3 from table 3
was isolated from Conium maculatum, a member of the carrot family. Compound 4
from table 3 was isolated from Erythroxylon coca (Solomons, 1996). Both of these
compounds are alkaloids well known for their effects in stimulating the central
nervous system. Cocaine is a banned substance the world over.
5
Table 3: Structure of alkaloids which have been previously isolated from different plants (Solomons, 1996; Cho,
1990).
# Structure Name Reference
3
Coniine Solomons, 1996
4
Cocaine Solomons, 1996
5
Berberine Cho, 1990
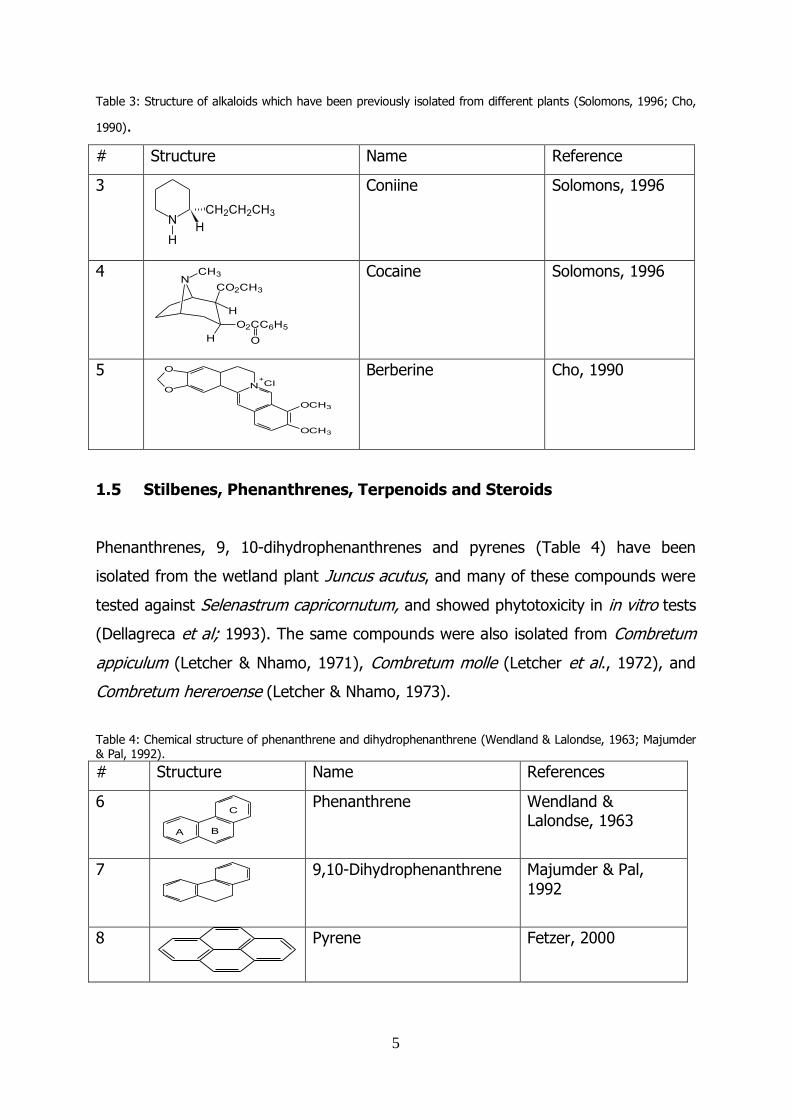
1.5 Stilbenes, Phenanthrenes, Terpenoids and Steroids
Phenanthrenes, 9, 10-dihydrophenanthrenes and pyrenes (Table 4) have been
isolated from the wetland plant Juncus acutus, and many of these compounds were
tested against Selenastrum capricornutum, and showed phytotoxicity in in vitro tests
(Dellagreca et al; 1993). The same compounds were also isolated from Combretum
appiculum (Letcher & Nhamo, 1971), Combretum molle (Letcher et al., 1972), and
Combretum hereroense (Letcher & Nhamo, 1973).
Table 4: Chemical structure of phenanthrene and dihydrophenanthrene (Wendland & Lalondse, 1963; Majumder & Pal, 1992).
# Structure Name References
6
Phenanthrene Wendland & Lalondse, 1963
7
9,10-Dihydrophenanthrene Majumder & Pal,
1992
8
Pyrene Fetzer, 2000
N
HH
CH2CH2CH3
N
H
O2CC6H5
H
CO2CH3
CH3
O
O
ON
OCH3
OCH3
+Cl
A B
C

6
The extensive use of medicinal plants by phytomedical scientists and traditional
healers, who rely on plants for medicines and research material, has caused fear
among botanists that the plants might be utilized to extinction. These days however,
chemists and pharmacists rely on the synthesis of the drugs, they use chemical
components from the plants to identify the drug that should be synthesized. For
example 9,10-dihydrophenanthrenes and phenanthrenes were isolated from various
plants, which are already mentioned as natural compounds but now they can be
synthesized through cross-coupling of 1-(2-iodo-5-methoxy)-phenyl ethanol with
variously substituted iodobenzenes (Dellagraca et al, 2000).
Table 5: Chemical structure of 1-(2-iodo-5-methoxy)-phenyl ethanol and iodobenzene (Hirt et al., 1998; Lucas &
Kennedy, 1939).
# Structure Name Reference
8
1-(2-iodo-5-methoxy)-phenyl
ethanol
(Hirt et al., 1998)
9
Iodobenzene
(Lucas & Kennedy,
1939)
The synthetic derivatives of phenathrene, bearing a hydroxy or a methoxy group at
position 2 and a methyl group in the C ring, were tested against green algae
Selenastrum capricornutum (table 4). All compounds except 2-methoxy-7-
methylphenanthrene, caused inhibition of algal growth by more than 70% at the
concentration of 10-4 M, and many of them retained this strong activity even at the
lower concentration of 10-5 M (Dellagraca et al, 2000).
Steroids are a class of fat soluble compounds with a basic 17-carbon atom structure,
arranged into 4 rings (table 8) (Skoda-foldes & Takaes, 2008). According to
Majumder and Pal (1990) a steroidal compound of biogenetic importance was
isolated from the orchid Coelogyne uniflora and identified to be 24-ethyl-4α,14 α,24-
trimethyl-9β,19-cyclo-cholest-25-en-3 βyl cis-p-hydroxycinnamate.
O
H3C
OH
I
I

7
Table 6: Structures of compounds 10 – 15 (Majumder & Pal, 1990; Langkilde et al., 1994; Moretti et al., 1986; Rogers & Verota, 1996)
# Structure Name Reference
10
24-ethyl-4α,14α,24-trimethyl-9β,19-cyclo-cholest-25-en-3-βyl-cis-p-hydroxycinnamate
(Majumder & Pal, 1990)
11
stilbene (Langkilde et al., 1994)
12
The quassinoid 13,18-dehydro-6α-senecioyloxychaparrin
(Moretti et al., 1986)
13
quassinoid 12-dehydro-6α-senecioyloxychaparrin
(Moretti et al., 1986)
14
The triterpenoid squalene (Rogers & Verota, 1996)
Carr and Rogers (1987) confirmed the presence of triterpenoids (compound 14,
table 6) and flavanoids in the leaf extract of several Combretum species. More than
30 quassinoids for example (compound 12-13) Table 6 have been isolated from the
seeds of Brucea javanica and are used in Chinese traditional medicine for the
treatment of dysentery, malaria and cancer (Long-ze Lin et al., 1990).
O OHO
O
O
O
O
HO
OHHO
OH
O
O
O
O
O
HO
OHHO
O
O

8
Eloff et al (2005) found stilbene (compound 11, table 6) to have antibacterial
activities and most stilbenes were isolated from the seeds of Combretum kraussii
and Combretum woodii. 2, 3, 4-trihydroxyl-3, 5, 4-trimethoxybibenzyl is an example
of a stilbene that was isolated from the seeds of Combretum kraussii. A 2,3,4-
trihydroxyl-3,5,4-trimethoxybibenzyl was tested against Pseudomonas aeruginosa,
Staphylococcus aureus, and against Escherichia coli and showed activity against
Staphylococcus aureus and lower activity against Escherichia coli and Pseudomonas
aeruginosa (Eloff et al., 2005). Several stilbenes with cytotoxic activity as well as
acidic triterpenoids and their glycosides with molluscicidal, antifungal, antimicrobial
and anti-inflammatory activity have also been isolated from species of Combretum
(Rogers & Verotta, 1996).
Table 7: Diseases treated by traditional healers using Combretum species (Hutching et al., 1996; Gelfand et al.,1985; Van et al., 1997; Watt, 1996). Species Traditionally used to cure References
Combretum appiculam Snake and scorpion bite, bloody diarrhoea, leprosy, abdominal disorders, conjunctivitis and weak body.
Hutching et al., 1996
Combretum erythrophyllum Fattening tonic for dogs, to reduce the size of the vaginal orifice.
Gelfand et al., 1985
Combretum hereroense Bilharzia, headache, infertility in women. Van et al., 1997
Combretum molle Hookworm, stomachache, snakebite, leprosy, fever, dysentery, chest complaints and as an antihemintic.
Watt, 1996
Combretum zeyheri Toothache, cough, scorpion bite, bloody diarrhoea, arrest menstrual flow, eye lotion, embrocating and abdominal disorders.
Hutching et al., 1996
1.6 Saponins
Saponins are a class of chemical derivatives of many secondary metabolites found in
many plant species. They are amphipathic glycosides characterised by soap-like
foaming produced when shaken in aqueous solutions and structurally by their
hydrophilic glycoside moieties combined with a lipophilic residue (Baker, 2009).
They are contained in numerous herbal remedies and are anticancer agents and ion
channel-blockers (Luisella Verotta & Nadia, A.E, 2001). Saponins have a range of
biological and pharmacological activities such as immunomodulation and anticancer

9
activities (Hostettmann& Marston., 1995). A plant glycoside saponin dioscin
(compound 16, table 8) was isolated from the roots of Polygonatum zanlanscianense
and was shown to induce apoptosis in a number of human cell lines (Liu et al., 2004;
Cai et al., 2005).
Table 8: Structure of compounds 15 - 18.
# Structure Name Reference
15
The triterpenoid lanosterol (Jossang, 1996;Cáceres-Castillo et al., 2008)
16
The saponin dioscin (Wang et al., 2007)
18
cholesterol (Wilczura-wachnik et al., 2008)
Potter et al (1979) found that saponins from soya beans have the ability to lower
cholesterol by forming emulsion or micelles with bile salt in the intestine. Bile salts
form small micelles with cholesterol facilitating its absorption and some saponins
form insoluble complexes with cholesterol resulting in inhibition of the absorption of
cholesterol.
HO
O
O
CH3
H3C
O
O
HOH2C
O
OHO
CH3
OH
OH
OH
OOH
OH
OH
H3C
HO
H H
H

10
Colon cancer is known to display a histologic range from normal colonic mucosa
through increasingly forceful adenomas to envelop carcinoma (Kinzler &
Vogelstein,1996). Even though hyperplasia is observed through carcinoma diseases
in the breast cancer, the pattern of molecular change and biological behavior
suggests a more complex etiology than colon cancer. Specific genetic unsteadiness is
seen in some breast laceration at early stages (Dairkee & Smith, 1996).
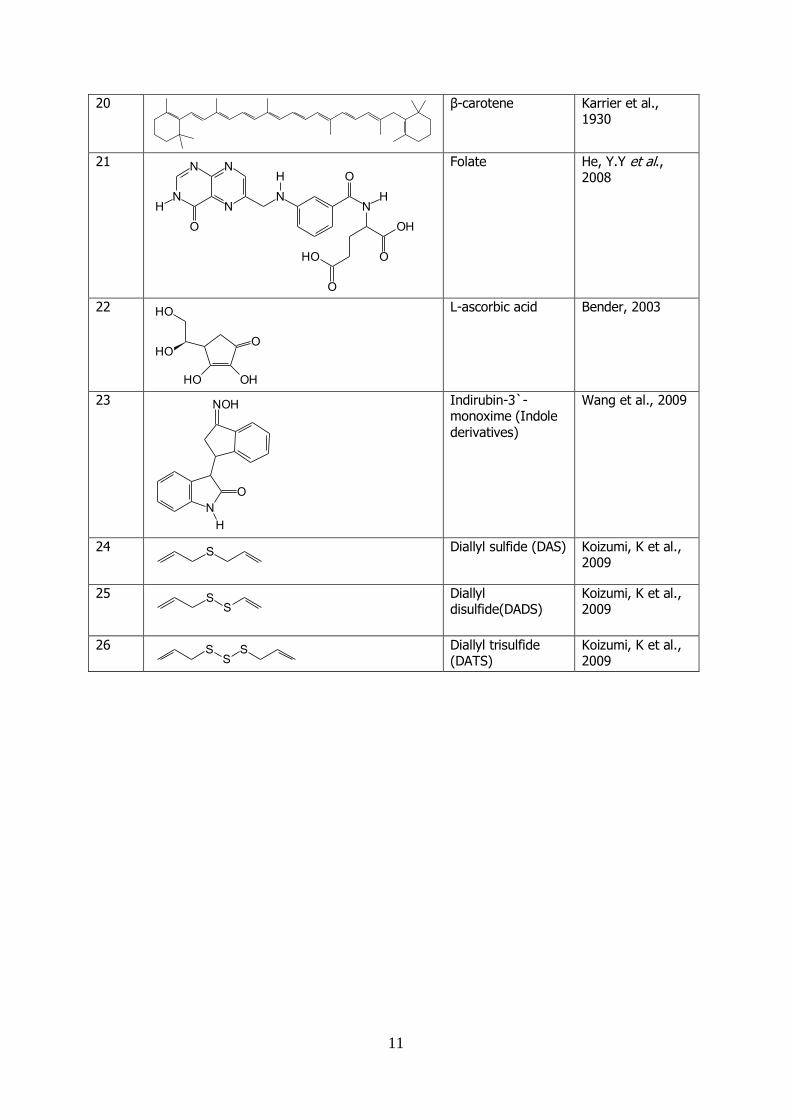
Fresh garlic has antioxidants (compounds 24-26; Table 9 & 10) that can protect
against cardiovascular diseases reducing risk factors for heart attacks, stroke and
blood pressure (Borek, 2001). It also increases circulation in capillaries and prevent
clot-forming platelet activity and inflammation. The antioxidant compounds from
fresh garlic have anti-cancer activity that protects against free radical and
carcinogen induced DNA damage and increases carcinogen detoxification and also
prevents the growth of a wide variety of human cancer cells including breast; colon
and prostate colon cancer (Pinto et al., 2000).
Table 9: Antioxidant and anticancer compounds from vegetables and fruits (Cancerproject.org, 2009)
Colours Foods Protective
substances
Structures Possible action
Red Tomatoes and tomato product as well as water melon and guava
Lycopene 19 Antioxidant and also cuts prostate cancer risk
Orange Carrots, yams, sweet potatos, mangos and pumpkins
Beta-carotene 20 Support immune system and has power antioxidant
Green Spinach, kale, collard and other greens
Folate 21 Builds healthy cells and genetic material
Yellow-orange
Orange, lemons, grapefruits, papayas and peaches
Vitamin C and flavonoids
22 Tumor cell growth inhibitor and detoxify harmful substances
Green-white
Broccoli, brussels sprout, cabbage and cauliflower
Indoles 23 Eliminate excess estrogen and carcinogens
White-green
Garlic, onions,chives and asparagus
Allyl sulfides 24 - 26 Destroy cancer cells
Blue Blueberries, purplegrapes, plums
Anthocyanins 27 Destroy free radicals
Red-purple
Grapes, berries, plums
Reservatrol 28 May decrease estrogen production
Table 10: The structures of compounds that have antioxidant and anticancer activity
# Structure Name References
19
Lycopene Rozzi et al., 2002
11
20
β-carotene Karrier et al., 1930
21
Folate He, Y.Y et al., 2008
22
L-ascorbic acid Bender, 2003
23
Indirubin-3`-monoxime (Indole derivatives)
Wang et al., 2009
24
Diallyl sulfide (DAS) Koizumi, K et al., 2009
25
Diallyl disulfide(DADS)
Koizumi, K et al., 2009
26
Diallyl trisulfide (DATS)
Koizumi, K et al., 2009
N
N N
N
O
N
H
H N
O
HO
O
H
OH
O
O
OHHO
HO
HO
N
NOH
O
H
S
SS
SS
S

12
Table 11: The structures of anthocyanins and reservatrol compounds (Castanẽda-ovando et al., 2009; Bishayee etal., 2009)
# Structure Name References
27
General structure of anthocyanines. Where R1 to R7 can be either H or OH and different anthocyanine derivatives is obtained depending in the position of H or OH
Castanẽda-ovando et al., 2009
28
Trans-resveratrol Bishayee etal., 2009
Epidemiology and clinical laboratory studies have shown that crushed garlic and their
active compounds such as diallyl sulfide (DAS) and diallyl disulfide (DADS) as well as
diallyl trisulfide (compounds 24-26; Table 10) give biological activities including
antitumorigenesis, antiatherosclerosis and also blood sugar modulation and antibiotic
activity (Milner, 2001; Siege et al, 2004).
OR4
R3
R2
R1
R5
R6
R7
OH
OH
HO

13
Table 12: Saponins isolated from extracts of the dried bark of Hippocratea excels (Cáceres-Castillo et al., 2008) # Structure Name References
29
11-β, 21-β-dihydroxy-olean-12-ene-3-one
Cáceres-Castillo et al., 2008
30
3α,11α,21-β-trihydroxy-olean-12-ene
Cáceres-Castillo et al., 2008
31
3α,21β-dihydroxy-11α-methoxy-olean-12-ene
Cáceres-Castillo et al., 2008
32
3α,21β-dihydroxy-olean-9(11)-1,2-diene
Cáceres-Castillo et al., 2008
33
3α,21β-dihydroxy-olean-12-ene Cáceres-Castillo et al., 2008
34
3α,21β-dihydroxy-11- α-methoxy-urs-12-ene
Cáceres-Castillo et al., 2008
OH
O
HO
OH
HO
HO
OH
HO
H3CO
OH
HO
OH
HO
H
O
O
H3CO O
O

14
35
105
1
29
6
12
13
15
16
19
22
21
O
23 24
25 26
28
27
3029
OH
11-β, 21-β-dihydroxy-olean-12-ene-3-one
Cáceres-Castillo et al., 2008
Table 13: 1HNMR (400 MHz) spectroscopic data for compounds (33-34) in CDCl3 (Cáceres-Castillo et al., 2008). H 29a 30 31 32 33 34 35
1 1.41 m, 1.90 m 1.65, 1.85 m 1.60, 1.77 m 1.54, 1.67 m 1.60, 1.80 m 1.90, 1.95 m 1.53, 1.66 m
2 2.36 ddd (16, 6.8, 3.7) 2.40, 2.55 m 1.60, 1.98 m 1.53, 1.97 m 1.66, 2.00 m 1.52, 1.95 m 1.58, 1.90 m
2.55 ddd (16, 11, 7.3)
3 3.42 brs 3.40 brs 3.42 brs 3.41 t (2.4) 4.61 brs
5 1.33 m 1.37 m 1.30 m 1.27 m 1.32 m 1.32 m 1.27 m
6 1.48, 1.55 m 1.05, 1.52 m 1.40, 1.47 m 1.40, 1.47 m 1.52 m 1.40, 1.47 m 1.40, 1.47 m
7 1.35, 1.52 m 1.34, 1.52 m 1.27, 1.53 m 1.25, 1.53 m 1.36, 1.70 m 1.30, 1.53 m 1.30, 1.56 m
9 1.65 dd (11.5, 6.3) 1.96 m 1.68 m 1.83 m 1.69 m 1.78 m
11 1.88, 1.97 m 4.54 dd (9.6, 3.2) 4.21 dd (8.2, 3.8) 3.88 dd (9, 3.5) 5.61 d (5.8) 1.86, 1.87 m 3.77 dd (8.8, 3.2)
12 5.24 t (3.5) 5.50 d (4) 5.28 d (3.4) 5.37 d (3.4) 5.54 d (5.8) 5.21 t (3.6) 5.43 d (3.6)
15 1.00, 1.76 m 1.05, 1.69 m 0.98, 1.68 m 0.97, 1.68 m 1.03, 1.85 m 0.95, 1.12 m 1.02, 1.74 m
16 1.00, 1.96 m 1.04, 1.96 m 1.03, 1.96 m 1.00, 1.96 m 1.06, 1.95 m 1.53, 1.93 m 1.15, 2.00 m
18 2.00 dd (14.8, 3.5) 2.10 dd (13.6, 3.6) 2.02 m 2.04 m 2.18 m 2.00 m 1.44 m
19 1.15, 1.75 m 1.22. 1.77 m 1.21, 1.75 m 1.22, 1.76 m 1.20, 1.75 m 1.14, 1.76 m 1.55 m
20 1.12 m
21 3.53 dd (12, 4.7) 3.52 dd (12, 4.8) 3.53 dd (11.9, 4.6) 3.53 dd (12, 4.6) 3.53 dd (12, 4.5) 3.53 dd (12.0, 4.8) 4.73 td (11.2, 3.8)
22 1.37, 1.50 m 1.36, 1.52 m 1.37, 1.50 m 1.40, 1.50 m 1.42, 1.55 m 1.35, 1.46 m 1.28, 1.80 m
23 1.10 s 1.09 s 0.97 s 0.97 s 1.00 s 0.96 s 0.92 s
24 1.06 s 1.05 s 0.87 s 0.87 s 0.87 s 0.85 s 0.86 s
25 1.07 s 1.15 s 1.08 s 1.06 s 1.20 s 0.94 s 1.09 s
26 1.01 s 1.05 s 0.99 s 0.99 s 1.12 s 0.94 s 1.03 s
27 1.14 s 1.21 s 1.23 s 1.22 s 1.01 s 1.13 s 1.18 s
28 0.88 s 0.87 s 0.87 s 0.87 s 0.93 s 0.86 s 0.86 s
29 0.97 s 0.97 s 0.98 s 0.97 s 0.95 s 0.96 s 0.93 d (6)
30 0.86 s 0.87 s 0.87 s 0.88 s 0.89 s 0.86 s 0.96 d (6)
The positions 1-30 are shown in structure 35 in table 13.
1.7 Combretaceae
The family Combretaceae consists of 18 genera with the largest genus, Combretum
composed of about 370 species whereas Terminalia has about 200 species
(Lawrence, 1951). Terminalia are commonly and widely distributed throughout
western and southern Africa (Rogers and Verotta, 1996). The Combretaceae which
has the greatest variations with as many as 11 subspecies in the taxon presents a
major taxonomic challenge (Okafor, 1967). According to Carr (1988) only three
subspecies are currently recognized in South Africa namely gazense, suluense, and
taborense.

15
1.7.1 Combretum collinum subspecie suluense
Figure 1: A fresh twig of Combretum collinum ssp suluense (Neilspruit National botanical garden)
Traditional healers throughout southern Africa employ species of Combretaceae and
use them for many medicinal purposes, which include the treatment of abdominal
pains, backache, chest coughs, colds, conjunctivitis, diarrhoea, dysmenorrheal,
earache, fever, headache, hookworm, infertility in women, leprosy, pneumonia,
scorpion and snake bite, swelling caused by mumps, syphilis and general weakness
(Watt & Breyer-Brandwijk, 1962). According to Njoroge and Bussmann (2006),
Traditional healers use Combretum collinum to manage throat and nose diseases in
central Kenya.
According to Katende (1995) Combretum collinum subspecies suluense is a medium-
sized, thickly leafy deciduous tree, about 6-15 m high, is found mostly in Bushveld
on granite. It has a stem or multi-stem which is rough, the bark is pale and grayish-
brown, and young branches are covered with brown hairs (Neilspruit National
botanical garden).
Schmidt et al (2002) reported that leaves are opposite and often elliptic to obovate
(70–250 x 30-100 mm), they are hairless except in the pockets below the axils of
the vein and along the midrib. New leaves are hairy and densely covered in scales.
Below the leaf, there is a petiole which is 25 mm long.

16
Figure 2: Trunk of Combretum collinum ssp suluense (Neilspruit National botanical garden)
Flowers are small, yellow-white, borne on spikes and 50-80 mm long from axils of
leaves and they grow during August to November. Its fruit is 4-winged about 35-45
x 30-50 mm large, light to dark reddish-brown. The wings are grayish or plum-
coloured and covered in hairs and borne in hanging clusters from January to April
(Schmidt et al., 2002). Fruit can be stored for only a short period, but seed storage
practice is orthodox, and they can be stored up to 3 years (Hong et al., 1996).
Figure 3: A map of the distribution of Combretum collinum (Theodora.maps, 2009).
The latin word collinus meaning growing on a hill (Katende, 1995). Combretum
collinum subspecie suluense is distributed tropically, from South Africa to Namibia,
Botswana, Zimbabwe, Mozambique, Lowveld of Limpopo Province, Mpumalanga,
Swaziland and into northern Kwazulu-Natal (Katende, 1995).

17
According to Storrs (1995), Combretum collinum occurs at medium to low altitudes
in open woodlands; it is found throughout Zambia and is locally a common tree in
Baikiaea forest margins, deciduous thickets, and Kalahari and Lake Basin Chipya
woodland. It is occasional on anthills, in Miombo woodlands, and in the dry,
evergreen forests, outside Zambia, it is widespread, extending from Senegal to east
Africa and south to Natal and also westwards to Angola. They are dominant
wherever they occur.
According to Hedberg et al (1982), Combretum collinum has various medicinal uses
in African traditional medicine; the roots are used together with bark and roots of
Kigelia Africana for the treatment of excessive menstrual bleeding. The hot water
extract from the same plant is used for the treatment of diarrhoea and anal
bleeding. Haerdi (1964) found that Traditional healers prescribed the hot water
extract from leaves and roots to the patient to drink, as the treatment of malaria.
Investigation by Kokwaro (1976) showed that patients who suffer from snakebites
chew the roots of Combretum collinum as treatment. Adjanouhoun et al (1986)
reported that three spoons of decoction vapour of leaves are used for the treatment
of malaria; however no antimicrobial activity has been reported so far. Some
compounds from Combretum species have shown anti-inflammatory, antihelmintic,
antibilharzia and anti-DNA damaging. Significant activity in more than one bioassay
was exhibited by Combretum apiculatum, Combretum hereroense, Combretum molle
and Combretum mossambicense (MacGaw et al., 2001).
Combretum collinum is one of the trees that produce a mean charcoal kiln efficiency
of 23%. Most of the industrial wood energy is consumed by small-scale industries
which include food processing industries and service sectors such as brewing, fish
smoking, salt production, baking, restaurants, schools, hospitals, vending, agro-
processing industries such as tobacco curing, tea drying and bees wax processing
and production of building materials such as burnt bricks, lime, pottery and
ceramics. These industry and domestic activities which rely upon wood energy

18
provide employment and income for rural people particularly during off-season in
agricultural production (Monela & Kihiyo., 1998).
Table 14: Some chemical compounds isolated from Combretum species (Pegel & Rogers, 1985).
# Structure Name References
36
1α-hydroxycycloartenoid (mollic acid)
(Pegel & Rogers, 1985).
37
3β-D-Xyloside (Pegel & Rogers, 1985).
38
α-arabinoside (Pegel & Rogers, 1985).
39
glucoside (Pegel & Rogers, 1985).
40
β-D-xyloside tetraacetate (Pegel & Rogers, 1985).
The cycloartenoid 30-carboxy-1α-hydroxycycloartenol (Mollic acid) and its 3β-o-
arabinoside, glucoside, xyloside derivatives have been isolated from Combretum
molle, Combretum moggii, Combretum edwardsii and the South American species
Combretum leprosum (Pegel et al., 1985; Rogers et al.,1986).
These were secreted from the epidermal trichomes which were present in all species
of the subgenus Combretum (Stace, 1969). The triterpenoid and trichome have been
found to be species specific (Carr et al., 1987; Stace, 1969). Recent evidence
suggests that there is a bifurcation in triterpenoid biosynthesis within the genus
CO2H
HO
OH
CO2H
O
OH
O
OHHO
HO
CO2H
O
OH
OHO
OH
OH
CO2H
O
OH
O
HO
OH
OH
CO2H
O
OAc
OCOCH3
HOHO
O
19
Combretum with species producing compounds with a 30-carboxy-1α-
hydroxycycloartane skeleton (Rogers et al., 1996). So far, no compounds from
Combretum collinum sub species suluense have been reported.
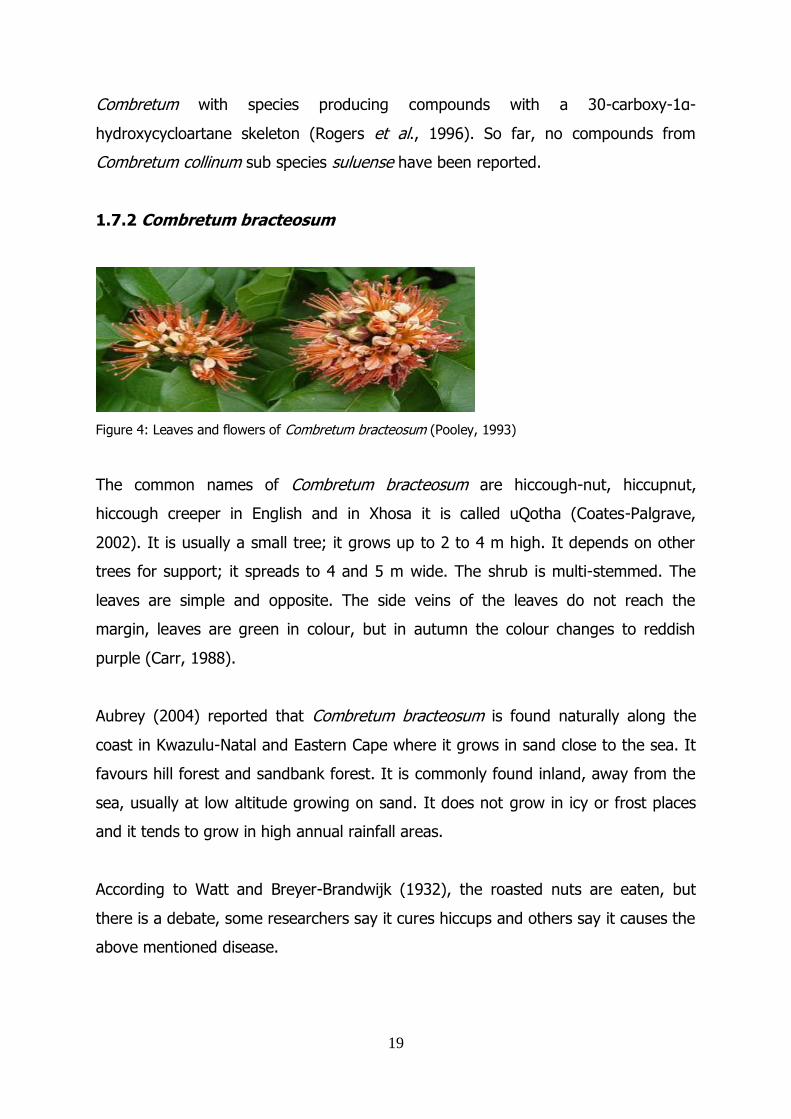
1.7.2 Combretum bracteosum
Figure 4: Leaves and flowers of Combretum bracteosum (Pooley, 1993)
The common names of Combretum bracteosum are hiccough-nut, hiccupnut,
hiccough creeper in English and in Xhosa it is called uQotha (Coates-Palgrave,
2002). It is usually a small tree; it grows up to 2 to 4 m high. It depends on other
trees for support; it spreads to 4 and 5 m wide. The shrub is multi-stemmed. The
leaves are simple and opposite. The side veins of the leaves do not reach the
margin, leaves are green in colour, but in autumn the colour changes to reddish
purple (Carr, 1988).
Aubrey (2004) reported that Combretum bracteosum is found naturally along the
coast in Kwazulu-Natal and Eastern Cape where it grows in sand close to the sea. It
favours hill forest and sandbank forest. It is commonly found inland, away from the
sea, usually at low altitude growing on sand. It does not grow in icy or frost places
and it tends to grow in high annual rainfall areas.
According to Watt and Breyer-Brandwijk (1932), the roasted nuts are eaten, but
there is a debate, some researchers say it cures hiccups and others say it causes the
above mentioned disease.

20
1.7.3 Combretum apiculatum
Figure 5: A branch of Combretum apiculatum (Hyde & Wursten, 2009)
Wickens (1973) found that the bark of Combretum apiculum is grey to greyish black,
smooth or reticulated and leaf buds are black or dark brown. The leaves are
opposite and the lamina is sticky when young, however broadly to narrowly obovate-
elliptic or oblong-elliptic or ovate to subcircular, 3-14 cm long and 1.5-7.5 cm wide.
According to Wickens (1973), Van Wyk and Van Wyk (1997) it occurs on granitic,
rhyolitic and basaltic soils in Miombo woodland, wooded grassland and in Acacia-
Commiphora bushland, and is also found on rocky hill slopes, mostly on well-drained
soils.
Traditional healers use the hot water extracts from roots for the treatment of mental
illness. They give the patient the extract to drink and also they can bend the root
and give the patient to wear in the form of necklace as a cure of the same disease
instead of using the extract (Chhabra et al., 1989). According to Kokwaro (1976),
the roots are chewed and the sap is swallowed for the treatment of snakebite and
the water extract from roots is drunk for the treatment of scorpion sting, whereas
root decoctions are used for the treatment of leprosy and bloody diarrhoea. The
leaves are used for abdominal disorders and the stem bark is used for the treatment
of conjunctivitis (Watt & Breyer-Brandwijk, 1962).

21
1.7.4 Combretum zeyheri
Figure 6: Small branches and leaves of Combretum zeyheri (Dubinovsky & Tatiana, 2003)
This is a slender, deciduous tree reaching heights of 10-13 m, or rarely a shrub. The
bark is brown or grayish-brown. The leaves are arranged oppositely on broadly
elliptic to obovate elliptic. The leaf apex is usually rounded to obtuse. The leaves are
tomentose-pubescent. Inflorescences are unbranched axillary spikes, up to 8 cm
long. The flowers are greenish-yellow. The large fruit is sub circular to elliptic, 4-
winged, usually 6.5 cm long and 5.5-6 cm wide. It is wide, straw coloured to light
brown. The apical peg is very short or does not appear. The wings of the fruit are up
to 4 cm wide (Drummond & Coates-Palgrave, 1973).
According to Drummond and Coates-Palgrave (1973) Combretum zeyheri occurs
from Congo and Tanzania, South West Africa, Botswana, Transvaal to Natal. It
occurs in woodland, wooded grassland and Acacia-Commiphora bushland and it
prefers sandy soils, and also on termite mounds, and tolerant to high metal soil.

22
Figure 7: Distribution map of Combretum zeyheri (CIA, 2009)
Drummond and Coates-Palgrave (1973) reported that leaves of Combretum zeyheri
are burnt and its smoke is inhaled for the treatment of coughs. The water extract of
powdered leaves is drunk for the treatment Colic, and also mixed with crushed
melon seed for the treatment of rheumatism and joint pain. Decoctions of finely
ground leaves are used as the treatment of eye inflammation and conjunctivitis
(Kremniz et al., 1988). According to Kokwaro (1976), Hedberg et al (1982), Gelfland
et al (1985) and Neuwinger (2000) leaves are powdered and mixed with oil; the
mixture is applied on the area that has pain for the treatment of back pain.
Moreover the hot water extract from Combretum zeyheri is mixed with porridge to
treat diarrhoea, dysentery, and vomiting. According to Watt and Breyer-Brandwijk
(1962), powdered stem bark is placed in the vagina to arrest menstrual flow.
1.8 Calpurnia aurea
Calpurnia aurea is a small slender evergreen tree (2-4 m tall) belonging to the family
Fabaceae (Germishuizen & Meyer, 2003). According to the same author, the leaves
are compound, up to 20 cm long, each having 5-15 pairs of leaflets and a terminal
leaflet. Calpurnia aurea is one of the smaller genera of approximately 16 species,
eight of which occur in Southern Africa where they are found in the eastern and
north – eastern parts of the country.

23
Figure 8: A small Calpurnia aurea leaf (Germishuizen and Meyer, 2003).
Figure 9: A Calpurnia aurea tree (Germishuizen and Meyer, 2003).
Calpurnia is easily raised from seed sown in spring or early summer. Soaking in
hand-hot water and treating with a fungicide that combats pre- and post-
emergence damping, although not essential for germination, will increase the
number of successful seedlings. Seed germinates in 10-14 days. They must be
pricked out soon after the first pair of true leaves have developed, taking care not to
damage the taproot (Leisner, 2000). The flowers of Calpurnia aurea are bright
yellow, each about 2.5 cm long, in showy hanging bunches of 8 to 30 flowers. In
summer rainfall areas the peak flowering period is mid-late summer (Dec-Feb), but
in the winter-rainfall Western Cape, particularly during hot dry summers, they don’t
flower well in summer but start up again in the autumn. The fruit is a thin pod

24
drying light brown with a papery texture, 5-12 cm long and 0.8-1.9 cm wide,
narrowly winged on one side containing up to 8 brownish seeds (Coates, 2002).
Figure 10: A fruit of Calpurnia aurea (Germishuizen and Meyer, 2003).
Figure 11: Flowers of Calpurnia aurea (Germishuizen and Meyer, 2003).
Calpurnia aurea is the most widespread of the genus. It is found growing in the
forest, on forest margins and clearings, on hillsides or on the edge of woody kloofs
and in the bushveld. In the forest it can be a 9 to 15m tree while in the open it is
more often a shrub or small tree 2-4m tall. In southern Africa it occurs from the
Eastern Cape through Kwazulu-Natal and Swaziland to Mpumalanga, Gauteng and
Limpopo. It also occurs northwards into tropical Africa as far as Ethiopia (Palmer and
Pitman, 1972).

25
Figure 12: Distribution map of Calpurnia aurea (CIA, 2009)
Calpurnia leaves are used to treat allergic rashes (Asres et al., 1989). In East Africa,
the leaf sap is used to destroy maggots in wounds (Abebe, 2001). This plant is fast
growing and it does best in fertile, well – drained soil with plenty of water in
summer, although it is tolerant of summer drought (Coates, 2002). In South Africa,
Calpurnia leaves and powdered roots are used to destroy lice and to relieve itches.
Unspecified parts are used to destroy maggots and the leaves are used to treat
allergic rashes, particularly those caused by caterpillars (Hutchings, 1996). In
Nigeria, the seeds are used to treat abscesses. In Ethiopia it is used to treat stomach
complaints, headache, eye disease, amoebic dysentery, scabies and as an insecticide
(Asres et al., 2001). Many compounds from Calpurnia areus have been reported and
have been tested against bacteria and fungi (Asres et al., 1989). Compounds 41, 44,
45, and 46 (Table 5) has been isolated from Ethiopian Calpurnia aurea (Asres et al.,
1986).
26
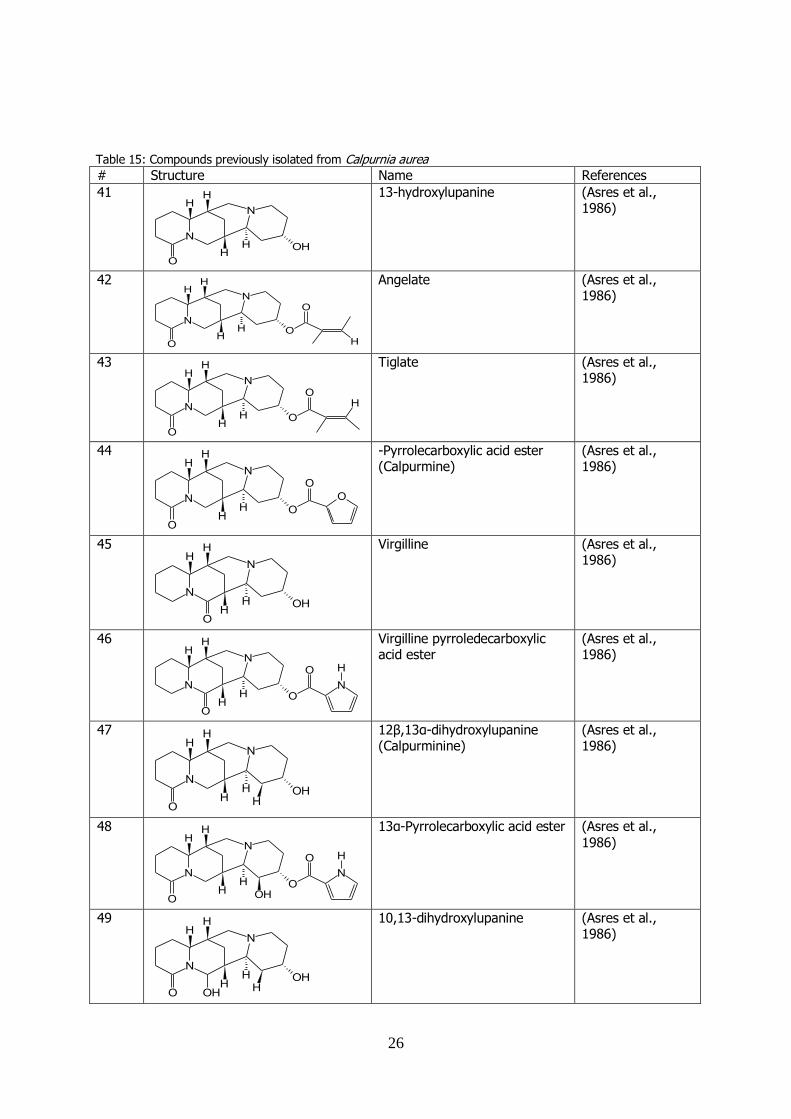
Table 15: Compounds previously isolated from Calpurnia aurea # Structure Name References
41
13-hydroxylupanine (Asres et al., 1986)
42
Angelate (Asres et al., 1986)
43
Tiglate (Asres et al., 1986)
44
-Pyrrolecarboxylic acid ester (Calpurmine)
(Asres et al., 1986)
45
Virgilline (Asres et al., 1986)
46
Virgilline pyrroledecarboxylic acid ester
(Asres et al., 1986)
47
12β,13α-dihydroxylupanine (Calpurminine)
(Asres et al., 1986)
48
13α-Pyrrolecarboxylic acid ester (Asres et al., 1986)
49
10,13-dihydroxylupanine (Asres et al., 1986)
N
N
OH
O
HH
HH
N
N
O
O
HH
HH
O
H
N
N
O
O
HH
HH
OH
O
O
HH
HH
O
O
N
N
HH
HH
OH
N
N
O
N
O
O
N
N
O
HH
HH
H
N
N
OH
HH
HH
OH
N
O
N
N
O
HH
HH
H
O OH
N
N
OH
HH
HH
OH
OH
27
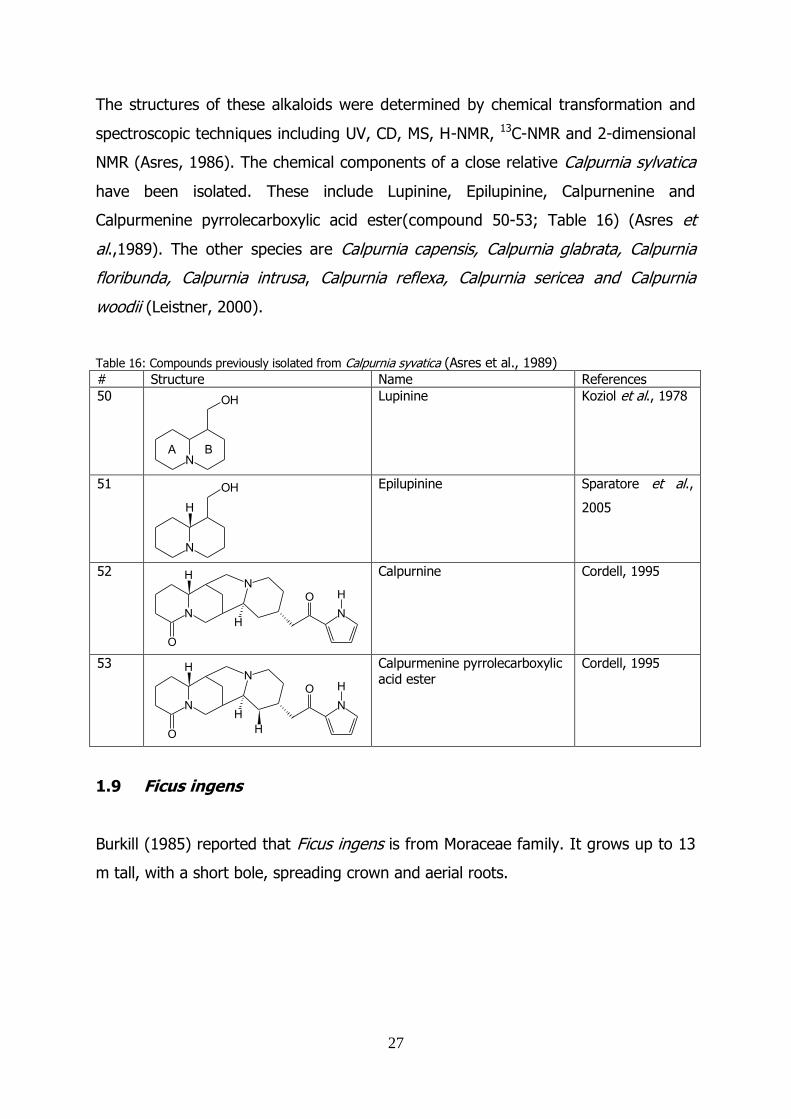
The structures of these alkaloids were determined by chemical transformation and
spectroscopic techniques including UV, CD, MS, H-NMR, 13C-NMR and 2-dimensional
NMR (Asres, 1986). The chemical components of a close relative Calpurnia sylvatica
have been isolated. These include Lupinine, Epilupinine, Calpurnenine and
Calpurmenine pyrrolecarboxylic acid ester(compound 50-53; Table 16) (Asres et
al.,1989). The other species are Calpurnia capensis, Calpurnia glabrata, Calpurnia
floribunda, Calpurnia intrusa, Calpurnia reflexa, Calpurnia sericea and Calpurnia
woodii (Leistner, 2000).
Table 16: Compounds previously isolated from Calpurnia syvatica (Asres et al., 1989) # Structure Name References
50
Lupinine Koziol et al., 1978
51
Epilupinine Sparatore et al.,
2005
52
Calpurnine Cordell, 1995
53
Calpurmenine pyrrolecarboxylic acid ester
Cordell, 1995
1.9 Ficus ingens
Burkill (1985) reported that Ficus ingens is from Moraceae family. It grows up to 13
m tall, with a short bole, spreading crown and aerial roots.
N
OH
A B
N
OH
H
N
O
O
HN
N
H
H
N
O
O
HN
N
H
H
H

28
Figure 13: Branch and fruit of Ficus ingens (Jordaan, 2005)
Ficus ingens is found in savanna, in rocky places from Senegal to north and south
Nigeria, and in drier parts of tropical Africa and South Africa (Burkill, 1985). Ficus
ingens is used to treat fever, gastrointestinal problems (Grosvenor et al.,1995).
According to Burkill (1985) barks, leaves, and roots of Ficus ingens are used by
Traditional healers to treat diarrhoea, dysentery, diuretics and kidney problems.
Figure 14: Distribution map of Ficus ingens (CIA, 2009)
Chemical components isolated from Ficus moraceae are alanine, asparatine,
arginine, cystine, beta-carotene, ascorbic acid, lioleic-acid, niacin, methionine, malic-
acid, and oleic-acid (Berg & Corner, 2005) and their structures are shown in table
17.

29
Table 17: Structure of chemical compounds isolated from Ficus moraceae # Structure Name References
54
alanine (Brady & Senese,
2004)
55
L-ascorbic acid (Bender, 2003)
56
cysteine (Brady & Senese, 2004)
57
Linoleic acid (Brady & Senese, 2004)
58
Oleic acid (Brady & Senese, 2004)
59
L-arginine (Helmenstine, 2001)
60
L-methionine (Helmenstine, 2001)
61
Malic-acid (Dobbin, 1931)
62
L-asparagine (Helmenstine,
2001)
63
βeta-Carotene (Karrier et al., 1930)
1.10 Filicium decipiens (Fern tree)
Filicium decipiens belongs to Sapindaceae family, it grows up to 6-9 m. Flowers are
white or near white in colour. It flowers mid spring, late spring or early summer and
H3N+
O-
O
OO
OHHO
HO
OH
H3N+
O-
O
SH
OH
O
OH
O
+NH3
NH2
O-
NH2N
O
+NH3
O-S
O
HOOH
O
O
OH
+NH3
O-H2N
O
O
30
leaves or foliage are evergreen, It prefers a soil with PH from 8,6 to 9,0 which is
strongly alkaline (Godfrey et al, 1981). Filicium decipiens are found in tropical
lowland to submontane environments, as well as subtropical forests (Tryon &
Gastony, 1975; Moran, 1995a). Filicium decipiens have antioxidant activities (Lo et
al, 2004)
Figure 15: Fern tree (Van den bos, 2004)
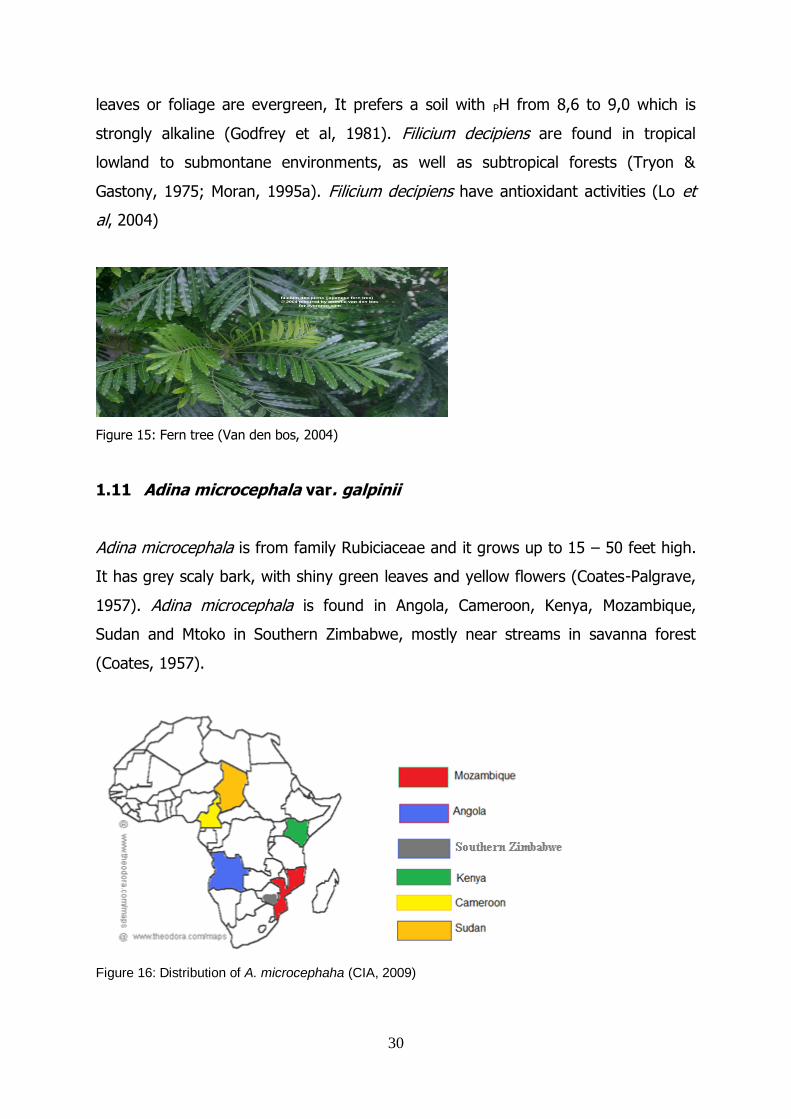
1.11 Adina microcephala var. galpinii
Adina microcephala is from family Rubiciaceae and it grows up to 15 – 50 feet high.
It has grey scaly bark, with shiny green leaves and yellow flowers (Coates-Palgrave,
1957). Adina microcephala is found in Angola, Cameroon, Kenya, Mozambique,
Sudan and Mtoko in Southern Zimbabwe, mostly near streams in savanna forest
(Coates, 1957).
Figure 16: Distribution of A. microcephaha (CIA, 2009)

31
Figure 17: A painted Adina microcephala (Coate, 1957)
1.12 Introduction of bacteria used.
Staphylococcus aureus is one of the most commonly identified pathogens in human
medicine and is a major cause of nosocomial infections (Boyce et al., 1983) and
community-acquired infections (Naimi et al., 2003). Enterotoxigenic Escherichia coli
(ETEC) has been reported as the major cause of diarrheoa in humans throughout
the world (Sack, 1975), especially in developing countries (Black et al., 1984). It is a
cause of morbidity and mortality in children up to 5 years of age in developing
countries (Black, 1993).

32
Baille et al (2004) Escherichia coli can generally cause several intestinal and extra
intestinal infections such as urinary tract infection, meningitis, peritonitis, mastitis,
septicemia and pneumonia, it is often the causative agent of Traveler’s diarrhoea,
and the primary source of infection is by ingestion of fecally contaminated food or
water. Certain strains of Staphylococcus aureus are also the causative agent for
septicemia infections, pneumonia, meningitis, endocardis, and food poisoning occurs
after eating food containing toxins produced by the organism.
Campylobacter jejuni is a gram-negative bacteria; the name of the illness caused by
campylobacter jejuni is Campylobateriosis. The infection can cause diarrhoea, fever,
abdominal pain, nausea, headache and muscle pain. The illness usually occurs 2-5
days after ingestion of the contaminated food or water. Campylobacter jejuni
contaminates raw chicken, raw milk and non-chlorinated water (Baille et al., 2004).
1.13 Isolation of compounds with preparative thin-layer
chromatography.
The invention of chromatography can be traced to the milestone report published in
1906 by the Russian botanist and plant physiologist Mikhali Semyonovitch Tswett; he
managed to separate chloroplast pigments from leaves in a column of precipitated
chalk washed with carbon disulfide mobile phase. During the 20th century and in the
new millennium, chromatography has become an indispensable separation tool that
is very widely used in natural and life science laboratories throughout the world.
Tswett`s column liquid chromatography method was developed and applied in two
modes, liquid–solid adsorption and liquid–liquid partition (Kowalska & Shema, 2006).
Adsorption chromatography based on partition with mechanically coated stationary
phase has become the most important liquid chromatographic method and this
remains true today in thin layer chromatography, for which silica gel as chemically
bonded stationary phases is the most popular. Preparative thin layer
chromatography (PTLC) was apparently reported by Ritter and Meyer in 1962. They
used layers of 1-mm thickness. Earlier preparative work, reported by Miller et al

33
(1963) the inventors of TLC is performed today by development in a closed tank
(Kowalska & Shema, 2006).
PTLC may be defined as the TLC of relatively large amounts of material used in
order to prepare and isolate quantities of separated compounds for further
investigations such as chemical derivatization, structure elucidation and
chromatographic standards or biological activity determination. Preparative layer
chromatography is an excellent method for cleaning up synthetic reactions with
mixtures (Miller et al, 1962), for natural products, plant extracts, and
biotechnological products. The classical preparative layer plate involves migration of
a mobile phase by capillary action through 0,5 to 2mm layer of adsorbent for
separating compounds in amounts of 10 to 1000mg. The analytical TLC methods are
tested first for quick judgment of the sample, to try to identify unknown compounds
or to optimize a separation before starting with large amounts of samples. The main
differences between TLC and PLC are due to large layer thickness and particle size of
the stationary phase and the amount of sample applied to the plate (Kowalska &
Shema, 2006).
1.14 Column chromatography
Column chromatography is a physical method of separation in which the components
to be separated are distributed between two phases one of which is a stationary
phase whereas the other one is a mobile phase (Ettre, 1981).
The stationary phase is one of the two phases forming a chromatographic system
and it may be a solid, a gel or a liquid and may be distributed on a solid. This solid
may or may not contribute to the separation process. The liquid may also be
chemically bonded to the solid (Bonded phase) or immobilized onto it (Ettre, 1993);
a stationary phase is covalently bonded to support particles inside or to the inside
wall of the column tubing and used for separation. The most popular support is
micro particulate silica gel (Stahl, 1968). A stationary phase which is stationary on
the support particles or on the inner wall of the column tubing by polymerization

34
after coating (Ettre, 1981). Sulfonated resins were prepared as an immobilized
phase transfer catalyst for the hydrolysis of benzophenone azine to hydrazine
(Hayashi et al., 1991)
1.15 Antioxidant activities
Emerging evidence suggests that during pregnancy oxidative damage to DNA,
protein, and lipids may be associated with reduced birth weight and increased risks
of outcomes such as low birth weight, preterm delivery, and preeclampsia. The risk
may depend on the mother’s antioxidant status which potentially protects the
maternal-fetal unit, thus increasing intra-uterine growth and infant weight at birth.
Antioxidants scavenge free radicals and buffer the effects of pro oxidants by
reducing oxidative stress preventing oxidative damage. Antioxidants are produced
endogenously by the body or are consumed in the diet (Rimm et al, 1993).
The DPPH method was used alongside with dose-response curve to refer to the
titration plot (Sanchez-Moreno et al., 1999). The DPPH method gives a validation to
the use of substrate as an antioxidant in a biological system (Sanchez-Moreno et al.,
1999). The higher the antioxidant activity, the lower the EC50 value and this is a
disadvantage when the results are presented graphically as a bar chart (Ames et al.,
2001). EC50 means concentration of substrate that causes 50% loss of DPPH activity
(colour) and that should be noted from any residual yellow from reduced form
(Sanchez-Moreno et al., 1999). Vitamin E is a lipid soluble chain breaking antioxidant
that is dietary in origin (Ames et al., 2001). Of the 8 isomers of vitamin E that occur
naturally, α-tocopherol is the most abundant in plasma and other human tissues,
whereas -tocopherol is the primary form found in the human diet (Knekt et al,
2000).
Table 18: Structure of α and -tocopherol # Structure Name References
64
a. RI = CH3, R2 = CH3
(α-tocopherol)
b. RI = H, R2 = CH3
( -tocopherol)
(Swanson et al., 1999)
O
CH3
R3
HO
R1
CH3H CH3
35
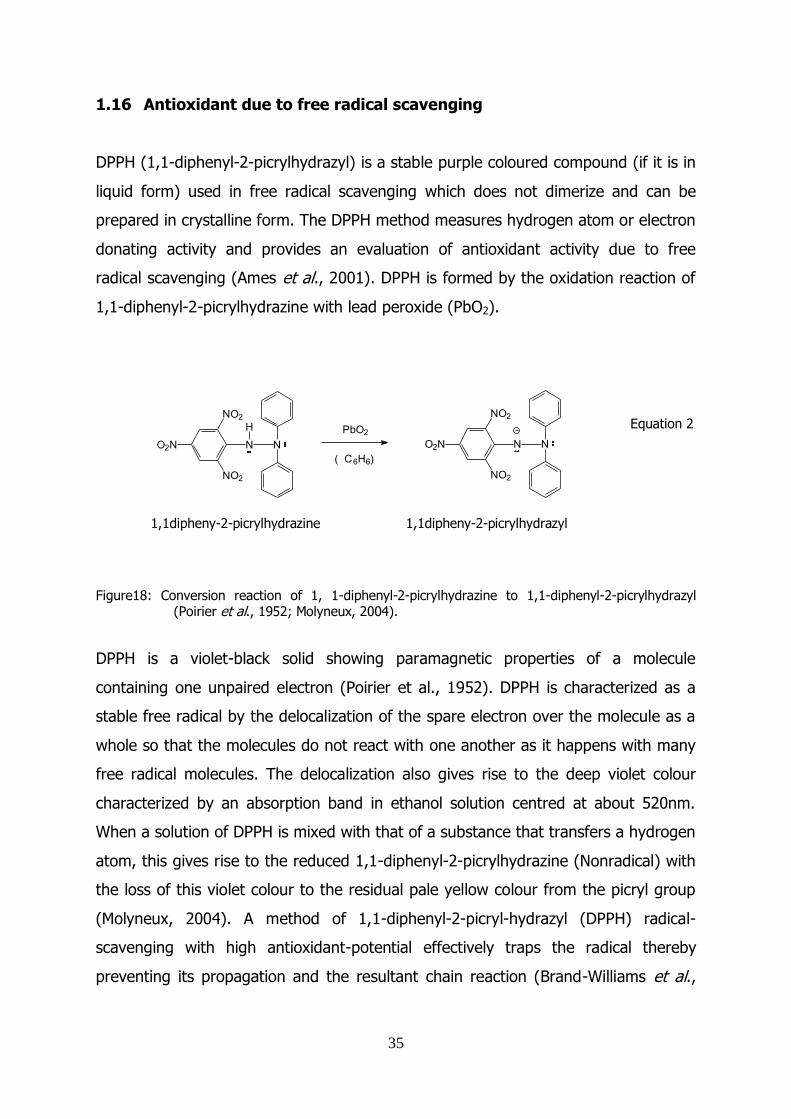
1.16 Antioxidant due to free radical scavenging
DPPH (1,1-diphenyl-2-picrylhydrazyl) is a stable purple coloured compound (if it is in
liquid form) used in free radical scavenging which does not dimerize and can be
prepared in crystalline form. The DPPH method measures hydrogen atom or electron
donating activity and provides an evaluation of antioxidant activity due to free
radical scavenging (Ames et al., 2001). DPPH is formed by the oxidation reaction of
1,1-diphenyl-2-picrylhydrazine with lead peroxide (PbO2).
Equation 2
1,1dipheny-2-picrylhydrazine
1,1dipheny-2-picrylhydrazyl
Figure18: Conversion reaction of 1, 1-diphenyl-2-picrylhydrazine to 1,1-diphenyl-2-picrylhydrazyl (Poirier et al., 1952; Molyneux, 2004).
DPPH is a violet-black solid showing paramagnetic properties of a molecule
containing one unpaired electron (Poirier et al., 1952). DPPH is characterized as a
stable free radical by the delocalization of the spare electron over the molecule as a
whole so that the molecules do not react with one another as it happens with many
free radical molecules. The delocalization also gives rise to the deep violet colour
characterized by an absorption band in ethanol solution centred at about 520nm.
When a solution of DPPH is mixed with that of a substance that transfers a hydrogen
atom, this gives rise to the reduced 1,1-diphenyl-2-picrylhydrazine (Nonradical) with
the loss of this violet colour to the residual pale yellow colour from the picryl group
(Molyneux, 2004). A method of 1,1-diphenyl-2-picryl-hydrazyl (DPPH) radical-
scavenging with high antioxidant-potential effectively traps the radical thereby
preventing its propagation and the resultant chain reaction (Brand-Williams et al.,
N N
H
O2N
NO2
NO2
N NO2N
NO2
NO2
PbO2
(C6H6)
36
1995). The free radical-scavenging activity of the extracts is attributed to their
hydrogen-donating capabilities (Shimada et al., 1992).
Ethanolic and ethylacetate extracts of bee pollen of Melipona submitida are free
radical inhibitors and primary antioxidants that react with free radicals and DPPH
screening for free radical scavenging capability showed that extracts of yellow or
brown pollen posses the most impressive free radical scavenging capability
consistent with their contents of phenolic constituents especially in flavonoids (Silva
et al, 2006).
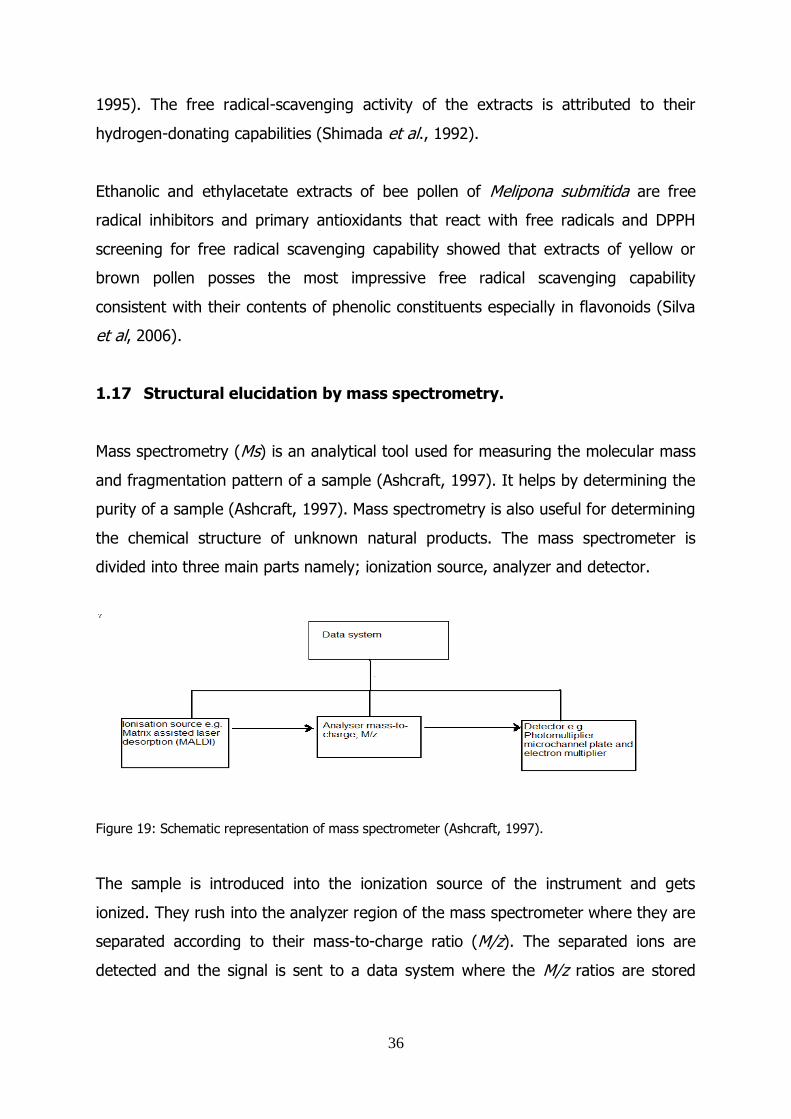
1.17 Structural elucidation by mass spectrometry.
Mass spectrometry (Ms) is an analytical tool used for measuring the molecular mass
and fragmentation pattern of a sample (Ashcraft, 1997). It helps by determining the
purity of a sample (Ashcraft, 1997). Mass spectrometry is also useful for determining
the chemical structure of unknown natural products. The mass spectrometer is
divided into three main parts namely; ionization source, analyzer and detector.
Figure 19: Schematic representation of mass spectrometer (Ashcraft, 1997).
The sample is introduced into the ionization source of the instrument and gets
ionized. They rush into the analyzer region of the mass spectrometer where they are
separated according to their mass-to-charge ratio (M/z). The separated ions are
detected and the signal is sent to a data system where the M/z ratios are stored

37
together with their relative abundance for presentation in the form of a M/z
spectrum. The M/z values can be expressed as follows:
M/z = (MW + H+)/n Equation 3 Where M/z = mass-to-charge ratio marked on the x-coordinate of the spectrum, MW = molecular mass of the sample or fragment, n = integer number of charge on the ions, H = mass of a proton = 1.00Da (Ashcraft, 1997).
The various components of the mass spectrometer are often maintained under
vacuum gradient in order to give ions more chance of travelling from one end of the
instrument to the other end without interferences from carrier gas molecules.
The sample in the mass spectrometer is vaporized at low pressure and bombarded
with a beam of high-energy electrons. The energy of the beam of electrons is
usually 70eV and this bombardment is useful for dislodging one of the electrons
from the molecules of the sample and produce positively charged ions called the
molecular ions.
The molecular ion is not only cation, but because it contains an odd number of
electrons, it is also a radical (McMurry, 2006). Thus it belongs to a general group of
ions called radical cations. Because of the high energy the molecular ion, undergoes
fragmentation. Fragmentation can take place in a variety of ways depending on the
nature of the particular molecular ion and the way a molecular ion fragments can
give highly useful information about the structure of a complex molecule. The mass
spectrometer sorts the radical cations on the basis of their mass/charge ratio. Since
for all practical purposes the charge on all of the ions is +1, this amounts to sorting
them on the basis of their mass. The conventional mass spectrometer does this by
accelerating the ions through a series of slits and then it passes the ion beam
through a curved tube (Munson & Field, 1966).

38
The curved tube passes through a variable magnetic field and the magnetic field
exerts an influence on the moving ions. Depending on its strength at a given
moment, the magnetic field will cause ions with a particular M/z ratio to follow a
curved path that exactly matches the curvature of the tube. These ions are said to
be “in register.” These ions pass through another slit and impinge on an ion collector
where the intensity of the ion beam is measured electronically. The intensity of the
beam is simply a measure of the relative abundance of the ions with a particular M/z
ratio. Some mass spectrometers are so sensitive that they can detect the impact of a
single ion (McMurry, 2006).
1.18 Infrared Spectroscopy
Fourier-Transform Infrared spectroscopy (FT-IR) is a commonly used structural
elucidation tool. FT-IR is a technique used for identifying both organic and inorganic
compounds by analysis of vibration and rotation properties of the molecules of the
sample. The infrared spectrum can be used to specifically identify the material or
provide generic information regarding its chemical family by the functional groups
present as well as quantitatively analyze the sample (Luypaert et al, 2003).
A variety of sample handling accessories makes this a versatile technique having the
ability to examine gases, liquids and solids. Infrared spectroscopy measures the
energy difference between vibrational and rotational energy levels in molecules
(Mukamel et al, 1997).
Absorption of infrared radiation is restricted to compounds with small energy
differences in the possible vibration and rotational states. For a molecule to absorb
infrared radiation, the rotations or vibrations within a molecule must cause a net
change in the dipole moment of the molecule. The alternating electrical field of the
radiation interacts with fluctuations in the dipole moment of the molecule. If the
frequency of the radiation matches the vibration frequency of the molecule then
radiation will be absorbed (Kirkwood et al, 2000), causing a change in the amplitude

39
of molecular vibration. In a molecule, the atoms are not held rigidly apart. Instead
they move, as if they are held together by a spring, and the chemical bonds can
either bend or stretch. If the bond is subjected to infrared radiation of a specific
frequency (400-4000 cm-1), it will absorb the energy, and the bond will move from
the lowest vibration state, to the next higher vibration state. In a simple diatomic
molecule, there is only one direction of vibrating, stretching. This means there is
only one band of infrared absorption. If there are more atoms, there will be more
bonds, and therefore more modes of vibration. This will produce a more complicated
spectrum. In general, a polyatomic non-linear molecule with N atoms has 3N6
distinct vibrations, but for linear molecules it will have 3N5 vibration modes (Tretiak
et al, 2002).
There is one restriction; the molecule will only absorb radiation if the vibration is
accompanied by a change in the dipole moment of the molecule. A dipole occurs
when there is a difference of charge across a bond. If the two oppositely charged
atoms get closer or further apart as the bond bends or stretches, the dipole moment
will change. Infrared is normally determined from 4000-400 cm-1, but a wider range
can be utilized down to a few cm-1, but for the purpose of this study the above
range was used on a Perkin Elmer Spectrum RXI FT-IR Spectrometer (Bruker IFS
113v, DTGS detector, and resolution 2 cm-1) (Mukamel, 2000).
1.19 p-Iodonitrotetrazolium violet (INT) reaction
The p-iodonitrotetrazolium violet (INT) reaction is based on the transfer of electrons
from NADH in a reaction catalyzed by dehydrogenases. This converts INT into its
respective formazan. Viable cells are identified by the red formazan colour. Dead
cells are unable to form the formazan colour (Nachlas, 1960).

40
Equation 5
Figure 20: Equilibrium reaction of p-iodonitrotetrazolium violet red (ITVr) and p-iodonitrotetrazolium violiox (ITVox) (Engeh et al., 2006).
Consider the example of threonine dehydrogenase catalyzed reaction with p-
iodonitrotetrazolium violet (INT) reaction. Threonine dehydrogenase (TDH) from
bacteria catalyses the NAD-dependent oxidation of threonine to form 2-amino-3-
ketobutyrate and NADH (Engeh et al, 2006).
In the course of active growth of bacteria an electron is transferred from the NADH
which is transparent in the visible range to p-iodonitrotetrazolium violet and
formazan dye which is purple-red in colour (Engeh et al, 2006). The clear zones on
the chromatogram represent areas of inhibition or zones where no active growth of
bacteria (Engeh et al, 2006).
N N
NN
H
I
NO2
N N
NN
I
NO2

41
Chapter 2
Materials and Methods
2.1. Plant collection
Leaves of six plants, namely [Calpurnia aurea (437,948g), Combretum collinum
(174,324g), Combretum bracteosam (116,085g), Adina mcrocephaha (238,674g),
Ficus ingens (53, 995g), and Filicium decipiens (246, 57g) were collected from the
National Botanical garden in Nelspruit, Mpumalanga during summer in 2007.
2.2 Plant drying and Storage
The leaves of the six plant species were air-dried in the dark for three weeks. The
dried leaves were ground to fine powder using a mortar and pestle and placed in
glass containers until further use (Rogers & Verotta, 1996; Eloff, 1998a).
2.3 Extraction
The ground leaves (1g) of each of the six different plant species were suspended in
10 ml of acetone, dichloromethane, and hexane for preliminary screening (Masoko &
Eloff, 2006). The mixtures were shaken for 30 minutes and filtered using Whatman
no.1 filter paper. The extracts were air-dried and the mass of the extracts was
measured and recorded (Asfaw & Lwande, 1993; Masoko & Eloff, 2006)
In the antimicrobial activity results from preliminary screening (Eloff, 2004), C.
collinum was shown to have many compounds with antibacterial activity, hence C.
collinum (171, 5g) was further extracted with hexane, chloroform, ethyl acetate and
methanol respectively (Shai et al, 2008). Since the acetone extract showed many
compounds with antibacterial activity from preliminary screening, the acetone extract
(4, 1g), was further investigated.

42
2.4 Antimicrobial activity
2.4.1 Chromatogram development.
The TLC plate (20 x 20 cm) loaded with 100 µg of hexane, acetone, and
dichloromethane extract were developed in a tank saturated with mobile phase of
chloroform, ethyl acetate and formic acid (5:4:1) (CEF). The chemical components
were visualized by spraying the plates with a vanillin/methanolic mixture [vanillin
(0,1g): methanol (28 ml): sulphuric acid (1 ml)] and heating at 110°C for 5 min, for
adequate colour development (Kotze & Eloff, 2002).
2.4.2 Bacterial cultures
Bacterial cells were cultured in a sterile Schott Duran bottle (500 ml) in Luria Bertani
(LB) broth at 37°C (Reynolds, 2005). The bacterial cultures were prepared 14 hrs,
prior antibacterial activity assays. Staphylococcus aureus, Escherichia coli,
Enterococcus faecalis and Pseudomonas aeruginosa were kindly donated by Dr. L.J.
McGaw of the Phytomedicine Programme at the University of Pretoria, South Africa
(Miller, 1972).
2.4.3 Bioautographic method
The TLC plates (20 x 20 cm) were loaded with each extract and developed as
described in section 2.4.1. The chromatograms were dried up at room temperature
under a stream of air for at least a day to remove the remaining solvent. Cultures
were grown in LB broth solution overnight. The plates were sprayed with cultures of
selected bacteria until wet. The plates were incubated overnight at 37°C in an
incubator. The plates were then sprayed with 2mg/ml of INT. The plates were
incubated at 37°C for adequate colour development (Begue & Kline, 1972), due to
the formazan reaction.

43
2.4.4 Minimum inhibitory concentration determination
The microplate dilution method was used to determine the Minimum inhibitory
concentration (MIC) of the extracts against each test bacterial species (Eloff, 1998).
The plant fractions or compounds were constituted to 10 mg/ml with acetone and
100 μl of fractions or compounds were serially diluted to 50% with water in a 96-wel
microplates. Muller Hinton (MH) broth culture was inoculated (1%) with the test
bacteria (S. aureus or E. coli) and was incubated at 37°C overnight and 100 μl of the
resulting culture were added to each well (Eloff, 2004).The negative growth control
contained both MH broth as well as test organism. The microplates were sealed and
incubated at 37°c at 100% relative humidity for 18 hours. 40 μl of a 0.2 mg/ml of P-
iodonitrotetrazolium violet (INT) dissolved in water was used as an indicator for
bacterial growth and the solution was added to the microplate wells and incubated at
37°c for a further 30 minutes. The MIC was recorded as the lowest concentration of
fraction or compounds at which bacterial growth was inhibited (Eloff, 2004). A lack of
colour in the well shows that the bacteria were inhibited from growth and a pink
colour indicated that there was bacterial growth (Begue and Kline, 1972).
2.5 Screening of antioxidant compounds
TLC plates were loaded with the same amount of extracts and developed as
described in sections 2.4.1 and 2.4.4.The plates were allowed to dry and then
sprayed with red DPPH. Antioxidant activity was regarded as the ability to reduce red
DPPH into colourless product (Brand-Williams et al., 1995). White zones on the
plates therefore indicated components of the extracts with antioxidant activity.
2.6 The instruments used
The instrument used for GC-MS spectra was a Hewlett Packard 5973 mass selective
detector, connected to a HP 6890 series GC system from Council for Scientific and
Industrial Research Pretoria (CSIR), Agilent Technologies Automatic Liquid Injection
system no.7683 series, with split less injection mode. The column used was HP-5MS
(30m x 0, 25mmid x 0, 25um df). The column temperature was programmed from
120°C with a 1min ramp to 320 at 15°C/min thereafter held for 5 min at 320°c. The

44
carrier gas was helium, electron energy was 700eV, emission current 34,6Ua,
injector temperature was 250°c and the transfer line temperature was 25°C and the
quadrupole temperature was 150°c. The total flow rate was 14ml/min, with a purge
flow at a split vent of 0,1ml/min and the acquisition mode was full scan and the scan
range was 35-750amu.
The instrument used for NMR spectra was mercury-300BB from Limpopo University
(Medunsa campus) at an ambient temperature. The solvent used to dissolve
compound in NMR tube was acetone. The compound was relaxed and delayed by
1.000 second in the NMR instrument. The acquisition time was 1.997 seconds. The
observe H1 was 300.0689246 MHz. The total time spent by compound in the NMR
instrument was 59min and 1 second.
The instrument used for Fourier transform infrared spectroscopy was Perkin Elmer
spectrum RX I FTIR from University of Pretoria (Acadia campus). Compound was
mixed with potassium bromide to remove scattering effects from large crystals. The
mixture was pressed in a mechanical die press to form a translucent pellet through
which the beam of the spectrometer can pass. This pellet was placed between two
small plates and inserted to Perkin Elmer spectrum RXI FTIR for analysis.

45
Chapter 3
Purpose of the research
3.1 Problem statement
According to Warrier et al (2001) medicinal plants provide accessible and largely safe
sources of primary health care to the majority of the population in India. Poor People
who are unable financially to afford formal health care systems are dependent on
herbal medicine. Government is always experiencing problems with pharmaceutical
companies that are regularly increasing prices of their medicines. There is a growing
interest in the value and efficacy of medicinal plants based on local health systems
as a means of meeting the current and future health care needs of the people
(Warrier et al, 2001). Many investigators found that combretum collinum sub specie
suluense has antibacterial activities. However its chemical components have not
been identified (Pegel et al., 1985; Rogers et al., 1986).
Many Traditional healers use water extracts of Combretum collinum which means
there is a need to characterize its chemical components. Many Traditional healers
use water extract to heal people without the knowledge of concentration
measurement which means there is a need to test plant against different organisms
and measure the minimum effective concentration.
3.2 Aim
The aim of this study is to isolate and characterize the antibacterial and antioxidant
compounds from Combretum collinum sub specie suluense, and to evaluate their
properties and propose their chemical structures.

46
3.3 Objectives
Extract compounds from Combretum collinum subspecie suluense using sequential
solvent extraction.
Determine the antibacterial activity of the extracts. This will help in the selection of
extracts from which to isolate active compounds.
Isolate compounds from the extracts using chromatographic techniques.
Determine the minimum inhibitory concentration of chemical components that have
antibacterial activities.
Determine the chemical structure of the antibacterial compounds using spectroscopic
techniques.

47
Chapter 4
Results and discussion
4.1 Extraction for preliminary screening.
In this work the following plant species Adina mcrocephaha, Calpurnia aurea,
Combretum bracteosam, Combretum collinum, Filicium decipiens, and Ficus
moraceae were used.
Table 19: Mass of extracts from a gram of each of six different plants and the % yield of each extract.
Name of plants Mass of extracts (mg) % yield
Acetone DCM Hexane Acetone DCM Hexane Adina microcephaha 74 86 37 7.4 8.6 3.7
Combretum aurea 35 20 63 3.5 2.0 6.3
Combretum bracteosam 27 47 33 2.7 4.7 3.3
Combretum collinum 40 30 30 4.0 3.0 3.0
Filicium decipiens 118 75 52 11.8 7.5 5.2
Ficus moraceae 44 30 18 4.4 3.0 1.8
Table 19 shows that 1g of ground plant material, acetone extracted 118 mg of
extract from Filicium decipiens and was found to be the highest extracted mass as
compared to the extracts from the other five plants and hexane extracted the least
mass of 18 mg from Ficus moraceae.
4.2 Preliminary screening of medicinal plants.
The preliminary screening of the plant extracts was carried out as described in
section 2.4.3 and 2.5, for antibacterial activity and antioxidant activity respectively.
The two chromatograms shown in figure 21 & 26 showed the results of antibacterial
screening of all six dichloromethane plant extracts against Staphylococcus aureus
and antibacterial screening against Staphylococcus aureus of hexane extracts in
figure 22. Antibacterial activity of the extracts of Combretum collinum subsp
suluense and Filicium decipiens are shown in figure 21 & 24.

48
The chromatograms in figure 23 and 24 show antibacterial activity results only from
Combretum collinum subsp suluense and filicium decipiens extracted with
dichloromethane and acetone against Escherichia coli and the chromatogram in
figure 25 shows the antibacterial activity against Staphylococcus aureus from
Combretum collinum subspecies suluense extracted by acetone. In figure 21, 23,24
and 25 at Cc chromatogram, the white zones indicate the area of bacterial growth
inhibition and pink zones indicate the bacteria growth. On Fd chromatogram there is
colourless chromatogram which is not as active as the one in Cc chromatogram. This
indicates that the chemical components of that plant extract have antibacterial
activity.
Preliminary screening of plant extract was performed by spraying the chromatogram
on the thin layer chromatography in figure 21-25 with Escherichia coli or
Staphylococcus aureus followed by p-iodonitrotetrazolium violet. The TLC plates
were incubated overnight, and taken out for observation. The pink background
shows that there was no bacterial growth. White zones in figure 20, 23, 24 and 25
indicate that there was no bacterial growths.
Figure 21: Chromatogram of dichloromethane; extract against S. aureus. Fm: Ficus ingens (Morecea); Am: Adina microcephala; Fd: Filicium decipiens; Cc: Combretum collinum; Cb: Combretum bracteosam; Ca: Calpurnia aurea

49
Figure 22: Hexane extract against S. aureus. Fm: Ficus ingens (Morecea); Am: Adina microcephala; Fd: Filicium decipiens; Cc: Combretum collinum; Cb: Combretum bracteosam; Ca: Calpurnia aurea
Figure 23: Hexane extract against Escherichia coli

50
Figure 24: Dichloromethane extract against Escherichia coli
Figure 25: Acetone extract against Escherichia coli

51
Figure 26: Acetone extract against S. aureus. White zones on chromatogram indicate active compounds against that bacteria. Adina microcephaha (Am), Filicium decipiens (Fd), Combretum collinum (Cc), Combretum bracteosum (Cb) and Calpurnia aurea (Ca). Ficus ingens
4.3 Serial extraction
The quantity in grams extracted from each extract (hexane, chloroform, ethyl
acetate and methanol) in a serial exhaustive extraction from Combretum collinum
ssp suluense was 174. 3 g
Figure 27: Graph of percentage yield extracted from Combretum collinum ssp suluense
0102030
Hex Chloro E. acetate Methanol
Mas
s(g)
an
d %
yie
ld o
f ex
tra
cts
Name of extracts
Extracts from C. collinum
mass(g) extracts % yield extracts

52
In figure 27 ethyl acetate extract (23,3 g) was the extract that had the highest mass
followed by hexane extract (8,4 g), methanol extract (4,43 g) and chloroform extract
(1,9 g). This indicates that C.collinum subsp suluense has more moderately polar
compounds than non polar compounds and mostly polar compounds since ethyl
acetate is a moderate polar solvent and therefore can extract moderately polar and
polar compounds.
4.4 Preparative Thin layer Chromatography (PTLC)
The acetone extract (1.0 g) was dissolved in acetone (15 ml), and loaded on a line
drawn 2mm from the bottom of the preparative plate as shown in figure 28. The
mobile phase used to separate the compounds was 2:1 ethyl acetate and hexane.
The PTLC plate used was 20 cm x 20 cm in size.
Figure 28: The preparative TLC plate of 2 mm thickness was developed using hexane and ethyl acetate in 2:1 ratio.
The bands shown in figure 28 were scrapped from the PTLC plate. The support
material with adsorbed components from the scrapped bands was suspended in
ethyl acetate to dissolve the adsorbed components. The adsorbed components were

53
isolated by filtration washing several times with the ethyl acetate. The ethyl acetate
was reduced by evaporation on the rotary evaporator. The components separated in
this procedure were examined by spotting on an analytical TLC plate and developing
with a mixture of chloroform ethyl acetate and formic acid (5:4:1) on section 3.1.8.
Figure 29: Compounds separated by thin layer chromatography from Combretum collinum using chloroform, ethyl acetate and formic acid (5:4:1).
The chromatogram A,and B in figure 29 shown only one compound, whereas in
chromatogram C and D shown more than one compound. Further investigation was
performed on compound from chromatograms A, B and E in figure 29.
4.5 Scrapped layers
Figure 30: shows the layers that were scrapped from the preparative layer plate. The scrapped layers
are indicated from layer A-D

54
The bands on the PTLC plate shown in figure 28 were scrapped and transferred into
separate beakers. The picture of the beakers that contained scrapped material from
band E and F are not shown in figure 30.
4.6 Thin Layer Chromatography.
In figure 29 chromatogram A, B and E show that they only have one compound for
each chromatography and C has more than one compound and it was not further
investigated because the yield was not enough to be re-separated.
Only compounds in band B, E and F were re-dissolved and spotted on a separate
plate which was sprayed with vanillin and placed under UV light to check how many
compounds were present on the spots found on the TLC plate in figure 30. The
remaining filtrate was filtered into pre-weighed beakers and the solvent was
removed by evaporation on a rotary evaporator.
The following are the yields for each compound; compound in band A (0.152%), in
band E (0.048%) and in band F (0.0299%), band B was not counted because more
one compounds were found. The compounds isolated from the bands A, E and F was
named as unknown compound A, compound E and compound F respectively.
4.7 Chromatogram investigation
The TLC plate was placed under UV light to display invisible compounds on the
plate. The same compounds separated on the TLC plate in figure 29 were respotted
on the TLC shown in figure 31, and developed,then placed under UV light to
investigate if there were invisible compound without spraying with vanillin.

55
Figure 31: The compounds which were on the thin layer chromatography plate were placed under the UV light at 254nm to display even the invisible compounds.
4.8 Bioautography
TLC was used to confirm if there was one compound, from the band which was
scrapped from each preparative layer plate in figure 28. The scrapped band was
transferred into a beaker and ethyl acetate (20 ml) was used to dissolve the
compound from silica which was then filtered by Whatman no.1 filter paper and the
filtrate were collected into clean beakers as described in section 2.4.1. The solvent
was evaporated by a rotary evaporator. The thin layer chromatography plate in
figure 30 shown that chromatogram B, E and F have one compound after revealed
by ultraviolet light and compounds in vial labeled B, E and F were dissolved and
spotted on the TLC plate in figure 32 for bioautography. The TLC was developed in
hexane and ethyl acetate in a ratio of 2:1 and the TLC plate was then dried and
sprayed with active Escherichia coli cultures and later sprayed with INT. White areas
indicate zones of growth inhibition as described in section 2.4.4.

56
Figure 32: Bioautograms of acetone extract of Combretum collinum sub specie suluense.
Clear zones in the chromatogram shown in figure 32 represent bacterial growth
inhibition as described in section 2.4.3. Bacterial growth was observed on compound
B in figure 31. Bacterial growth inhibition was observed on compound E and F in
figure 32.
4.9 Antioxidant activity
Figure 33: DPPH sprayed on compounds or fractions isolated from acetone extract.
57
TLC analysis of compounds A, B, E and F were performed by spotting each
compound on the TLC plate followed by developing the plate with hexane and ethyl
acetate 2:1. The TLC plate was dried by a stream of air for 24hrs. A purple-red
DPPH solution was sprayed on the chromatograms. A yellow colour developed on
compound A and F as shown in figure 33, represents the antioxidant activity as it is
explained by Sánchez-Moreno et al (1999) in section 2.5.
4.10 Summary of the extraction process
After placing thin layer chromatography plate under ultraviolet light the compounds
in vials labeled B, C and D from acetone extracts were more than one and not
separable because the yield was very low. Only compounds in vials labeled A, E and
F in figure 33, were further investigated.
Figure 34 shows the summary of the extraction process of ground leaves of
Combretum collinum (174.3 g) extracted by five solvents namely hexane,
chloroform, ethyl acetate, acetone and methanol. All extracts from Combretum
collinum leaves were tested against Escherichia coli or Staphylococcus aureus as
shown in figure 21-26. The compounds from the acetone extract that were isolated
using preparative TLC were found to be active against both bacteria (Escherichia coli
and S. aureus). These were percentage yields for each compound, compound A
(15.2 %), compound E (4.8 %) and compound F (9.9 %), isolated using preparative
thin layer chromatography.
4.11 Retardation factor (rf) value.
According to IUPAC Compendium of Chemical Terminology (1997), the retardation
factor is a ratio of the distance travelled by the centre of the spot to the distance
travelled by the mobile phase. rf = b/a, where b is distance travelled by analyte and
a is a distance travelled by mobile phase (IUPAC Compendium of Chemical
Terminology, 1997).

58
Figure 34: Schematic flow chart of extraction procedure of Combretum collinum ssp suluense.
The distance travelled by a mobile phase and compound A and B in figure 29 was
measured and their retardation factor values were calculated and reported in table
20 and the same procedure for measuring distance travelled by compound F and
mobile phase in figure 31 was applied. The mobile phase was prepared by hexane
and ethyl acetate (2:1).
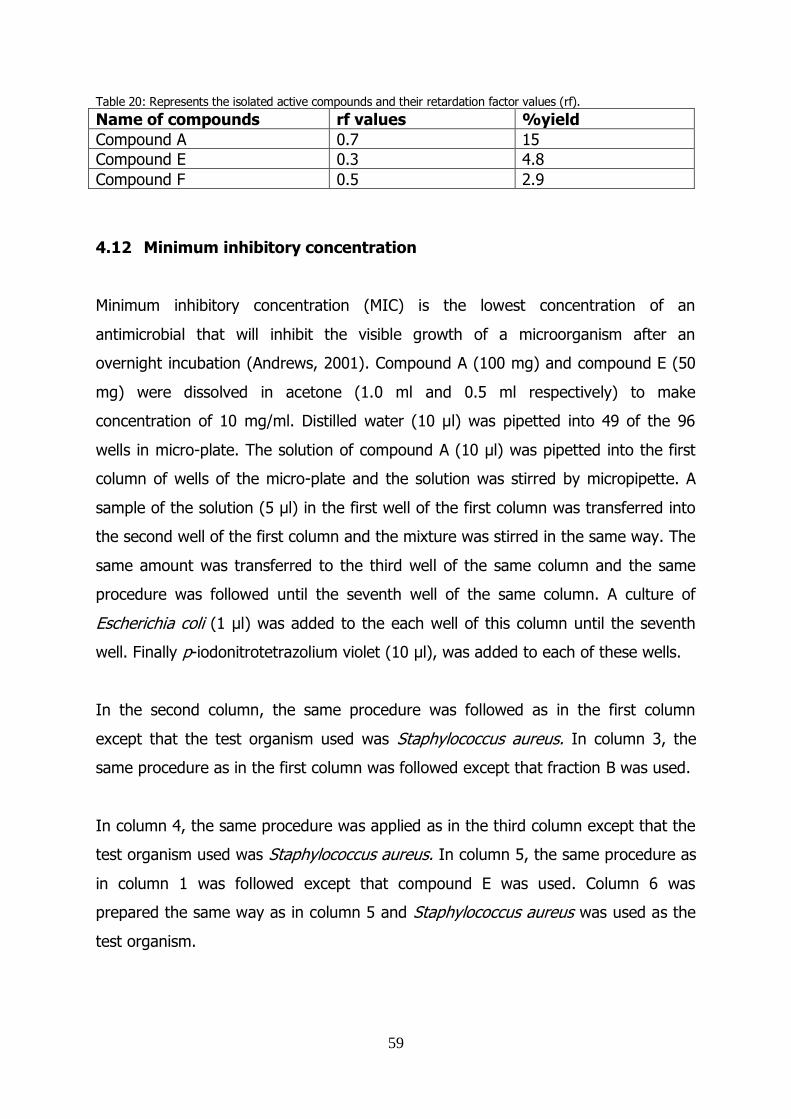
59
Table 20: Represents the isolated active compounds and their retardation factor values (rf).
Name of compounds rf values %yield
Compound A 0.7 15
Compound E 0.3 4.8
Compound F 0.5 2.9
4.12 Minimum inhibitory concentration
Minimum inhibitory concentration (MIC) is the lowest concentration of an
antimicrobial that will inhibit the visible growth of a microorganism after an
overnight incubation (Andrews, 2001). Compound A (100 mg) and compound E (50
mg) were dissolved in acetone (1.0 ml and 0.5 ml respectively) to make
concentration of 10 mg/ml. Distilled water (10 µl) was pipetted into 49 of the 96
wells in micro-plate. The solution of compound A (10 µl) was pipetted into the first
column of wells of the micro-plate and the solution was stirred by micropipette. A
sample of the solution (5 µl) in the first well of the first column was transferred into
the second well of the first column and the mixture was stirred in the same way. The
same amount was transferred to the third well of the same column and the same
procedure was followed until the seventh well of the same column. A culture of
Escherichia coli (1 µl) was added to the each well of this column until the seventh
well. Finally p-iodonitrotetrazolium violet (10 µl), was added to each of these wells.
In the second column, the same procedure was followed as in the first column
except that the test organism used was Staphylococcus aureus. In column 3, the
same procedure as in the first column was followed except that fraction B was used.
In column 4, the same procedure was applied as in the third column except that the
test organism used was Staphylococcus aureus. In column 5, the same procedure as
in column 1 was followed except that compound E was used. Column 6 was
prepared the same way as in column 5 and Staphylococcus aureus was used as the
test organism.

60
Lastly the same procedure as in column 1 was followed except that there was no
test organism used and this column was the control. The micro-plate was incubated
at 37°C for overnight. The formula which was used to calculate the concentration of
the diluted compounds is given in equation number 6.
The micro plate was sealed and incubated in 37°C for overnight (Eloff, 2004). The
white colour was developed in compound A (0.5689 mg/ml) and in compound E
(1.479 mg/ml) and a pink colour developed in the rest of the wells. Therefore
compound A only inhibits growth of Staphylococcus aureus at a concentration of
0.5689 mg/ml and compound E inhibits growth of Staphylococcus aureus at a
concentration of 1.479 mg/ml. The pink colour in the wells indicates that there was
bacteria growth (Begue and Kline, 1972).
Cconcd x Vconcd = Cdil x Vdil Equation 6
Where Cconcd = concentration of a compound, Vconcd = volume of a compound, Cdil = concentration of diluted compound and Vdil = volume of the solution. Vdil = (volume of solution of compound + volume of distilled water + volume of bacteria mixture + volume of p-iodonitrotetrazolium violet solution) - (volume of solution transferred). Vdil = (10 µl distilled water + 10µl solution of compound + 1µl solution bacteria + 10 µl solution p-iodonitrotetrazolium violet)-(Solution of a 5 µl solution reabsorbed) = 26 µl.
Table 21: Summary of the diluted solutions of the compounds tested against Staphylococcus aureus.
Diluted concentration of compounds
Concentration compound A in mg/ml against Staphylococcus aureus
Concentration compound E in mg/ml against S. aureus
Initial conc 10.00 10.00
1st dilution 3.846 3.846
2nd dilution 1.479 1.479
3rd dilution 0.5689 0.5689
4th dilution 0.2188 0.2188
5th dilution 0.0842 0.0842
6th dilution 0.0324 0.0324
7th dilution 0.01245 0.01245
The micro-plate was sealed and incubated at 37°c overnight (Eloff, 2004), A white
colour developed in compound A solution (3.846 mg/ml) and in compound E solution
(0.5689 mg/ml) and therefore pink colour developed in the rest of the wells.
Compound A can only inhibit growth of Escherichia coli at a concentration of 3. 846

61
mg/ml and compound E can inhibit growth of Escherichia coli (0.5689 mg/ml). The
pink colour in the wells indicates that there was bacteria growth (Begue and Kline,
1972).
Table 22: Summary of diluted solutions of compounds tested against Escherichia coli
Diluted concentration of compounds
Concentration compound A in mg/ml against Staphylococcus aureus
Concentration compound E in mg/ml against S. aureus
Initial conc 10.00 10.00
1st dilution 3.846 3.846
2nd dilution 1.479 1.479
3rd dilution 0.5689 0.5689
4th dilution 0.2188 0.2188
5th dilution 0.0842 0.0842
6th dilution 0.0324 0.0324
7th dilution 0.01245 0.01245
4.13 Proposed structure of the isolated unknown compound from vial A
The structure proposed for unknown compound from vial A shown in figure 34, was
proposed following the correlation of HNMR, FT-IR and GC-MS spectroscopy. The
unknown compound from vial A was isolated from the leaves of Combretum collinum
subsp suluense, extracted using acetone and its retardation factor (rf) value is 0.7
on TLC which was developed using mobile phase of hexane and ethyl acetate 2:1.
Figure 35: Structure of unknown compound from vial A.
O

62
Figure 36: Mass spectrum of unknown compound from vial A.
Figure 37: 1HNMR spectrum of unknown compound from vial A from 0.7 to 1.7 ppm

63
Figure 38: 1HNMR spectrum of unknown compound A from 0.7 to 3.1 ppm.
Figure 39: 1HNMR spectrum of unknown compound A from 3.6 to 5.4 ppm.

64
105
1
29
6
12
13
15
16
19
22
21
O
23 24
25 26
28
27
3029
Figure 40: Numbered structure of unknown compound from vial A
4.14 1HNMR analysis of unknown compound from vial A
The unknown compound A was re-crystallized from 98% ethanol, the yield was 15%
and the compound was analyzed using 1HNMR (300 MHz), using tetramethylsilane
(TMS) as a reference and chloroform as solvent: 0.858 (3H, s, 30), 0.861 (3H, s,
28), 0.875 (3H, s, 29), 0.887 (3H, s, 27), 0.887 (1H, m, 1), 1.981 (1H, m, 1), 0.931
(3H, s, 26), 0.997 (3H, s, 23), 1.051 (1H, m, 15) 1.091 (1H, m, 15), 1.091 (3H, s,
24), 1.113 (1H, m, 16) 1,136 (1H, m, 16), 1.113 (3H, s, 25), 1.284 (1H, m, 5), 1.333
(1H, m, 7) 1.601 (1H, m, 7), 1.37 (1H, m, 22) 1.50 (1H, m, 22), 1.601 (2H, m, 6),
1.655 (1H, m, 19) 1.672 (1H, m, 19), 1.984 (1H, m, 11) 2.036 (1H, m, 11), 2, 881
(1H, dd, 2) 2.914 (1H, dd, 2), 2.797 (1H, dd, 18), 2.816 (1H, dd, 9), 2.914 (1H, dd,
21),5.133 (1H, t, 12). The data compares well with literature as shown in table 23.
Table 23: 1HNMR results of compound A
105
1
29
6
12
13
15
16
19
22
21
O
23 24
25 26
28
27
3029
105
1
29
6
12
13
15
16
19
22
21
O
23 24
25 26
28
27
3029
OH
H # Isolated compound 29a (Liturature compound) (Mena-Rejón et al., 2008)
1 0.887 m, 1.984 m 1.41 m, 190 m
2 2, 881 dd, 2.914 dd 2.36 ddd (16, 6.8,3.7), 2.55 ddd (16, 11, 7.3)
3 - -
4 - -
5 1.284 m 1.33 m

65
6 1.588 m, 1.601 m 1.48, 1.55 m
7 1.312 m, 1.333 m 1.35, 1.52 m
8 -
9 1.655 dd 1.65 dd (11.5, 6.3)
10 - -
11 2.044 dd, 2.058 dd 1.88, 1.97 m
12 5.133 t 5.24 t (3.5)
13 - -
14 - -
15 1.051 m, 1.692 m 1.00, 1.76 m
16 1.113 m, 1,136 m 1.00, 1.96m
17 - -
18 2.082 dd 2.00 dd (14.8, 3.5)
19 1.655, 1.672 m 1.15, 1.75 m
20 - -
21 2.914, 2.323 dd 3.53 dd (12, 4.7)
22 1.42 m 1.37, 1.50 m
23 0.997 s 1.10 s
24 1.091 s 1.06 s
25 1.113 s 1.07 s
26 0.931 s 1.01 s
27 0.887 s 1.14 s
28 0.861 s 0.88 s
29 0.875 s 0.97 s
30 0.858 s 0.86 s
Figure 41: FT-IR spectrum of compound A from 500 to 4000cm-1
115
110
105
100
95
90
85
Intensity (a.u.)
500 1000 1500 2000 2500 3000 3500
Wavenumber (cm-1)
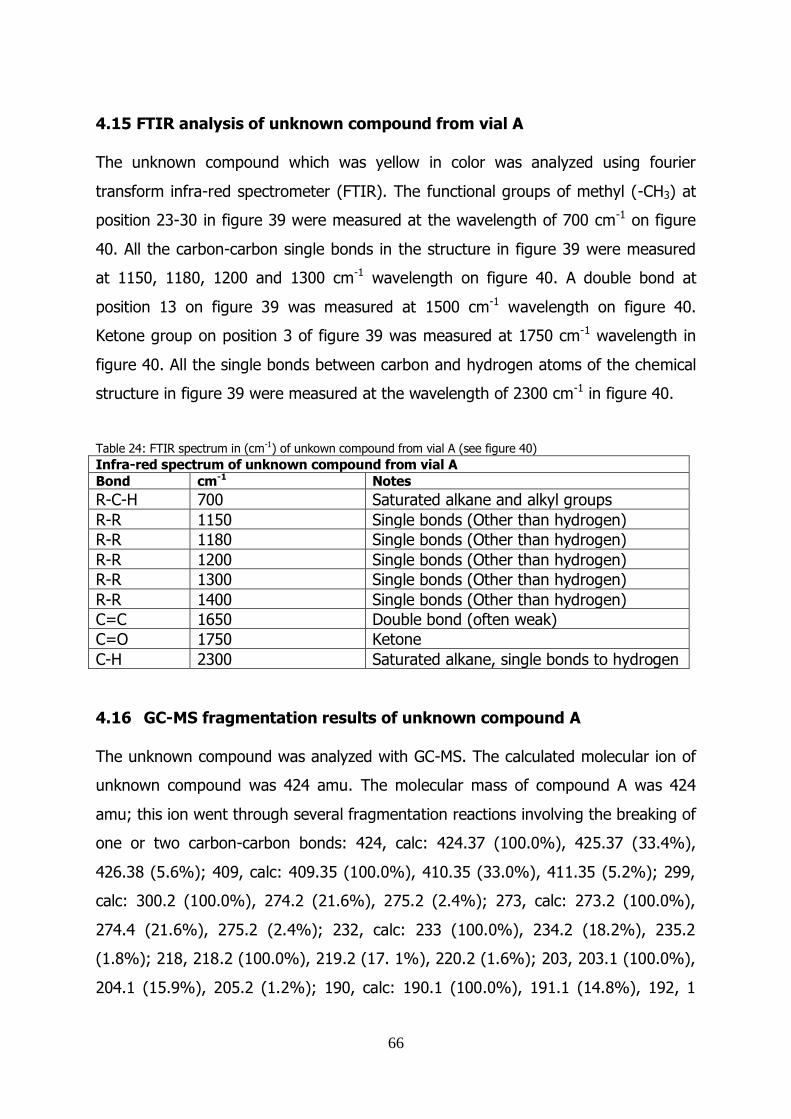
66
4.15 FTIR analysis of unknown compound from vial A
The unknown compound which was yellow in color was analyzed using fourier
transform infra-red spectrometer (FTIR). The functional groups of methyl (-CH3) at
position 23-30 in figure 39 were measured at the wavelength of 700 cm-1 on figure
40. All the carbon-carbon single bonds in the structure in figure 39 were measured
at 1150, 1180, 1200 and 1300 cm-1 wavelength on figure 40. A double bond at
position 13 on figure 39 was measured at 1500 cm-1 wavelength on figure 40.
Ketone group on position 3 of figure 39 was measured at 1750 cm-1 wavelength in
figure 40. All the single bonds between carbon and hydrogen atoms of the chemical
structure in figure 39 were measured at the wavelength of 2300 cm-1 in figure 40.
Table 24: FTIR spectrum in (cm-1) of unkown compound from vial A (see figure 40)
Infra-red spectrum of unknown compound from vial A
Bond cm-1 Notes
R-C-H 700 Saturated alkane and alkyl groups
R-R 1150 Single bonds (Other than hydrogen)
R-R 1180 Single bonds (Other than hydrogen)
R-R 1200 Single bonds (Other than hydrogen)
R-R 1300 Single bonds (Other than hydrogen)
R-R 1400 Single bonds (Other than hydrogen)
C=C 1650 Double bond (often weak)
C=O 1750 Ketone
C-H 2300 Saturated alkane, single bonds to hydrogen
4.16 GC-MS fragmentation results of unknown compound A
The unknown compound was analyzed with GC-MS. The calculated molecular ion of
unknown compound was 424 amu. The molecular mass of compound A was 424
amu; this ion went through several fragmentation reactions involving the breaking of
one or two carbon-carbon bonds: 424, calc: 424.37 (100.0%), 425.37 (33.4%),
426.38 (5.6%); 409, calc: 409.35 (100.0%), 410.35 (33.0%), 411.35 (5.2%); 299,
calc: 300.2 (100.0%), 274.2 (21.6%), 275.2 (2.4%); 273, calc: 273.2 (100.0%),
274.4 (21.6%), 275.2 (2.4%); 232, calc: 233 (100.0%), 234.2 (18.2%), 235.2
(1.8%); 218, 218.2 (100.0%), 219.2 (17. 1%), 220.2 (1.6%); 203, 203.1 (100.0%),
204.1 (15.9%), 205.2 (1.2%); 190, calc: 190.1 (100.0%), 191.1 (14.8%), 192, 1

67
(1.2%); 175, calc: 175.1 (100.0%), 176.1 (13.6%), 177.1 (1.1%); 161, calc: 161.1
(100.0%), 162.1 (12.5%); 147, calc: 147.1 (100.0%), 148.1 (11.3%); 135, calc:
135.1 (100.0%), 136.1 (10.2%); 122, calc: 122.1 (100.0%), 123.1 (9.1%); 109,
calc: 109.1 (100.0%), 110.1 (8.0%); 95, calc: 95.0 (100.0%), 96.1 (6.8%); 81, calc:
81.0 (100.0%), 82.0 (5.7%); 69, 68.0 (100.0%), 69.0 (4.5); 55, 55.0 (100.0%),
56.0 (3.4); 41, 41.0 (100.0%), 42.0 (2.3%). The fragmentation reactions are
illustrated in table 26.
Table 25: GC-MS fragmentation of unknown compound from vial A (see figure 35)
Fragment (M/z)
Found (M/z)
Calculated (M/z)
Fragmentation structure
1 (M+) 424 424.37 (100.0%), 425.37 (33.4%), 426.38 (5.6%)
2 409 409.35 (100.0%),
410.35 (33.0%),
411.35 (5.2%)
3 299 300.2 (100.0%),
274.2 (21.6%),
275.2 (2.4%)
4 273 273.2 (100.0%),
274.4 (21.6%), 275.2 (2.4%)
O
O
M/z = 409
M/z = 15
O
M/z = 299
M/z = 125
O
M/z = 273
M/z = 151

68
5 232 233 (100.0%), 234.2 (18.2%),
235.2 (1.8%)
6 218 218.2 (100.0%),
219.2 (17. 1%), 220.2 (1.6%)
7 203 203.1 (100.0%),
204.1 (15.9%), 205.2 (1.2%)
8 190 190.1 (100.0%),
191.1 (14.8%), 192, 1 (1.2%)
9 175 175.1 (100.0%),
176.1 (13.6%),
177.1 (1.1%)
10 161 161.1 (100.0%),
162.1 (12.5%)
O
M/z = 232
M/z = 192
O
M/z = 206
M/z = 218
O
M/z = 220
M/z = 204
O
M/z = 232
M/z = 192
M/z = 247
M/z = 177
O
M/z = 166
M/z = 158
O

69
11 147 147.1 (100.0%), 148.1 (11.3%)
12 135 135.1 (100.0%),
136.1 (10.2%)
13 122 122.1 (100.0%),
123.1 (9.1%)
14 109 109.1 (100.0%),
110.1 (8.0%)
15 95
95.0 (100.0%), 96.1 (6.8%)
16 81 81.0 (100.0%),
82.0 (5.7%)
M/z = 152
M/z = 272
O
M/z = 138
M/z = 286
O
M/z = 302
M/z = 122
O
M/z = 108
M/z = 316
O
M/z = 98
M/z = 326
O
M/z = 84
M/z = 340
O

70
17 69 68.0 (100.0%), 69.0 (4.5)
18 55 55.0 (100.0%),
56.0 (3.4)
19 41 41.0 (100.0%),
42.0 (2.3%)
4.17 Proposed structure of unknown compound from vial E
The chemical structure of compound from vial E was not proposed because it was
masked by a pollutant which interfered during the analytical process. This pollutant
may have contaminated the leaves since they were not washed before extraction.
According to Kirchmann et al (1991), phthalates released to environment can be
deposited on or taken up by crops, meaning that there is a possibility that
Combretum collinum subsp suluense may have absorbed di-n-octylphthalate from
soil. The structures of compound B and F were not elucidated because their yields
were not enough for spectroscopic analysis.
O
M/z = 369
M/z = 69
O
M/z = 369
M/z = 55
O
M/z = 42
M/z = 382

71
O
O
O
O M/z = 391.31
Figure 42: Structure of pollutant that masked compound from vial E
Figure 43: Mass spectrum of second unknown compound from vial E
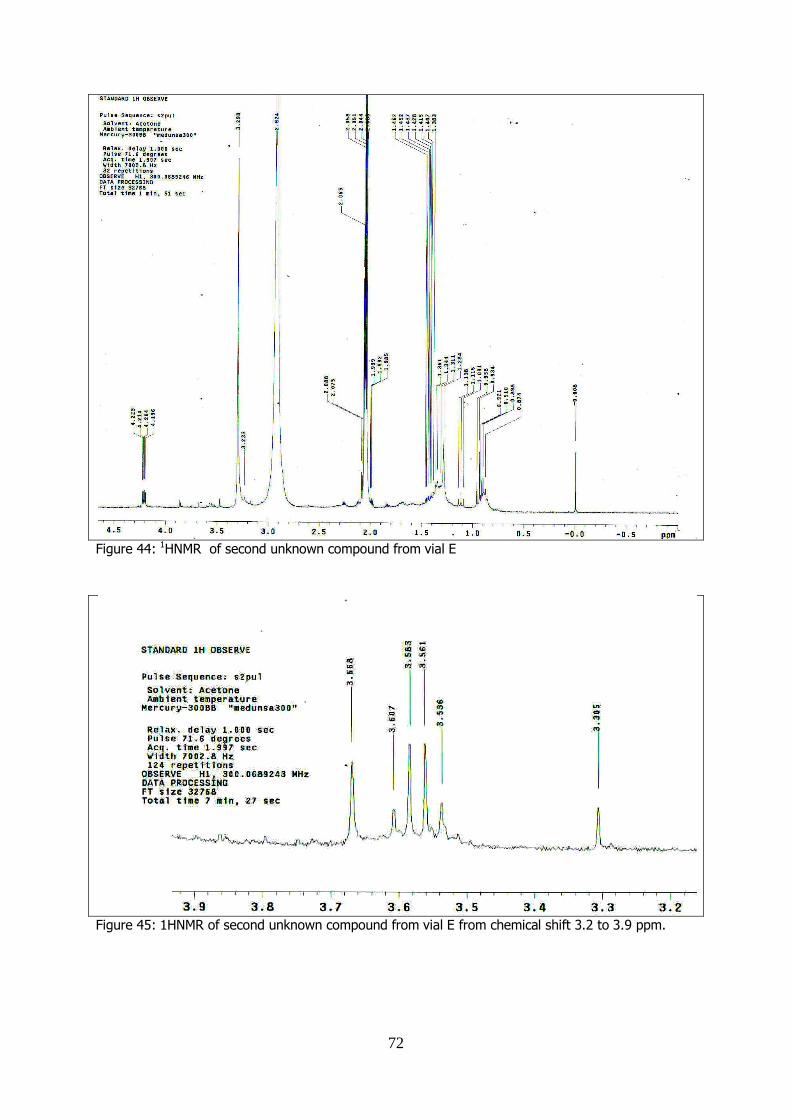
72
Figure 44: 1HNMR of second unknown compound from vial E
Figure 45: 1HNMR of second unknown compound from vial E from chemical shift 3.2 to 3.9 ppm.

73
Figure 46: 1HNMR spectra from the region of 7.3 to 8.4ppm chemical shift.
O
O
O
O
1
2
3
4
5
6
7
8
910
11
12
13
14
15 18
19
20
21
22
2316
17
24
Figure 47: Numbered structure of compound E.
4.18 1HNMR analysis of second unknown compound E
The yield of unknown compound was 4.8% and it was yellow in colour. This
compound analyzed using 1HNMR (300 MHz), using tetramethylsilane (TMS) as a
reference and chloroform as solvent. The data are listed in table 26.

74
Table 26: Interpretation of 1HNMR results of second unknown compound
Position Integration Multiplicity Chemical shift
1 3H Triplet 1.091-1.138
2 2H Sextet 2.044-2.088
3 2H Quintet 3.305
4 2H Quintet 3.536-3.668
5 2H Quintet 3.305
6 2H Quintet 3.536-3.668
7 2H Quintet 3.305
8 2H Triplets 1.985-1.999
9 - -
10 - -
11 1H Doublets 4.196& 4.204
12 1H Doublet of doublets 7.738-7.768
13 1H Doublet of doublets 7.643 - 7.672
14 1H Doublets 4.214& 4.223
15 -
16 -
17 2H Triplets 1.985-1.999
18 2H Quintet 3.536-3.668
19 2H Quintet 3.305
20 2H Quintet 3.536-3.668
21 2H Quintet 3.305
22 2H Quintet 3.536-3.668
23 2H Quintet -
24 3H Triplets 1.091-1.138

75
Figure 48: FTIR spectrum of second unknown compound
4.19 FT-IR analysis of second unknown compound E
This compound analyzed using Fourier transform infrared spectroscopy. The carbon-
carbon single bonds on unknown compound in figure 46 were measured at 437.96
cm-1 to 650.72cm-1 wavelength in figure 48. The carbon-carbon and carbon-
hydrogen bonds in benzene ring of compound E in figure 47were measured at the
wavelength of 750.06 cm-1, 858.08cm-1, 952.27 cm-1, 1019.78 cm-1, 1096.00 cm-1
and 1108.77 cm-1 in figure 48. The carbon oxygen single bonds from ester groups at
compound E in figure 46 were measured at 1247.38 cm-1 and 1282.34 cm-1 in figure
48. The two functional groups C=O of esters in figure 48 were measured at 1708
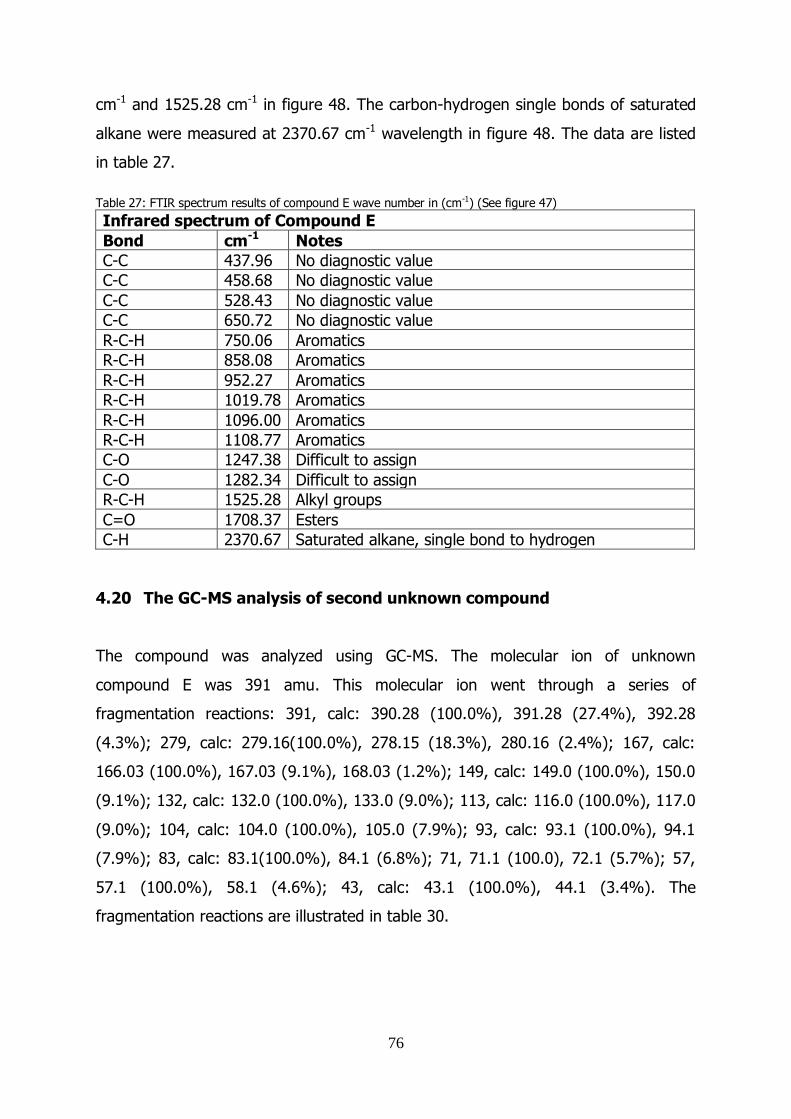
76
cm-1 and 1525.28 cm-1 in figure 48. The carbon-hydrogen single bonds of saturated
alkane were measured at 2370.67 cm-1 wavelength in figure 48. The data are listed
in table 27.
Table 27: FTIR spectrum results of compound E wave number in (cm-1) (See figure 47)
Infrared spectrum of Compound E
Bond cm-1 Notes
C-C 437.96 No diagnostic value
C-C 458.68 No diagnostic value
C-C 528.43 No diagnostic value
C-C 650.72 No diagnostic value
R-C-H 750.06 Aromatics
R-C-H 858.08 Aromatics
R-C-H 952.27 Aromatics
R-C-H 1019.78 Aromatics
R-C-H 1096.00 Aromatics
R-C-H 1108.77 Aromatics
C-O 1247.38 Difficult to assign
C-O 1282.34 Difficult to assign
R-C-H 1525.28 Alkyl groups
C=O 1708.37 Esters
C-H 2370.67 Saturated alkane, single bond to hydrogen
4.20 The GC-MS analysis of second unknown compound
The compound was analyzed using GC-MS. The molecular ion of unknown
compound E was 391 amu. This molecular ion went through a series of
fragmentation reactions: 391, calc: 390.28 (100.0%), 391.28 (27.4%), 392.28
(4.3%); 279, calc: 279.16(100.0%), 278.15 (18.3%), 280.16 (2.4%); 167, calc:
166.03 (100.0%), 167.03 (9.1%), 168.03 (1.2%); 149, calc: 149.0 (100.0%), 150.0
(9.1%); 132, calc: 132.0 (100.0%), 133.0 (9.0%); 113, calc: 116.0 (100.0%), 117.0
(9.0%); 104, calc: 104.0 (100.0%), 105.0 (7.9%); 93, calc: 93.1 (100.0%), 94.1
(7.9%); 83, calc: 83.1(100.0%), 84.1 (6.8%); 71, 71.1 (100.0), 72.1 (5.7%); 57,
57.1 (100.0%), 58.1 (4.6%); 43, calc: 43.1 (100.0%), 44.1 (3.4%). The
fragmentation reactions are illustrated in table 30.
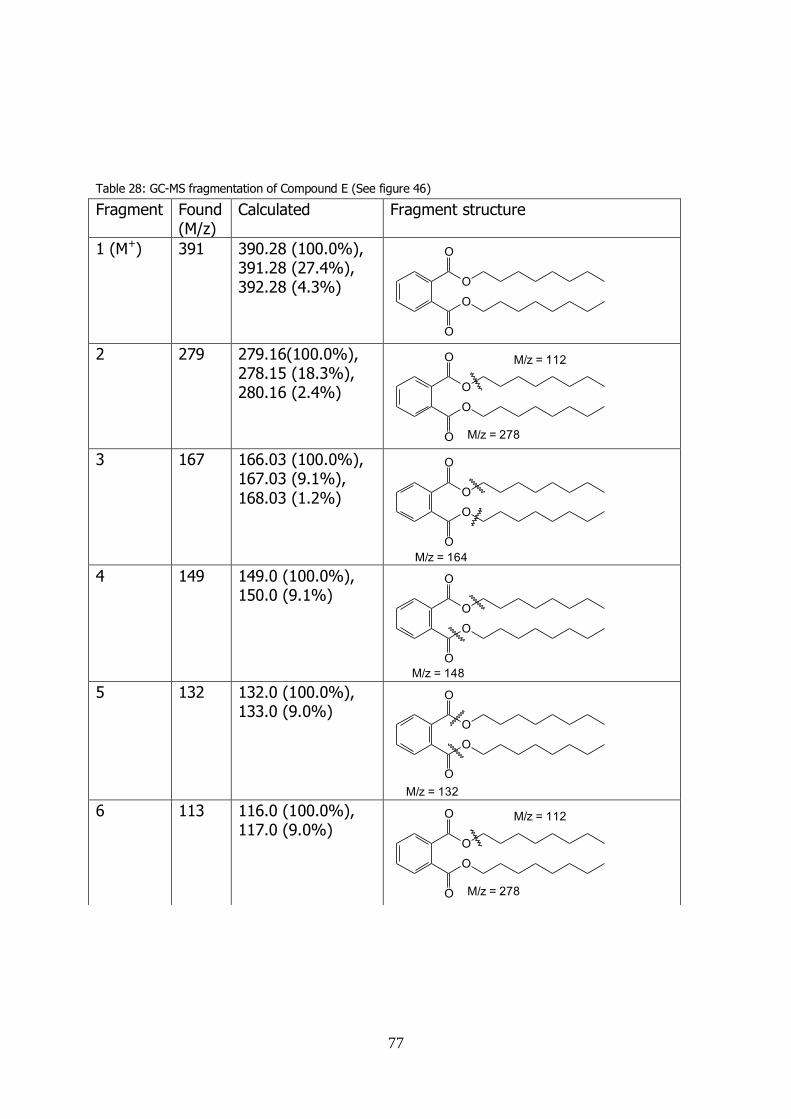
77
Table 28: GC-MS fragmentation of Compound E (See figure 46)
Fragment Found (M/z)
Calculated Fragment structure
1 (M+) 391 390.28 (100.0%), 391.28 (27.4%), 392.28 (4.3%)
2 279 279.16(100.0%),
278.15 (18.3%), 280.16 (2.4%)
3 167 166.03 (100.0%),
167.03 (9.1%),
168.03 (1.2%)
4 149 149.0 (100.0%),
150.0 (9.1%)
5 132 132.0 (100.0%),
133.0 (9.0%)
6 113 116.0 (100.0%),
117.0 (9.0%)
O
O
O
O
O
O
O
O
M/z = 112
M/z = 278
O
O
O
O
M/z = 164
O
O
O
O
M/z = 148
O
O
O
O
M/z = 132
O
O
O
O
M/z = 112
M/z = 278

78
7 104 104.0 (100.0%), 105.0 (7.9%)
8 93 93.1 (100.0%),
94.1 (7.9%)
9 83 83.1(100.0%),
84.1 (6.8%)
10 71 71.1 (100.0),
72.1 (5.7%)
11 57 57.1 (100.0%),
58.1 (4.6%)
12 43 43.1 (100.0%),
44.1 (3.4%)
O
O
O
O
M/z = 104
O
O
O
O
M/z = 99
O
O
O
O
M/z = 85
O
O
O
O
M/z = 71
O
O
O
O
M/z = 57
O
O
O
O
M/z = 43

79
Chapter 5
Conclusion
5.1 Background
Borek (2001) found that some antioxidant compounds can protect against
cardiovascular diseases and reduce risk factors for heart attacks as well as stroke
and blood pressure, whereas other antioxidant compounds increase circulation in
capillaries and prevent clot-forming platelet activity and inflammation. According to
Pinto et al (2000) some antioxidant compounds have anti-cancer activity that protect
against free radical and carcinogen induced DNA damage and increases carcinogen
detoxification and also stop the growth of a wide variety of human cancer cells
including breast, colon and prostate cancer.
5.2 Antioxidant Activity
In conclusion unknown compound A which was found to be Olean-12-ene-3-one
isolated from Combretum collinum subspecies suluense, was found to have
antioxidant activity and it must undergo further tests to find out if it can protect
against cardiovascular diseases, heart attack and if it can stop the growth of human
cancer cells which include breast; colon and prostate cancer, which are considered
to be dangerous diseases.
5.3 Inhibition of bacterial strain by two isolated compounds
An olean-12-ene-3-one was found to inhibits the growth of Escherichia coli at 0.5689
mg/ml concentration and Staphylococcus aureus at 3.846 mg/ml in table 21 & 22.
Compound E which was contaminated with dioctylphthalate was found to inhibit the
growth of S. aureus at 1.479 mg/ml and E. coli (0.5689 mg/ml) in table 21 & 22.

80
These two compounds can be modified and used as the remedy for diseases caused
by S. aureus and E. coli.

81
Chapter 6
References
Abebe, D., 2001. The role of herbal remedies and the approaches towards their
development, Proceedings of the workshop on development and utilization of herbal
remedies in Ethiopia Nazareth, 29.
Abebe, D., and Ayethu, A., 1993. Medicinal plants and enigmatic health practices of
northern Ethiopia, Addis Ababa, Ethiopia.
Adjanounhoun, E.J., Ahyi, M.R.A., Assi. A., Chibon, L., Eyme, J., Garba, M., Gassita,
J.N., Goudote, E., Guinko, S, Keita, A., Lo, I., 1986. Contribution aux etudes
ethnobotaniques et floristique au Togo. Agence de Cooperation Culturelle et
Technique. ACCT, Paris, 133.
Agency for toxic substances and disease registry, 1997, Toxicological profile for di-
n-octylphthalate, Atlanta, Department of Health and Human services, Public Health
service, CAS No. 117-84-0.
Akerele, O., 1988. Medicinal plants and Primary Health Care: Agenda for action,
fitoterapia, volume Lix, no.5, 355-363.
Alexander, D.M., 1992. Antimicrobial testing of selected plant extracts from
Combretum species, South African Journal of science, 88, 342-344.
Ames, B.N., Jiang, Q., Christen, S., and Shigenaga, M.K., 2001. -Tocopherol, the
major form of vitamin E in the US diet, deserves more attention, The American
Journal of clinical nutrition, 74, 714-722.
Andrews, J.N, 2001, Determination of minimum inhibitory concentrations. Journal of
antimicrobial chemotherapy 48, 5-16.

82
ApSimon, J. W., Badripersand, S., Nguyen, T.T.T and Pike, R., 1978. Approaches to
the synthesis of the triterpenoids.(III). Some Cis-decalins corresponding to rings D
and E of some pentacyclic triterpenes., CAN. J.CHEM.vol.56, 1653.
Asfaw, N., Begaz, A., and Lwande, W., 1993. Constituents of essential research, 5,
487-498.
Ashcraft, A.E., 1997. Ionization methods in organic mass spectrometry, Analytical
monograph, Royal society of chemistry, UK.
Asres, K., Gibbons, A.W., Phillipson, J.D. and Mascagni, P, 1986. Alkaloids of
Ethiopian Calpurnia aurea subsp aurea. Phytochemistry, 1443-1447.
Asres, K., William, A., Gibbons, J., Phillipson, D., and Mascagni, P., 1989.
Phytochemistry, 25, 1443-1447.
Asres, K., Bucar, F., Kartnig, T., and Witvrouw, M., 1989. Antiviral activity against
Human Immunodeficiency Virus Type1 (HIV-1) and Type2 (HIV-2) of
ethnobotanically selected Ethiopian Medicinal plants physiotherapy Research, 62-69.
Asres, K., Bucar, F., Karting, T., Witvrouw, M., and De clergy., 2001. Antiviral
Activity against Human Immunodeficiency Virus Type1 (HIV-1) and Type 2 (HIV-2)
of ethnobotanically selected Ethiopian medicinal plants Phytotherapy Research
vol.15, 62-69.
Alice, A., 2004. Walter Sisulu National Botanical Garden.
Baille, L., Towned, T., Walker, N., Eriksson, U., and Williamson, D., 2004.
Characterization of the human immune response to the UK anthrax vaccine.
Federation of European microbiological society’s immunology and medical
microbiology, 42, 267-270.

83
Baker, J.T, 2009. Saponins.
Bardhan, J.C., and Sengupta, S.C. 1932, J. Chem. Soc, 2520 and 2798.
Begue, W.J., and Kline, R.M., 1972. The use of tetrazolium salts in bioautographic
procedure. J. chromatography, 88, 182-184.
Bein, E., 1996. Useful trees and shrubs in Eritrea Regional soil conservation unit,
Nairobi, Kenya.
Bender, D.A, 2003. Nutritional biochemistry of the vitamins Cambridge, 357-384.
Berg and Corner. 2005. Moraceae-Ficus, South African Journal of Botany, 642-649.
Bishayee, A and Dhir. N, 2009. Resveratrol-mediated chemoprevention of
diethylnitrosamine-initiated hepatocarcinogenesis, inhibition of cell proliferation and
induction of apoptosis, chemical-biological interaction, 131-144.
Black, R.E., 1993. Epidemiology of diarrhoeal disease. Implications for control by
vaccines. Vaccine11, 100-106.
Black, R.E., Brown, K.H., and Becker, S., 1984. Effect of diarrhoea associated with
specific enteropathogens on the growth of children in rural Bangladesh. Pediatrics,
vol 73, 799-805.
Borek, C, 2001. Antioxidant health effects of aged garlic extract. J. nutr. 131,
1010s-1015s.
Boyce, J.M., White, R.L., and Spruill, E.Y., 1983. Impact of methicillin – resistant
Staphylococcus aureus on the incidence of nosocomial Staphylococcal infections. J
infects Dis, 148, 763.

84
Brady, J.E & Senese, F., 2004. Chemistry matter and its changes, 113.
Brand-Williams, W., Cuvelier, M.E., and Berset, C., 1995. Use of a free radical
method to evaluate antioxidant activity, Journal of Ethnopharmacology, 25-30.
Cáceres-Castillo, D, Gonzalo. J, Mena-Rejón, Cedillo-Rivera, R, Quijano, L, 2008. 21-
Hydroxy-oleanane type triterpenes from Hippocratea excelsa, Phytochemistry, 1057-
1064.
Cai, J., Liu, M., Wang, Z and Ju, Y, 2005. Biol.pharm. Bull. 193-196.
Carr, J.D., and Rogers, C.B., 1987. Chemosystematic studies of the genus
Combretaceae, 1A, convenient method of identifying species of this genus by a
comparison of the polar constituents extracted from leaf material. South African
Journal of Botany, 53, 173-176.
Carr, J. D., 1988. Combretaceae in Southern Africa. Tree society of Southern Africa,
49.
Castanẽda-ovando, A., Pacheso-Hernández, M., Páez-Hernández, M., Rodriquez, J.A
and Galán-Vida, A., 2009. Chemical studies of anthocyanins, A review food
chemistry, 113, 859-871.
Chhabra, S.C., Mahunnah, R.L., and Mshiu, E.N., 1989. Plants used in traditional
medicine in eastern Tanzania. II. Angiosperms (Capparidaceae-Ebanaceae). J.
Ethnopharmacol, 25, 339-359.
Christie, W.W., 2009. The American oil chemist society. www.lipidlibrary.co.uk,
mass spectra of some miscellaneous artifacts and additives, 3.
CIA, 2009. Facts about Africa.

85
Coates- Palgrave, K., 2002. Trees of Southern Africa, Third edition. Struik
Publishers, Cape Town. Flowering plants of Africa, 44, 1759.
Coates-Palgrave, K., 1988. Trees of southern Africa, C.S. Struik publishers Cape
Town.
Coates-Palgrave, K, 1957. Tree of central Africa, 383.
Cordell, G. A, 1995, The Alkaloids: Chemistry and pharmacology, vol 47, p 20-40.
Dairkee, S. H and Smith, H.S, 1996. Genetic analysis of breast cancer pregression,
J. mammary gland biol. and neoplassa 1, 139-151.
Dellagreca. M., Fiorentino, A., Zarrelli, A., and Lavorgna, M., 2002. Phenanthrenoids
from wetland Juncus acutus. Phytochemistry, 60, 633-638.
Dellagraca, M., Fiorentino, A., Monaco, P., Pollio, A., and Previtera, L., 2000. Journal
of chemical ecology, 26, 587-600.
Dixon, R.A., Achnime, L., Kota, P., Liu, C.J., Srinivasa Reddy, M.S., and Wang, L,
2002. The phenylpropanoid pathway and plant defence-a genomic perspective.Mol.
plant pathol., 3, 371-390.
Dobbin, L., 1931. Collected papers of Carl Wilhelm Scheele.
Drummond, R.B and Coates-Palgrave, K., 1973. Common Trees of the Highweld.
ISBN, Rhodesia, 160.
Dubinovsky Michael and Tatiana Anderson, 2003. Toptropicals. A new generation of
Tropical plant store.

86
Edreva.A, Velikova.V, Tsonev.T, Dagnon.S, Gürel. A, Aktas. L and Gesheva. E, 2008.
Stress-proctective role of secondary metabolites, Diversity of functions and
mechanism, Gen.Appl. Plant Physiology, special issue, 67-78.
Edreva, A., Yordanov., I, Kardjieva. R., Gesheva, E, 1998. Heat shock responses of
bean plants, Involvement of free radicals, antioxidants and free radical/active
oxygen scavenging system. Biol.plant, 185-191.
Adreva, A., 2005. Generation and scavenging of reactive oxygen species in
chloroplasts: a submolecular approach. Agric.Ecosyst.Env., 106, 119-133.
Cancerproject.org, 2009, Antioxidant and antitumor as well as anticancer
compounds found in vegetables and fruits, last viewed on march 2009.
Cho, E., 1990, Berberine hydrochloride, Pharmacopoeia of the People`s Republic of
China, vol 2, pp437.
Eloff, J.N., 1994. A sensitive and quick microplate method to determine the minimal
inhibitory concentration of plant extracts for bacteria, planta medica 64, 711-713.
Eloff, J.N., 1998a. Conservation medicinal plants, selecting Medicinal plants for
research and gene banking monographs in Systematic Botany from Missouri
Garden, conservation of plants Genes111, conservation and utilization of African
plants, 71, 209-222.
Eloff, J.N., 1999b. It is possible to use herbarium specimens to screen antibacterial
components in some plants. Journal of Ethnopharmacology, 67, 355-360.
Eloff, J.N., 2004. Quantifying the bioactivity of plant extracts during screening and
bioassay-guided fractionation, Phytomedicine, 11, 370-371.
87
Eloff, J.N., Famakin, J.O., and Katerere, D.R.P. 2005. Isolation of antibacterial
stilbene from Combretum woodii (Combretaceae) leaves. African Journal of
Biotechnology, 4, 1167-1171.
Engeh, J.E., Eloff, J.N., Masoko, P., Famakin, J.O., and Katerere, D.R.P., 2006.
Isolation of antibacterial compounds from erythrophyllum, Phytomedicine
programme, University of Pretoria, 51.
Ettre, L.S., 1981. Nomenclature of chromatography. II. Liquid chromatography,
J.Chromatogr.220, 29-63.
Ettre, L.S., 1981. Nomenclature of chromatography, III. General rules for future
revisions. J.Chromatogr.220, 65-69.
Ettre, L.S., 1993. Nomenclature for chromatography. Pure & Appl.chem. 65. 825.
Fetzer, J.C, 2000. The chemistry and analysis of the large polycyclic aromatic
hydrocarbons, New York, Wiley.
Geissman, T.A., Forkin, M., and Stotz, E.H., 1963. Flavonoid compounds, tannins,
lignins and related compounds, In pyrrole pigments, Isoprenoid compounds and
Phenolic plants constituents, New York, Elsevier.
Gelfland, M., Mavis, S., Drummond, R.B., Ndemera, B., 1985. The traditional
medical practitioner in Zimbabwe. Mambo Press, Gweru, Zimbabwe.
Germishuizen, G., and Meyer, N.L., 2003. Plants of southern Africa, an annotated
checklist, strelitzia 14, National Botanical Institute, Pretoria.
Godfrey, R.K and Wooten, J.W., 1981. Aquatic and Wetland plants of south eastern
United states, dicotyledons, University of Georgia Press, Athens Georgia, 933.

88
Goodman, M., and Morehouse, F., 1973. Organic molecules in Action, Gordon and
Breach, 351.
Grosvenor, P.W., Gothard, P.K., McWilliams, N.C., Supriono, A., Gray, D.O., 1995.
Medicinal plants from Riau Province, Sumatra, Indonesia, Part I. Uses. Journal of
Ethnopharmacology, 75-95.
Hadecek, F, 2002. Secondary metabolites as plant traits: current assessment and
future perspectives. Crit. Rev.plant sci., 21, 273-322.
Haerdi, F., 1964. Die Eingeborenen-Heilpflanzen des Ulanga-Distriktes Tanganjikas
(Ostafrika) Acta Tropica supplement, 8, 1-278.
Hayashi, H., Somei, J., Akei M., Suga, T., Kigami, H., Hiramatsu, N., Itoyama, H.,
Nakano, T and Okazaki, T., 1991. Journal of catalysis, vol.130, 547-555.
Hedberg, I., Hedberg, O., Madati, p., Mshigeni, K.E., and Mshiu, E. Inventory of
plants used in traditional medicine in Tanzania. Plants of the families Acathaceae-
Cucurbitaceae. J. Ethnopharmacol, 6, 29-60.
Heinrich, M., Ankli, A., Frei, B., Weimann, C., 1998a, Medicinal plants in Mexico:
Healers consensus and cultural importance, social science and Medicine, vol 47, pp
1859-1871.
Helmenstine, A.M., 2001. Amino acid, 1-14.
Hirt, U.H., Spingler, B and Wirth, T., 1998. New chiral hypervalent iodine
compounds in asymmetric synthesis. J.org.chem. 7674-7679.
Hong, T.D., Linington, S, and Ellis, R.H., 1996. Seed storage behaviour, a
compendium. Handbooks, for Genebanks, vol. 4, IPGRI.

89
Hostettmann.k and Marston. A, 1995. Saponins, Cambridge University Press,
Cambridge, UK.
Hutching, A., 1996. Zulu medicinal plants, an inventory, university of Natal press,
Pietermaritzburg.
Hutching, Anne and Van Staden, J., 1994. Journal of Ethnopharmacology, 43, 89-
124.
Hyde, M.A and Wursten, B., 2009. Flora of Zimbabwe, species information,
individual images, combretum apiculatum.
IUPAC Compendium of Chemical Terminology., 1997. Retardation factor ( in planar
chromatography), 845.
Jordaan, M., 2005. National Herbarium.
Jossang, A., 1996. Pentacyclic triterpenes from Combretum nigricans,
phytochemistry, 41, 591-594.
Karrier, P., Helfenstein, A., Wehrli, H and Wettstein, A., 1930.Pflanzenfarbstoffe
XXV, über die constitution des Lycopins und Carotins, Helvetica Chimica Acta 13,
1084-1099.
Katende, A.B., 1995. Useful trees and shrubs for Uganda Identification, propagation
and management for Agriculture and pastoral communities, Regional soil
conservation unit(RSCU), Swedish International Development Authority ( SIDA ).
Kinzler, K.W and Vogelstein, B., 1996. Lessons from hereditary colorectal cancer,
cell 87, 159-170.

90
Kirchmann, H., Astrum, G and Jonsali, G., 1991. Organic pollutants in organic
sewage sluge. 1. Effect of toluene, naphthalene, 2-methylnaphthalene, 4-
nonylphenol, and di-2-ethylhexylphthalate on soil biological processes and their
decomposition in soil. Swedish J. Agric. Res 21, 107-113.
Kirkwood, J.C., Scheurer, C., Chernyak, V., Mukamel, S., 2000. Simulations of
energy funneling and time and frequency-Gated fluorescene in Dendrimers, J.chem.
phys.2000, 112, 3572-3579.
Knekt, P., Heliovaara, M., Aho, K., 2000. Serum selenium, serum alpha-tocopherol,
and the risk of rheumatoid arthritis. Epidemiology, 1, 402-5.
Koizumi, K., Iwasaki, Y., Narukawa, M., Litsuka, Y., Fukao, T., Seki, T., Ariga, T and
Watanabe, T, 2009. Diallyl sulfides in garlic active both TRPA1 and TRPV1,
Biochemical and biophysical research communications, 545-548.
Kotze, M., and Eloff, J.N., 2002. Extraction of antibacterial compounds from
Combretum microphyllum (Combretaceae) S. Afr.J. Bot., 68, 62-67.
Koziol, A., Kosturkiewcz, Z and Podkowinska, H, 1978, Structure of the Alkaloid
Lupinine, vol 6, p 60-780.
Kokwaro, O., 1976. Medicinal plants of East Africa. East African Literature, Nairobi.
Kowalska, T., and Shema, J., 2006. Preparative layer chromatography,
chromatographic science series, 95, 3-115.
Kossel, A, 1891. Über die chemische zusammensetzung der zelle, Archiv für
physiologie, 181-186.
Langkilde, F.W., Brouwer, A.M., Negri, F., Zerbetto, F and Orlandi, G., 1994. Journal
of physical chemistry, vol.98, 2255.
91
Lawrence, G.H.M., 1951. The taxonomy of vascular plants, Macmillan, New York.
Leisner, O.A., 2000. Seed plants of Southern Africa families and genera, strelitzia
10, National Botanical Institute, Pretoria.
Letcher, R.M, and Nhamo, L.R.M., 1971. Chemical constituents from the
Combretaea, part1, Substituted phenanthrenes and 9, 10-dihydrophenanthrenes
from the heartwood of Combretum appiculum. Journal of the chemical society C,
3070-76.
Letcher, R.M., Nhamo, L.R.M, and Gumiro, I.T., 1972. Chemical constituents of the
Combretaceae, partII, substituted phenanthrenes and 9, 10-dihydrophenanthrenes
and a substituted bibenzyl from the heart wood Combretum molle. Journal of the
chemical society, Perkin transaction1, 206-210.
Liu, M., Wang, Z., Ju, Y., Zhou, J.B., Wang, Y and Wong, R.N, 2004. Biol.pharm.
Bull, 1059-1065.
Lo, S.F., Mulabaga, I.V., Chen, C.L., Kuo, C.L., and Tsay, H.S., 2004. J Agric food
chem., 52, 6916-9.
Long-ze LIN, G., Cordell, A., Chao-zhou, N., and Clardy, J., 1990. A Quassinoid from
Brucea javanica. Phytochemistry, 29, 2720-2722.
Luypaert, J., Zhang, M. H., Massart, D.L., 2003. Feasibility study for the use of near
infrared spectroscopy in the qualitative and quantitative analysis of green tea,
Camellia sinensi (L), Analutica Chimica Acta, 478, Elsevier, 303-312.
MacGaw, L.J., Rabe, T., Jager, A.K., Sparg, S.G., and Eloff, J.N., 2001. An
investigation of the biological activity of Combretum species, J. Ethnopharmacol,
vol. 75, 45-50.

92
Majumder, P.L., and Pal, S., 1990. Asteroidal ester from Coelogyne uniflora.
Phytochemistry, 29, 2717-2720.
Majumder, P.L and Pal, S., 1992. Rotundatin, a new 9,10-dihydrophenanthrene
derivative from Dendrobium rotundatum, Phytochemistry, 3225-3228.
Martini, N., and Eloff, J.N., 1998. The preliminary isolation of several antibacterial
compounds from Combretum erythrophyllum (Combretaceae), J.Ethnopharmacol,
and vol 62, 255-263.
Martini, N., Katerere, D.R.P., and Eloff, J.N., 2004a. Antibacterial flavonoids isolated
from Combretum erythrophyllum (Burch) sond (Combretaceae), S.Afri, J. Bot, 70,
310-312.
Martini, N., Katerere, D.R.P., and Eloff, J.N., 2004b. Biological activity of five
antibacterial flavonoids isolated from Combretum erythrophyllum (Combretaceae),
J. Ethnopharmacol, vol. 93, 207-212.
Masoko, J.Picard, and Eloff, J.N., 2006. African Journal of Biotechnology,
Bioautography indicates the multiplicity of antifungal compounds from twenty – four
Southern African combretum species (Combretaceae), 5(18), 1626-1627.
Masoko, J.Picard, and Eloff, J.N., 2005. Antifungal activities of six South African
Terminalia species (Combretaceae), Journal of Ethnopharmacology, 99, 301-308.
McMurry, J., 2006. Organic chemistry, 429-433.
Michael. E.Agnes. 1988. Webster`s New world dictionary. Third college Edition, 131.
Miller, J.M., Kirchner, R.G., Rice, R.G., 1963. Thin-layer chromatography AAAKhrem,
AIKuznetsova Russ chem. rev. J. Agric. food chem., 2, 1031-1033.

93
Miller, J.M., Kirchner, J.G., Rice, R.G., 1962. The story of Thin-layer chromatography.
J.Agr. food chem., 2, 1031-1033.
Miller, J.H., 1972. Experiments in molecular Genetics. Cold spring Harbor, Ny. Cold
spring Harbor Laboratory.
Milner, J.A, 2001. Mechanism by which garlic and allyl sulfur compounds suppress
carcinogen bioactivation, Garlic and carcinogenesis, Advances in experimental
medicine and biology, 69-81.
Molyneux, P., 2004. The use of the stable free radical diphenylpicrylhydrazyl (DPPH)
for estimating antioxidant activity, Songklanakarin J.Sc. Technol, 26, 211-219.
Monela, G.C., and Kihiyo, V.B.MS., 1999. Wood energy in sub-Saharan Africa,
London, 153-160.
Moran, C.R., Hoshizaki, B.J., 1995a. Fern Grower`s manual, 519-533.
Mukamel, S., Tretiak, S., Wagersreiter, T., Chernyak, V., 1997. Electronic coherence
and collective optical excitations of conjugated molecules, Science, 277, 781-787.
Mukamel, S., 2000. Multidimensional Fentosecond Correlation spectroscopies of
electronic and vibrational excitations, Annu.Rev.Phys.chem, vol. 51, 691.
Munson, M., Field, F., 1966. Chemical Ionization mass spectrometry. I. General
introduction. Journal Chemical society, American chemical society, 172.
Nachlas, M.N., 1960. Lactate dehydrogenase, Analytical Biochemistry, 1, 317.

94
Naimi, T.S., Le Dell, K.H., Como – sabetti, K., Borchardt, S., and Boxrud, D.J., 2003.
Comparison of community and health care associated methicillin – resistant
Staphylococcus aureus infection .JAMA, 290, 2976 – 2984.
Neuwinger, H.D., 2000. African traditional medicine. Dictionary of plant use and
Applications, Medpharm Scientific Publishers. Stuttgart, Germany, 589.
Njoroge, G.N., and Bussmann, R.W., 2006. Journal of ethno biology and ethno
medicine, 2, 54.
Notten, L., 2005. Calpurnia aurea, Kirstenbosch National Botanical Garden.
Okafor, J. C., 1967. Bolm soc broteriana, se`r 241, 137.
Reynolds, J., 2005. Richland College. Lab procedures manual for microbiology media
preparation.
Pegel, K.H., and Rogers, C.B., 1985. J.chemistry.soc, Perkin Trans, 1, 1711.
Pettit, G.R., Singh, S.B., Niven, M.L., Schimidt, and Hamel, E., 1996. Isolation,
structure, synthesis, and antimiotic properties of combretastins β-3 and β-4 from
Combretum caffum. Journal of natural products, 51, 517-527.
Pinto, J., Lapsia, S., Shah, A., Santiago, H and Kim, G, 2000. Nutritional and cancer
prevention, new insight into the role of phytochemicals, advances in experimental
medicine and biology, 83-106.
Pitman, N., and Palmer, E., 1972. Trees of southern Africa. A. A. Balkema, Cape
Town.

95
Poirier, R.H., Kahler, E.J and Benington, F., 1952. The chemistry of hydrazyl free
radicals.I. Spectrophotometric evidence on the structure of α, α-diphenyl-β-
picrylhydrazyl and α, α-diphenyl- β-oxyhydrazyl, J.Org.chem, 1437-1445.
Pooley, E , 1993. The complete field guide of trees of Natal Zululand and Transkei.
Natal flora publications Trust, Durban.
Recommendations on Nomenclature for chromatography. 1972. Information bulletin
appendices on tentative Nomenclature, symbols, units and standards, No.15.IUPAC
Secretariat; oxford.
Rimm, E.B., Stampfer, M.J., 1993. Vitamin E consumption and the risk of coronary
heart disease in men. Engl J Med, 328, 1450-6.
Ritter, F.J., Meyer, G.M., 1962. Preparatory Thin-layer chromatography as an
alternate to column chromatography, Central Laboratory T.N.O, Delf, The
Netherlands, Nature, 193, 941-942.
Rogers, C.B., and Verotta, L., 1996. Chemistry and biological properties of the
African Combretaceae.
Rogers, C.B., 1989. New mono-and bi-desmosidic triterpenoids isolated from
Combretum padoides leaves. Journal of Natural products.52, 528-533.
Rozzi, N.L., Singh, R.K., Vierling, R.A., Watkins, B.A, Supercritical fluid extract of
lycopene from tomato processing byproducts, J. Agric.food chem, 5796-5802.
Sack, R.B., 1975. Human diarrhoeal disease caused by entertoxigenic Escherichia
coli. Annu Rev microbial, vol 29, 333-353.
Schmidt, E., Lotter, M, McClelland, W., Burrow. S., and Burrows, J.E., 2002. Trees
and Shrubs of Mpumalanga and Kruger National Park, 458.

96
Schimidt, A., Sivaraman, J., Li, Y., Larocque, R., Barbosa, J.A., Smith, C., Matte, A.,
Schrag, J.D and Cygler, M., 2001. Three-dimensional structure of 2-amino-3-
ketobutyrate CoA ligase from Escherichia coli complexed with a PLP-substrate
intermediate, inferred reaction mechanism, Biochemistry, 5151-60.
Shai, L.J., McGaw, L.J., Masoko, P., Eloff, J.N., 2008. Antifungal and antibacterial
activity of seven traditionally used South African plant species active against
Candida albicans. South African Journal of Botany, in Press, doi, 10, 1016.
Shimada, K.K., Fujikawa, K.Y and Nakamura, T., 1992. Antioxidative properties of
xanthan on autoxidation of soybean oil in cyclodetrin, Journal of Agriculture and
food chemistry, 945-948.
Siege, G., Malmstein, M., Pietzsch, J., Schmidt, A., Buddecke, E., Michel, F., Plach,
M., and Schneider, W., 2004. The effect of garlic on arteriosclerotic nanoplaque
formation and size, phytomedicine, international Journal of phytotherapy and
phytopharmacology, 24-35.
Silva, T.M.S., Camara, C.A., Lins, A.C., Barbosa, J.M., Da Silva, E.M.S., Freitas, B.M
and Dos Santos, F.D.A., 2006. Chemical composition and free radical scavenging
activity of pollen loads from stingless bee Melipona subnitida ducke, Journal of food
composition and analysis, 507-511.
Skoda-foldes, R. and Takaes, E., 2008. Application of aminocarbonylation in the
synthesis of new steroidal compounds. University of Pannonia School of chemical
sciences, 2.
Southon, I.W., and Buckingham, J., 2003. Angewandte chemie international edition
in English, 561-562.

97
Sparatore, A., Tasso, B., Boido, V and Sparatore, F., 2005, Helvetica Chimica Acta,
Epimerization of Lupinine to Epilupinine and vice versa. Reexamination of the
structures of lupinal and Epilupinal, vol.88, p245.
Stace, C.A., 1969. Bot J. Linn.soc., 62, 131-168.
Stahl, E., 1968. Nomenclature in chromatography. Chromatographica 1, 338-342.
Storrs, A.E.G., 1995. Know your trees, some common trees found in Zambia,
Regional soil conservation unit (RSCU).
Swanson, J.E., Ben, R.N., Burton, G.W and Parker, R.S., 1999. Urinary excretional of
2,7,8-trimethyl-2-(β-carboxylethyl)-6-hydroxychroman is a major route of
Elimination of -tocopherol in humans. The Journal of lipid Research, 40. 665-671.
Teklehaymanot, T., and Giday, M., 2007. Ethnobotanical study of medicinal plants
used by people in Zegie Peninsula, Northwestern Ethiopia, J.Ethnobiol Ethno med,
vol.1, 3-12.
Theodora.maps, 2009, Maps of Africa, last viewed on August 2009.
Tretiak, S., Mukamel, S., 2002. Density matrix analysis and simulation of electronic
excitations in conjugated and aggregated molecules, chem., Rev, 102, 3171-3212.
Tryon, R.M., and Gastony, G.J., 1975. The biography of endemism in the
Cyntheacea. Fern Gaz, Systematic, Pteridophyta.
Van den bos, A., 2004. Filicium decipiens (Japanese fern tree), aycronto.
Van Wyk, B and Van Wyk, P., 1997. Field Guide to Trees of southern Africa. Struik
publishers Ltd, S 25.

98
Verotta, L & Nadia A. El-sebakhy, 2001. Cycloartane and oleanane saponins from
Astragalus sp. Studies in natural product chemistry, 179.
Wang, Y., Addess, K.J., Chen, J., Gear, L.Y, He, J., He, S., Lu, S., Madej, T.,
Marchler-Bauer, A., Thiessen, P.A., Zhang, N and Bryant, SH., 2007. MMDB.
Annotating protein sequences with entrez`s 3D-structure database, Nucleic acids,
D298-300.
Wang, Y., Che, C., Chiu, J and He, Q, 2007. Diosin (Saponin)-induced Generation of
Reactive oxygen species through mitochondria dysfunction, a proteomic-based
study, American chemical society, 4703-4710.
Wang, Z.H., Li, W.Y., Li, F.L., Zhang, L., Hua, W.Y,Cheng, J.C and Yao, O.Z, 2009.
Synthesis and antitumor activity of 7-azaindirubin, Chinese chemical letter, 542-544.
Warrier, P.K., Nambiar, V.P.K., Ganapathy, P.M., 2001. Some important medicinal
plants of the western Ghats India, a profile, 398.
Watt, J.M., and Breyer – Brandwijk, M.G., 1962. The Medicinal and poisonous plants
of Southern and Eastern Africa. 2nd Edition, Livingstone, London, 194.
Watt, J.M., and Breyer-Brandwijk, M.G., 1932. The medicinal and poisonous plants
of southern Africa. Livingstone, Edinburgh.
Wendland, R and Lalondse, J., 1954. Organic synthesis, 757.
WHO, 1978. The promotion and development of traditional medicine. Technical
report series 622. Geneva.
Wickens, G.E., 1973. Flora of Tropical East Africa. East African community.

99
Wilczura-wachnik, H., Yahuz, A.G and Myslinski, A, 2008. Calorimetric study of α-
tocopherol solubility in reverse of AOF micelles , Journal of colloid and interface
science, 520-525.