Embed Size (px)
Citation preview

Online Crowdsourcing Subjective Image QualityAssessment ∗
Qianqian XuGraduate University, ChineseAcademy of Sciences, Beijing
100049, [email protected]
Qingming HuangGraduate University, ChineseAcademy of Sciences, Beijing
100049, [email protected]
Yuan Yao�
School of MathematicalSciences, LMAM and LMP,Peking University, Beijing
100871, [email protected]
ABSTRACTRecently, HodgeRank on random graphs has been proposedas an effective framework for multimedia quality assessmentproblem based on paired comparison method. With the ran-dom design on large graphs, it is particularly suitable forlarge scale crowdsourcing experiments on Internet. How-ever, to make it more practical toward this purpose, it isnecessary to develop online algorithms to deal with sequen-tial or streaming data. In this paper, we propose an onlinerating scheme based on HodgeRank on random graphs, toassess image quality when assessors and image pairs enterthe system in a sequential way in a crowdsourceable sce-nario. The scheme is shown in both theory and experimentsto be effective by exhibiting similar performance to batchlearning under the Erdos-Renyi random graph model forsampling. It enables us to derive global rating and moni-tor intrinsic inconsistency in the real time. We demonstratethe effectiveness of the proposed framework on LIVE andIVC databases.
Categories and Subject DescriptorsH.5.1 [Information Interfaces and Presentation]: Mul-timedia Information Systems—Evaluation/methodology ; C.4[Performance of Systems]: Design studies; H.1.2 [Modelsand Principles]: User/Machine Systems—Human factors
General TermsPerformance, Experimentation, Human Factors
KeywordsSubjective Image Quality Assessment, Online, Crowdsourc-ing, Paired Comparison, HodgeRank, Random Graphs, Tri-angular Curl, Topology Evolution, Persistent Homology
∗Area chair: Heng Tao Shen.�Corresponding author.
Permission to make digital or hard copies of all or part of this work forpersonal or classroom use is granted without fee provided that copies arenot made or distributed for profit or commercial advantage and that copiesbear this notice and the full citation on the first page. To copy otherwise, torepublish, to post on servers or to redistribute to lists, requires prior specificpermission and/or a fee.MM’12, October 29–November 2, 2012, Nara, Japan.Copyright 2012 ACM 978-1-4503-1089-5/12/10 ...$15.00.
1. INTRODUCTIONImage Quality Assessment (IQA) fundamentally relies on
subjective experiments to capture the true perception of hu-man observers. Therefore, subjective tests are often used toprovide the ground-truth and verification for objective mod-els in IQA. In a typical Mean Opinion Score (MOS) test [1],individuals are asked to give a rating from Bad to Excel-lent (e.g. Bad-1, Poor-2, Fair-3, Good-4, and Excellent-5)to grade the quality of an image. However, such a test maysuffer from various problems such as ambiguity in defini-tion of scales, dissimilar interpretations of the scale amongusers, etc. [7]. Therefore, paired comparison method is re-cently gaining rising attention, in which raters are asked tocompare two images simultaneously and vote which one hasthe better quality; this is an easier and less demanding taskfor raters, whence more reliable in practice.
However, paired comparison approach leaves a heavierburden on participants with a larger number
(n2
)of compar-
isons. To address this issue, there has been a large volumeof statistical literature on deterministic incomplete block de-sign [11]. However, these designs are not suitable for crowd-sourcing on Internet where the raters are distributive overnetwork with varied backgrounds and it is hard to con-trol with traditional experimental designs. To meet thischallenge, the work in [15] proposes a randomized pairedcomparison method which randomly selects small subsets ofpairs for each assessor to view; the work shows that ran-domization is effective in reducing costs of a complete de-sign without jeopardizing the intended purpose. However, itleaves some open problems arising from randomization: (1)how to systematically deal with the resulting imbalancedand incomplete data; (2) how many samples are needed toachieve certain approximation of the complete design.
To address these two questions, a new framework calledHodgeRank on Random Graphs (HRRG) is introduced toanalyze the imbalanced and incomplete data in random de-sign experiments [40, 39]. In this framework, paired com-parison data are mapped to edge flows on a paired com-parison graph which is often a random multigraph in ran-dom design, and then Hodge decomposition on graphs [19]leads to an orthogonal decomposition of such edge flows intoglobal rating as gradient flow, local inconsistency as trian-gular curl flow, and global inconsistency as harmonic flow.Random graphs are shown as good models to design ran-dom sampling schemes in particular for crowdsourcing ex-periments. For example, Erdos-Renyi random graphs selectpairs of videos or images uniformly from all possible candi-
359Area Chair: Heng Tao Shen
dates, while random k-regular graphs keep a balanced sam-pling for each video/image which receives the same numberof comparisons against others and thus important for sparsegraph designs [39]. Consistent with recent developments inrandom graph theory, when sampling complexity is largeenough one can remove the global inconsistency. Experi-ments show that such a scheme in random designs providesgood approximations of global ratings derived from completeexperimental designs. In the successful developments abovefor subjective multimedia assessment, it leaves open to ex-plore the online algorithms to deal with streaming data incrowdsourcing experiments on Internet.Crowdsourceable quality assessment on Internet collects
paired comparison data in a distributive and streaming wayfrom a large population over Internet participants [7]. Thestreaming data calls for online algorithms as a sequentialdecision process via incremental data updates to improveits prediction accuracy. Although the image quality itselfis constant, in subjective IQA, preferences may vary overraters and image pairs with different criteria based on dif-ferent salient features of images in attention, noise from en-vironment, and levels of attention, etc. Thus it is a funda-mental question in subjective IQA to aggregate preferencesof multiple assessors into a consistent global score, reflectingthe statistical consensus on image quality over population.In this paper, we fill in this gap by presenting an onlinerating algorithm for HodgeRank on random graphs. Ouralgorithm is based on the classic Robbins-Monro procedure[28] which has been widely exploited in online learning, e.g.[32, 41].Online algorithms could offer significant computational
advantages over batch algorithms and the benefits of onlinelearning become more evident when dealing with stream-ing or large-scale data. Besides, to tackle the scenario thatin crowdsourcing assessors and image pairs come in an un-specified way, Erdos-Renyi random graph is systematicallyexploited in the paper which is equivalent to the standardassumption in statistical learning that the sample sequenceis independent and identically distributed (I.I.D.). Further-more, we note that online algorithms can be applied to moregeneral settings with edge independent sampling such asMutli-attribute random graphs, dependent sampling such asMarkov sampling, and tracking time-varying environment.We demonstrate the effectiveness and generality of the
proposed framework on LIVE [3] and IVC [2] databases,which include 15 different reference images and 15 distortedversions of each reference. Totally 186 observers have carriedout the experiment via Internet, providing us 23,097 pairedcomparisons. Experimental results show that the proposedonline rating algorithm is promising and a robust assessmentmethod suitable for crowdsourceable subjective IQA.Our contribution in this work is the following:1. To the best of our knowledge, it is the first time to pro-
pose an online rating framework for exploratory quality as-sessment. The framework provides the possibility of makingassessment procedure significantly faster without deteriorat-ing the accuracy, while maintaining the freedom of assessors.2. The online rating algorithm is based on Robbins-Monro
procedure or stochastic gradient descent for HodgeRank onrandom graphs. For an independent sampling process, theonline rating reaches minimax convergence rates whence asymp-totically as efficient as a batch algorithm. Moreover, online
tracking of ranking inconsistency is possible in this frame-work.
3. Crowdsourcing image assessment experiments are con-ducted based on Erdos-Renyi random graph designs, whichfurther confirms the theoretical analysis by showing thatthe proposed online rating algorithm achieves similar con-vergences to batch algorithms.
The remainder of this paper is organized as follows. Sec-tion 2 contains a review of related works. Then we describethe proposed framework in Section 3, and establish the on-line HodgeRank models based on batch HodgeRank. Thedetailed experiments are demonstrated in Section 4. Sec-tion 5 presents the conclusive remarks along with discussionfor future work.
2. RELATED WORK
2.1 Subjective Quality AssessmentThere have been studies on the design of subjective tests
to evaluate image/video quality in paired comparison method.One such example is [7], which proposes a crowdsourceableframework based on paired comparison. However, one majorshortcoming of [7] lies in that it makes a strong assumptionthat all paired comparison data collected are complete whichis impossible for a large number of videos. For example, theway to evaluate Transitivity Satisfaction Rate (TSR) de-pends on such complete design assumption. To address thisissue, the work in [15] suggests a randomised pair compari-son method in which a random subset of all pairs are chosenfor different participants to reduce the number of compar-isons. However, this work does not address how to deal withthe imbalanced and incomplete data arisen in random sam-pling, and also leaves the issue open on how many samplesone needs.
To solve these problems, [40, 39] present a frameworkbased on HodgeRank [19] on random graphs, which dealwith incomplete and imbalanced data distributed on ran-dom graphs and further derive the constraints on samplingcomplexity in crowdsourcing experiment that the randomselection must adhere to.
2.2 Online LearningOnline learning is a well established subfield of machine
learning concerned with estimation problems with limitedaccess to the entire data. It is a sequential decision process(ft)t∈N in the hypothesis space, where each ft is decided bythe current observation zt = (xt, yt) and ft−1 which onlydepends on previous examples, i.e. ft = Tt(ft−1, zt). Asa contrast, batch learning refers to a decision utilizing thewhole set of examples available at time t [33, 10]. Examplesof online learning algorithms include Perceptrons [29] andAdaline [35], etc.
The performance of the online learning algorithms is oftenmeasured by a loss function, which is often assumed to beconvex such that convex optimization technique can be usedto solve the problem. Typical examples of loss functionsinclude hinge loss and square loss. The hinge loss is used inSupport Vector Machines (SVM) [9] for classifications andthe square loss leads to Least Mean Square method, such asAdaline and its variations [36].
Because of the lower computational cost of online learningcompared with batch leaning, it has been shown to benefita number of computer vision applications such as object
360
recognition [12, 18], object detection [25, 38] and tracking[26, 17, 22]. The benefits of online learning become more ev-ident when dealing with streaming or very large-scale data.In this paper, we propose an online learning scheme based
on stochastic gradient decent method in the setting of crowd-sourceable subjective IQA.
2.3 Random GraphsRandom graph is a graph generated by some random pro-
cess [5, 8]. It starts with a set of n vertices and adds edgesbetween them at random. With such models we aim atcrowdsourcing experimental designs where assessors may se-lect image pairs at random. Different random graph mod-els produce different probability distributions on graphs.The most commonly studied one is the Erdos-Renyi randomgraph [16] which is a stochastic process that starts with nvertices and no edges, and at each step adds one new edgeuniformly. Besides, there are some other kinds of randommodels, such as random regular graph [37], preferential at-tachment random graph [4], small world random graph [34],and geometric random graph [24], which may also play im-portant roles under certain circumstances.However, as Erdos-Renyi random graph can be viewed as
a random sampling process of image pairs or edges inde-pendently and identically distributed (I.I.D.), and thus iswell suited to our online crowdsourcing test system. In thispaper, we particularly focus on this kind of random graph,Erdos-Renyi random graph, leaving other models for futurestudies.
3. ONLINE HODGERANKIn this section, we propose a new online design to con-
duct paired comparison for subjective IQA and Erdos-Renyirandom graph model is chosen to tackle the scenario thatin crowdsourcing raters and pairs come in an unspecifiedway. Specifically, we first describe Hodge theory on generalgraphs, and then explain how to develop the online ratingalgorithms. An upper bound for convergence of such on-line rating algorithms is given to justify the settings thatminimax parametric rate is met. Finally, we discuss how toonline track triangular curls and topological changement.
3.1 Batch HodgeRank on GraphsHodgeRank [19] is a general framework to decompose paired
comparison data on graphs, possibly imbalanced (where dif-ferent image pairs may receive different number of compar-isons) and incomplete (where every participant may onlygive partial comparisons), into three orthogonal components:
aggregate paired ranking =
global ranking⊕
local inconsistency⊕
global inconsistency
To be precise, consider paired ranking data on a graphG = (V,E), Yα : E → R such that Y α
ij = −Y αji where α is the
participant index. Without loss of generality, one assumesthat Y α
ij > 0 if α prefers i to j and Y αij ≤ 0 otherwise, with
the magnitude representing the degree of preference. In adichotomous choice, Y α
ij can be taken as {±1}.In subjective multimedia assessment, it is natural to as-
sume
Y αij = s∗i − s∗j + εαij (1)
where s∗ : V → R is some true scaling score on V and εαijare independent noise of mean zero and fixed variance.
Under such assumptions, Gauss-Markov theorem tells usthat the unbiased estimator is given by the following leastsquare problem
mins∈R|V |
∑i,j,α
ωαij(si − sj − Y α
ij )2, (2)
where ωαij denotes the number of paired comparisons on
{i, j} made by rater α. It can be rewritten as the followingweighted least square form
mins∈R|V |
∑i,j
ωij(si − sj − Yij)2, (3)
where Yij = (∑
α ωαijY
αij )/(
∑α ωα
ij) and ωij =∑
α ωαij .
To characterize the solution and residue of (3), we firstdefine the triangle set of G as all the 3-cliques in G:
T =
{{i, j, k}ε
(V3
)|{i, j}, {j, k}, {k, i}εE
}. (4)
Then every Y admits an orthogonal decomposition adaptedto G
Y = Y g + Y h + Y c, (5)
where
Y gij = si − sj , for some s ∈ RV , (6)
Y hij + Y h
jk + Y hki = 0, for each {i, j, k} ∈ T , (7)
∑j∼i
ωij Yhij = 0, for each i ∈ V . (8)
where Y g satisfies (6) and Y h satisfies two conditions (7)
and (8). The residue Y c actually satisfies (8) but not (7).
Residues Y h and Y c account for inconsistencies of the globalranking obtained which show the validity of the ranking andcan be further studied in terms of its geometric scale, namelywhether inconsistency in the ranking data arises locally orglobally. Local inconsistency can be fully characterized bytriangular cycles (e.g. i � j � k � i), while global in-consistency involves loops consisting nodes more than three(e.g. i � j � k � ... � i), which may arise due to dataincompleteness and once presented with a large componentindicates some serious conflicts in ranking data.
Global rating score can be the minimal norm least squaresolution s of the following normal equation
�0 s = δ∗0 Y (9)
where δ0 : RV → RE is a finite difference operator (matrix)on G defined by δ0((i, j), i) = −1, δ0((i, j), j) = 1, and oth-erwise zero, δ∗0 = δT0 W (W = diag(ωij)), Δ0 = δ∗0 · δ0 is theunnormalized graph Laplacian defined by (Δ0)ii =
∑j∼i ωij
and (Δ0)ij = −ωij , and (·)† is the Moore-Penrose (pseudo)inverse.
An interesting variation of this l2-norm scheme (3) is ananalogous l1-projection onto the space of gradient flows,
mins∈R|V |
∑i,j
ωij |si − sj − Yij |. (10)
361
This optimization problem is applied to the case that thenoise is sparse but can be large, often regarded as outliers.It is more robust to outliers when compared with the l2-norm, and thus can be regarded as robust ranking. Formore details, readers may refer to [19, 23].
As the input of this HodgeRank framework is a pairedcomparison multigraph (the whole set of paired comparisondata in one batch) provided by participants, we may call thistype of work as batch HodgeRank. For details of the theo-retical development, readers may refer to [19]. The work in[40] adopts such batch HodgeRank to obtain quality scoresof videos. However, for crowdsourcing test on Internet, par-ticipants and image pairs enter the system one by one in adynamic and random way. Therefore, batch HodgeRank isnot an efficient tool for crowdsourcing. To meet this chal-lenge, we propose an online HodgeRank as Robins-Monroprocedure or stochastic approximation of (9).
3.2 Online Rating AlgorithmsThe online rating algorithm considered in this paper is
constructed from Robbins-Monro procedure [28] to solve lin-ear operator equation Ax = b,
xt+1 = xt − γt(Atxt − bt), E(At) = A, E(bt) = b. (11)
Now consider the normal equation (9) for the least square
problem (2), Δ0s = δ∗0 Y . In this case, at time t when a newrating Yt(it, jt) = −Yt(jt, it) entered on pair (it, jt), we have
• At is a |V |×|V |matrix defined byAt(it, it) = At(jt, jt) =−At(it, jt) = −At(jt, it) = 1 and otherwise zero;
• bt is a |V |-dimensional vector defined by bt(it) = −bt(jt) =Yt(it, jt) and otherwise zero.
Let st = xt. The Robbins-Monro procedure becomes
st+1(it) = st(it)− γt[st(it)− st(jt)− Yt(it, jt)]
st+1(jt) = st(jt) + γt[st(it)− st(jt)− Yt(it, jt)] (12)
where the initial choice is s0 = 0 or any vector such that∑i s0(i) = 0, and the step size γt is a nonnegative sequence
whose choice is often taken in the following form
γt =a
(t+ t0)θ, θ ∈ [0, 1].
The choice of step size will be discussed in more detail inthe next subsection with a convergence analysis which showsminimax rates with independent and identically distributedsampling. Algorithm 1 below shows the procedure of thisonline rating method.For the sake of comparison, we also present a stochastic
subgradient method for online rating with l1-norm in (10),which is given by:
st+1(it) = st(it)− γt sign(st(it)− st(jt)− Yt(it, jt))
st+1(jt) = st(jt) + γt sign(st(it)− st(jt)− Yt(it, jt))
(13)
with similar choices on initial score and steps.Note that updates here only occur locally on the nodes
associated with edge {it+1, jt+1}, which is suitable for asyn-chronized parallel implementation.Note that for l1-based online algorithm it suffices to change
gij = sign(st(it)− st(jt)− Yt(it, jt)).
Algorithm 1: Online Rating Procedure.
1 Initialization:2 s0 = 0 or any vector such that
∑i s0(i) = 0; // Initialize
the quality scores of each images.3 With a new rating Yt(it, jt); // A new paired
comparison (it, jt) occurs at time t.4 Compute gij = st(it)− st(jt)− Yt(it, jt);5 Then6 st+1(it) = st(it)− γt ∗ gij ;7 st+1(jt) = st(jt)+ γt ∗ gij . // Quality scores at time t+1.
3.3 Convergence AnalysisThere have been studies on convergence analysis of sub-
gradient methods, e.g. [31]. Typical convergence resultsrequire the conditions that step sizes
∑t γ
2t < ∞ while∑
t γt = ∞, and boundedness of subgradients, which are inparticular s(i)− s(j)−Y (i, j) and sign(s(i)− s(j)−Y (i, j))here. When general convex loss functions are assumed, theanalysis is typically formulated as regret bounds [27].
In particular, when the square loss is adopted, one mayachieve the following probabilistic upper bound, whose proofis given by [21] for general edge independent random graphs,which in fact reaches the minimax optimal rates for para-metric regression up to a logarithmic factor.
In the following theorem, assume that Yt(it, jt) is an in-dependent and identically distributed (I.I.D.) sequence. Forexample, each rater follows a sampling on Erdos-Renyi ran-dom graph. Another example is Multiplicative-AttributeGraph Models [20] once node attributes are given which ishowever not pursued in this paper. The convergence analy-sis can be based on general Robbins-Monro procedure (11)with independent sampling sequence.
Define a random matrix
Πtk =
{(I − γtAt) . . . (I − γkAk) , k ≤ t;I, k > t.
(14)
If we replace Ai by A, we obtain a deterministic positivedefinite matrix, say Πt
k.The following lemma leads to a martingale decomposition
for error xt − x∗, given in [32, 41], which is crucial to leadto the error bounds.
Lemma. For all t ∈ N,
xt = Πt−11 x0 +
t−1∑k=1
γkΠt−1k+1bt (15)
and
xt − x∗ = Πt−11 (x0 − x∗)−
t−1∑k=1
ξk, (16)
where
ξk =
{γkΠ
t−1k+1((Ak − A)xk − (bk − b)), 1 ≤ k < t;
0, k ≥ t.
is a martingale difference sequence such that E[ξt : Ft−1] =0 for a filtration Ft−1 up to time t− 1.
The first part in error, Πt−11 (x0 − x∗), is called the ini-
tial error and the martingale difference tail,∑
ξk, is calledthe sample error. Initial error can be bounded deterministi-cally, while the sample error can be bounded via a Pinelis-Bernstein probabilistic inequality. Combining these bounds
362

will lead to the following theorem, whose derivation followsclosely [41].Theorem 3.3. Let E consists of the edge set of the ex-
pected graph, and 0 = λ0 < λ1 ≤ . . . ≤ λn−1 are eigenval-ues of expected graph Laplacian Δ0 = E(At). Assume thatA = 2 ∨ λn−1 and |Yt(i, j)| ≤ B. Then there exists a choiceof step size γt = a/(t + t0) (e.g. a = 1/λ1 and t0 ≥ B/λ1)such that the following holds for all t ∈ N with probability atleast 1− δ (δ > 0),
‖st − s∗‖2 ≤ 7√AB|E|λ3/21
t−1/2 log(t+ t0) · log 2
δ
where st is defined by (12).The theorem says that the online rating algorithm con-
verges to the underlying true score s∗ under independentsampling process. The convergence rate is minimax optimalat O(t−1/2). The choice of step size γt ∼ t−1 is crucial, withlarge enough t0. Although the choice of a and t0 does notaffect the asymptotic rate in theory, in practice they influ-ence the speed of convergence when t is small. We shall seethis in experimental section. Moreover, in our applications,we find the performance distinctions are ignorable betweentwo types of online algorithms, least square (12) and leastabsolute value (13), whence we do not pursue a thoroughconvergence analysis here for l1-based online rating (13).
Figure 1: Large curl due to multicriteria in pairedcomparisons among users. The image is undistin-guishable due to its small size, so image IDs in LIVEdatabase are printed here.
3.4 Online Tracking of Triangular CurlsHodge decomposition (5) has a component Y c which sat-
isfies Y cij + Y c
jk + Y cki = 0 for each triangle (i, j, k) ∈ T .
This encodes the information about triangular or local in-consistency. For a graph G = (V,E) whose 3-clique complexχG = (V,E, T ) does not contain a “loop” (i.e. the first Bettinumber β1 = 0), global inconsistency vanishes and such tri-angular inconsistency explains all sorts of inconsistency. Ithappens when Erdos-Renyi random graphs and k-regularrandom graphs are sufficiently dense [40, 39]. Due to suchan importance, it is desired to track triangular curls:
curlijk = Y cij + Y c
jk + Y cki = Yij + Yjk + Yki.
which is nothing but triangular trace of Y [19]. Curl is easyfor online and parallel realizations. In [40], another relative
curl is introduced as extensions of combinatorial intransitivetriangles,
rel-curlijk =|Yij + Yjk + Yki|
|Yij |+ |Yjk|+ |Yki|∈ [0, 1].
Relative curl on a triangle (i, j, k) ∈ T is one if and only if(i, j, k) is intransitive.
The existence of large curls or intransitive triangles maybe either due to noise or suggesting the existence of mul-ticriteria in paired comparisons. If the latter case happenson a triangule (i, j, k), on each edge say (i, j) ∈ E, it will
have a Yij consistently away from zero, and incur a largecurl. In Figure 1, we exhibit one example of such intransi-tive triangle existing in the data we collected so far, whichindicates a stable cyclic preference on a natural scene pic-ture in LIVE dataset such that JPEG2000 (img91) is betterthan Fast Fading (img91), Fast Fading (img91) is betterthan White Noise (img40), and White Noise (img40) is bet-ter than JPEG2000 (img91). This is due to the fact whendifferent pairs of images are presented to raters, differentsalient features are adopted by raters implicitly. Triangularcurls due to noise will vanish when the sample size goes toinfinity while curls due to multicriteria will persist with theincrease of sample complexity. Therefore, online tracking ofcurls will be useful to identify such a kind of inconsistency.
Algorithm 2 outlined below shows how to track the trian-gular curl in an online way.
Algorithm 2: Online Tracking of Curls.
1 With a new rating Y(t)ij ;
2 n(t+1)ij = n
(t)ij + 1; // n
(t)ij is the number of paired
comparisons up to time t.
3 Y(t+1)ij = (1− 1/n
(t+1)ij )Y
(t)ij + Y
(t)ij /n
(t+1)ij ; // Y
(t)ij
follows the same definition in Section 3.1.4 for each k s.t. (i,j,k) is a triangle do
5 curl(t+1)ijk = Y
(t+1)ij + Y
(t+1)jk + Y
(t+1)ki
rel-curl(t+1)ijk =
|curl(t+1)ijk
||Y (t+1)
ij |+|Y (t+1)jk
|+|Y (t+1)ki
|6 end
3.5 Online Tracking of Topology EvolutionThe work in [40] shows that when the resultant graph pro-
vided by assessors is connected, we can derive global scoresfor all the images in comparison from batch HodgeRank. Be-sides, when its clique complex is loop-free, there is no globalinconsistency whence tracking local inconsistency (triangu-lar curls) presented above will be enough. Motivated bythese two observations, [40] adopts persistent homology [14,42, 6, 13] to check if a given graph instance satisfies the twoconditions.
In fact, persistent homology is an online algorithm tocheck topology evolution when nodes, edges and trianglesenter in a sequential way. Here we just discuss in brief theapplication of persistent homology to monitor the numberof connected components (β0) and loops (β1) in our onlinesettings. In random graph designs for image comparisons,we can assume that the images (nodes) are created at thesame time, after that pairs of images (edges) are presentedto assessors independently one by one. A triangle {i, j, k}is created immediately when all the three associated edges
363

Figure 2: An example of persistence Barcodes ofBetti numbers .
appeared. In practice with sampling of multigraph data,one may consider certain thresholds on edges and trianglesfor their presence, which can be dealt with in a similar way.With such a streaming data, persistent homology may re-turn the number of β0 and β1 at each time when a newnode/edge/triangle is born.Figure 2 illustrates an example of this birth process and
its associated Betti numbers (β0 and β1) that are computedand plotted by JPlex [30]. At the first frame (say t = 0), 6images as nodes are collected, which corresponds to β0 = 6at t = 0 in Barcode: Betti 0. On the second frame (t = 1),an edge connecting a pair of nodes is created which dropsthe number of connected components from 6 to 5, i.e. β0 = 5at t = 1 in Barcode: Betti 0. The same procedure followsand particularly at the fifth frame t = 4, it creates a loopand there are 3 connected components in the graph, whichcan be read from β0 = 3 at t = 4 and β1 = 1 at t = 4,respectively. Note that after the thirteenth frame t = 12,there is only one connected component β0 = 1 left and noloop exists β1 = 0 as indicated by the Barcodes.
4. EXPERIMENTSIn this section, we systematically evaluate the performance
of the proposed online HodgeRank algorithm against batchHodgeRank. First, the datasets used for the experimentsare briefly explained. Then we present the experimental de-sign of obtaining online paired comparison data, followed bythe results with online and batch methods. Finally, we showhow to track the curls and topological evolution online withpersistent homology.
4.1 DatasetsTwo publicly available datasets, LIVE [3] and IVC [2],
are used in this work. The LIVE dataset contains 29 ref-erence images and 779 distorted images. The distorted im-ages are obtained using five different distortion processes–JPEG2000, JPEG, White Noise, Gaussian Blur, and FastFading Rayleigh. Considering the resolution limit of mosttest computers, we only choose 6 different reference images(480 × 720) and 15 distorted versions of each reference, fora total of 96 images. The second dataset, IVC, which is also
Figure 3: Images in LIVE and IVC databases (Thefirst six are images from LIVE and the remainingimages are from IVC).
a broadly adopted dataset in the community of IQA, in-cludes 10 reference images and 185 distorted images derivedfrom four distortion types–JPEG2000, JPEG, LAR Coding,and Blurring. Following the collection strategy in LIVE, wefurther select 9 different reference images (512 × 512) and15 distorted images of each reference. Eventually, we ob-tain a medium-sized image set that contains a total of 240images from 15 references, as illustrated in Figure 3. Notethat we do not use the subjective scores in LIVE and IVC,but only borrow the image sources they provide. Differentfrom them, we propose to assess image quality with pairedcomparison method. There are two aspects about the size ofdataset: (1) number of distortion types; (2) number of refer-ence images. The first is the number of nodes in our pairedcomparison graphs, which is n=16 here. Even on such ascale, it is almost impossible for a single person to performall
(n2
)paired comparisons. So it suffices to illustrate the
performance of online algorithm against batch algorithm.The second does not affect the computational complexityof algorithms, whence a random choice 15 from LIVE andIVC database is to show performance consistency over theseexamples.
4.2 Online Paired Data CollectionWe now present our experiment design for collecting the
set of online paired data. Different from traditional com-plete design in paired comparison, a session in our test canhave an arbitrary duration (down to a single pair) and par-
364
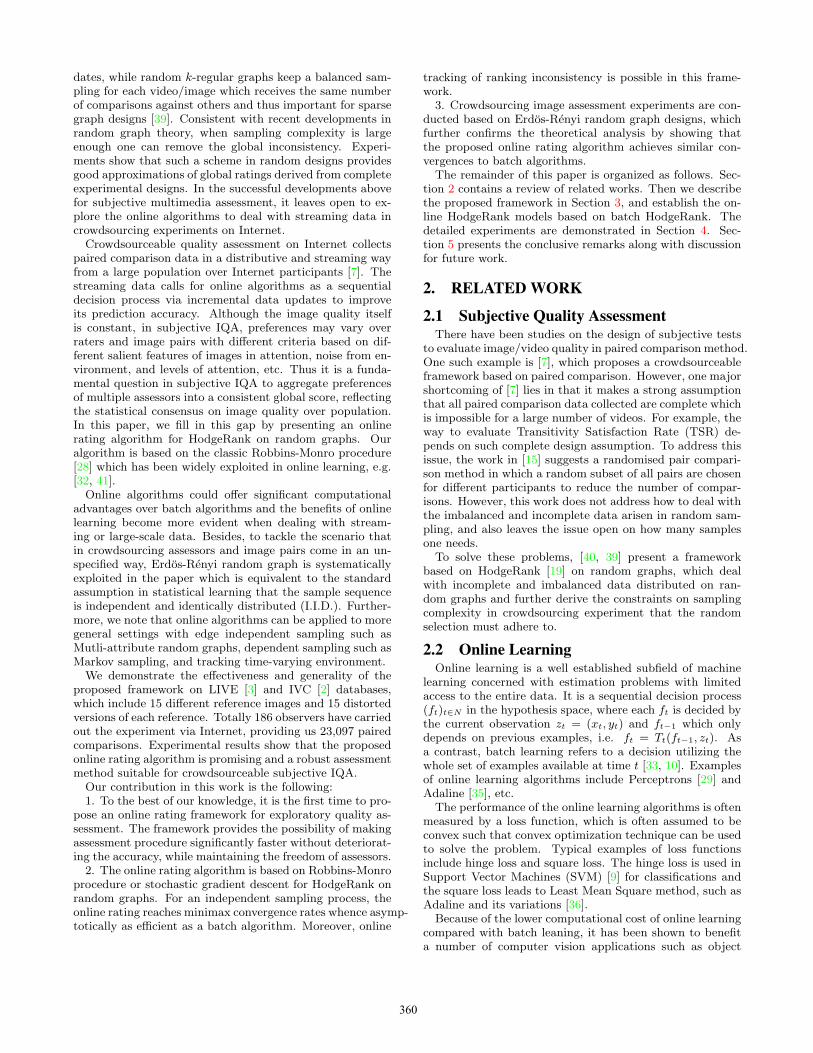
Figure 4: Number of paired comparisons each refer-ence received in LIVE and IVC databases.
ticipants are free to decide when to quit. In other words,the number of pairs (#pairs) shown to participants can beadjusted according to their time constraint and preference.That is, when a participant’s time is adequate, #pairs canbe a bigger value. But if he/she is under the pressure oftime or prefers not to spend more time with the experiment, #pairs will be smaller.Before starting the experiment, each participant is briefed
about the goal of the experiment and given a short trainingsession to familiarize themselves with the testing procedure.In the testing process, images are displayed side by side attheir native resolutions to prevent any distortions due toscaling operations performed by software or hardware. Be-sides, to make it impossible for participants to cheat oursystem by inputting “smart” answers, the order of each pairand the order within each pair are totally random for eachparticipant. Each assessor is allowed to take as much timeas needed to enter their choice. However, the assessors couldnot change their choice once entered or view the image again.Once the choice is entered, the next image pair is displayed.Moreover, we hope to avoid the situation with successive
pairs of test images from the same reference, to avoid con-textual and memory effects in their judgments of quality.For this purpose, after the playlist for one participant isconstructed, our program would go over the entire playlistto determine if adjacent pairs correspond to the same refer-ence. If such a case is detected, one of the pairs would beswapped with another randomly chosen pair in the playlistwhich does not suffer from the same problem.Finally, 186 observers of different cultural level (students,
tutors, and researchers), each of whom performs a variednumber of comparisons via Internet, provide 23,097 pairedcomparisons in total. The number of responses each refer-ence image receives is different, as illustrated in Figure 4.It should be noted that, for ref1-6 from LIVE database, westart our test from October 10th, 2011. Later, 9 referencesimages (ref7-15) from IVC database are added to our testsystem from November 2nd, 2011. Our collecting task is stillon-going now for further larger-scale studies.
4.3 Comparison with “Batch” HodgeRankThe experimental evaluation involves evaluating the on-
line HodgeRank algorithms (12) on various data sets againstthe performance of batch HodgeRank. We also comparethese algorithms against the l1-norm online algorithm in (13)on the same data sets.The metric that we used in the evaluation of the perfor-
mance of various algorithms is the Mismatch Ratio (MR),
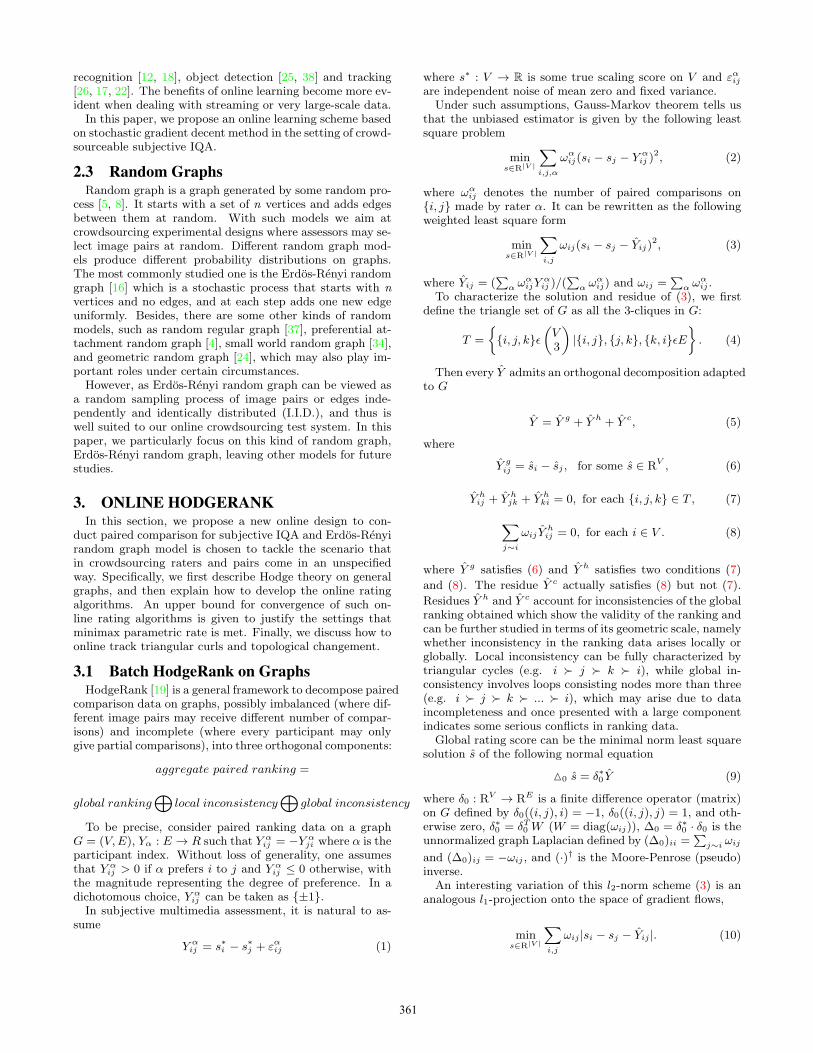
Figure 5: The impact of the t0 parameter on theperformances. MR (y-axis) versus the number ofsamples (x-axis) on reference1.
365

Figure 6: Experimental results of online HodgeRank vs. batch HodgeRank. MR (y-axis) versus the numberof samples (x-axis) on 15 reference datasets.
i.e., at time t, the percentage of mismatch pairs of a globalrating st made on all previous examples,
εt =1
2t
t∑τ=1
|sign(st(iτ )−st(jτ ))−Yτ (iτ , jτ )|, Yτ (i, j) ∈ {±1}
Since in this paper we use the simplest binary choice forYt(i, j), one natural performance measure for different al-gorithms is simply to count the ratio of mismatched pairedcomparisons up to time t. Minimization of such an objectivefunction is known to be NP-hard. However, in our experi-ments we find the batch HodgeRank, online l2 HodgeRankand online l1 HodgeRank exhibit similar effects on minimiz-ing such an objective function, whose distinctions thus canbe ignored in practice like this.Although in theory, the choice of t0 won’t affect asymp-
totic convergence rates (Theorem 3.3); one has to be carefulon choosing it in practice. First, we study the impact ofthe t0 parameter in (12) and (13) on the performances ofonline rating algorithms. For simplicity, we randomly takereference1 as an illustrative example while other referenceimages exhibit similar results. Figure 5 shows the influ-ences of t0 on mismatch ratios, in a comparison with batchHodgeRank. It can be seen from this figure that with the in-crease of collected data, the MR curve generally decreases.When t0 is chosen to be small, l2 online rating (12) showsbetter performance than l1 online (13). However, when t0increases (e.g. from 1 to 10000), such a performance differ-
ence diminishes and both methods approach performance ofbatch HodgeRank. We note that when t0 is chosen to be toolarge, initial tracking performance will drop which shows alag behind of batch learning curve. Although this does nothurt the long term behavior eventually, those who care theinitial iterations should be careful on this. In the followingexperiments, we will choose t0 = 1000 as a balance of theseeffects for further studies.
Figure 6 shows the performance comparisons of onlineHodgeRank against batch HodgeRank with t0 = 1000 forother 14 reference datasets. It is interesting to see that onall of these large scale data collections, both of these twoonline algorithms are able to maintain competitive perfor-mances with the batch case. From these results, we may con-clude that large amplitude outliers are not a significant issuein our crowdsourcing data collection as |Yt(i, j)| is boundedby 1. Besides, Table 1 shows the computation complexityachieved by l2 online HodgeRank, l1 online HodgeRank andbatch HodgeRank. It is easy to see that on our dataset,online HodgeRank can achieve up to nearly 370 times fasterthan batch HodgeRank, with similar prediction errors.
4.4 Online Tracking of Topology and CurlsIn our online settings, due to the multiple comparisons
between a pair of images, a natural question is raised thathow many samples are needed to satisfy the connected &loop-free conditions? As each reference is similar in sam-pling scheme, we compute the online mean Betti numbers
366
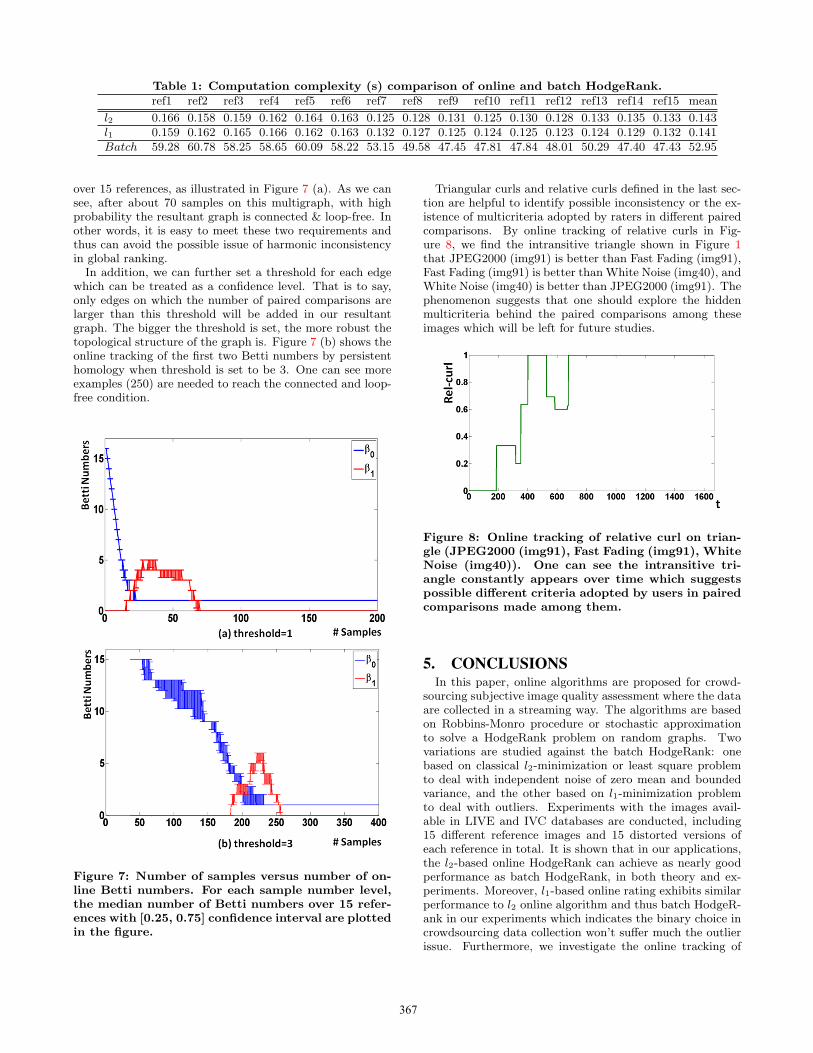
Table 1: Computation complexity (s) comparison of online and batch HodgeRank.ref1 ref2 ref3 ref4 ref5 ref6 ref7 ref8 ref9 ref10 ref11 ref12 ref13 ref14 ref15 mean
l2 0.166 0.158 0.159 0.162 0.164 0.163 0.125 0.128 0.131 0.125 0.130 0.128 0.133 0.135 0.133 0.143l1 0.159 0.162 0.165 0.166 0.162 0.163 0.132 0.127 0.125 0.124 0.125 0.123 0.124 0.129 0.132 0.141Batch 59.28 60.78 58.25 58.65 60.09 58.22 53.15 49.58 47.45 47.81 47.84 48.01 50.29 47.40 47.43 52.95
over 15 references, as illustrated in Figure 7 (a). As we cansee, after about 70 samples on this multigraph, with highprobability the resultant graph is connected & loop-free. Inother words, it is easy to meet these two requirements andthus can avoid the possible issue of harmonic inconsistencyin global ranking.In addition, we can further set a threshold for each edge
which can be treated as a confidence level. That is to say,only edges on which the number of paired comparisons arelarger than this threshold will be added in our resultantgraph. The bigger the threshold is set, the more robust thetopological structure of the graph is. Figure 7 (b) shows theonline tracking of the first two Betti numbers by persistenthomology when threshold is set to be 3. One can see moreexamples (250) are needed to reach the connected and loop-free condition.
Figure 7: Number of samples versus number of on-line Betti numbers. For each sample number level,the median number of Betti numbers over 15 refer-ences with [0.25, 0.75] confidence interval are plottedin the figure.
Triangular curls and relative curls defined in the last sec-tion are helpful to identify possible inconsistency or the ex-istence of multicriteria adopted by raters in different pairedcomparisons. By online tracking of relative curls in Fig-ure 8, we find the intransitive triangle shown in Figure 1that JPEG2000 (img91) is better than Fast Fading (img91),Fast Fading (img91) is better than White Noise (img40), andWhite Noise (img40) is better than JPEG2000 (img91). Thephenomenon suggests that one should explore the hiddenmulticriteria behind the paired comparisons among theseimages which will be left for future studies.
Figure 8: Online tracking of relative curl on trian-gle (JPEG2000 (img91), Fast Fading (img91), WhiteNoise (img40)). One can see the intransitive tri-angle constantly appears over time which suggestspossible different criteria adopted by users in pairedcomparisons made among them.
5. CONCLUSIONSIn this paper, online algorithms are proposed for crowd-
sourcing subjective image quality assessment where the dataare collected in a streaming way. The algorithms are basedon Robbins-Monro procedure or stochastic approximationto solve a HodgeRank problem on random graphs. Twovariations are studied against the batch HodgeRank: onebased on classical l2-minimization or least square problemto deal with independent noise of zero mean and boundedvariance, and the other based on l1-minimization problemto deal with outliers. Experiments with the images avail-able in LIVE and IVC databases are conducted, including15 different reference images and 15 distorted versions ofeach reference in total. It is shown that in our applications,the l2-based online HodgeRank can achieve as nearly goodperformance as batch HodgeRank, in both theory and ex-periments. Moreover, l1-based online rating exhibits similarperformance to l2 online algorithm and thus batch HodgeR-ank in our experiments which indicates the binary choice incrowdsourcing data collection won’t suffer much the outlierissue. Furthermore, we investigate the online tracking of
367

triangular curls and topology evolution of the paired rank-ing complex. In particular, we show that online tracking oftriangular curls provides us important information about in-consistency, which may suggest the existence of multicriteriain rater’s judgement of different object pairs.Our studies show that online HodgeRank provides us an
efficient approach to study large scale crowdsourcing subjec-tive IQA on Internet. It enables us to derive global ratingas well as monitor the inconsistency occurring in the datain the real time.Additionally, we would like to point out here that the the-
ory developed in this paper takes the standard I.I.D. sam-pling assumption as the main stream of statistical machinelearning. It is a largely unexplored field for online learn-ing with dependent sampling, such as Markov sampling andactive sampling, which will be our future directions.
6. ACKNOWLEDGMENTSThis work was supported in part by National Basic Re-
search Program of China (973 Program): 2012CB316400,2012CB825501, 2011CB809105, in part by National Natu-ral Science Foundation of China: 61025011, 61071157, and60833006.
7. REFERENCES[1] ITU-R Recommendation P.800. Methods for subjective
determination of transmission quality, 1996.[2] Subjective quality assessment irccyn/ivc database.
http://www2.irccyn.ec-nantes.fr/ivcdb/, 2005.[3] LIVE image and video quality assessment database.
http://live.ece.utexas.edu/research/quality/, 2008.[4] A.-L. Barabasi and R. Albert. Emergence of scaling in
random networks. Science, 286(5439):509–512, 1999.
[5] B. Bollobas. Random Graphs. Cambridge University Press,2001.
[6] G. Carlsson. Topology and data. Bulletin of the AmericanMathematical Society, 46(2):255–308, 2009.
[7] K.-T. Chen, C.-C. Wu, Y.-C. Chang, and C.-L. Lei. Acrowdsourceable QoE evaluation framework for multimediacontent. pages 491–500. ACM Multimedia, 2009.
[8] F. Chung and L. Lu. Complex Graphs and Networks.CBMS Regional Conference Series in Mathematics,American Mathematical Society, 2006.
[9] N. Cristianini and J. Shawe-Taylor. An Introduction toSupport Vector Machines and Other Kernel-based LearningMethods. Cambridge Unversity Press, 2000.
[10] F. Cucker and S. Smale. On the mathematical foundationsof learning. Bull. of the Amer. Math. Soc., 29(1):1–49,2002.
[11] H. David. The method of paired comparisons. 2nd Ed.,Griffin’s Statistical Monographs and Courses, 41. OxfordUniversity Press, New York, NY, 1988.
[12] Y. S. E. Granger and P. Lavoie. A pattern reorderingapproach based on ambiguity detection for online categorylearning. PAMI, 25:525–529, 2003.
[13] H. Edelsbrunner and J. Harer. Computational topology :an introduction. 2010.
[14] H. Edelsbrunner, D. Letscher, and A. Zomorodian.Topological persistence and simplification. Discrete andComputational Geometry, 28(4):511–533, 2002.
[15] A. Eichhorn, P. Ni, and R. Eg. Randomised paircomparison: an economic and robust method foraudiovisual quality assessment. pages 63–68. NOSSDAV,2010.
[16] P. Erdos and A. Renyi. On random graphs i. Publ. Math.Debrecen, 6:290–297, 1959.
[17] H. Grabner and H. Bischof. On-line boosting and vision.CVPR, 2006.
[18] G. H. H. Bekel, I. Bax and H. Ritter. Adaptive computervision: Online learning for object recognition. DAGM, 2004.
[19] X. Jiang, L.-H. Lim, Y. Yao, and Y. Ye. Statistical rankingand combinatorial Hodge theory. MathematicalProgramming, 2010.
[20] M. Kim and J. Leskovec. Multiplicative attribute graphmodel of real-world networks. Internet Mathematics,8(1-2):113–160, 2012.
[21] L.-H. Lim and Y. Yao. Online ranking on random graphs.preprint, 2012.
[22] S. A. O. Javed and M. Shah. Online detection andclassification of moving objects using progressivelyimproving detectors. CVPR, 2005.
[23] B. Osting, J. Darbon, and S. Osher. Statistical rankingusing the l1-norm on graphs. AIMS’, 2012.
[24] M. Penrose. Random Geometric Graphs (Oxford Studies inProbability). Oxford University Press, 2003.
[25] M. T. Pham and T. J. Cham. Online asymetric boostedclassifiers for object detection. CVPR, 2007.
[26] Y. L. R. T. Collins and M. Leordeanu. Online selection ofdiscriminative tracking features. PAMI, 27:1631–1643, 2005.
[27] A. Rakhlin. Statistical Learning Theory and SequentialPrediction. Lecture Notes in University of Pennsyvania,2012.
[28] H. Robbins and S. Monro. A stochastic approximationmethod. The Annals of Mathematical Statistics,22(3):400–407, 1951.
[29] F. Rosenblatt. The perceptron: A probabilistic model forinformation storage and organization in the brain.Psychological Review, 65(6):386–408, 1958.
[30] H. Sexton and M. Johansson. JPlex: a java softwarepackage for computing the persistent homology of filteredsimplicial complexes.http://comptop.stanford.edu/programs/jplex/, 2009.
[31] N. Shor. Minimization Methods for Non-DifferenliableFunctions. Springer-Verlag, 1985.
[32] S. Smale and Y. Yao. Online learning algorithms.Foundation of Computational Mathematics, 6(2):145–170,2006.
[33] V. N. Vapnik. Statistical Learning Theory.Wiley-Interscience, 1998.
[34] D. Watts and S. Strogatz. Collective dynamics of‘small-world’ networks. Nature, (393):440–442, 1998.
[35] B. Widrow and M. Hoff. Adaptive switching circuits. IREWESCON Convention Record, (4):96–104, 1960.
[36] B. Widrow and M. A. Lehr. 30 years of adaptive neuralnetworks: Perceptron, madaline, and backpropagation.pages 1415–1442. Proceedings of the IEEE, 1990.
[37] N. Wormald. Models of random regular graphs. pages239–298. In Surveys in Combinatorics, 1999.
[38] B. Wu and R. Nevatia. Improving part based objectdetection by unsupervised, online boosting. CVPR, 2007.
[39] Q. Xu, Q. Huang, T. Jiang, B. Yan, W. Lin, and Y. Yao.HodgeRank on random graphs for subjective video qualityassessment. IEEE Transactions on Multimedia,14(3):844–857, 2012.
[40] Q. Xu, T. Jiang, Y. Yao, Q. Huang, B. Yan, and W. Lin.Random partial paired comparison for subjective videoquality assessment via HodgeRank. pages 393–402. ACMMultimedia, 2011.
[41] Y. Yao. On complexity issue of online learning algorithms.IEEE Transactions on Information Theory,56(12):6470–6481, 2010.
[42] A. Zomorodian and G. Carlsson. Computing persistenthomology. Discrete and Computational Geometry,33(2):249–274, 2005.
368


![Crowdsourcing Detection of Sampling Biases in Image Datasetsmingyin.org/ · research on visual question collection from the crowd to improve image understanding [1], and previous](https://img.dokumen.tips/doc/110x75/5f3e000f3fd4d470474b62b7/crowdsourcing-detection-of-sampling-biases-in-image-research-on-visual-question.jpg)