Embed Size (px)
Citation preview

Oneida Hydroelectric Project FERC No. 472
Water Quality Summary
2004-2005
Prepared for:
PacifiCorp
Prepared by:
Ecosystems Research Institute
Version: April 5, 2007

2004-2005 Water Quality Summary
Oneida: Project Number 472 i
TABLE OF CONTENTS
1.0 INTRODUCTION ...............................................................................................................1 2.0 HISTORICAL WATER QUALITY CONCERNS .............................................................3 2.1 Water Quality Limited Segments Occurring in the Study Area ..............................3 2.2 Applicable Water Quality Standards .......................................................................3 2.3 Summary and Analysis of Existing Hydrology and Water Quality Data ................6 2.3.1 Hydrology ..................................................................................................12 2.3.2 Temperature, Dissolved Oxygen and pH...................................................12 2.3.3 Suspended Solids .......................................................................................14 2.3.4 Nutrients.....................................................................................................14 3.0 METHODS ....................................................................................................................16 3.1 Data Qualification..................................................................................................16 3.2 Data Merging and Filtration...................................................................................16 3.3 Analytical Procedure..............................................................................................21 3.3.1 Hydrologic Time Periods...........................................................................21 3.3.2 Storm Event Documentation......................................................................24 3.3.3 Outlier Identification..................................................................................24 4.0 RESULTS ....................................................................................................................26 4.1 Upper Basin Runoff 2004 ......................................................................................26 4.2 Summer Base Flow 2004.......................................................................................26 4.3 Winter Base Flow 2004-2005 ................................................................................32 4.4 Lower Basin Runoff 2005......................................................................................32 4.5 Upper Basin Runoff 2005 ......................................................................................32 4.6 Summer Base Flow 2005.......................................................................................41 4.7 Water Quality Grab Samples and Regression Analysis.........................................41 4.8 Quantification of PacifiCorp Operations ...............................................................41 4.9 PacifiCorp Effects..................................................................................................46 4.10 Statistical Analysis of Increasing Hydrological Effects ........................................54 5.0 DISCUSSION ....................................................................................................................69 6.0 REFERENCES ..................................................................................................................69
2004-2005 Water Quality Summary
Oneida: Project Number 472 ii
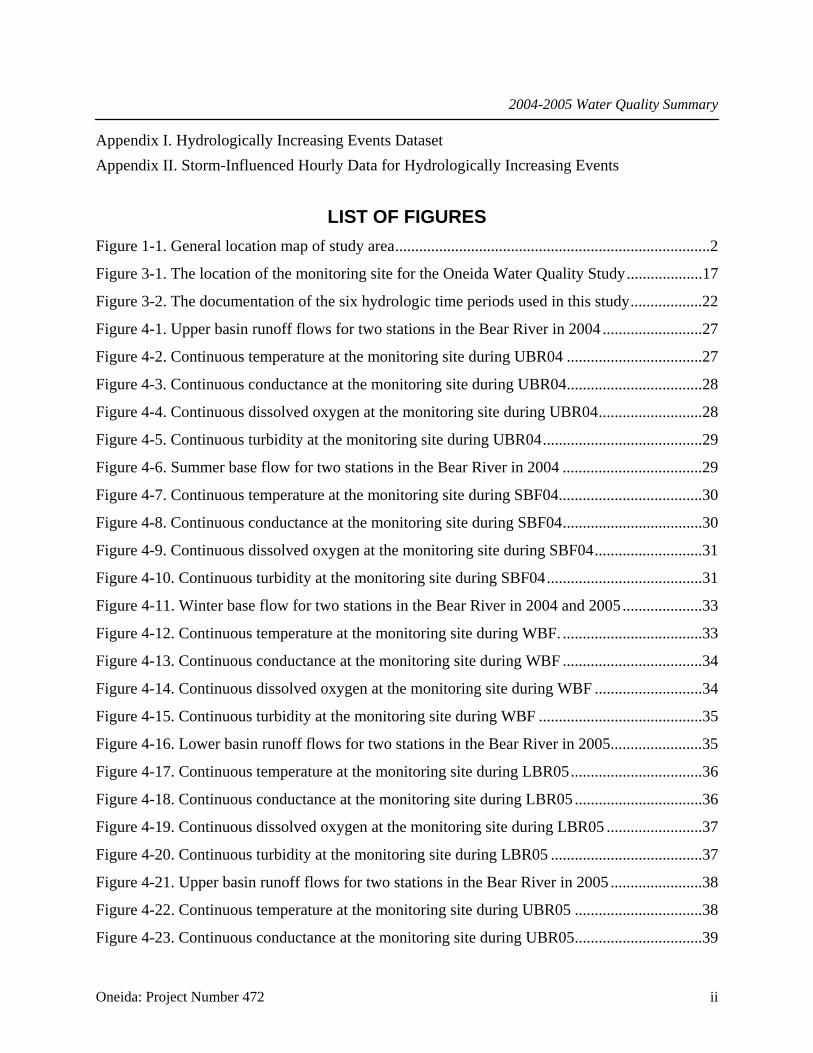
Appendix I. Hydrologically Increasing Events Dataset Appendix II. Storm-Influenced Hourly Data for Hydrologically Increasing Events
LIST OF FIGURES Figure 1-1. General location map of study area...............................................................................2
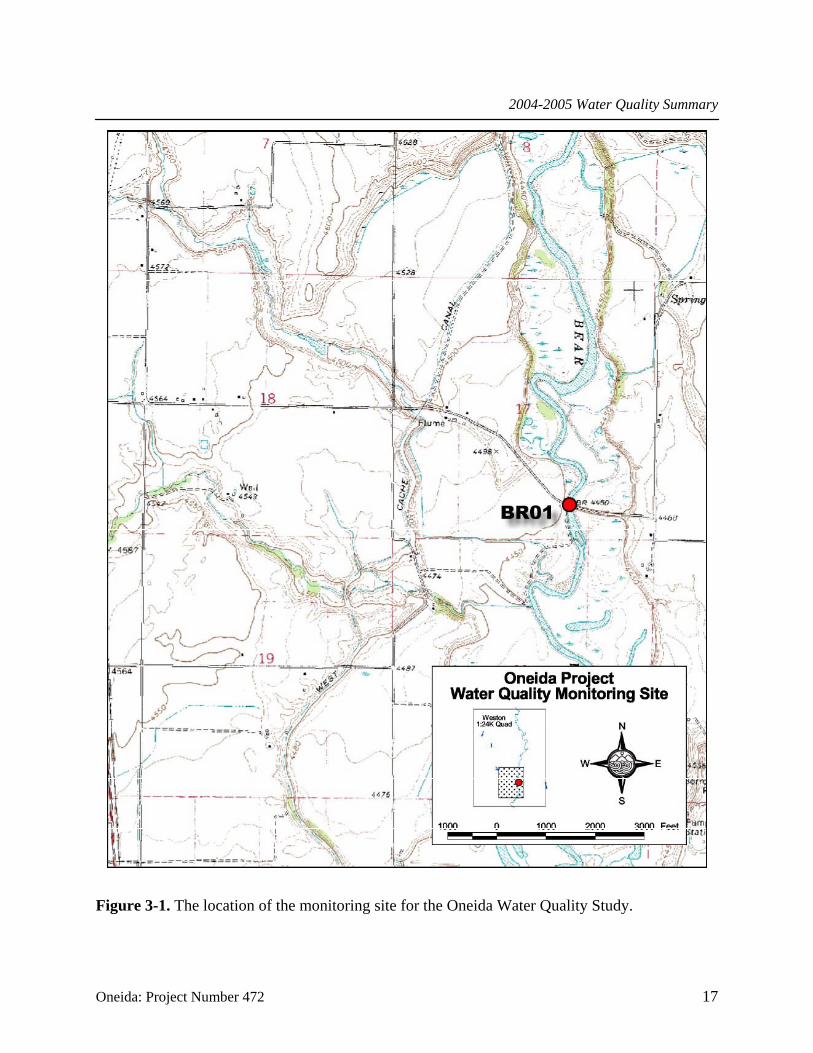
Figure 3-1. The location of the monitoring site for the Oneida Water Quality Study...................17
Figure 3-2. The documentation of the six hydrologic time periods used in this study..................22
Figure 4-1. Upper basin runoff flows for two stations in the Bear River in 2004 .........................27
Figure 4-2. Continuous temperature at the monitoring site during UBR04 ..................................27
Figure 4-3. Continuous conductance at the monitoring site during UBR04..................................28
Figure 4-4. Continuous dissolved oxygen at the monitoring site during UBR04..........................28
Figure 4-5. Continuous turbidity at the monitoring site during UBR04........................................29
Figure 4-6. Summer base flow for two stations in the Bear River in 2004 ...................................29
Figure 4-7. Continuous temperature at the monitoring site during SBF04....................................30
Figure 4-8. Continuous conductance at the monitoring site during SBF04...................................30
Figure 4-9. Continuous dissolved oxygen at the monitoring site during SBF04...........................31
Figure 4-10. Continuous turbidity at the monitoring site during SBF04.......................................31
Figure 4-11. Winter base flow for two stations in the Bear River in 2004 and 2005....................33
Figure 4-12. Continuous temperature at the monitoring site during WBF. ...................................33
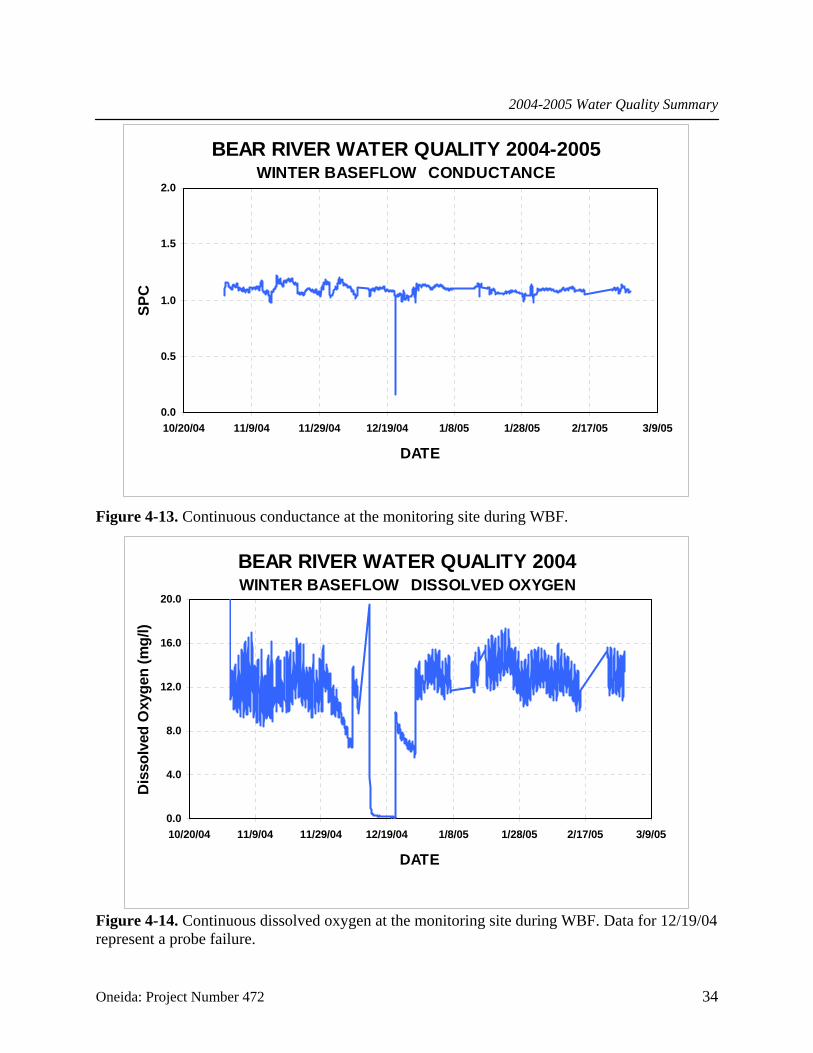
Figure 4-13. Continuous conductance at the monitoring site during WBF ...................................34
Figure 4-14. Continuous dissolved oxygen at the monitoring site during WBF ...........................34
Figure 4-15. Continuous turbidity at the monitoring site during WBF .........................................35
Figure 4-16. Lower basin runoff flows for two stations in the Bear River in 2005.......................35
Figure 4-17. Continuous temperature at the monitoring site during LBR05.................................36
Figure 4-18. Continuous conductance at the monitoring site during LBR05 ................................36
Figure 4-19. Continuous dissolved oxygen at the monitoring site during LBR05 ........................37
Figure 4-20. Continuous turbidity at the monitoring site during LBR05 ......................................37
Figure 4-21. Upper basin runoff flows for two stations in the Bear River in 2005 .......................38
Figure 4-22. Continuous temperature at the monitoring site during UBR05 ................................38
Figure 4-23. Continuous conductance at the monitoring site during UBR05................................39

2004-2005 Water Quality Summary
Oneida: Project Number 472 iii
Figure 4-24. Continuous dissolved oxygen at the monitoring site during UBR05........................39
Figure 4-25. Continuous turbidity at the monitoring site during UBR05......................................40
Figure 4-26. Summer base flow for two stations in the Bear River in 2005 .................................42
Figure 4-27. Continuous temperature at the monitoring site during SBF05..................................42
Figure 4-28. Continuous conductance at the monitoring site during SBF05.................................43
Figure 4-29. Continuous dissolved oxygen at the monitoring site during SBF05.........................43
Figure 4-30. Continuous turbidity at the monitoring site during SBF05.......................................44
Figure 4-31. The statistical relationship between turbidity and total suspended solids for grab samples collected during the study period .....................................................................................45
Figure 4-32. The statistical relationship between turbidity and total phosphorus for grab samples collected during the study period...................................................................................................45
Figure 4-33. The flows below the Soda Hydroelectric Project and the Oneida Hydroelectric Project for UBR04 ....................................................................................................................47
Figure 4-34. The flows below the Soda Hydroelectric Project and the Oneida Hydroelectric Project for SBF04 ....................................................................................................................47
Figure 4-35. The flows below the Soda Hydroelectric Project and the Oneida Hydroelectric Project for WBF ....................................................................................................................48
Figure 4-36. The flows below the Soda Hydroelectric Project and the Oneida Hydroelectric Project for LBR05 ....................................................................................................................48
Figure 4-37. The flows below the Soda Hydroelectric Project and the Oneida Hydroelectric Project for UBR05 ....................................................................................................................49
Figure 4-38. The flows below the Soda Hydroelectric Project and the Oneida Hydroelectric Project for SBF05 ....................................................................................................................49
Figure 4-39. The frequency distribution of the duration of the increasing flow events documented below Oneida Reservoir in 2004-2005 ..........................................................................................50
Figure 4-40. An example of three sequential events (All Events Nos. 51, 52, and 53) during UBR04 associated with operational effects due to the Oneida Hydroelectric Project. The timing of the event is associated with the flows at the Utah-Idaho stateline station.................................51
Figure 4-41. An example of three sequential events (All Events Nos. 155, 156, and 157) during SBF04 associated with operational effects due to the Oneida Hydroelectric Project. The timing of the event is associated with the flows at the Utah-Idaho stateline station .....................................51
Figure 4-42. An example of three sequential events (All Events Nos. 258, 259, and 260) during WBF in 2004/2005 associated with operational effects due to the Oneida Hydroelectric Project. The timing of the event is associated with the flows at the Utah-Idaho stateline station ..............52

2004-2005 Water Quality Summary
Oneida: Project Number 472 iv
Figure 4-43. An example of three sequential events (All Events Nos. 427, 428, and 429) during LBR05 associated with operational effects due to the Oneida Hydroelectric Project. The timing of the event is associated with the flows at the Utah-Idaho stateline station.................................52
Figure 4-44. An example of three sequential events (All Events Nos. 537, 538, and 539) during UBR05 associated with operational effects due to the Oneida Hydroelectric Project. The timing of the event is associated with the flows at the Utah-Idaho stateline station.................................53
Figure 4-45. An example of three sequential events (All Events Nos. 619, 620, and 621) during SBF05 associated with operational effects due to the Oneida Hydroelectric Project. The timing of the event is associated with the flows at the Utah-Idaho stateline station. ....................................53
Figure 4-46. The temporal location of the 236 hydrologically increasing events during the study period ....................................................................................................................55
Figure 4-47. The temporal (above) and linear regression (below) relationship between flow and turbidity during an increasing flow event (No. 16) in the Bear River during UBR04 ..................56
Figure 4-48. The temporal (above) and linear regression (below) relationship between flow and turbidity during an increasing flow event (No. 56) in the Bear River in SBF04...........................57
Figure 4-49. The temporal (above) and linear regression (below) relationship between flow and turbidity during an increasing flow event (No. 91) in the Bear River in WBF 2004-2005 ...........58
Figure 4-50. The temporal (above) and linear regression (below) relationship between flow and turbidity during an increasing flow event (No. 147) in the Bear River in LBR05 ........................59
Figure 4-51. The temporal (above) and linear regression (below) relationship between flow and turbidity during an increasing flow event (No. 184) in the Bear River in UBR05........................60
Figure 4-52. The temporal (above) and linear regression (below) relationship between flow and turbidity during an increasing flow event (No. 229) in the Bear River in SBF05.........................61
Figure 4-53. The hourly data for all significant increasing flow events comparing flow and turbidity in the Bear River at the Idaho-Utah state border.............................................................65
Figure 4-54. The hourly data for all significantly increasing flow events comparing flow and turbidity at the Idaho-Utah state border for just outlier and storm-influenced events...................66
Figure 4-55. The hourly data for all significantly increasing flow events comparing flow and turbidity at the Idaho-Utah state border after removing outlier and storm-influenced events.......67
LIST OF TABLES Table 2-1. Waters within the Middle Bear River Subbasin (HUC# 16010202) and their designated beneficial uses................................................................................................................4
Table 2-2. Idaho water quality criteria for the mainstem Bear River and its tributaries .................5
Table 2-3. A comparison of total inorganic nitrogen and orthophosphorus concentrations in the Bear River (data are from ERI historical collections) .....................................................................7

2004-2005 Water Quality Summary
Oneida: Project Number 472 v
Table 2-4. Total suspended solids and total phosphorus criteria applied to mainstem Bear River reaches in the proposed TMDL for the Bear River below Oneida Reservoir. The criteria for total suspended solids changed with hydrologic time period ..................................................................8
Table 2-5. A summary of studies completed on the Bear River basin ............................................9
Table 2-6. Exceedences of state water quality criteria in mainstem Bear River sites ...................13
Table 2-7. Exceedences in Bear River tributary sites of state water quality criteria .....................15
Table 3-1. Rejection criteria for continuous water-quality monitoring sensors ............................18
Table 3-2. The description of the hydrologic intervals used in this study and the associated number of data points excluded due to QA/QC criteria ................................................................19
Table 3-3. The description of the hydrologic intervals used in this study and the associated number of data points ....................................................................................................................20
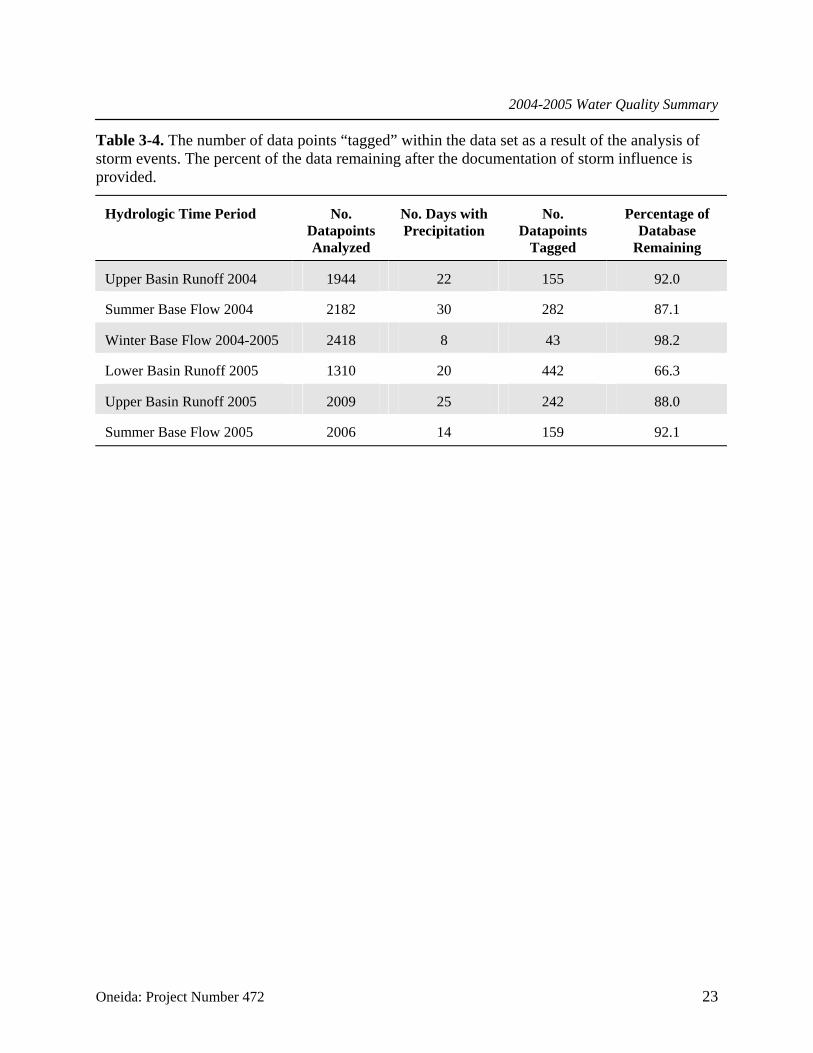
Table 3-4. The number of data points “tagged” within the data set as a result of the analysis of storm events. The percent of the data remaining after the documentation of storm influence is provided .........................................................................................................................................23
Table 3-5. The number of data points removed from the data set as a result of the analysis of outliers (probe fouling). The percent of the data remaining after removal of these outliers is provided .........................................................................................................................................25
Table 4-1. Characteristics of the hydrologically increasing event database..................................62
Table 4-2. Percent exceedence of IDEQ's current numeric criterion for turbidity and proposed TSS and TP TMDL criteria (calculated from turbidity data) in database events categorized as hydrologically-increasing. Exceedence was based on whether the maximum turbidity recorded in the event exceeded criteria.............................................................................................................63
Table 4-3. The details of the storm-influenced events that had significant relationships between flow and turbidity. These tagged events were removed from further analysis relative to operational effects due to PacifiCorp. Hourly data for these events are included in Appendix II ........................................................................................................................................................68
2004-2005 Water Quality Summary
Oneida: Project Number 472 1
1.0 INTRODUCTION
On August 28, 2002, PacifiCorp entered into a settlement agreement with the resource agencies and other intervening parties including the Idaho Department of Environmental Quality concerning the relicensing of the Bear River Projects (FERC Nos. 20, 472, and 2401). As part of the Draft 401 Water Quality Certification in this agreement, PacifiCorp agreed to several investigations associated with the operation of the Oneida Hydroelectric Plant (FERC No. 472), the furthest downstream project licensed under the agreement. The pertinent sections of this agreement relative to the Oneida Hydroelectric Project are as follows:
(Section 5). PacifiCorp shall develop a water quality monitoring plan (Oneida WQMP) to monitor for temperature, dissolved oxygen, specific conductance, sediment, nutrients and turbidity. The purpose of the Oneida WQMP is to characterize water quality conditions in the Bear River from Oneida powerhouse to the Idaho/Utah border (“Oneida reach”) and to determine the Project’s contribution to any violations of water quality criteria as set forth in the Idaho Water Quality Standards and Wastewater Treatment Requirements, IDAPA 58.01.02 (Water Quality Standards). Continuous monitoring consisting of temperature, specific conductance, dissolved oxygen and turbidity will be conducted downstream of Riverdale (at the location identified in paragraph 3) and data will be recorded at a minimum of hourly intervals for a minimum period of 18 months commencing after the new license has been issued by FERC and accepted by PacifiCorp. Monitoring for suspended sediment and nutrients (at a minimum, total and dissolved phosphorus) shall be conducted to establish a statistically significant relationship between these parameters and turbidity as recorded by the continuous monitoring station (i.e., approximately 30 samples during the 18-month monitoring period). Sampling for suspended sediment and nutrients shall be collected to represent the range of flows experienced through course of the annual hydrograph in the Oneida reach. PacifiCorp shall implement the Oneida WQMP upon IDEQ approval pursuant to paragraph 7 below.
(Section 6). If IDEQ determines, based upon data collected by PacifiCorp and any other relevant information, that the operation of the Oneida Project causes or contributes to a violation of Water Quality Standards in the Bear River downstream of the Oneida reach, then within 90 days of IDEQ's request, PacifiCorp shall submit an Oneida Reach Mitigation Plan to IDEQ for approval that describes those measures PacifiCorp shall take, to address the violations caused by the Oneida Project. PacifiCorp must obtain approval of the Oneida Reach Mitigation Plan consistent with the requirement of this certification within 180 days of its submittal. PacifiCorp shall implement and comply with the Mitigation Plan once it is approved by IDEQ. Failure to submit an Oneida Reach Mitigation Plan consistent with this Certification or failure to comply with an approved Mitigation Plan is a violation of the terms of this certification and the FERC license for the Projects.
The objectives of this investigation were to meet the conditions of Section 5 above. The study was undertaken in cooperation with the Idaho Department of Environmental Quality who selected the monitoring location (county bridge at 3600 South, Figure 1-1) and approved the

2004-2005 Water Quality Summary
Oneida: Project Number 472 2
#S
Bea r R
iv
er
BearLake
GreatSaltLake
10 0 10 20 Miles
Oneida Water Quality StudyN
#S Monitoring Station
UTAHIDAHO
WYOMING
Figure 1-1. General location map of study area.

2004-2005 Water Quality Summary
Oneida: Project Number 472 3
monitoring plan June 18, 2004. The experimental design was for a single continuous monitoring station near the Idaho-Utah border below the Oneida Project. Within the reach of river between the Oneida Hydroelectric Project and the 3600 South Bridge (a distance of approximately 30 river miles), there are a number of tributaries and anthropogenic activities that have been historically shown to affect the ambient water quality parameters measured as part of this study. A brief overview of the historical water quality conditions is warranted in order to place the current data collection into perspective.
2.0 HISTORICAL WATER QUALITY CONCERNS 2.1 Water Quality Limited Segments Occurring in the Study Area
The Bear River below Oneida Reservoir is the last of four major subbasins in the Idaho portion of the Bear River. This subbasin has six tributaries (5 are on the 303(d) list) of which four are non-designated, and thus assumed to support coldwater aquatic life and secondary contact recreation. Recreation contact is primary or secondary for these tributary streams (Table 2-1). The Bear River in this subbasin is also on the 303(d) list. The entire Bear River in this reach has a coldwater and salmonid spawning designation for aquatic life and primary contact recreation. Nutrients, sediment and flow alteration are the reasons given for the 303(d) listing for the river.
2.2 Applicable Water Quality Standards
As noted in Section 2.1, the tributaries and mainstem of the Bear River, as well as Oneida Reservoir have either coldwater, salmonid spawning or are undesignated relative to surface water beneficial use designations (aquatic life). Recreation designations are either primary or secondary contact. The specific numeric water quality standards are described in Table 2-2.
According to the 1998 Idaho Administrative Code 16.01.02.101.01(b), non-designated surface waters in the state are assumed to support cold water aquatic life and primary or secondary contact recreation beneficial uses and the department will apply coldwater aquatic life and primary and secondary recreation criteria to undesignated waters unless the department determines that other criteria are appropriate.
In addition to enforceable numeric standards, the state has narrative standards for pollutants such as nutrients (e.g. phosphorus and nitrate) and sediment. Therefore, numeric criteria established for nutrients or sediment are targets and not standards. Targets, like standards, do serve as a guidance to indicate possible pollution problems. When the concentrations are exceeded, further study is typically recommended. This may include more frequent water quality monitoring, biological monitoring, riparian assessment or additional studies to identify and quantify point and nonpoint sources.

2004-2005 Water Quality Summary
Oneida: Project Number 472 4
Table 2-1. Waters within the Middle Bear River Subbasin (HUC# 16010202) and their designated beneficial uses.
BENEFICIAL USES* WATERS INCLUDED: 303(d) LIST ND DWS AWS COLD WARM SS PCR SCR SRW
Bear River - Alexander Dam to Utah Border
X X X X X
Cottonwood Creek X X X
Mink Creek X X X X
Battle Creek X X X X
Deep Creek X X X
Fivemile Creek X X X
Weston Creek X X X * ND: Non-designated; DWS: Domestic Water Supply; AWS: Agricultural Water Supply; COLD: Cold Water Communities; WARM: Warm Water Communities; SS: Salmonid Spawning; PCR: Primary Contact Recreation; SCR: Secondary Contact Recreation; SRW: Special Resource Water.

2004-2005 Water Quality Summary
Oneida: Project Number 472 5
Table 2-2. Idaho water quality criteria for the mainstem Bear River and its tributaries.
PARAMETER CRITERIA
RECREATION USE DESIGNATIONS
E. coli: primary contact (May 1-Sept 30)
secondary contact
Maximum: 406/100 ml and or geometric mean >126/100 ml from 5 samples taken 3 to 5 days over 30 days. Maximum: 576/100 ml or a geometric mean >126/100 ml from 5 samples taken 3 to 5 days over 30 days.
AQUATIC LIFE USE DESIGNATIONS (COLDWATER)
Dissolved Oxygen >6 mg/L
pH 6.5 - 9.5
Turbidity increase < 50 NTUs from background instantaneously
< 25 NTUs from background for 10 days
Temperature < 22°C instantaneous maximum & daily average maximum < 19°C
Total Dissolved Gas <110%
Ammonia dependent on pH and temp
AQUATIC LIFE USE DESIGNATIONS (SALMONID SPAWNING )
Dissolved Oxygen (water column) >6 mg/L
Dissolved Oxygen (intergravel) one day min >5 mg/L & 7 day avg >6 mg/L
Temperature < 13°C instantaneous maximum & daily average maximum < 9°C
2004-2005 Water Quality Summary
Oneida: Project Number 472 6
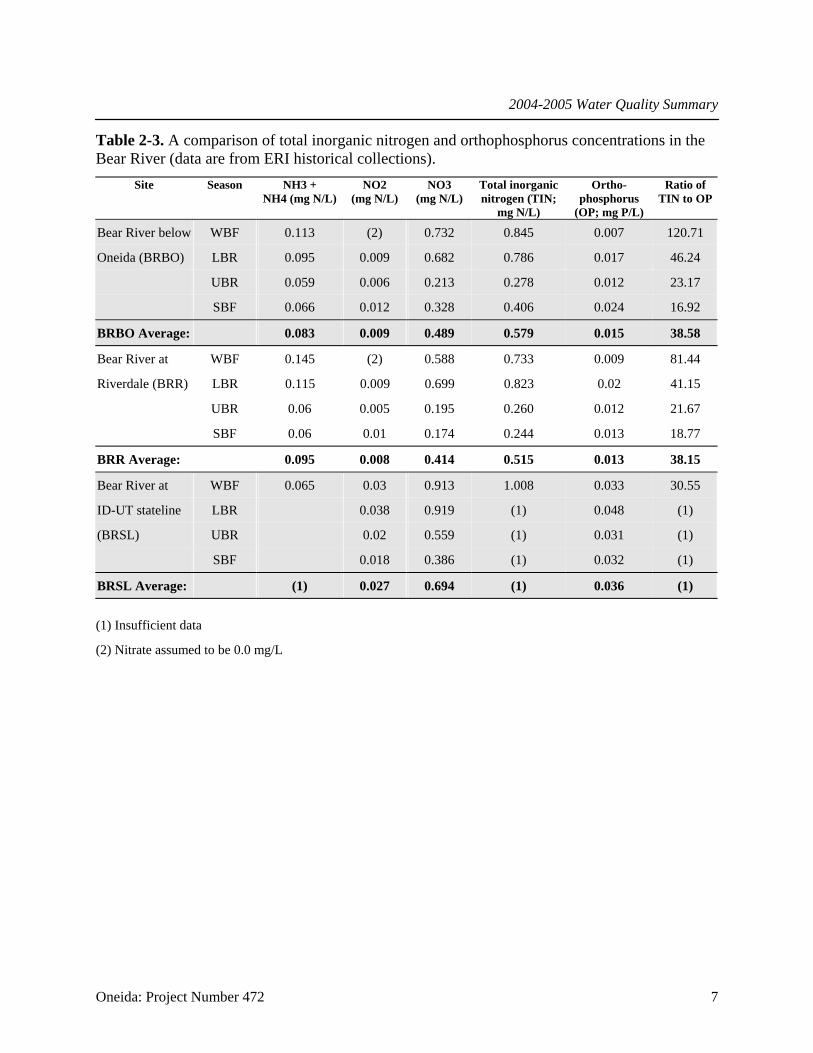
Generally, one nutrient, usually phosphorus, is the limiting factor in aquatic environments. Nitrogen to phosphorus ratios in aquatic vegetation have been shown to range from about 10 to 17 parts nitrogen to 1 part phosphorus (Mackenthun 1973). It appears the limiting factor during most of the year in the Bear River in the study reach is phosphorus (Table 2-3). A comparison of readily available (i.e., the form of nutrient in the water column is such that its uptake by plants is easy) phosphorus and nitrogen indicates that phosphorus is the limiting factor.
Water quality targets for sediment and total phosphorus are different based on location within the Bear River depending on whether water flowing past that site discharges into a lake or impoundment (reservoir). For example, water flowing into Alexander Reservoir has a target of 0.05 mg P/l while water flowing in the Bear River below Alexander is 0.075 mg/l. In the case of the Bear River at the Utah-Idaho border, the target was set at 0.050 mg P/l for political reasons (Utah has set a target of 0.05 mg P/l for their criteria and the two states wanted to be consistent in their designations).
In the Bear River, the separation of sites based on downstream receiving waters corresponds to phosphorus targets recommended in the 1986 EPA “Gold Book” which established phosphorus concentrations at levels that prevent the “development of biological nuisances and to control accelerated or cultural eutrophication.” The Gold Book recommends for sections of stream that do not discharge into a lake or impoundment (reservoir) a total phosphorus target of 0.1 mg/L. For those reaches that discharge into a lake or reservoir, the Gold Book suggests a threshold of total phosphates as phosphorus of 0.05 mg/L. The 0.05 mg/L target has been proposed for those reaches of the Bear River which discharge into Bear Lake, Alexander Reservoir, and Oneida Reservoir. All other sites, which are considered riverine, were assigned a target of 0.075 mg/L total phosphorus, a 25 percent reduction from that which was recommended in the Gold Book. However, as noted in the previous section of this report, the 0.05 mg/L total phosphorus target was also used for the Bear River below Oneida Reservoir to the stateline, based on the same target set by the state of Utah in their Lower Bear River Water Quality Management Plan (Ecosystems Research Institute 1995). Table 2-4 lists TSS and TP criteria for the Bear River below Oneida Reservoir by hydrologic period.
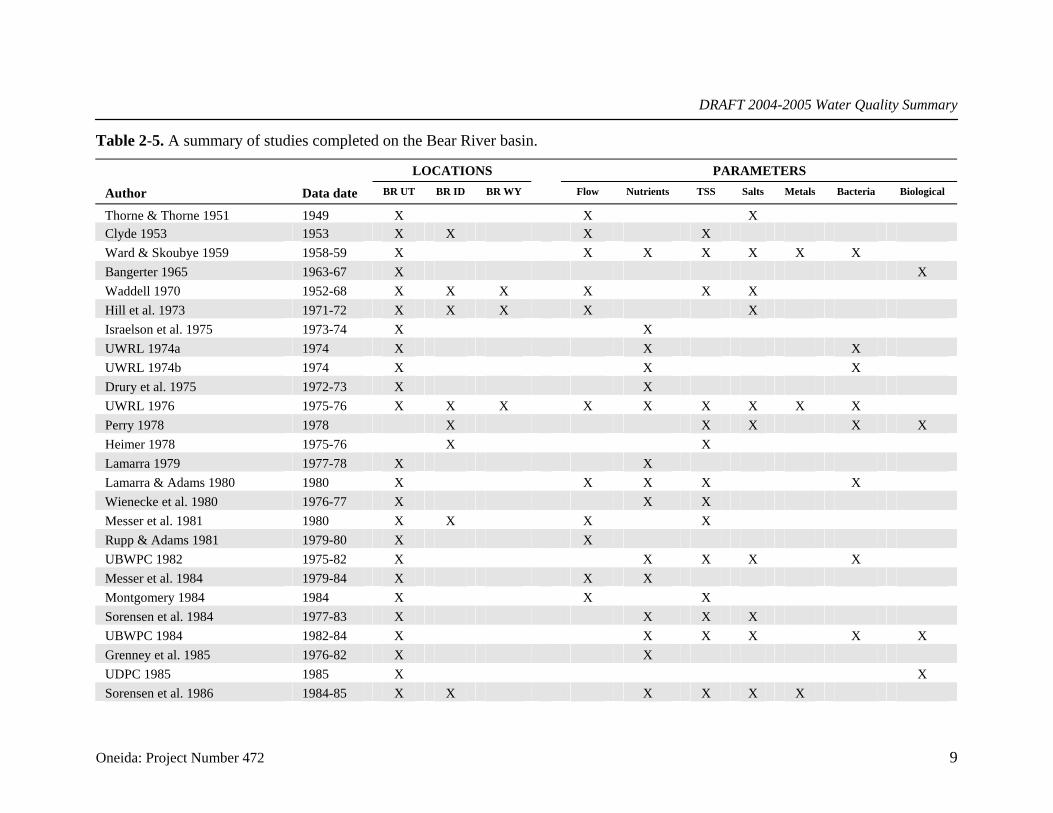
2.3 Summary and Analysis of Existing Hydrology and Water Quality Data Water quality studies on the Bear River date back to the 1950s. Table 2-5 summarizes these studies by author, year of data collection, area covered by the study and the parameters measured during the investigations. The Idaho Bear River reach (that portion downstream of the Wyoming-Idaho border) has been the subject of water quality investigations starting as early as 1953 (Clyde 1953). The studies focused on suspended sediments and flow. Several studies have also been conducted on the current condition of and influences on water quality in the reach above Bear Lake, extending as far as Woodruff Reservoir in Wyoming down to the Idaho-Utah stateline. Of the studies that have been conducted on Bear River water quality in Idaho (Wyoming-Idaho stateline to the Utah-Idaho stateline) the most extensive has been completed by ERI (1998) and will be described in detail later in this section.
2004-2005 Water Quality Summary
Oneida: Project Number 472 7
Table 2-3. A comparison of total inorganic nitrogen and orthophosphorus concentrations in the Bear River (data are from ERI historical collections).
Site Season NH3 + NH4 (mg N/L)
NO2 (mg N/L)
NO3 (mg N/L)
Total inorganic nitrogen (TIN;
mg N/L)
Ortho- phosphorus
(OP; mg P/L)
Ratio of TIN to OP
Bear River below WBF 0.113 (2) 0.732 0.845 0.007 120.71
Oneida (BRBO) LBR 0.095 0.009 0.682 0.786 0.017 46.24
UBR 0.059 0.006 0.213 0.278 0.012 23.17
SBF 0.066 0.012 0.328 0.406 0.024 16.92
BRBO Average: 0.083 0.009 0.489 0.579 0.015 38.58
Bear River at WBF 0.145 (2) 0.588 0.733 0.009 81.44
Riverdale (BRR) LBR 0.115 0.009 0.699 0.823 0.02 41.15
UBR 0.06 0.005 0.195 0.260 0.012 21.67
SBF 0.06 0.01 0.174 0.244 0.013 18.77
BRR Average: 0.095 0.008 0.414 0.515 0.013 38.15
Bear River at WBF 0.065 0.03 0.913 1.008 0.033 30.55
ID-UT stateline LBR 0.038 0.919 (1) 0.048 (1)
(BRSL) UBR 0.02 0.559 (1) 0.031 (1)
SBF 0.018 0.386 (1) 0.032 (1)
BRSL Average: (1) 0.027 0.694 (1) 0.036 (1)
(1) Insufficient data
(2) Nitrate assumed to be 0.0 mg/L

2004-2005 Water Quality Summary
Oneida: Project Number 472 8
Table 2-4. Total suspended solids and total phosphorus criteria applied to mainstem Bear River reaches in the proposed TMDL for the Bear River below Oneida Reservoir. The criteria for total suspended solids changed with hydrologic time period.
Location Total Suspended Solids (mg/l)
Total Phosphorus (mg/l) Criterion Runoff Criterion Base flow Criterion
Bear River below Oneida (BRBO)
0.050 80 60
Bear River at ID-UT stateline (BRSL)
0.050 80 60
DRAFT 2004-2005 Water Quality Summary
Oneida: Project Number 472 9
Table 2-5. A summary of studies completed on the Bear River basin.
LOCATIONS PARAMETERS
Author Data date BR UT BR ID BR WY Flow Nutrients TSS Salts Metals Bacteria Biological
Thorne & Thorne 1951 1949 X X XClyde 1953 1953 X X X X Ward & Skoubye 1959 1958-59 X X X X X X X Bangerter 1965 1963-67 X X Waddell 1970 1952-68 X X X X X X Hill et al. 1973 1971-72 X X X X X Israelson et al. 1975 1973-74 X X UWRL 1974a 1974 X X X UWRL 1974b 1974 X X X Drury et al. 1975 1972-73 X X UWRL 1976 1975-76 X X X X X X X X X Perry 1978 1978 X X X X X Heimer 1978 1975-76 X X Lamarra 1979 1977-78 X X Lamarra & Adams 1980 1980 X X X X X Wienecke et al. 1980 1976-77 X X X Messer et al. 1981 1980 X X X X Rupp & Adams 1981 1979-80 X X UBWPC 1982 1975-82 X X X X X Messer et al. 1984 1979-84 X X X Montgomery 1984 1984 X X X Sorensen et al. 1984 1977-83 X X X X UBWPC 1984 1982-84 X X X X X X Grenney et al. 1985 1976-82 X X UDPC 1985 1985 X X Sorensen et al. 1986 1984-85 X X X X X X

DRAFT 2004-2005 Water Quality Summary
Oneida: Project Number 472 10
LOCATIONS PARAMETERS
Author Data date BR UT BR ID BR WY Flow Nutrients TSS Salts Metals Bacteria Biological
UBWPC 1986a 1984-86 X X X X XUBWPC 1986b 1986 X X Sorensen et al. 1987 1985-86 X X X X UBWPC 1987 1987 X X UBWPC 1988 1986-88 X X X X X Barker et al. 1989 1987 X X X X X UBWPC 1990 1988-90 X X X X X ERI 1991 1990-91 X X X X X X X PacifiCorp Electric Operations 1991 X X UBWPC 1991a 1988-89 X X UBWPC 1991b 1889-90 X X UDWQ 1992a 1990-92 X X X X X BLRC & ERI 1993 1991 X X X X X X UDWQ 1993a 1990-91 X X UDWQ 1993b 1991-92 X X UDWQ 1993c 1990-91 X X UDWQ 1993d 1991-92 X X UDWQ 1994a 1992-93 X X UDWQ 1994b 1992-93 X X UDWQ 1995 1993-94 X X ERI 1995 1992-93 X X X X X X X ERI 1998 1994-96 X X X X X X X X

2004-2005 Water Quality Summary
Oneida: Project Number 472 11
Early water quality studies focused on sediments and salinity in the river. Clyde (1953) evaluated sedimentation patterns in the Bear River between Oneida and Cutler reservoirs. Between 1910 and 1950, the river bed raised six feet due to the deposition of over 110,000,000 tons of sediment. He attributed the source to rapid erosion in tributaries below Oneida Reservoir, caused by the natural soil conditions in the upland areas, exacerbated by irrigation and other land use practices. He concluded that fluctuating flows from Oneida had not greatly affected deposition of sediment in the channel. Heimer (1978) measured turbidity and suspended sediments at sites from below Bear Lake to the Utah-Idaho stateline. Based on his 1975 data, sediment loads in the river increased from 98 tons/month (3,000 kg/day) at Soda Springs to 351 tons/month (10,600 kg/day) near Preston, then decreased to 171 tons/month (5,180 kg/day) at the stateline. Waddell (1970), Haws and Hughes (1973), and Hill et al (1973) all summarized water quality data collected in the late 1960s and early 1970s. Most analyses were for major anions and cations only. Over this time period, total dissolved solids (TDS) averaged about 375 mg/liter at the Bear Lake outlet, with little change throughout the Idaho reach.
The first extensive water quality study of the Idaho portion of the Bear River was conducted in 1975 and 1976 (Perry 1978), with samples collected every two weeks at 15 stations. Perry concluded that total suspended solids (TSS) and TDS concentrations responded differently in the reaches above and below Oneida. From Bear Lake to above Oneida, TSS and TDS decreased at higher flows due to a dilution effect. However, below Oneida, solids increased during runoff. He attributed this to high sediment inputs from tributaries below Oneida. High nitrate concentrations in Black Canyon, possibly from Grace wastewater treatment plant (WWTP), and fecal coliform contamination in the river near Preston were also identified as water quality problems.
In the late 1970s, the emphasis shifted to nutrient contamination in the river, with most data collected below Oneida Reservoir by Utah State University Water Research Laboratory. Sorensen et al. (1984, 1986) found increasing TSS and total phosphorus (TP) loads below Oneida to be associated with inputs from tributaries. Most of the phosphorus was associated with the sediment, rather than in dissolved form. A study of the impact of power peaking below Oneida Reservoir demonstrated that total phosphorus increased during peaking events. Sorensen et al. also investigated bio-available phosphorus at the sites they monitored. They indicated that the amount of bio-available phosphorus in the system was related to anthropogenic sources.
Barker et al. (1989) summarized nutrient data collected from Bear Lake outlet to the Idaho-Utah stateline during 1987 and 1988. Average TP concentrations increased from 0.06 mg/liter at Bear Lake outlet to 0.100 mg/liter at stateline. Average orthophosphorus increased from 0.008 to 0.037 mg/liter over the same reach, although on most dates the concentrations were low and relatively constant from site to site. Nitrate concentrations ranged from 0.140 mg/liter at the outlet to 0.860 mg/liter at the stateline.
ERI (1991) reported on data collected in the lower basin during 1990, a low flow year, which included a site below Oneida Reservoir and sites from the Idaho-Utah stateline to below Cutler Reservoir. In this study, the average daily load of TSS increased from 7,000 kg/day below Oneida Reservoir to 24,000 kg/day at the stateline. The average TSS concentration increased

2004-2005 Water Quality Summary
Oneida: Project Number 472 12
from 6 to 50 mg/liter over this reach. Nutrient concentrations were relatively constant or decreased from Oneida to the stateline.
ERI (1998) conducted the most current and extensive water quality investigation on the mainstem Bear River. Twelve sites on the mainstem Bear River were sampled from April 1994 through September 1996 and in 1999-2000. In addition, several point sources, including the Soda Springs WWTP, the Clear Springs fish hatchery and Preston WWTP were also sampled. Several monitoring sites on the mainstem and tributaries were monitored by PacifiCorp as part of their relicensing effort on three hydroelectric facilities in Idaho. Data from several of these sites have also been included in this review of available information. This study represents the basis for the summary and analysis of water quality conditions in the Middle Bear River watershed particularly below Oneida Reservoir.
ERI’s (1998) investigation sampled only a limited number of tributaries. In order to more fully define the nonpoint source component of the source inventory, detailed tributary and mainstem synoptic surveys were conducted during 1999-2000, using the same protocol as the 1998 study. These surveys will be discussed in the context of the more extensive 1998 study.
Samples for both studies were collected as subsurface grabs within the mixed zone and in the main channel of the stream. Field parameters (temperature, pH, conductivity, dissolved oxygen) were measured at the site and water samples were collected for nutrient, sediment and salinity analyses and returned to the laboratory for analysis. Flows were measured at the sites where water quality samples were collected. Flows on most of the mainstem Bear River in Idaho, and Soda Creek were obtained from PacifiCorp. Discharge data for the Utah-Idaho stateline were obtained from the U.S. Geological Service (USGS).
2.3.1 Hydrology For the years used in this specific water quality analysis (1994, 1995, 1999, and 2000), the total water yields from this basin were considered below average for 1994 to 1995 and above average for 1996 and 1999. The seasonal hydrograph was divided into four hydrologically similar periods. These periods, which will be used throughout the analysis in this report are: winter base flow or WBF (November, December, January, and February); lower basin runoff or LBR (March and April); upper basin runoff or UBR (May, June, and July); and summer base flow or SBF (August, September, and October).
2.3.2 Temperature, Dissolved Oxygen and pH Temperature and dissolved oxygen are important water quality parameters relative to aquatic life. Within the Bear River system in Idaho, both parameters have numeric criteria associated with the coldwater aquatic life beneficial use designated for this segment of the Bear River and its tributaries.
Exceedence of state water quality criteria for coldwater biota for each hydrologic time period and station are shown in Table 2-6. The temperature criterion was exceeded between 0% and 7% of the observations below Oneida Reservoir, depending upon the specific location.

2004-2005 Water Quality Summary
Oneida: Project Number 472 13
Table 2-6. Exceedences of state water quality criteria in mainstem Bear River sites.
PHYSICAL SOLIDS NITROGEN PHOSPHORUS DESCRIPTION DO (mg/L)
<6 pH (SU)<6.5 or
>9.5
Temp (°C) >22
TSS (mg/L)
>80
NH3 (mg/L)
>4
NO3 (mg/L)
>4
OP (mg/L) >0.075
TP (mg/L) >0.075
BR abv Oneida at Hwy Bridge 3% 0% 0% 0.0% 0% 0% 2.9% 72.2%
BR 1 mile blw Oneida 0% 0% 0% 0.0% 15% 0.0% 40.0%
BR blw Oneida 2% 1% 3% 0.0% 0% 0% 0.0% 5.9%
BR at Riverdale 0% 0% 0.0% 14% 4.8% 20.0%
BR near Preston 0% 0% 7% 0.0% 0.0%
BR west of Preston 1% 0% 5% 2.8% 0% 0% 0.0% 53.5%
BR at ID UT stateline 2% 0% 7% 7.9% 0% 1% 9.1% 41.8%

2004-2005 Water Quality Summary
Oneida: Project Number 472 14
Dissolved oxygen varied widely from station to station on the Bear River in each hydrologic time period. In general, the highest dissolved oxygen concentrations were found during the winter base flow period, followed by lower basin runoff. Upper basin runoff and summer base flow had the lowest overall oxygen levels. This is believed to be the result of the combination of the influences of temperature and flow on the oxygen concentrations in the Bear River system. The numbers of exceedences for dissolved oxygen concentrations for the 1994-1995 and 1999-2000 data sets are shown in Table 2-6. Exceedences ranged from 0% to 3% of the observations.
2.3.3 Suspended Solids
The concentrations of total suspended solids were far more variable than for other parameters throughout the study reach. For example, during the two study periods, water leaving Oneida Reservoir and moving downstream to the Utah-Idaho stateline had its highest gain in concentration (61 mg/l) during the winter base flow period as compared to other river reaches upstream of Oneida Reservoir. The same spatial pattern was evident in the concentration of TSS in the three other hydrologic periods, with large increases in TSS occurring from the Oneida outlet to the Utah-Idaho stateline. The data collected in 1999-2000 indicated the major differences between the hydrologic time period was one of magnitude. Lower basin runoff had the highest concentrations of TSS followed by upper basin runoff, summer and winter base flow Using a criterion of 80 mg TSS/l, there were up to 7.8% exceedences for suspended sediments in the mainstem Bear River at the Utah-Idaho stateline (Table 2-6).
In the reach below Oneida Reservoir, the six major tributaries were also sampled as part of the 1999-2000 investigation. The data indicated that with the exception of Cottonwood Creek, these tributaries significantly added suspended solids to the Bear River. As noted in Table 2-7, Deep Creek and Battle Creek had the highest percent exceedences (46.7% and 75%, respectively). These creeks flow into the Bear River from the northwest near Riverdale, Idaho.
2.3.4 Nutrients Using a 4 mg/l concentration for ammonia and nitrate as a pollution indicator, the mainstem Bear River stations below Oneida exceeded criterion from 0% to 15% of the observations (Table 2-6). In this reach of the river, Battle, Deep, Five Mile and Weston creeks exceeded criterion 7% to 13% of the observations (Table 2-7).
Total phosphorus and orthophosphorus are also pollution indicators. Inspection of Table 2-6 indicates that the concentrations of phosphorous measured below the Oneida Reservoir exceeded the proposed criteria of 0.05 mg P/l at least 50% of the observations. The elevated concentrations at the border reflect mostly watershed contributions because the highest elevated concentrations occur in March and April (lower basin runoff) when winter snows are melting off the south and west facing dry farms which are in the drainages of Deep Creek, Battle Creek and 5-mile Creek. These tributaries exceed the TP criteria in 100% of the observations (Table 2-7). In a loading analysis conducted as part of the preliminary TMDL for this reach of the Bear River, it was found that about 30% of the TP gain from the Oneida Reservoir outfall to the Utah-Idaho stateline was attributed to these tributary inflows.

2004-2005 Water Quality Summary
Oneida: Project Number 472 15
Table 2-7. Exceedences in Bear River tributary sites of state water quality criteria.
PHYSICAL SOLIDS NITROGEN PHOSPHORUSDESCRIPTION DO (mg/L)
<6 pH (SU) <6.5 or
>9.5
Temp (°C)>22
TSS (mg/L)>80
NH3 (mg/L)
>4
NO3 (mg/L)
>4
OP (mg/L)>0.075
TP (mg/L) >0.075
Cottonwood Creek 0% 0% 1% 0.0% 0% 0% 0.0% 0.0%
Mink Creek 0% 0% 3% 7.9% 0% 0% 6.3% 56.8%
Battle Creek * 3% 0% 2% 75.0% 0% 13% 33.3% 100.0%
Deep Creek * 0% 0% 13% 46.7% 0% 7% 46.7% 100.0%
5 Mile Creek 0% 0% 7% 6.7% 0% 7% 93.3% 100.0%
Weston Creek * 0% 0% 7% 13.3% 0% 13% 0.0% 73.3%
* Idaho 303(d) List

2004-2005 Water Quality Summary
Oneida: Project Number 472 16
3.0 METHODS The following section of this report describes the methods used in the collection, data qualification, and data analysis of the study. As noted previously, a single station (Figure 3-1) was used to collect hourly data for selected water quality parameters. Continuous monitoring data was collected using a YSI Model 6920 water quality probe. The instrument was inspected and field calibrated at least weekly. During some time periods (summer baseflow 2004) the probe was inspected on a daily basis in order to remove organic detritus that congregated around the probe housing and resulted in a significant amount of outlier data points. Section 3.1 describes the procedure for data qualification and outlier identification.
In addition to the continuous electronic data, water quality “grab” samples were collected by technicians from Ecosystems Research Institute (ERI) and returned to the ERI laboratory for determining the concentration of ortho and total phosphorous, as well as total suspended solids. From March to September (runoff through summer baseflow/irrigation season), grab samples were collected every two weeks. The frequency was reduced to monthly sampling from October to February (winter baseflow). This schedule was followed in order that water quality samples collected for total suspended solids (TSS), turbidity and phosphorous corresponded to the range of flows representing the normal hydrograph, which is between 150 cfs and 2000 cfs.
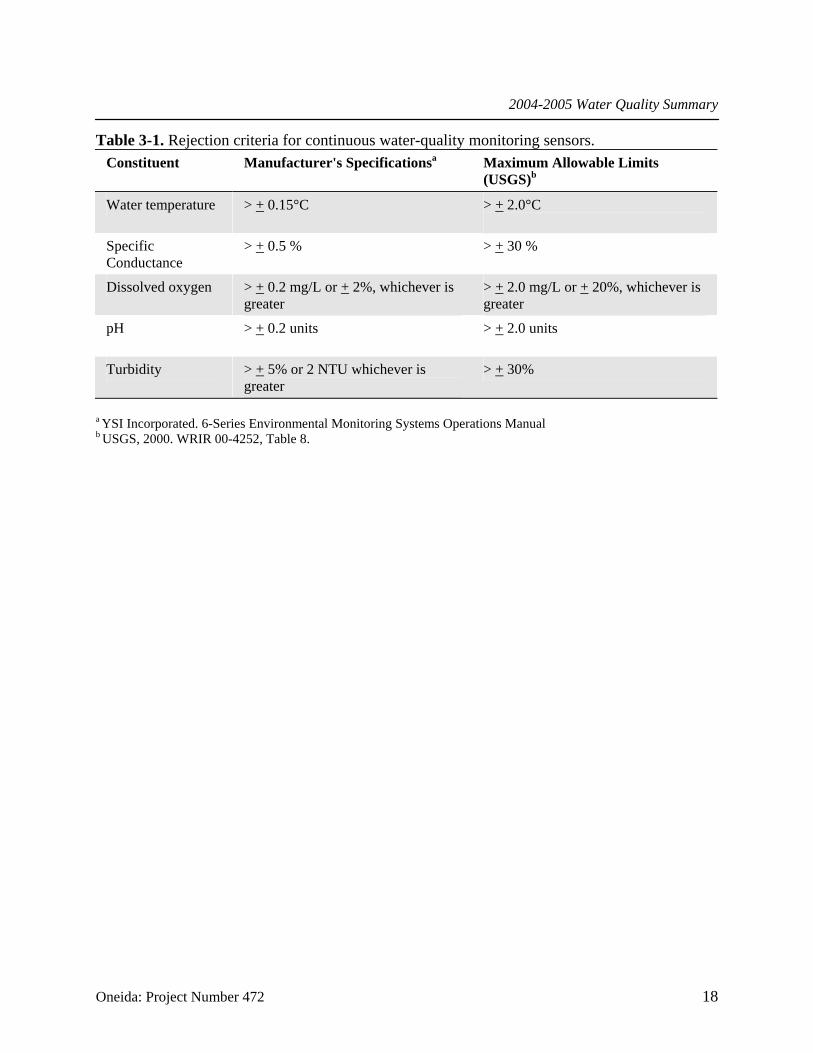
3.1 Data Qualification An important process in the analysis of the data collected at the site was the determination of data acceptance. The criteria used to establish acceptance limits are noted in Table 3-1. These limits were compared to the water quality probe data during regular probe field calibrations. Data were rejected based upon the exceedence of the criteria. The number and percent of accepted data are provided in Table 3-2 and Table 3-3.
3.2 Data Merging and Filtration The following section of this report describes the procedures and protocols (logic) used to further refine (filter) the electronic water quality data logged at the study site. Because the overall objective of the study was to determine if PacifiCorp’s activities were resulting in or contributing to violations of the water quality standards in the Bear River below the Oneida site, several additional data sets were acquired and merged with the in situ logged electronic data.
In order to accomplish the goal of assigning potential liability to operations of the Oneida Project to water quality violations, the natural perturbations (storm events) in the system needed to be identified within the data. In addition, the transient data anomalies also need to be identified and marked. The overall procedure is described below.
2004-2005 Water Quality Summary
Oneida: Project Number 472 17
Figure 3-1. The location of the monitoring site for the Oneida Water Quality Study.
2004-2005 Water Quality Summary
Oneida: Project Number 472 18
Table 3-1. Rejection criteria for continuous water-quality monitoring sensors. Constituent Manufacturer's Specificationsa Maximum Allowable Limits
(USGS)b
Water temperature > + 0.15°C > + 2.0°C
Specific Conductance
> + 0.5 % > + 30 %
Dissolved oxygen > + 0.2 mg/L or + 2%, whichever is greater
> + 2.0 mg/L or + 20%, whichever is greater
pH > + 0.2 units > + 2.0 units
Turbidity > + 5% or 2 NTU whichever is greater
> + 30%
a YSI Incorporated. 6-Series Environmental Monitoring Systems Operations Manual b USGS, 2000. WRIR 00-4252, Table 8.

2004-2005 Water Quality Summary
Oneida: Project Number 472 19
Table 3-2. The number and percentage of records in the database rated “acceptable” by parameter, based upon Table 3-1 criteria.
ACCEPTABLE RATING
No. of Datapoints
Percentage
Percent exceeding state water quality criteria
Turbidity 11869 100 See Table 3-3
Dissolved Oxygen 8691 73.2 6.9
Temperature 11869 100 17.1
Conductivity 11461 96.6 NA

2004-2005 Water Quality Summary
Oneida: Project Number 472 20
Table 3-3. The description of the hydrologic intervals used in this study and the associated number of turbidity data points included which met the QA/QC criteria.
Hydrologic Time Period Months Included Number Data
Points Accepted
Percentage Accepted
Upper Basin Runoff 2004 May, June, July 5974 100
Summer Base Flow 2004 August, September, October 9162 100
Winter Base Flow 2004-2005 November, December, January, February
10080 100
Lower Basin Runoff 2005 March, April 5437 100
Upper Basin Runoff 2005 May, June, July 8361 100
Summer Base Flow 2005 August, September 5874 100

2004-2005 Water Quality Summary
Oneida: Project Number 472 21
The initial step in the database development involved the merging of three separate hydrologic data sets with the water quality data (temporally matching), which involved the following steps. First, the USGS flow data was obtained and merged with the data from the logged water quality information. According to the standard operating procedure for the study, the frequency of data collection was on an hourly time step, however the study logged data at a 15-minute interval for better resolution and for use in the identification of outliers. The USGS flow data from Station No. 10092700 (Bear River at Idaho-Utah State Line) were merged at a 15-minute interval resolution.
Second, additional flow data collected by PacifiCorp at the outlet channel from Bear Lake (BROC), the outflow from the Soda Plant (BRSO) and the outflow from the Oneida facility (BROO) were combined with the above described data. This data was also at a 15-minute interval. It is believed that these three stations define PacifiCorp’s Bear River hydrologic operations, which in turn, affects flows at the monitoring location. For example, the Bear River at BROC defines the time period and the magnitude of flows released out of Bear Lake for down stream irrigation at Cutler Reservoir (below the project site). These releases are not determined by PacifiCorp, but by the irrigation companies which have water delivery contracts with PacifiCorp. The comparison between the flows below Soda and the flows below Oneida define the day-to-day flow changes and thus the specific “micro” impacts experienced at the site. These flows shown at BROO can be regulated on an hourly or on a daily basis throughout the year and are much less in scale when compared to the large seasonal flow releases from Bear Lake in the mid to late summer or the lower or upper basin runoff flows.
Third, the meteorological data was obtained from the Preston Idaho COOP Northwest station 107346 and merged into the data set. This data was only reported as daily totals for a 24-hour period ending between 5:00 PM and 10:00 PM. All data were merged at their reporting times.
At the conclusion of the database development phase (merging of all the data sets), the final step was to clip the hourly data from the complete data set. This reduced data set (11,869 observations) was then used in the analytical process described below. The total data set (47,394 observations) was retained for an analysis of outliers described in Section 3.3.3.
3.3 Analytical Procedure The following section summarizes the process used in the analysis phase of this study. This process systematically qualified or refined the data prior to statistical analysis. It should be noted that the description of the analytical approach is based upon one overriding assumption that the only mechanism of impact caused by PacifiCorp is the short term alteration of flows (operational changes) which can indirectly affect the water quality parameters recorded at the 3600 South station. To that end, great effort was made to define operational hydrologic actions and to dissect these actions from naturally occurring hydrologic events.
3.3.1 Hydrologic Time Periods In order to facilitate the analysis, the hourly data was divided into four hydrologic time periods. These periods are shown in Table 3-3 and are used throughout this report. The hydrologic time periods are also shown in Figure 3-2.

2004-2005 Water Quality Summary
Oneida: Project Number 472 22
Figure 3-2. The documentation of the six hydrologic time periods used in this study.
BEAR RIVER WATER QUALITY 2004-2005 FLOW
0
500
1,000
1,500
2,000
2,500
1/14/04 4/23/04 8/1/04 11/9/04 2/17/05 5/28/05 9/5/05 12/14/05
DATE
FLO
W (c
fs)
UBR 04SBF 04
WBF
LBR 05
UBR 05
SBF 05
2004-2005 Water Quality Summary
Oneida: Project Number 472 23
Table 3-4. The number of data points “tagged” within the data set as a result of the analysis of storm events. The percent of the data remaining after the documentation of storm influence is provided.
Hydrologic Time Period No. Datapoints Analyzed
No. Days with Precipitation
No. Datapoints
Tagged
Percentage of Database
Remaining
Upper Basin Runoff 2004 1944 22 155 92.0
Summer Base Flow 2004 2182 30 282 87.1
Winter Base Flow 2004-2005 2418 8 43 98.2
Lower Basin Runoff 2005 1310 20 442 66.3
Upper Basin Runoff 2005 2009 25 242 88.0
Summer Base Flow 2005 2006 14 159 92.1

2004-2005 Water Quality Summary
Oneida: Project Number 472 24
3.3.2 Storm Event Documentation
As noted above, storm events are stochastic in nature and affect the water quality parameters at the site. Because there is only one station where data were collected, transient storm events were marked within the database in order to facilitate an analysis of potential PacifiCorp impacts. The identification of storm events followed two steps or procedures. Firstly, any hydrologic changes in the data associated with measurable precipitation were coded within the data. A summary of precipitation events during the project period are shown in Table 3-4. In this initial storm event analysis, a total of 119 days with measurable precipitation occurred over the entire period of the study. Inspection of each event resulted in a change of flow and turbidity in 66 number of events (55.5% of the total storm time). This resulted in a notation of hourly observations ranging from 43 hourly observations during winter baseflow to 442 hourly observations in lower basin runoff. As can be seen in Table 3-4, all hydrologic time periods had data that fell into this category (storm event modified). After this initial filtration, data unaffected by stochastic storm events ranged from 66.3% to 98.2% of the total data, depending upon hydrologic time period.
3.3.3 Outlier Identification The identification of outliers was undertaken with the hourly data set described in Section 3.2 of this report. Outliers were found to be present in all hydrologic conditions. Field observations during the regular servicing and calibration of the probes indicated that floating or suspended detritus commonly collected on the probe housing especially during summer base flows in 2004. This resulted in sporadic peaks in the turbidity data. These points were tagged based upon the following criteria. Firstly, upon inspection of each data point where large turbidity spikes occurred, if the event was not present before or after the spike, the event was considered a outlier and tagged within the data set. If however, the spike lasted more than a single hourly observation (multiple consecutive hourly observations), the 15 minute data were inspected. If the data indicated that the pattern observed followed a “step function”, all the data were tagged for future analysis. In total, 394 hourly turbidity spikes were categorized as outliers within the database. By far, the vast majority of outliers were encountered in the summer baseflow of 2004. In September of that year, flows in the Bear River were less than 200 cfs. Given this low flow, extensive aquatic macrophytes were observed growing in the river around the study site. In order to keep the probe free from fouling, daily cleaning was necessary. Inspection of the data indicated that the water quality instrument was fouled within only several hours of cleaning. In order to preserve some data for analysis in this time period, the data collected immediately following the clearing of macrophyte debris was deemed usable in the subsequent analysis. A summary of the outliers removed are shown in Table 3-5.
In summary, the documentation of water quality observations at the 3600 Street Bridge corresponding to storm or outlier events has resulted in a dataset that is 85.5% of its initial size. Although all the data remained within the database, the outlier data was not used in the analysis involving the subsequent determination of potential impacts as a result of Oneida Reservoir operations.

2004-2005 Water Quality Summary
Oneida: Project Number 472 25
Table 3-5. The number of data points “tagged” within the data set as outliers. The percent of the data remaining after removal is provided.
Hydrologic Time Period No. Datapoints Tagged as Outliers
Percentage of Database Remaining
Upper Basin Runoff 2004 1 92.0
Summer Base Flow 2004 371 70.1
Winter Base Flow 2004-2005 15 97.6
Lower Basin Runoff 2005 2 66.1
Upper Basin Runoff 2005 3 87.8
Summer Base Flow 2005 2 92.0

2004-2005 Water Quality Summary
Oneida: Project Number 472 26
4.0 RESULTS The following section of this report summarizes the results of the data analysis conducted as part of investigation. The results of this study will be initially presented based upon hydrologic time period. Because of its timing and magnitude, hydrology at the site has a overriding influence on the water quality conditions, and an inter-parameter comparison was warranted.
4.1 Upper Basin Runoff 2004 The hydrology data used in this investigation came from two sources and are shown in Figure 4-1. Data for the 3600 South site was obtained from the USGS (Station No. 10092700) while flow data for the remaining sites were provided by PacifiCorp. All the remaining hydrology data presented in this report was obtained from these sources. In Figure 4-1 through Figure 4-5, flow and water quality data are presented for the upper basin runoff period in 2004 (UBR04). As noted in the Methods section, the flows at the project site (Figure 4-1) represent natural hydrologic conditions, irrigation augmentation during base flow, and re-regulation of flows below Oneida Reservoir. In 2004, Bear Lake water was released earlier than normal because of the lack of upper basin runoff flows. The hydrologic year in 2004 was considered a low water year. Bear Lake releases occurred for a brief time in May, as well as in June and July. Irrigation releases were continued after August 1, 2004. The remaining flows passing the study site were from natural sources.
The water quality parameters are plotted in Figures 4-2 through 4-5. Both temperature and dissolved oxygen exhibited diel variations. Temperatures remained relatively consistent in May but showed an overall warming trend during the middle of July, after which it remained constant at about 25°C (+1°C). Dissolved oxygen typically ranged between 6.5 to 9.5 mg/L.
Turbidity measurements during UBR04 were usually less than 50 NTU. The exception included two large peaks that occurred in May. Both peaks exceeded 120 NTU and were associated with large storm events.
4.2 Summer Base Flow 2004 The summer base flows for 2004 (SBF04) as well as the water quality data for the same time period are shown in Figures 4-6 through 4-10. The flow data for the Bear Lake outlet shows that irrigation releases continued from the UBR04 period through August ending on September 2, 2004. Flows at the stateline site were very low and relatively stable (200 cfs) until the middle of October when fall storms increased flows to 700 cfs.
As in the UBR04 time period, temperature and dissolved oxygen both exhibited diel variations. Temperatures reached a maximum of 23°C in early August and then continually decreased through the end of October (7°C). Both dissolved oxygen and turbidity had the highest proportion of outliers (94.2% of all outlier data occurred during this period) because of extensive amounts of floating macrophyte piles which lodged on the probe housing. Both dissolved oxygen and turbidity are sensitive to debris fouling. The turbidity data (in an unfouled condition) was typically around 10 NTU. During an October storm event, which increased flows in the river to 700 cfs, turbidity also increased from a base of 5 NTU to a maximum of 70 NTU.

2004-2005 Water Quality Summary
Oneida: Project Number 472 27
Figure 4-1. Upper basin runoff flows for two stations in the Bear River in 2004.
Figure 4-2. Continuous temperature at the monitoring site during UBR04.
BEAR RIVER HYDROLOGY 2004UPPER BASIN RUNOFF FLOWS
0
200
400
600
800
1,000
1,200
5/3/04 5/13/04 5/23/04 6/2/04 6/12/04 6/22/04 7/2/04 7/12/04 7/22/04 8/1/04 8/11/04
DATE
FLO
W (c
fs)
BR AT UT- I D S TATE LI NE BR AT BL OUTLET
BEAR RIVER WATER QUALITY 2004UPPER BASIN RUNOFF TEMPERATURE
0
5
10
15
20
25
30
35
5/3/04 5/13/04 5/23/04 6/2/04 6/12/04 6/22/04 7/2/04 7/12/04 7/22/04 8/1/04 8/11/04
DATE
Tem
pera
ture
(oC
)

2004-2005 Water Quality Summary
Oneida: Project Number 472 28
Figure 4-3. Continuous conductance at the monitoring site during UBR04.
Figure 4-4. Continuous dissolved oxygen at the monitoring site during UBR04. Data from 7/12/04 to 08/01/04 were due to probe failure.
BEAR RIVER WATER QUALITY 2004UPPER BASIN RUNOFF CONDUCTANCE
0.0
0.5
1.0
1.5
2.0
2.5
3.0
5/3/04 5/13/04 5/23/04 6/2/04 6/12/04 6/22/04 7/2/04 7/12/04 7/22/04 8/1/04 8/11/04
DATE
SPC
BEAR RIVER WATER QUALITY 2004UPPER BASIN RUNOFF DISSOLVED OXYGEN
0
4
8
12
16
20
5/3/04 5/13/04 5/23/04 6/2/04 6/12/04 6/22/04 7/2/04 7/12/04 7/22/04 8/1/04 8/11/04
DATE
Dis
solv
ed O
xyge
n (m
g/l)

2004-2005 Water Quality Summary
Oneida: Project Number 472 29
Figure 4-5. Continuous turbidity at the monitoring site during UBR04.
Figure 4-6. Summer base flow for two stations in the Bear River in 2004.
BEAR RIVER WATER QUALITY 2004UPPER BASIN RUNOFF TURBIDITY
0
50
100
150
200
5/3/04 5/13/04 5/23/04 6/2/04 6/12/04 6/22/04 7/2/04 7/12/04 7/22/04 8/1/04 8/11/04
DATE
TUR
BID
ITY
(ntu
)
BEAR RIVER HYDROLOGY 2004SUMMER BASEFLOW FLOWS
0
200
400
600
800
1,000
1,200
7/27/04 8/6/04 8/16/04 8/26/04 9/5/04 9/15/04 9/25/04 10/5/04 10/15/04 10/25/04 11/4/04
DATE
FLO
W (c
fs)
BR AT UT- I D S TATE LI NE BR AT BL OUTLET

2004-2005 Water Quality Summary
Oneida: Project Number 472 30
Figure 4-7. Continuous temperature at the monitoring site during SBF04.
Figure 4-8. Continuous conductance at the monitoring site during SBF04.
BEAR RIVER WATER QUALITY 2004SUMMER BASEFLOW TEMPERATURE
0
5
10
15
20
25
30
35
7/27/04 8/6/04 8/16/04 8/26/04 9/5/04 9/15/04 9/25/04 10/5/04 10/15/04 10/25/04 11/4/04
DATE
Tem
pera
ture
(oC
)
BEAR RIVER WATER QUALITY 2004SUMMER BASEFLOW CONDUCTANCE
0.0
0.5
1.0
1.5
2.0
7/27/04 8/6/04 8/16/04 8/26/04 9/5/04 9/15/04 9/25/04 10/5/04 10/15/04 10/25/04 11/4/04
DATE
SPC

2004-2005 Water Quality Summary
Oneida: Project Number 472 31
Figure 4-9. Continuous dissolved oxygen at the monitoring site during SBF04. Data below 4 mg DO/l were due to probe failure (08/11/04, 09/10/04, 10/20/04).
Figure 4-10. Continuous turbidity at the monitoring site during SBF04.
BEAR RIVER WATER QUALITY 2004SUMMER BASEFLOW DISSOLVED OXYGEN
0
4
8
12
16
20
7/27/04 8/6/04 8/16/04 8/26/04 9/5/04 9/15/04 9/25/04 10/5/04 10/15/04 10/25/04 11/4/04
DATE
Dis
solv
ed O
xyge
n (m
g/l)
BEAR RIVER WATER QUALITY 2004SUMMER BASEFLOW TURBIDITY
0
50
100
150
200
7/27/04 8/6/04 8/16/04 8/26/04 9/5/04 9/15/04 9/25/04 10/5/04 10/15/04 10/25/04 11/4/04
DATE
TUR
BID
ITY
(ntu
)

2004-2005 Water Quality Summary
Oneida: Project Number 472 32
4.3 Winter Base Flow 2004-2005
The data collected at the 3600 South Bridge site and the stateline gage during winter base flow 2004-2005 (WBF) are shown in Figures 4-11 through 4-15. Of all the data sets collected, this time period represented the most stable conditions in both flow and water quality data. Flows in the river were between 200 and 400 cfs with no flows from Bear Lake being added to the system. Temperatures decreased from 10°C on November 1 to 5°C by January 1, and remained between 0°C and 5°C throughout the hydrologic period. Unlike temperature, which did not show a strong diel periodicity, dissolved oxygen did have daily variations. Because temperatures were reasonable uniform, the variation in oxygen was believed to have been caused by plant photosynthesis and respiration. Inspection of the data shows three turbidity fouling events. One event was associated with a spike in flows while the remaining events were not associated with large-scale flow changes.
4.4 Lower Basin Runoff 2005
Inspection of lower basin runoff flows in 2005 (LBR05) in Figure 4-16 shows that the flows at the stateline station did not start to change until March 7, 2005. At that time, flows increased in a linear fashion reaching an initial maximum of 1,120 cfs (from a base of 450 cfs). This initial increase caused a significant increase in turbidity (Figure 4-20). This is consistent with the historical data collected within the basin, which shows that lower basin runoff has the highest ambient turbidity. This data set documents this condition in unprecedented detail. The turbidity, which started at a base level of 5 NTU to 10 NTU, increased to levels over 400 NTU. Although subsequent snow melting also resulted in increased turbidity, levels did not exceed 150 NTU. The highest flows experienced in this time period (over 2,000 cfs on April 29, 2005) were associated with higher elevation runoff. This high flow resulted in a concurrent turbidity of over 250 NTU.
4.5 Upper Basin Runoff 2005
Upper basin runoff in 2005 (UBR05) was the first replication of a hydrologic time period for the study. In the 2005 time period, hydrologic conditions were much different than in 2004. First, Bear Lake water was not added to the system in May as had occurred in 2004. In addition, a significant amount of water was in the system as a result of natural flows from the watershed. Two peaks in flow were observed (Figure 4-21), both of which were over 2,000 cfs in magnitude and resulted in turbidity changes at the study site. The first flow peak resulted in turbidity levels in excess of 100 NTU, while the second peak in flow resulted in turbidity levels around 50 NTU. Bear Lake water entered the site on June 20, 2005 and flow steadily increased to a maximum of 800 cfs on July 23, 2005. This flow increase also had an overall increase in background turbidity.
Temperatures in the river showed no pattern relative to the runoff events but did show an overall increase beginning at 10°C on May 1 and reaching 25°C by July 1.

2004-2005 Water Quality Summary
Oneida: Project Number 472 33
Figure 4-11. Winter baseflow for two stations in the Bear River in 2004 and 2005.
Figure 4-12. Continuous temperature at the monitoring site during WBF.
BEAR RIVER HYDROLOGY 2004-2005WINTER BASEFLOW FLOWS
0
200
400
600
800
1,000
1,200
10/20/04 11/9/04 11/29/04 12/19/04 1/8/05 1/28/05 2/17/05 3/9/05
DATE
FLO
W (c
fs)
BR AT UT- I D S TATE LI NE BR AT BL OUTLET
BEAR RIVER WATER QUALITY 2004-2005WINTER BASEFLOW TEMPERATURE
-5
0
5
10
15
20
25
30
35
10/20/04 11/9/04 11/29/04 12/19/04 1/8/05 1/28/05 2/17/05 3/9/05
DATE
Tem
pera
ture
(oC
)
2004-2005 Water Quality Summary
Oneida: Project Number 472 34
Figure 4-13. Continuous conductance at the monitoring site during WBF.
Figure 4-14. Continuous dissolved oxygen at the monitoring site during WBF. Data for 12/19/04 represent a probe failure.
BEAR RIVER WATER QUALITY 2004-2005WINTER BASEFLOW CONDUCTANCE
0.0
0.5
1.0
1.5
2.0
10/20/04 11/9/04 11/29/04 12/19/04 1/8/05 1/28/05 2/17/05 3/9/05
DATE
SPC
BEAR RIVER WATER QUALITY 2004WINTER BASEFLOW DISSOLVED OXYGEN
0.0
4.0
8.0
12.0
16.0
20.0
10/20/04 11/9/04 11/29/04 12/19/04 1/8/05 1/28/05 2/17/05 3/9/05
DATE
Dis
solv
ed O
xyge
n (m
g/l)

2004-2005 Water Quality Summary
Oneida: Project Number 472 35
Figure 4-15. Continuous turbidity at the monitoring site during WBF.
Figure 4-16. Lower basin runoff flows for two stations in the Bear River in 2005.
BEAR RIVER HYDROLOGY 2005LOWER BASIN RUNOFF FLOWS
0
500
1,000
1,500
2,000
2,500
2/17/05 2/27/05 3/9/05 3/19/05 3/29/05 4/8/05 4/18/05 4/28/05 5/8/05
DATE
FLO
W (c
fs)
BR AT UT-ID STATE LINE BR AT BL OUTLET
BEAR RIVER WATER QUALITY 2004-2005WINTER BASEFLOW TURBIDITY
0
50
100
150
200
10/20/04 11/9/04 11/29/04 12/19/04 1/8/05 1/28/05 2/17/05 3/9/05
DATE
TUR
BID
ITY
(ntu
)

2004-2005 Water Quality Summary
Oneida: Project Number 472 36
Figure 4-17. Continuous temperature at the monitoring site during LBR05.
Figure 4-18. Continuous conductance at the monitoring site during LBR05.
BEAR RIVER WATER QUALITY 2005LOWER BASIN RUNOFF TEMPERATURE
0
5
10
15
20
25
30
35
2/17/05 2/27/05 3/9/05 3/19/05 3/29/05 4/8/05 4/18/05 4/28/05 5/8/05
DATE
Tem
pera
ture
(oC
)
BEAR RIVER WATER QUALITY 2005LOWER BASIN RUNOFF CONDUCTANCE
0.0
0.5
1.0
1.5
2.0
2/17/05 2/27/05 3/9/05 3/19/05 3/29/05 4/8/05 4/18/05 4/28/05 5/8/05
DATE
SPC

2004-2005 Water Quality Summary
Oneida: Project Number 472 37
Figure 4-19. Continuous dissolved oxygen at the monitoring site during LBR05. Data for 04/04/05 represent a probe failure.
Figure 4-20. Continuous turbidity at the monitoring site during LBR05.
BEAR RIVER WATER QUALITY 2005LOWER BASIN RUNOFF DISSOLVED OXYGEN
0
4
8
12
16
20
2/17/05 2/27/05 3/9/05 3/19/05 3/29/05 4/8/05 4/18/05 4/28/05 5/8/05
DATE
Dis
solv
ed O
xyge
n (m
g/l)
BEAR RIVER WATER QUALITY 2005LOWER BASIN RUNOFF TURBIDITY
0
50
100
150
200
250
300
350
400
2/17/05 2/27/05 3/9/05 3/19/05 3/29/05 4/8/05 4/18/05 4/28/05 5/8/05
DATE
TURB
IDIT
Y (n
tu)

2004-2005 Water Quality Summary
Oneida: Project Number 472 38
Figure 4-21. Upper basin runoff flows for two stations in the Bear River in 2005.
Figure 4-22. Continuous temperature at the monitoring site during UBR05.
BEAR RIVER HYDROLOGY 2005UPPER BASIN RUNOFF FLOWS
0
500
1,000
1,500
2,000
2,500
4/18/05 5/1/05 5/14/05 5/27/05 6/9/05 6/22/05 7/5/05 7/18/05 7/31/05
DATE
FLO
W (c
fs)
BR AT UT- I D S TATE LI NE BR AT BL OUTLET
BEAR RIVER WATER QUALITY 2005UPPER BASIN RUNOFF TEMPERATURE
0.0
5.0
10.0
15.0
20.0
25.0
30.0
35.0
4/18/05 5/1/05 5/14/05 5/27/05 6/9/05 6/22/05 7/5/05 7/18/05 7/31/05
DATE
TEM
PER
ATU
RE
(oC
)

2004-2005 Water Quality Summary
Oneida: Project Number 472 39
Figure 4-23. Continuous conductance at the monitoring site during UBR05.
Figure 4-24. Continuous dissolved oxygen at the monitoring site during UBR05.
BEAR RIVER WATER QUALITY 2005UPPER BASIN RUNOFF CONDUCTANCE
0.0
0.5
1.0
1.5
2.0
4/18/05 5/1/05 5/14/05 5/27/05 6/9/05 6/22/05 7/5/05 7/18/05 7/31/05
DATE
SPC
BEAR RIVER WATER QUALITY 2005UPPER BASIN RUNOFF DISSOLVED OXYGEN
0
4
8
12
16
20
4/18/05 5/1/05 5/14/05 5/27/05 6/9/05 6/22/05 7/5/05 7/18/05 7/31/05
DATE
Dis
solv
ed O
xyge
n (m
g/l)

2004-2005 Water Quality Summary
Oneida: Project Number 472 40
Figure 4-25. Continuous turbidity at the monitoring site during UBR05.
BEAR RIVER WATER QUALITY 2005UPPER BASIN RUNOFF TURBIDITY
0
50
100
150
200
4/18/05 5/1/05 5/14/05 5/27/05 6/9/05 6/22/05 7/5/05 7/18/05 7/31/05
DATE
TUR
BID
ITY
(ntu
)

2004-2005 Water Quality Summary
Oneida: Project Number 472 41
4.6 Summer Base Flow 2005
As with UBR04 and UBR05, summer base flow in 2005 (SBF05) was a replicate time period relative to the 2004 data. The major difference between the two replicate years was the amount of time Bear Lake water influenced the lows at the project site. In 2004, Bear Lake flows were discontinued in the first week of September, but in 2005 these flows were present in the system until the end of September. This allowed for a higher base flow in 2005 (400 cfs rather than 200 cfs). This resultant higher base flow was reflected in the ambient number of turbidity outliers and the lower degree of probe fouling that was experienced in 2004. Temperature and dissolved oxygen data showed the same pattern between the two years. Several storm events occurring in the middle of October resulted in an increase in background turbidity levels.
4.7 Water Quality Grab Samples and Regression Analysis As part of the settlement agreement, IDEQ required the collection of water quality grab samples from each of the representative hydrologic time periods, with a minimum collection of 30 samples. The parameters included turbidity, total phosphorus, and total suspended solids. Upon completion of the chemical analysis, statistical relationships were to be determined between total phosphorous (mg P/l) and turbidity (NTU), as well as between total suspended solids (mg/l) and turbidity (NTU). These relationships, as well as their statistical significance can be seen in Figures 4-31 and 4-32. In both cases, turbidity as measured at the 3600 South Bridge site was a significant predictor of total phosphorus concentration and total suspended sediment concentrations.
4.8 Quantification of PacifiCorp Operations As noted earlier in this report, hydrologic conditions at the study site (below the Oneida Hydroelectric Project and near the Utah-Idaho border) can be affected by a variety of natural and man-caused events. Natural flows in the river, tributary input within the study reach, augmentation of summer base flows for irrigation, as well as short-term flow manipulations for hydropower production at the Oneida facility all contribute to the observed flows. Because of this mixture of activities, as well as only a single monitoring station, the specific operations of the Oneida facility had to be defined and quantified, as well as sorted out from the other non-project related impacts. To that end, an analysis was undertaken which attempted to dissect out the operational effects on hydrology at the 3600 South Bridge site.

2004-2005 Water Quality Summary
Oneida: Project Number 472 42
Figure 4-26. Summer base flow for two stations in the Bear River in 2005.
Figure 4-27. Continuous temperature at the monitoring site during SBF05.
BEAR RIVER HYDROLOGY 2005SUMMER BASEFLOW FLOWS
0
200
400
600
800
1,000
1,200
7/27/05 8/8/05 8/20/05 9/1/05 9/13/05 9/25/05 10/7/05 10/19/05 10/31/05
DATE
FLO
W (c
fs)
BR AT UT- I D S TATE LI NE BR AT BL OUTLET
BEAR RIVER WATER QUALITY 2005SUMMER BASEFLOW TEMPERATURE
0.0
5.0
10.0
15.0
20.0
25.0
30.0
35.0
7/27/05 8/8/05 8/20/05 9/1/05 9/13/05 9/25/05 10/7/05 10/19/05 10/31/05
DATE
TEM
PER
ATU
RE
(oC
)

2004-2005 Water Quality Summary
Oneida: Project Number 472 43
Figure 4-28. Continuous conductance at the monitoring site during SBF05.
Figure 4-29. Continuous dissolved oxygen at the monitoring site during SBF05. Data between 08/16/05 and 08/26/05 were lost due to probe failure.
BEAR RIVER WATER QUALITY 2005SUMMER BASEFLOW CONDUCTANCE
0.0
0.5
1.0
1.5
2.0
7/27/05 8/8/05 8/20/05 9/1/05 9/13/05 9/25/05 10/7/05 10/19/05 10/31/05
DATE
SPC
BEAR RIVER WATER QUALITY 2005SUMMER BASEFLOW DISSOLVED OXYGEN
0
4
8
12
16
20
7/27/05 8/8/05 8/20/05 9/1/05 9/13/05 9/25/05 10/7/05 10/19/05 10/31/05
DATE
Dis
solv
ed O
xyge
n (m
g/l)

2004-2005 Water Quality Summary
Oneida: Project Number 472 44
Figure 4-30. Continuous turbidity at the monitoring site during SBF05.
BEAR RIVER WATER QUALITY 2005SUMMER BASEFLOW TURBIDITY
0
25
50
75
100
7/27/05 8/8/05 8/20/05 9/1/05 9/13/05 9/25/05 10/7/05 10/19/05 10/31/05
DATE
TUR
BID
ITY
(ntu
)

2004-2005 Water Quality Summary
Oneida: Project Number 472 45
Figure 4-31. The statistical relationship between turbidity and total suspended solids for grab samples collected during the study period.
Figure 4-32. The statistical relationship between turbidity and total phosphorus for grab samples collected during the study period.
BEAR RIVER WATER QUALITYTurbidity vs. Total Suspended Solids
y = 2.8835x - 0.8233R2 = 0.9823
0
100
200
300
400
500
600
0 20 40 60 80 100 120 140 160 180
Turbidity (NTU)
Tota
l Sus
pend
ed S
olid
s (m
g/L)
BEAR RIVER WATER QUALITYTurbidity vs. Total Phosphorus
y = 0.0033x + 0.04R2 = 0.9368
0
0.1
0.2
0.3
0.4
0.5
0.6
0.7
0 20 40 60 80 100 120 140 160 180
Turbidity (NTU)
Tota
l Pho
spho
rus
(mg/
L)

2004-2005 Water Quality Summary
Oneida: Project Number 472 46
In order to accomplish this goal, the following approach was undertaken. First, the individual hourly data was inspected and divided into “events”. An event was defined as an abrupt change in flow conditions as recorded at the USGS stateline station (No. 10092700) lasting at least three hours in length. Typically, events were longer in duration, however, three hours was the threshold for consideration. The event was then categorized as an increasing flow, decreasing flow or stable flow event within the hourly data set. All data was placed into one of the three categories. During the entire study period lasting 18 months, there were 758 events where flow changes occurred. Second, a determination was made as to which of the short-term flow changes were caused by Oneida plant operations. Returning to the hourly-defined events, visual inspection was made between the flows below the Soda plant and flows below the Oneida facility. The assumption was that if flows were different between the two stations, the difference was a result in operational changes at Oneida. The corollary to that assumption is that if no differences were found, then Oneida was under a run-of-river operational mode, with no short-term flow changes.
The comparison between these two stations for each hydrologic time period can be seen in Figures 4-33 through 4-38. Inspection of these figures clearly shows the operations of the Oneida project relative to the water made available below Soda and into the headwaters of Oneida Reservoir. It should be noted, depending upon the hydrologic period, the reach of river between the two projects can be a gaining reach due to watershed inputs (i.e. winter base flow) or a losing reach due to irrigation withdrawals via Last Chance Canal (i.e. June and July 2004 and 2005). Given this information, each “event” was further tagged as an operational event. The distribution of the duration of the increasing flow events in hours can be seen in Figure 4-39. These events were typically greater than six hours in length.
In summary, the hydrologic data which was used at the 3600 South Bridge site was subdivided into “events” based upon flow direction (increasing, decreasing or stable). The data were further categorized based upon operational effects. It should be noted that based upon the information in Section 3.0 of this report, these data also contained tags which indicate storm event influence or the presence of outliers.
4.9 PacifiCorp Effects
Once constructed, the hydrologic events were investigated on an individual basis for their impacts upon water quality (specifically turbidity). An example of a sequence of events (and their associated event number) for each hydrologic time period is shown in Figures 4-40 through 4-45. For each event, a regression analysis was conducted to determine if a statistically significant relationship was present between the independent variable (flow) and the dependent variable (turbidity). Inspection of these relationships indicated that there were some significant regressions in the increasing and decreasing flow events but not in the stable flow category. Logic dictated that the increasing flow category should be investigated in greater detail given that in the decreasing flow category, the significant relationships demonstrated that with lower flows, turbidity was also lower.
Further analysis of the increasing flow events indicated that they were interspersed throughout the study period. Figure 4-46 shows where these events occurred over the entire 18 month time period. In total, 251 individual hydrologically increasing events were defined.

2004-2005 Water Quality Summary
Oneida: Project Number 472 47
Figure 4-33. The flows below the Soda Hydroelectric Project and the Oneida Hydroelectric Project for UBR04.
Figure 4-34. The flows below the Soda Hydroelectric Project and the Oneida Hydroelectric Project for SBF04.
BEAR RIVER HYDROLOGY 2004UPPER BASIN RUNOFF FLOWS
0
200
400
600
800
1,000
1,200
5/3/04 5/15/04 5/27/04 6/8/04 6/20/04 7/2/04 7/14/04 7/26/04 8/7/04
DATE
FLO
W (c
fs)
BR AT ONEI DA BR AT S ODA
BEAR RIVER HYDROLOGY 2004SUMMER BASEFLOW FLOWS
0
200
400
600
800
1,000
1,200
7/22/04 8/4/04 8/17/04 8/30/04 9/12/04 9/25/04 10/8/04 10/21/04 11/3/04
DATE
FLO
W (c
fs)
BR AT ONEI DA BR AT S ODA

2004-2005 Water Quality Summary
Oneida: Project Number 472 48
Figure 4-35. The flows below the Soda Hydroelectric Project and the Oneida Hydroelectric Project for WBF.
Figure 4-36. The flows below the Soda Hydroelectric Project and the Oneida Hydroelectric Project for LBR05.
BEAR RIVER HYDROLOGY 2005LOWER BASIN RUNOFF FLOWS
0
500
1,000
1,500
2,000
2,500
2/17/05 2/27/05 3/9/05 3/19/05 3/29/05 4/8/05 4/18/05 4/28/05 5/8/05
DATE
FLO
W (c
fs)
BR AT ONEI DA BR AT S ODA
BEAR RIVER HYDROLOGY 2004-2005WINTER BASEFLOW FLOWS
0
200
400
600
800
1,000
1,200
10/20/04 11/4/04 11/19/04 12/4/04 12/19/04 1/3/05 1/18/05 2/2/05 2/17/05 3/4/05
DATE
FLO
W (c
fs)
BR AT ONEI DA BR AT S ODA

2004-2005 Water Quality Summary
Oneida: Project Number 472 49
Figure 4-37. The flows below the Soda Hydroelectric Project and the Oneida Hydroelectric Project for UBR05.
Figure 4-38. The flows below the Soda Hydroelectric Project and the Oneida Hydroelectric Project for SBF05.
BEAR RIVER HYDROLOGY 2005UPPER BASIN RUNOFF FLOWS
0
500
1,000
1,500
2,000
2,500
4/18/05 5/1/05 5/14/05 5/27/05 6/9/05 6/22/05 7/5/05 7/18/05 7/31/05
DATE
FLO
W (c
fs)
BR AT ONEI DA BR AT S ODA
BEAR RIVER HYDROLOGY 2005SUMMER BASEFLOW FLOWS
0
200
400
600
800
1,000
1,200
7/27/05 8/8/05 8/20/05 9/1/05 9/13/05 9/25/05 10/7/05 10/19/05 10/31/05
DATE
FLO
W (c
fs)
BR AT ONEI DA BR AT S ODA

2004-2005 Water Quality Summary
Oneida: Project Number 472 50
Figure 4-39. The frequency distribution of the duration of the increasing flow events documented below Oneida Reservoir in 2004-2005.
BEAR RIVER WATER QUALITY STUDYDistribution of Increasing Flow Events
0%
5%
10%
15%
20%
25%
30%
<3 4-5 6-7 8-9 10-11 12-13 14-15 >16EVENT DURATION (Number of Hours)
PERC
ENT
OF
OBS
ERVA
TIO
NS
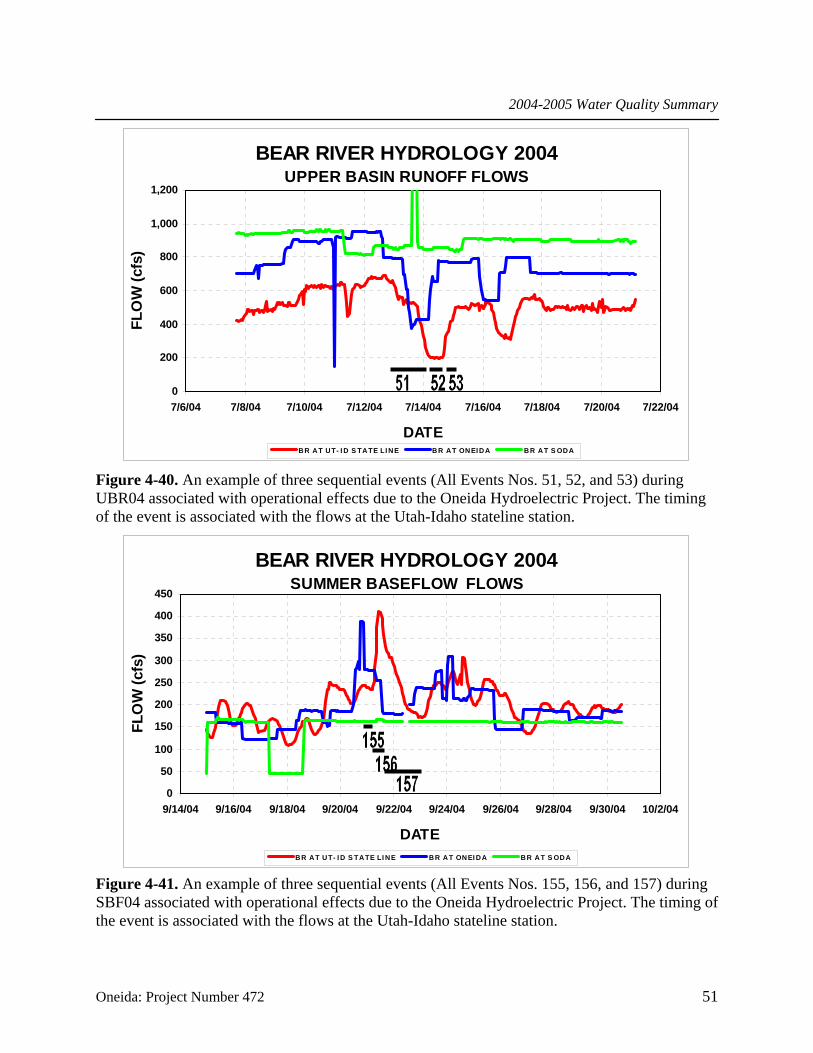
2004-2005 Water Quality Summary
Oneida: Project Number 472 51
Figure 4-40. An example of three sequential events (All Events Nos. 51, 52, and 53) during UBR04 associated with operational effects due to the Oneida Hydroelectric Project. The timing of the event is associated with the flows at the Utah-Idaho stateline station.
Figure 4-41. An example of three sequential events (All Events Nos. 155, 156, and 157) during SBF04 associated with operational effects due to the Oneida Hydroelectric Project. The timing of the event is associated with the flows at the Utah-Idaho stateline station.
BEAR RIVER HYDROLOGY 2004SUMMER BASEFLOW FLOWS
0
50
100
150
200
250
300
350
400
450
9/14/04 9/16/04 9/18/04 9/20/04 9/22/04 9/24/04 9/26/04 9/28/04 9/30/04 10/2/04
DATE
FLO
W (c
fs)
BR AT UT- I D S TATE LI NE BR AT ONEI DA BR AT S ODA
BEAR RIVER HYDROLOGY 2004UPPER BASIN RUNOFF FLOWS
0
200
400
600
800
1,000
1,200
7/6/04 7/8/04 7/10/04 7/12/04 7/14/04 7/16/04 7/18/04 7/20/04 7/22/04
DATE
FLO
W (c
fs)
BR AT UT- I D S TATE LI NE BR AT ONEI DA BR AT S ODA

2004-2005 Water Quality Summary
Oneida: Project Number 472 52
Figure 4-42. An example of three sequential events (All Events Nos. 258, 259, and 260) during WBF in 2004/2005 associated with operational effects due to the Oneida Hydroelectric Project. The timing of the event is associated with the flows at the Utah-Idaho stateline station.
Figure 4-43. An example of three sequential events (All Events Nos. 427, 428, and 429) during LBR05 associated with operational effects due to the Oneida Hydroelectric Project. The timing of the event is associated with the flows at the Utah-Idaho stateline station.
BEAR RIVER HYDROLOGY 2004-05WINTER BASEFLOW FLOWS
0
200
400
600
800
1,000
1,200
11/7/04 11/9/04 11/11/04 11/13/04 11/15/04 11/17/04 11/19/04 11/21/04 11/23/04 11/25/04
DATE
FLO
W (c
fs)
BR AT UT- I D S TATE LI NE BR AT ONEI DA BR AT S ODA
BEAR RIVER HYDROLOGY 2005LOWER BASIN RUNOFF FLOWS
0
500
1,000
1,500
2,000
2,500
4/10/05 4/12/05 4/14/05 4/16/05 4/18/05 4/20/05 4/22/05 4/24/05 4/26/05
DATE
FLO
W (c
fs)
BR AT UT- I D S TATE LI NE BR AT ONEI DA BR AT S ODA

2004-2005 Water Quality Summary
Oneida: Project Number 472 53
Figure 4-44. An example of three sequential events (All Events Nos. 537, 538, and 539) during UBR05 associated with operational effects due to the Oneida Hydroelectric Project. The timing of the event is associated with the flows at the Utah-Idaho stateline station.
Figure 4-45. An example of three sequential events (All Events Nos. 619, 620, and 621) during SBF05 associated with operational effects due to the Oneida Hydroelectric Project. The timing of the event is associated with the flows at the Utah-Idaho stateline station.
BEAR RIVER HYDROLOGY 2005UPPER BASIN RUNOFF FLOWS
0
500
1,000
1,500
2,000
2,500
6/3/05 6/5/05 6/7/05 6/9/05 6/11/05 6/13/05 6/15/05 6/17/05 6/19/05 6/21/05 6/23/05
DATE
FLO
W (c
fs)
BR AT UT- I D S TATE LI NE BR AT ONEI DA BR AT S ODA
BEAR RIVER HYDROLOGY 2005SUMMER BASEFLOW FLOWS
0
200
400
600
800
1,000
1,200
8/22/05 8/24/05 8/26/05 8/28/05 8/30/05 9/1/05 9/3/05 9/5/05 9/7/05 9/9/05
DATE
FLO
W (c
fs)
BR AT UT- I D S TATE LI NE BR AT ONEI DA BR AT S ODA
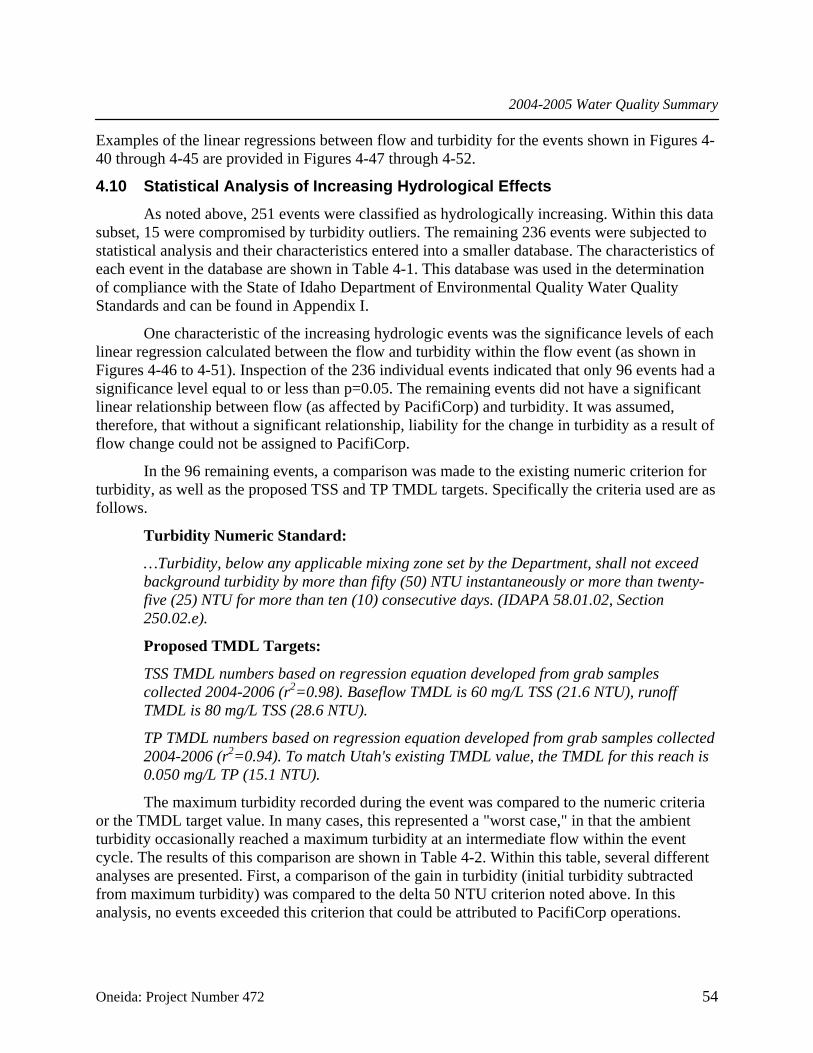
2004-2005 Water Quality Summary
Oneida: Project Number 472 54
Examples of the linear regressions between flow and turbidity for the events shown in Figures 4-40 through 4-45 are provided in Figures 4-47 through 4-52.
4.10 Statistical Analysis of Increasing Hydrological Effects
As noted above, 251 events were classified as hydrologically increasing. Within this data subset, 15 were compromised by turbidity outliers. The remaining 236 events were subjected to statistical analysis and their characteristics entered into a smaller database. The characteristics of each event in the database are shown in Table 4-1. This database was used in the determination of compliance with the State of Idaho Department of Environmental Quality Water Quality Standards and can be found in Appendix I.
One characteristic of the increasing hydrologic events was the significance levels of each linear regression calculated between the flow and turbidity within the flow event (as shown in Figures 4-46 to 4-51). Inspection of the 236 individual events indicated that only 96 events had a significance level equal to or less than p=0.05. The remaining events did not have a significant linear relationship between flow (as affected by PacifiCorp) and turbidity. It was assumed, therefore, that without a significant relationship, liability for the change in turbidity as a result of flow change could not be assigned to PacifiCorp.
In the 96 remaining events, a comparison was made to the existing numeric criterion for turbidity, as well as the proposed TSS and TP TMDL targets. Specifically the criteria used are as follows.
Turbidity Numeric Standard:
…Turbidity, below any applicable mixing zone set by the Department, shall not exceed background turbidity by more than fifty (50) NTU instantaneously or more than twenty-five (25) NTU for more than ten (10) consecutive days. (IDAPA 58.01.02, Section 250.02.e).
Proposed TMDL Targets:
TSS TMDL numbers based on regression equation developed from grab samples collected 2004-2006 (r2=0.98). Baseflow TMDL is 60 mg/L TSS (21.6 NTU), runoff TMDL is 80 mg/L TSS (28.6 NTU).
TP TMDL numbers based on regression equation developed from grab samples collected 2004-2006 (r2=0.94). To match Utah's existing TMDL value, the TMDL for this reach is 0.050 mg/L TP (15.1 NTU).
The maximum turbidity recorded during the event was compared to the numeric criteria or the TMDL target value. In many cases, this represented a "worst case," in that the ambient turbidity occasionally reached a maximum turbidity at an intermediate flow within the event cycle. The results of this comparison are shown in Table 4-2. Within this table, several different analyses are presented. First, a comparison of the gain in turbidity (initial turbidity subtracted from maximum turbidity) was compared to the delta 50 NTU criterion noted above. In this analysis, no events exceeded this criterion that could be attributed to PacifiCorp operations.

2004-2005 Water Quality Summary
Oneida: Project Number 472 55
Figure 4-46. The temporal location of the 236 hydrologically increasing events (increasing flow events) during the study period.
BEAR RIVER WATER QUALITYHydrologically Increasing Events 2004
0
500
1,000
1,500
2,000
2,500
4/23/04 6/12/04 8/1/04 9/20/04 11/9/04 12/29/04 2/17/05
DATE
FLO
W (c
fs)
BR AT UT-ID STATE LINE EVENT
BEAR RIVER WATER QUALITYHydrologically Increasing Events 2005
0
500
1,000
1,500
2,000
2,500
11/9/04 12/29/04 2/17/05 4/8/05 5/28/05 7/17/05 9/5/05 10/25/05 12/14/05
DATE
FLO
W (c
fs)
BR AT UT-ID STATE LINE EVENT

2004-2005 Water Quality Summary
Oneida: Project Number 472 56
Figure 4-47. The temporal (above) and linear regression (below) relationship between flow and turbidity during an Increasing Flow Event (No. 16) in the Bear River during UBR04.
BEAR RIVER WATER QUALITY INCREASING FLOW EVENT 16
0
100
200
300
400
500
600
7/14/04 14:24
7/14/04 16:48
7/14/0419:12
7/14/0421:36
7/15/040:00
7/15/04 2:24
7/15/04 4:48
DATE
FLO
W (c
fs)
0 2 4 6 8 10 12 14 16
TUR
BID
ITY
(ntu
)
Flow at Border Turbidity
BEAR RIVER WATER QUALITY INCREASING FLOW EVENT 16
y = -0.0067x + 16.144R 2 = 0.15
5
9
13
17
100 200 300 400 500 600
FLOW (cfs)
TUR
BID
ITY
(ntu
)

2004-2005 Water Quality Summary
Oneida: Project Number 472 57
Figure 4-48. The temporal (above) and linear regression (below) relationship between flow and turbidity during an Increasing Flow Event (No. 56) in the Bear River in SBF04.
BEAR RIVER WATER QUALITY INCREASING FLOW EVENT 56
0 50
100 150 200 250 300 350 400 450
9/21/04 5:31
9/21/04 6:14
9/21/046:57
9/21/047:40
9/21/048:24
9/21/049:07
9/21/04 9:50
9/21/0410:33
DATE
FLO
W (c
fs)
0 1 2 3 4 5 6 7 8
TUR
BID
ITY
(ntu
)
Flow Turbidity
BEAR RIVER WATER QUALITY INCREASING FLOW EVENT 56
y = 0.0259x - 4.4973R 2 = 0.92
0
1 2
3
4 5
6
7
8
0 100 200 300 400 500
FLOW (cfs)
TUR
BID
ITY
(ntu
)

2004-2005 Water Quality Summary
Oneida: Project Number 472 58
Figure 4-49. The temporal (above) and linear regression (below) relationship between flow and turbidity during an Increasing Flow Event (No. 91) in the Bear River in WBF 2004-2005.
BEAR RIVER WATER QUALITY INCREASING FLOW EVENT 91
0
250
500
750
1000
11/14/04 0:00
11/14/04 2:24
11/14/044:48
11/14/047:12
11/14/049:36
11/14/04 12:00
11/14/04 14:24
DATE
FLO
W (c
fs)
0
40
80
120
160
TUR
BID
ITY
(ntu
)
Flow Turbidity
BEAR RIVER WATER QUALITY INCREASING FLOW EVENT 91
y = 0.1567x - 53.191R 2 = 0.40
0
20
40
60
80
100
120
140
160
0 200 400 600 800 1000
FLOW (cfs)
TUR
BID
ITY
(ntu
)
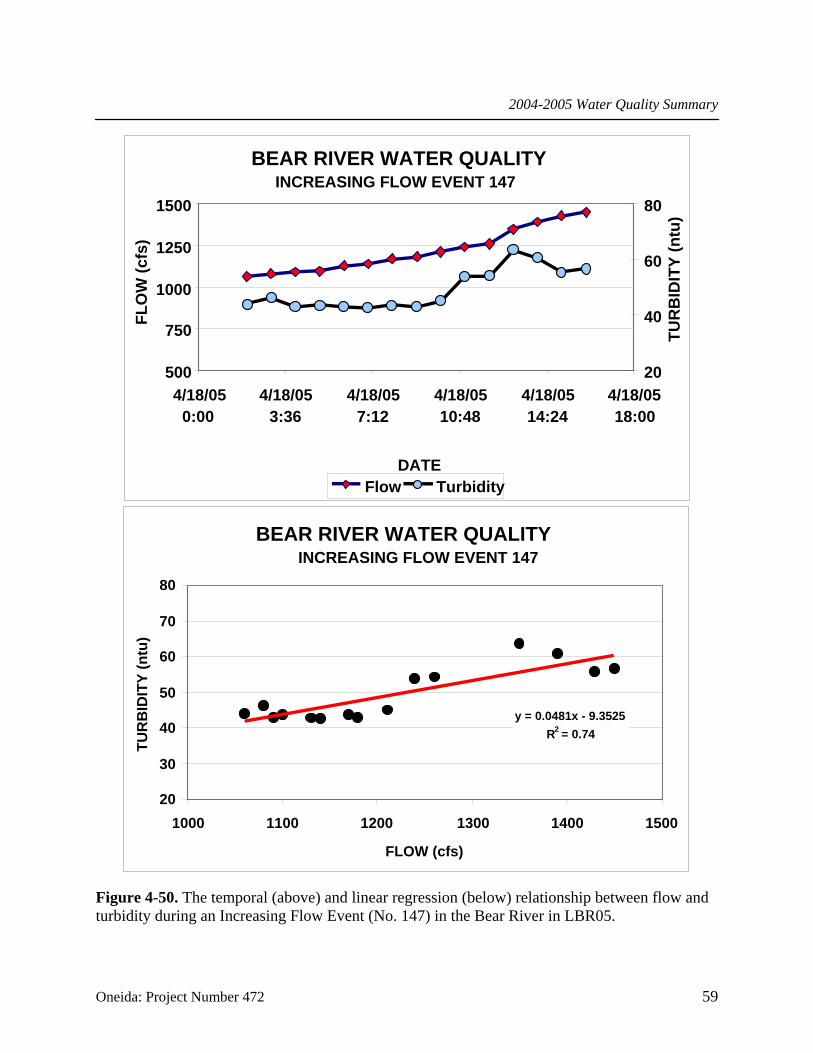
2004-2005 Water Quality Summary
Oneida: Project Number 472 59
Figure 4-50. The temporal (above) and linear regression (below) relationship between flow and turbidity during an Increasing Flow Event (No. 147) in the Bear River in LBR05.
BEAR RIVER WATER QUALITY INCREASING FLOW EVENT 147
500
750
1000
1250
1500
4/18/05 0:00
4/18/05 3:36
4/18/05 7:12
4/18/05 10:48
4/18/05 14:24
4/18/05 18:00
DATE
FLO
W (c
fs)
20
40
60
80
TUR
BID
ITY
(ntu
)
Flow Turbidity
BEAR RIVER WATER QUALITY INCREASING FLOW EVENT 147
y = 0.0481x - 9.3525 R2 = 0.74
20
30
40
50
60
70
80
1000 1100 1200 1300 1400 1500
FLOW (cfs)
TUR
BID
ITY
(ntu
)
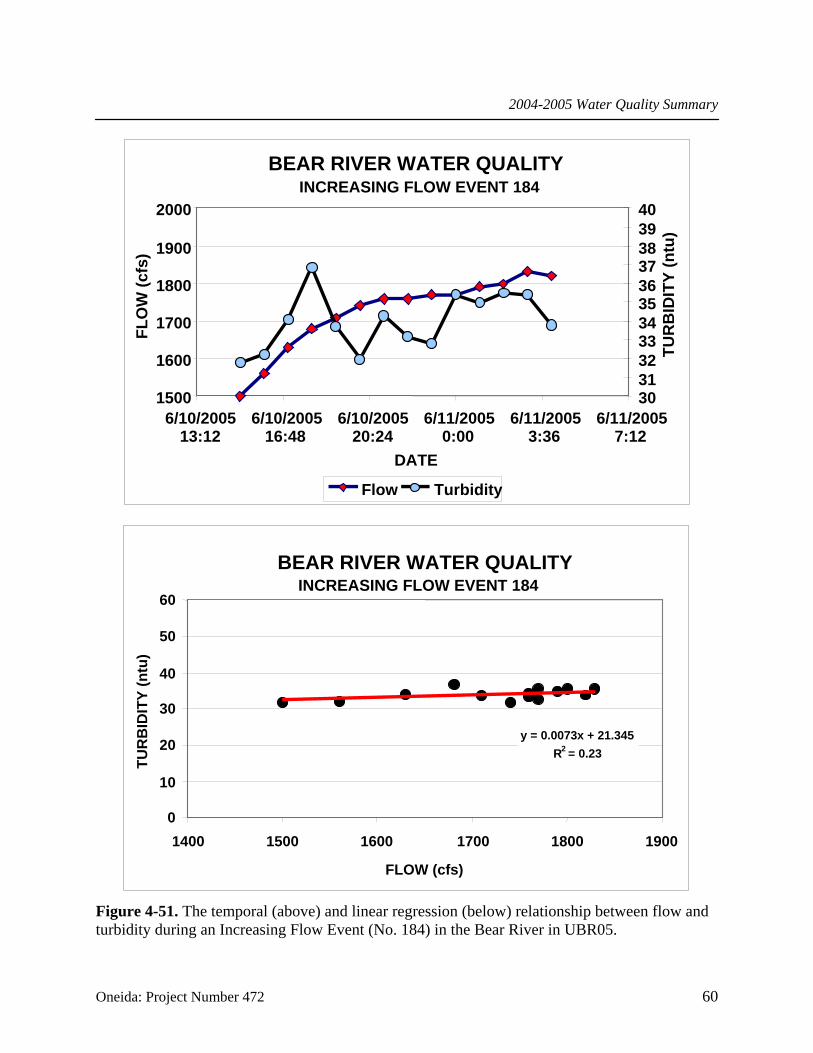
2004-2005 Water Quality Summary
Oneida: Project Number 472 60
Figure 4-51. The temporal (above) and linear regression (below) relationship between flow and turbidity during an Increasing Flow Event (No. 184) in the Bear River in UBR05.
BEAR RIVER WATER QUALITY INCREASING FLOW EVENT 184
1500
1600
1700
1800
1900
2000
6/10/2005 13:12
6/10/2005 16:48
6/10/200520:24
6/11/20050:00
6/11/2005 3:36
6/11/20057:12
DATE
FLO
W (c
fs)
3031323334353637383940
TUR
BID
ITY
(ntu
)
Flow Turbidity
BEAR RIVER WATER QUALITY INCREASING FLOW EVENT 184
y = 0.0073x + 21.345 R2 = 0.23
0
10
20
30
40
50
60
1400 1500 1600 1700 1800 1900
FLOW (cfs)
TUR
BID
ITY
(ntu
)
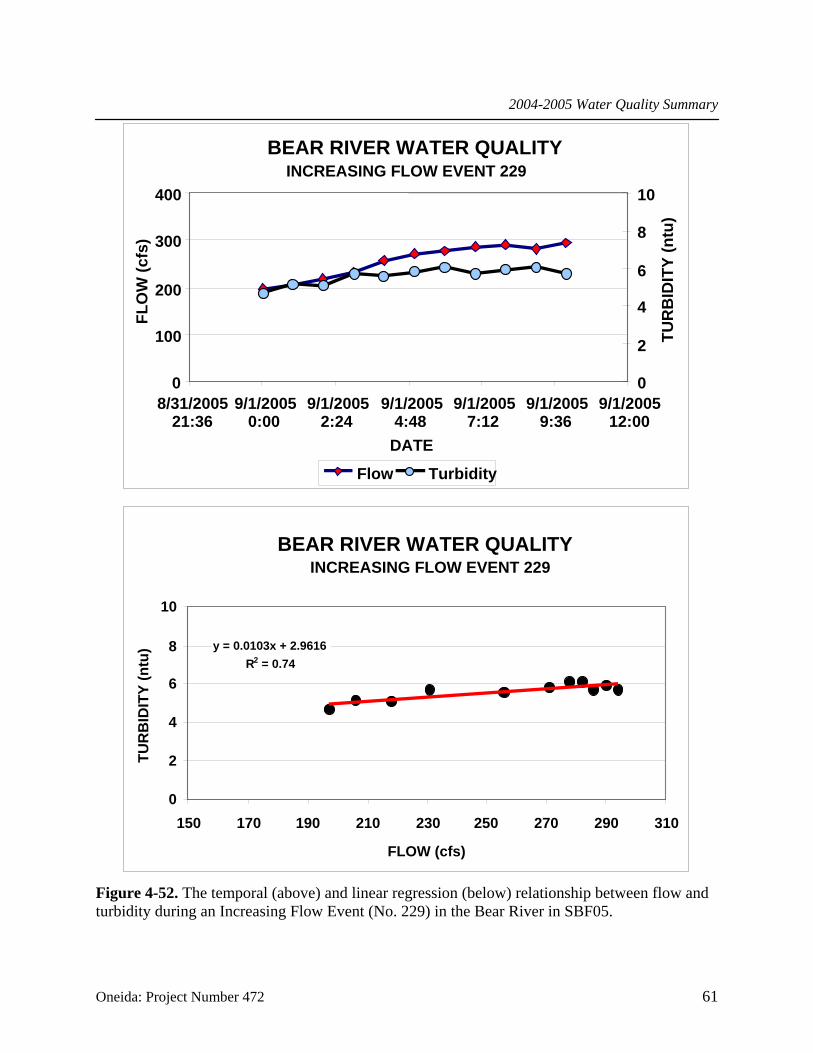
2004-2005 Water Quality Summary
Oneida: Project Number 472 61
Figure 4-52. The temporal (above) and linear regression (below) relationship between flow and turbidity during an Increasing Flow Event (No. 229) in the Bear River in SBF05.
BEAR RIVER WATER QUALITY INCREASING FLOW EVENT 229
0
100
200
300
400
8/31/2005 21:36
9/1/2005 0:00
9/1/20052:24
9/1/20054:48
9/1/20057:12
9/1/2005 9:36
9/1/200512:00
DATE
FLO
W (c
fs)
0
2
4
6
8
10
TUR
BID
ITY
(ntu
)
Flow Turbidity
BEAR RIVER WATER QUALITY INCREASING FLOW EVENT 229
y = 0.0103x + 2.9616 R 2 = 0.74
0
2
4
6
8
10
150 170 190 210 230 250 270 290 310
FLOW (cfs)
TUR
BID
ITY
(ntu
)

2004-2005 Water Quality Summary
Oneida: Project Number 472 62
Table 4-1. Characteristics of the hydrologically increasing event database.
Turbidity Average Change in turbidity Maximum Minimum Standard deviation Count Turbidity at start of event Turbidity at end of event
Stage and Flow at UT-ID border Change in stage Maximum stage Minimum stage Change in flow Maximum flow Minimum flow
Flow at Oneida Change in flow Maximum flow Minimum flow
Flow at Soda Change in flow Maximum flow Minimum flow
Analysis Characteristics Regression X-coefficient Regression Constant Regression r2 ANOVA Significance
Miscellaneous Characteristics Number of Hours Included Hydrologic Time Period Rain Event or Outlier tag

2004-2005 Water Quality Summary
Oneida: Project Number 472 63
Table 4-2. Percent exceedence of IDEQ's current numeric criterion for turbidity and proposed TSS and TP TMDL targets (calculated from turbidity data) in database events categorized as hydrologically-increasing and statistically significant at the 0.05 level. Exceedence was based on whether the maximum turbidity recorded in the event exceeded criteria.
Storm-related Operations-related TOTAL
% N % N % N
IDEQ Turbidity Criterion a 3.8 9 0 0 3.8 9
Non-exceedence events that subsequently exceeded criteria (turbstart < criterion)
TSS TMDL (Baseflow) b 0.4 1 0.8 2 1.3 3
TSS TMDL (Runoff) b 1.7 4 2.1 5 3.8 9
TP TMDL c 2.1 5 4.2 (2.5) 10 6.4 15
Events already in exceedence (turbstart > criterion)
TSS TMDL (Baseflow) b 0.4 1 0.4 1 0.8 2
TSS TMDL (Runoff) b 5.5 13 6.4 15 11.9 28
TP TMDL c 7.6 18 11.0 (5.5) 26 18.6 44
All exceedence events
TSS TMDL (Baseflow) b 0.8 2 1.3 3 2.1 5
TSS TMDL (Runoff) b 7.2 17 8.5 20 15.7 37
TP TMDL c 9.7 23 15.3 (8.1) 36 25.0 59 a Turbidity, below any applicable mixing zone set by the Department, shall not exceed background turbidity by more than fifty (50) NTU instantaneously or more than twenty-five (25) NTU for more than ten (10) consecutive days. (IDAPA 58.01.02, Section 250.02.e). b TSS TMDL numbers based on regression equation developed from grab samples collected 2004-2006 (r2=0.98). Baseflow TMDL is 60 mg/L TSS (21.6 NTU), runoff TMDL is 80 mg/L TSS (28.6 NTU). c TP TMDL numbers based on regression equation developed from grab samples collected 2004-2006 (r2=0.94). To match Utah's existing TMDL value, the TMDL for this reach is 0.050 mg/L TP (15.1 NTU). The number in parentheses is the percent attributed to PacifiCorp if the TMDL was 0.075 mg/L TP (22.7 NTU), in accordance with EPA guidelines and waters without receiving bodies.

2004-2005 Water Quality Summary
Oneida: Project Number 472 64
However, the analysis indicated that nine events (3.8%) related to storms did exceed this criterion.
In the comparison to the proposed TSS and TP TMDL target concentrations, two separate comparisons were made. The first comparison was the environmental condition where the initial turbidity was less than the target concentration, but the maximum turbidity during the event exceeded the target level. Under these conditions, storms accounted for five events exceeding the TSS target and PacifiCorp operations accounted for seven exceedence events. For the TP TMDL target (the most stringent of the two targets), storms accounted for five events and PacifiCorp accounted for 10 events (4.2% of the total increasing flow observations or 1.3% of all event observations).
The second comparison was for those increasing flow events where the starting turbidity was already in excess of the TMDL target. In this comparison, storms accounted for 14 events which added total suspended solids to the river already in excess of the target TSS level. PacifiCorp operations accounted for 16 events in this category. In a similar manner, the TP TMDL target had 18 events starting in excess but added to by storms and PacifiCorp had 26 events which added total phosphorous to the water via flow increases.
Further inspection of the “storm-related” category is warranted as it is believed these values are compromised due to external factors and should be treated as separate from PacifiCorp operations. In Appendix I, a summary has been provided which describes the Increasing Flow Event number and the environmental conditions (flow, start turbidity, etc) associated it. Appendix II is a table which expands the storm-influenced events to the hourly data associated within. In the storm-influenced category, 25 events had significant relationships with turbidity and flow. Of these 25 events, 19 were found to exceed the TSS TMDL criteria, either starting below or over the criteria. Inclusive in these 19 events were the 9 instantaneous delta 50 NTU criteria exceedences. A plot of the turbidity/flow relationships for three separate categories is provided in Figure 4-53 to Figure 4-55.
In Figure 4-53, hourly data for all significant (p=0.05) regression relationships are plotted as flow vs. turbidity. For the entire data set (all 96 events), the statistical relationship between the two parameters had a coefficient of variation of only 0.20. This indicates that when the entire data sets are combined, flow only explains 20 percent of the variation in turbidity. Inspection of Figure 4-54 shows that the relationship of storm-influenced events (flow vs. turbidity) had a coefficient of variation of 0.14, while the relationship of all significant events that were not storm-influenced had the highest coefficient of variation (0.40). This analysis indicates that removal of storm-influenced events results in a better relationship between flow and turbidity in the Bear River at the UT-ID border station."
In Table 4-3, a detailed summary of the individual events that had statistically significant relationships between flow and turbidity but were removed from the analysis of operational effects is shown. As can be seen from this summary, tagged events occurred in all hydrological time periods, with some resulting in exceedences of state criteria or standards. These events are not considered in the analysis because of the uncertainty of the influence of the storms to the ambient turbidity.

2004-2005 Water Quality Summary
Oneida: Project Number 472 65
Figure 4-53. The hourly data for all significant increasing flow events comparing flow and turbidity in the Bear River at the Idaho-Utah state border.
BEAR RIVER WATER QUALITY STUDYFlow vs. Turbidity for All Significant Increasing Flow Events
y = 0.0445x + 2.1169R2 = 0.2015
0
50
100
150
200
250
300
350
400
450
500
550
0 500 1000 1500 2000 2500
Flow (cfs)
Turb
idity
(ntu
)
All Significant Events Linear (All Significant Events)

2004-2005 Water Quality Summary
Oneida: Project Number 472 66
Figure 4-54. The hourly data for all significantly increasing flow events comparing flow and turbidity at the Idaho-Utah state border for just outlier and storm-influenced events.
BEAR RIVER WATER QUALITY STUDYFlow vs Turbidity for Significantly Increasing Flow Events
Influenced by Storms
y = 0.0752x + 33.859R2 = 0.14
050
100150200250300350400450500550
0 250 500 750 1000 1250 1500 1750 2000 2250 2500
Flow (cfs)
Turb
idity
(Ntu
)
50 NTU exceedence Linear (50 NTU exceedence)

2004-2005 Water Quality Summary
Oneida: Project Number 472 67
Figure 4-55. The hourly data for all significantly increasing flow events comparing flow and turbidity at the Idaho-Utah state border after removing outlier and storm-influenced events.
BEAR RIVER WATER QUALITY STUDYFlow vs Turbidity for All Significant Increasing Flow Events
y = 0.0258x + 3.6985R2 = 0.40
0
50
100
150
200
250
300
350
400
450
500
550
0 500 1000 1500 2000 2500
Flow (cfs)
Turb
idity
(ntu
)
All Significant Events Linear (All Significant Events)

2004-2005 Water Quality Summary
Oneida: Project Number 472 68
Table 4-3. The details of the storm-influenced events that had significant relationships between flow and turbidity. These tagged events were removed from further analysis relative to operational effects due to PacifiCorp. Hourly data for these events are included in Appendix II.
Turbidity (NTU)
Event ID
Hours
Average Delta Change
Starting Ending
Flow
Change
Hydro Period
Precip
(1/100in)
R2
ANOVA
SIG
1 17 15 7.8 13.5 19.5 44 UBR 2 0.356 0.009
2 29 49 106 16 104 689 UBR 69 0.926 0
3 24 59 133 23 152 698 UBR 152 0.963 0
14 79 18 39.3 15.6 25.2 215 UBR 33 0.198 0
32 38 7 16 12.6 8.3 395 SBF 2.05 0.179 0.007
81 11 10 11.8 5.5 17.3 87 SBF 204 0.794 0
134 15 119 196.3 86.4 278.3 97 LBR 12 0.809 0
136 5 363 237.2 275.6 512.8 140 LBR 11 0.906 0.003
137 20 233 371.3 120.8 490.2 177 LBR 52 0.848 0
139 11 85 84.9 50.9 133.9 290 LBR 76 0.905 0
145 11 58 27 71.5 44.5 350 LBR 9 0.835 0
149 32 64 88.2 33.9 90.5 523 LBR 108 0.75 0
155 14 133 164.6 47.5 211.2 820 LBR 155 0.879 0
162 6 62 13.9 68.4 54.5 210 UBR 39 0.823 0.005
165 14 117 67.4 140.4 99.6 660 UBR 60 0.698 0
166 6 110 39.8 130.6 90.8 170 UBR 17 0.959 0
179 6 35 4.4 33.6 36.4 60 UBR 31 0.809 0.006
181 6 25 16.4 18.4 34.8 240 UBR 25 0.898 0.001
182 4 47 8 51.3 44.9 110 UBR 68 0.931 0.008
183 6 39 13.6 33.3 40 90 UBR 17 0.614 0.037
224 11 14 9.1 10.6 19.7 230 SBF 5 0.818 0
225 34 21 8.1 22.4 24.8 198 SBF 5 0.592 0.002
237 7 6 3.7 4.2 7.8 157 SBF 15 0.937 0
243 7 6 4.3 4 7.1 134 SBF 29 0.698 0.01
248 16 22 27.6 5.6 26.1 308 SBF 15 0.888 0

2004-2005 Water Quality Summary
Oneida: Project Number 472 69
5.0 DISCUSSION This report has described the existing water quality conditions encountered at the 3600 South Street Bridge and placed the current water quality data collected into an historical perspective. The water quality conditions encountered during 2004 and 2005 fit into this historical framework. In 2004, flows in the Bear River were low when compared to historical watershed yields. This low flow resulted in water quality conditions similar to other low water years. In a similar manner, 2005, a much wetter year, reflected historical data from wetter years.
Comparisons between various gaging stations allowed the dissection of PacifiCorp operations at the Oneida facility when compared to background conditions. Further refining of hydrology into “events” where micro flow changes had occurred allowed an analysis of just increasing flow events associated with a ramping operations. Within this data set, only a fraction of the events had direct links between a change in flow (PacifiCorp operational effect) and a change in turbidity. Of that subset, no events exceeded the numeric state standard and only a few contributed to an exceedence of the proposed TMDL targets for total suspended solids and total phosphorus.
The general observation has been that historical ramping at the Oneida Hydroelectric Project has resulted in increased total suspended solids within the Bear River due to the destabilization of stream banks. In order to further investigate the possible mechanism of turbidity increases associated with increasing flow events, we used the database developed for this investigation to develop a predictive empirical model. Using a multiple regression approach, the following regression equation was built which predicts the final turbidity concentration at the 3600 South Bridge site.
Final Event Turbidity = 15.93+1.01*(Turbidity at Event Start)
+ 0.032*(Event Flow Change at Border)
- 1.716*(Maximum Event Stage at Border)
- 0.033*(Number of Event Hours)
This statistical relationship had a coefficient of variation (r2) of 0.93. It is interesting to note that both maximum event stage and event duration had negative regression coefficients indicating that the higher the maximum stage and the longer the event, the lower the final turbidity (assuming the two other variables are the same).
6.0 REFERENCES Barker, K.W., D.L. Sorensen, J.C. Anderson, J.M. Ihnat. 1989. Bear River Water Quality: Bioavailable Phosphorus Measurement, Sources and Control. UWRL, Utah State University, Logan, Utah.
Clyde, C.G. 1953. Sediment Movement in Bear River, Utah. A Thesis Submitted to the Civil Engineering Department, Utah State University. Logan, Utah.

2004-2005 Water Quality Summary
Oneida: Project Number 472 70
Ecosystems Research Institute. 1991. Water Quality Investigations: Lower Bear River. Prepared for Utah Department of Natural Resources, Division of Water Resources, and Utah Department of Environmental Quality, Division of Water Quality. Logan, Utah
Ecosystems Research Institute. 1998. Water Quality Study for the Bear River in Idaho. Logan, Utah.
Haws, F.W. and T.C. Hughes. 1973. Hydrologic Inventory of the Bear River Study Unit. UWRL, Utah State University, Logan, Utah.
Heimer, J.T. 1978. Turbidity concentrations and suspended sediment discharge in streams in southeastern Utah. Idaho Department of Fish and Game, Region 5.
Hill, R.W., E.K. Israelsen, and P.J. Riley. 1973. Computer Simulation of the hydrologic and salinity flow systems within the Bear River basin. Research Project Technical Completion Report. OWRT. Utah State University. Logan, Utah.
Mackenthun, K. M. 1973. Toward a cleaner environment. U. S. Environmental Protection Agency, Washington, D. C.
Perry, J. 1978. Water Quality Status Report. Bear River (Wyoming Border to the Utah Border). Idaho department of Health and Welfare, Division of Environment. Pocatello, Idaho.
Sorensen, D.L., C.W. Ariss, P. Ludrigsen, S.Eberl, W.J. Greeney, V.D. Adams. 1984. Water Quality Management Studies for Water Resources Development in the Bear River Basin: Second Progress Report. Utah Water Research Laboratory, Utah State University, Logan, Utah.
Sorensen, D.L., C. Caupp, W.J. Grenney. S Eberl, J.J. Messer, P. Ludrigsen, C.W. Ariss. 1986. Water Quality Management Studies of water Resources Development in the Bear River Basin. Utah Water Research Laboratory, Utah State University. Logan, Utah.
Waddell, K.M. 1970. Quality of Surface Water in the Bear River Basin, Utah, Wyoming and Idaho. Utah Basic Data Release No. 18. U.S. Geological Survey in Cooperation with the Utah Division of Water Rights.
APPENDIX I. Hydrologically Increasing Events Dataset

EVENT ID Hours TurbAvg TurbChangeTurbMax TurbMin TurbSTD TurbN TurbStart TurbEnd BorderStageChange
Borderflowchange
Oneidaflowchange
Sodaflowchange
HydroPeriod
Code MaxOfBorderStage
MinOfBorderStage
MaxOfBorderFlow
MinOfBorderFlow
MaxOfSodaFlow
MinOfSodaFlow
MaxOfOneidaFlow
MinOfOneidaFlow
X-coeff Constant R2 Anova Sig
1 17 14.6 7.8 19.5 11.7 2.3 18.0 13.5 19.5 0.4 44.0 2.0 6.0 UBR 1.0 8.6 8.2 82.0 38.0 221.0 215.0 130.0 128.0 0.1 8.2 0.4 0.02 29 49.2 106.0 122.0 16.0 35.2 30.0 16.0 104.0 1.9 689.0 628.0 960.0 UBR 1.0 11.3 9.5 1000.0 311.0 1096.0 136.0 1271.0 643.0 0.2 -52.5 0.9 0.03 24 58.9 133.0 152.0 19.0 40.7 25.0 23.0 152.0 1.9 698.0 1118.0 6.0 UBR 1.0 11.4 9.5 1040.0 342.0 398.0 392.0 1456.0 338.0 0.2 -57.6 1.0 0.04 16 23.8 11.0 31.0 20.0 3.3 17.0 20.0 28.0 0.6 220.0 147.0 63.0 UBR 10.7 10.1 757.0 537.0 392.0 329.0 592.0 445.0 0.0 0.3 0.8 0.05 9 12.4 2.7 13.5 10.8 0.9 10.0 11.5 10.8 0.3 83.0 64.0 11.0 UBR 9.4 9.1 260.0 177.0 347.0 336.0 260.0 196.0 0.0 13.7 0.0 0.66 24 10.5 6.6 14.2 7.6 1.5 24.0 12.7 11.3 0.5 90.0 67.0 0.0 UBR 9.0 8.5 156.0 66.0 341.0 341.0 334.0 267.0 0.0 10.4 0.0 1.07 19 17.0 14.9 27.1 12.2 3.7 19.0 22.8 18.6 1.1 311.0 23.0 38.0 UBR 9.6 8.5 375.0 64.0 807.0 769.0 604.0 581.0 0.0 24.0 0.5 0.08 17 29.5 22.3 36.8 14.5 7.6 18.0 14.7 35.2 0.9 323.0 151.0 238.0 UBR 10.0 9.1 497.0 174.0 945.0 707.0 632.0 481.0 0.1 5.1 0.8 0.09 7 33.7 18.3 45.2 26.9 7.1 8.0 29.1 45.2 0.8 292.0 1.0 10.0 UBR 10.3 9.6 620.0 328.0 999.0 989.0 899.0 898.0 0.1 5.4 0.9 0.010 30 32.7 15.1 40.1 25.0 3.7 31.0 34.8 36.0 0.2 60.0 113.0 10.0 UBR 10.3 10.2 617.0 557.0 987.0 977.0 909.0 796.0 0.0 11.7 0.0 0.411 41 27.1 10.1 31.4 21.3 2.6 31.0 31.3 29.2 0.1 46.0 6.0 18.0 UBR 10.3 10.2 624.0 578.0 985.0 967.0 903.0 897.0 -0.1 68.4 0.1 0.112 15 24.8 8.3 30.5 22.2 2.2 16.0 22.9 24.4 0.2 63.0 1.0 10.0 UBR 10.4 10.3 658.0 595.0 971.0 961.0 902.0 901.0 0.0 43.6 0.1 0.313 13 22.3 7.2 25.2 18.0 2.0 14.0 24.4 18.0 0.1 37.0 158.0 194.0 UBR 10.4 10.3 661.0 624.0 959.0 765.0 900.0 742.0 -0.1 68.5 0.2 0.114 79 18.5 39.3 52.4 13.1 5.7 80.0 15.6 25.2 0.6 215.0 247.0 127.0 UBR 1.0 10.4 9.8 631.0 416.0 967.0 840.0 902.0 655.0 0.0 -1.2 0.2 0.015 29 17.1 5.9 20.3 14.4 1.5 30.0 14.4 18.9 0.6 228.0 157.0 62.0 UBR 10.5 9.9 692.0 464.0 868.0 806.0 956.0 799.0 0.0 10.8 0.1 0.116 10 13.4 3.5 15.2 11.7 1.3 11.0 14.1 11.7 0.6 241.0 6.0 18.0 UBR 10.0 9.4 497.0 256.0 856.0 838.0 772.0 766.0 0.0 16.1 0.2 0.217 9 10.9 2.9 12.4 9.5 0.8 10.0 9.5 11.3 0.5 210.0 0.0 7.0 UBR 10.1 9.6 547.0 337.0 903.0 896.0 798.0 798.0 0.0 7.1 0.5 0.018 4 12.1 6.1 15.3 9.2 2.8 5.0 9.2 15.3 0.1 26.0 0.0 0.0 UBR 10.0 10.0 505.0 479.0 901.0 901.0 701.0 701.0 0.2 -100.4 0.6 0.119 6 7.2 1.5 7.6 6.1 0.5 7.0 7.6 7.5 0.2 65.0 5.0 8.0 UBR 10.2 10.0 547.0 482.0 895.0 887.0 701.0 696.0 0.0 18.0 0.6 0.020 7 7.2 2.4 8.3 5.9 0.8 8.0 7.4 8.2 0.2 79.0 16.0 8.0 UBR 10.2 10.0 550.0 471.0 900.0 892.0 717.0 701.0 0.0 3.4 0.1 0.621 5 7.0 1.3 7.8 6.5 0.5 6.0 6.5 6.7 0.2 79.0 0.0 8.0 UBR 10.3 10.1 606.0 527.0 908.0 900.0 763.0 763.0 0.0 5.4 0.0 0.722 15 6.1 1.7 6.8 5.1 0.5 16.0 5.7 5.3 0.2 82.0 5.0 11.0 UBR 10.2 10.0 553.0 471.0 711.0 700.0 733.0 728.0 0.0 12.8 0.3 0.023 11 1.1 1.4 2.1 0.7 0.4 12.0 1.4 1.2 0.3 94.0 0.0 15.0 UBR 10.1 9.9 540.0 446.0 825.0 810.0 774.0 774.0 0.0 4.3 0.2 0.124 4 1.2 0.2 1.3 1.1 0.1 5.0 1.2 1.3 0.0 17.0 0.0 4.0 UBR 10.2 10.1 547.0 530.0 798.0 794.0 774.0 774.0 0.0 -2.7 0.3 0.425 10 1.5 2.9 3.9 1.0 0.8 11.0 1.1 3.9 0.0 10.0 0.0 8.0 UBR 10.2 10.1 547.0 537.0 802.0 794.0 774.0 774.0 0.0 21.4 0.0 0.626 8 0.3 0.5 0.5 0.0 0.1 9.0 0.0 0.4 0.2 73.0 80.0 12.0 SBF 10.1 9.9 512.0 439.0 805.0 793.0 724.0 644.0 0.0 -1.3 0.3 0.127 9 0.8 1.1 1.4 0.3 0.4 10.0 0.3 1.1 0.1 41.0 1.0 4.0 SBF 10.1 10.0 523.0 482.0 801.0 797.0 750.0 749.0 0.0 -8.9 0.5 0.028 9 1.4 1.0 1.9 0.9 0.3 10.0 0.9 1.2 0.2 73.0 5.0 0.0 SBF 10.2 10.0 537.0 464.0 785.0 785.0 781.0 776.0 0.0 0.9 0.0 0.829 10 3.2 6.2 7.2 1.0 2.1 11.0 2.2 1.2 0.3 106.0 40.0 8.0 SBF 10.3 10.0 599.0 493.0 687.0 679.0 730.0 690.0 0.0 20.8 0.5 0.030 22 22.4 9.4 28.0 18.6 2.4 23.0 23.8 28.0 0.2 56.0 0.0 7.0 SBF 10.1 10.0 516.0 460.0 660.0 653.0 583.0 583.0 0.0 17.4 0.0 0.831 12 18.7 12.8 24.9 12.1 4.4 13.0 24.9 12.1 0.1 37.0 0.0 3.0 SBF 10.1 10.0 501.0 464.0 623.0 620.0 575.0 575.0 -0.4 188.5 0.8 0.032 38 7.2 16.0 18.9 2.9 3.6 39.0 12.6 8.3 0.9 395.0 301.0 97.0 SBF 1.0 10.9 10.0 866.0 471.0 737.0 640.0 896.0 595.0 0.0 17.4 0.2 0.033 7 5.2 2.5 6.5 4.0 0.9 8.0 5.7 4.2 0.3 124.0 154.0 8.0 SBF 10.5 10.3 684.0 560.0 644.0 636.0 763.0 609.0 0.0 15.2 0.7 0.034 5 15.2 8.4 18.9 10.5 2.9 6.0 16.5 14.0 0.3 110.0 0.0 0.0 SBF 1.0 10.5 10.2 650.0 540.0 438.0 438.0 605.0 605.0 0.0 -1.7 0.2 0.335 9 5.1 2.9 6.6 3.7 1.0 10.0 3.9 6.6 0.1 36.0 0.0 9.0 SBF 9.5 9.4 278.0 242.0 408.0 399.0 250.0 250.0 0.1 -13.1 0.8 0.036 8 12.5 8.9 15.7 6.8 3.8 8.0 6.8 14.5 1.2 458.0 4.0 5.0 SBF 10.6 9.4 707.0 249.0 284.0 279.0 474.0 470.0 0.0 0.8 0.9 0.037 5 4.8 1.7 5.7 4.0 0.6 6.0 4.3 5.7 0.3 136.0 3.0 0.0 SBF 9.8 9.5 399.0 263.0 244.0 244.0 400.0 397.0 0.0 3.1 0.2 0.438 6 4.2 0.7 4.6 3.9 0.2 7.0 4.2 4.2 0.0 17.0 60.0 36.0 SBF 9.6 9.5 307.0 290.0 223.0 187.0 288.0 228.0 0.0 7.2 0.1 0.639 12 4.8 0.8 5.1 4.3 0.2 13.0 4.7 5.1 0.1 29.0 0.0 0.0 SBF 9.5 9.4 278.0 249.0 185.0 185.0 228.0 228.0 0.0 1.4 0.2 0.140 10 17.0 9.0 22.2 13.2 3.3 11.0 13.6 16.7 0.1 45.0 0.0 9.0 SBF 9.5 9.3 260.0 215.0 184.0 175.0 233.0 233.0 0.1 -10.9 0.3 0.141 9 28.5 17.3 36.8 19.5 6.0 10.0 19.5 35.8 0.1 42.0 22.0 15.0 SBF 2.0 9.5 9.3 260.0 218.0 176.0 161.0 229.0 207.0 0.3 -42.5 0.5 0.042 15 52.0 85.4 98.7 13.3 25.2 15.0 98.7 22.0 0.2 78.0 19.0 0.0 SBF 2.0 9.5 9.3 278.0 200.0 46.0 46.0 248.0 229.0 -0.1 75.6 0.0 0.743 7 34.0 56.5 78.3 21.8 18.6 8.0 22.8 29.2 0.1 44.0 0.0 0.0 SBF 2.0 9.5 9.4 275.0 231.0 46.0 46.0 208.0 208.0 0.1 19.7 0.0 0.944 11 45.4 105.5 115.1 9.6 34.9 12.0 37.2 14.4 0.2 67.0 23.0 0.0 SBF 2.0 9.4 9.2 249.0 182.0 46.0 46.0 208.0 185.0 -0.4 142.8 0.1 0.345 8 78.1 131.6 177.3 45.7 48.7 8.0 177.3 129.2 0.1 40.0 3.0 0.0 SBF 2.0 9.4 9.2 228.0 188.0 46.0 46.0 167.0 164.0 -1.6 420.8 0.2 0.246 8 114.7 45.8 145.2 99.4 16.8 6.0 121.1 113.5 0.2 47.0 0.0 0.0 SBF 2.0 9.3 9.1 203.0 156.0 46.0 46.0 31.0 31.0 0.1 105.2 0.0 0.947 6 145.5 151.5 210.3 58.8 63.1 4.0 210.3 58.8 0.9 242.0 2.0 0.0 SBF 2.0 9.6 8.7 315.0 73.0 46.0 46.0 105.0 103.0 -0.5 228.4 0.7 0.148 7 49.1 173.3 174.0 0.7 76.3 6.0 174.0 0.9 0.0 8.0 287.0 0.0 SBF 2.0 9.0 9.0 139.0 131.0 46.0 46.0 394.0 107.0 -22.0 3076.7 0.9 0.049 11 5.4 12.5 13.9 1.4 4.1 12.0 1.7 8.3 0.8 217.0 71.0 0.0 SBF 9.6 8.8 320.0 103.0 46.0 46.0 187.0 116.0 0.0 1.9 0.1 0.350 10 7.0 28.0 29.4 1.4 9.5 11.0 2.4 21.1 0.3 83.0 22.0 12.0 SBF 2.0 9.3 9.0 209.0 126.0 172.0 160.0 182.0 160.0 0.0 0.5 0.0 0.151 11 6.2 13.5 15.2 1.7 4.8 10.0 2.1 6.2 0.2 49.0 38.0 7.0 SBF 9.3 9.1 203.0 154.0 167.0 160.0 160.0 122.0 0.0 9.6 0.0 0.852 13 13.0 36.3 40.5 4.2 12.6 9.0 9.2 4.2 0.1 24.0 2.0 114.0 SBF 2.0 9.1 9.0 166.0 142.0 160.0 46.0 124.0 122.0 0.7 -90.9 0.2 0.253 20 39.1 122.3 133.1 10.8 37.2 17.0 114.6 11.2 0.3 62.0 47.0 119.0 SBF 2.0 9.1 8.9 169.0 107.0 165.0 46.0 190.0 143.0 0.0 35.2 0.0 0.9

EVENT ID Hours TurbAvg TurbChangeTurbMax TurbMin TurbSTD TurbN TurbStart TurbEnd BorderStageChange
Borderflowchange
Oneidaflowchange
Sodaflowchange
HydroPeriod
Code MaxOfBorderStage
MinOfBorderStage
MaxOfBorderFlow
MinOfBorderFlow
MaxOfSodaFlow
MinOfSodaFlow
MaxOfOneidaFlow
MinOfOneidaFlow
X-coeff Constant R2 Anova Sig
54 13 15.0 71.0 74.4 3.4 19.4 12.0 7.9 18.6 0.4 114.0 37.0 0.0 SBF 1.0 9.4 9.0 249.0 135.0 165.0 165.0 187.0 150.0 0.2 -23.4 0.2 0.155 8 11.1 53.3 55.1 1.8 18.7 8.0 18.4 1.9 0.1 36.0 149.0 2.0 SBF 2.0 9.4 9.3 242.0 206.0 165.0 163.0 390.0 241.0 -0.7 163.9 0.3 0.256 6 4.6 4.9 6.9 2.0 1.8 7.0 2.0 5.6 0.4 160.0 22.0 4.0 SBF 9.8 9.4 412.0 252.0 167.0 163.0 276.0 254.0 0.0 -4.5 0.9 0.057 15 2.5 3.1 4.8 1.7 0.9 16.0 2.5 1.7 0.2 75.0 40.0 0.0 SBF 9.4 9.2 249.0 174.0 161.0 161.0 276.0 236.0 0.0 4.9 0.1 0.258 5 2.4 0.3 2.6 2.3 0.1 6.0 2.4 2.3 0.1 33.0 95.0 0.0 SBF 9.5 9.4 275.0 242.0 161.0 161.0 308.0 213.0 0.0 2.1 0.0 0.859 3 2.6 0.1 2.6 2.5 0.1 4.0 2.6 2.6 0.2 62.0 3.0 0.0 SBF 9.5 9.4 307.0 245.0 161.0 161.0 213.0 210.0 0.0 2.7 0.1 0.660 9 2.9 0.6 3.1 2.5 0.2 10.0 2.5 2.8 0.2 50.0 0.0 0.0 SBF 9.4 9.3 256.0 206.0 161.0 161.0 233.0 233.0 0.0 2.0 0.1 0.361 14 3.9 3.9 5.9 2.0 1.3 14.0 3.7 2.1 0.3 61.0 3.0 1.0 SBF 9.3 9.0 203.0 142.0 161.0 160.0 190.0 187.0 0.0 8.3 0.2 0.162 6 3.4 3.6 6.0 2.4 1.2 7.0 2.8 2.6 0.1 18.0 0.0 1.0 SBF 9.3 9.2 206.0 188.0 161.0 160.0 185.0 185.0 0.0 -4.5 0.0 0.663 6 4.8 1.4 5.7 4.3 0.5 7.0 4.5 5.7 0.1 20.0 0.0 1.0 SBF 9.2 9.2 197.0 177.0 161.0 160.0 172.0 172.0 0.0 2.3 0.1 0.664 32 11.4 14.2 21.4 7.2 3.2 33.0 9.0 21.4 0.1 43.0 26.0 114.0 SBF 9.3 9.2 231.0 188.0 160.0 46.0 208.0 182.0 0.1 -1.1 0.1 0.165 7 27.5 27.5 44.8 17.3 9.1 8.0 17.3 36.3 0.3 109.0 2.0 0.0 SBF 2.0 9.5 9.2 303.0 194.0 46.0 46.0 259.0 257.0 0.2 -11.3 0.5 0.067 2 1.6 1.0 2.2 1.2 0.6 3.0 2.2 1.2 0.1 53.0 0.0 0.0 SBF 9.8 9.6 409.0 356.0 46.0 46.0 259.0 259.0 0.0 9.2 1.0 0.171 13 0.8 1.7 1.8 0.1 0.5 12.0 0.1 1.2 0.5 182.0 118.0 0.0 SBF 9.7 9.2 370.0 188.0 46.0 46.0 318.0 200.0 0.0 -0.8 0.6 0.072 2 1.7 0.9 2.1 1.2 0.5 3.0 1.2 1.8 0.0 3.0 0.0 0.0 SBF 1.0 9.3 9.3 231.0 228.0 46.0 46.0 175.0 175.0 0.2 -44.1 0.6 0.573 13 2.8 1.7 3.8 2.1 0.5 14.0 2.4 3.5 0.5 176.0 90.0 0.0 SBF 9.7 9.2 370.0 194.0 46.0 46.0 314.0 224.0 0.0 1.3 0.5 0.074 4 3.1 0.3 3.2 2.9 0.2 5.0 2.9 3.2 0.1 32.0 91.0 0.0 SBF 9.3 9.2 235.0 203.0 46.0 46.0 311.0 220.0 0.0 1.8 0.2 0.475 4 3.2 0.3 3.4 3.1 0.1 5.0 3.4 3.2 0.2 68.0 5.0 0.0 SBF 9.6 9.4 320.0 252.0 46.0 46.0 220.0 215.0 0.0 3.8 0.2 0.476 4 3.2 0.3 3.4 3.1 0.1 5.0 3.1 3.3 0.1 26.0 3.0 0.0 SBF 9.5 9.4 278.0 252.0 46.0 46.0 150.0 147.0 0.0 0.4 0.7 0.177 9 3.8 2.3 5.4 3.1 0.7 10.0 3.9 3.6 0.1 34.0 109.0 0.0 SBF 9.2 9.1 203.0 169.0 46.0 46.0 249.0 140.0 0.0 4.5 0.0 0.978 9 5.4 2.8 6.7 3.9 0.9 10.0 3.9 5.7 0.3 149.0 3.0 0.0 SBF 9.8 9.4 416.0 267.0 46.0 46.0 301.0 298.0 0.0 1.4 0.4 0.179 8 2.9 0.6 3.2 2.6 0.2 9.0 2.9 3.0 0.2 81.0 2.0 0.0 SBF 1.0 9.6 9.4 333.0 252.0 46.0 46.0 233.0 231.0 0.0 2.4 0.0 0.680 6 11.6 35.1 37.4 2.3 12.7 7.0 2.4 37.4 0.5 207.0 98.0 0.0 SBF 1.0 10.1 9.6 553.0 346.0 46.0 46.0 409.0 311.0 0.1 -36.4 0.5 0.181 11 9.9 11.8 17.3 5.5 4.1 11.0 5.5 17.3 0.2 87.0 3.0 114.0 SBF 1.0 9.9 9.6 457.0 370.0 160.0 46.0 229.0 226.0 0.1 -42.6 0.8 0.082 5 56.1 57.1 78.5 21.4 22.3 6.0 21.4 78.5 1.2 458.0 636.0 0.0 SBF 1.0 11.0 9.8 891.0 433.0 46.0 46.0 1061.0 425.0 0.1 3.3 0.6 0.183 11 15.8 26.7 36.8 10.1 7.9 12.0 10.9 12.3 0.3 101.0 5.0 7.0 SBF 1.0 10.4 10.1 631.0 530.0 445.0 438.0 584.0 579.0 0.0 20.8 0.0 0.984 14 13.4 7.4 16.9 9.5 1.9 15.0 11.4 16.9 0.3 130.0 58.0 1.0 SBF 1.0 10.7 10.4 761.0 631.0 439.0 438.0 670.0 612.0 0.0 3.4 0.1 0.285 8 9.8 11.6 18.6 7.0 4.0 9.0 7.0 18.6 0.3 129.0 0.0 SBF 1.0 9.8 9.5 419.0 290.0 163.0 163.0 0.0 -6.8 0.2 0.286 9 8.6 4.1 10.3 6.2 1.2 10.0 6.2 8.5 0.5 215.0 0.0 SBF 9.9 9.4 486.0 271.0 163.0 163.0 0.0 3.1 0.6 0.087 8 3.3 0.8 3.7 2.9 0.3 9.0 3.4 3.2 0.1 47.0 52.0 0.0 WBF 9.6 9.5 333.0 286.0 164.0 164.0 315.0 263.0 0.0 4.3 0.0 0.688 3 3.3 0.1 3.4 3.3 0.1 4.0 3.3 3.4 0.1 38.0 0.0 0.0 WBF 9.6 9.6 375.0 337.0 164.0 164.0 286.0 286.0 0.0 2.5 0.5 0.389 10 4.0 1.0 4.3 3.3 0.3 11.0 3.6 3.9 0.1 37.0 6.0 0.0 WBF 9.5 9.5 315.0 278.0 167.0 167.0 270.0 264.0 0.0 -0.5 0.3 0.190 9 25.1 28.8 39.7 10.9 9.6 10.0 34.1 10.9 0.3 133.0 25.0 94.0 WBF 1.0 9.7 9.5 419.0 286.0 541.0 447.0 353.0 328.0 -0.1 58.5 0.3 0.191 11 43.5 140.1 150.8 10.7 39.2 12.0 39.9 57.8 1.1 392.0 408.0 4.0 WBF 2.0 10.8 9.8 825.0 433.0 170.0 166.0 848.0 440.0 0.2 -53.2 0.4 0.092 6 7.8 0.7 8.2 7.5 0.3 7.0 7.5 7.5 0.1 45.0 55.0 0.0 WBF 9.7 9.6 396.0 351.0 167.0 167.0 301.0 246.0 0.0 7.1 0.0 0.893 5 8.5 0.6 8.9 8.3 0.2 6.0 8.3 8.3 0.1 44.0 0.0 0.0 WBF 9.6 9.5 351.0 307.0 167.0 167.0 292.0 292.0 0.0 7.0 0.1 0.694 7 5.4 0.4 5.6 5.2 0.2 8.0 5.3 5.6 0.1 25.0 12.0 3.0 WBF 9.5 9.4 303.0 278.0 172.0 169.0 282.0 270.0 0.0 3.4 0.2 0.395 12 5.4 0.6 5.7 5.1 0.2 13.0 5.1 5.7 0.1 40.0 53.0 0.0 WBF 9.5 9.4 311.0 271.0 169.0 169.0 301.0 248.0 0.0 2.7 0.4 0.096 10 5.8 1.8 6.9 5.1 0.6 11.0 5.2 5.7 0.1 43.0 14.0 1.0 WBF 9.6 9.5 337.0 294.0 169.0 168.0 312.0 298.0 0.0 4.2 0.0 0.797 6 9.4 5.7 13.1 7.4 1.8 7.0 7.4 8.3 0.4 178.0 25.0 110.0 WBF 9.7 9.3 396.0 218.0 278.0 168.0 269.0 244.0 0.0 5.4 0.2 0.398 5 7.4 3.0 8.9 5.9 1.4 6.0 5.9 8.9 0.1 23.0 68.0 3.0 WBF 9.5 9.4 290.0 267.0 193.0 190.0 316.0 248.0 0.1 -33.1 0.9 0.099 9 12.6 6.8 15.5 8.7 2.5 10.0 8.7 14.1 0.5 222.0 47.0 0.0 WBF 10.0 9.5 512.0 290.0 190.0 190.0 483.0 436.0 0.0 -0.4 0.9 0.0100 3 6.1 0.5 6.4 5.9 0.2 4.0 5.9 6.0 0.1 53.0 27.0 0.0 WBF 9.6 9.6 390.0 337.0 190.0 190.0 331.0 304.0 0.0 6.6 0.0 0.8101 2 5.8 2.5 7.2 4.7 1.3 3.0 7.2 4.7 0.2 55.0 0.0 0.0 WBF 9.5 9.3 290.0 235.0 189.0 189.0 260.0 260.0 0.0 17.9 1.0 0.0102 8 7.4 2.4 9.2 6.8 0.7 9.0 7.5 6.8 0.2 123.0 3.0 19.0 WBF 9.6 9.4 390.0 267.0 189.0 170.0 263.0 260.0 0.0 9.0 0.1 0.5103 8 6.1 1.4 7.0 5.6 0.5 9.0 7.0 6.4 0.2 68.0 0.0 0.0 WBF 9.9 9.7 464.0 396.0 170.0 170.0 266.0 266.0 0.0 7.1 0.0 0.7104 3 14.0 11.2 19.4 8.2 4.9 4.0 8.2 19.4 0.3 162.0 0.0 5.0 WBF 9.8 9.4 433.0 271.0 175.0 170.0 266.0 266.0 0.1 -6.7 0.9 0.0105 4 6.5 0.7 6.9 6.2 0.3 5.0 6.2 6.3 0.1 44.0 0.0 0.0 WBF 9.5 9.4 315.0 271.0 170.0 170.0 266.0 266.0 0.0 7.3 0.0 0.8106 5 7.9 3.2 9.4 6.2 1.1 6.0 6.2 7.2 0.2 120.0 0.0 2.0 WBF 9.7 9.5 406.0 286.0 170.0 168.0 266.0 266.0 0.0 5.5 0.1 0.5107 6 9.1 5.0 13.0 8.0 1.8 7.0 8.4 8.9 0.0 33.0 0.0 0.0 WBF 9.6 9.6 361.0 328.0 170.0 170.0 267.0 267.0 0.0 -0.7 0.0 0.7108 7 8.1 2.3 9.4 7.1 0.8 8.0 9.4 7.8 0.0 27.0 29.0 3.0 WBF 9.6 9.6 351.0 324.0 170.0 167.0 314.0 285.0 0.0 13.4 0.0 0.7109 6 7.4 2.0 8.5 6.5 0.8 7.0 7.5 8.1 0.1 66.0 8.0 2.0 WBF 9.7 9.6 412.0 346.0 172.0 170.0 356.0 348.0 0.0 -0.3 0.5 0.1110 6 11.7 5.5 13.3 7.8 2.2 7.0 7.8 13.0 0.3 92.0 0.0 4.0 WBF 10.0 9.7 508.0 416.0 174.0 170.0 493.0 493.0 0.1 -13.8 0.8 0.0
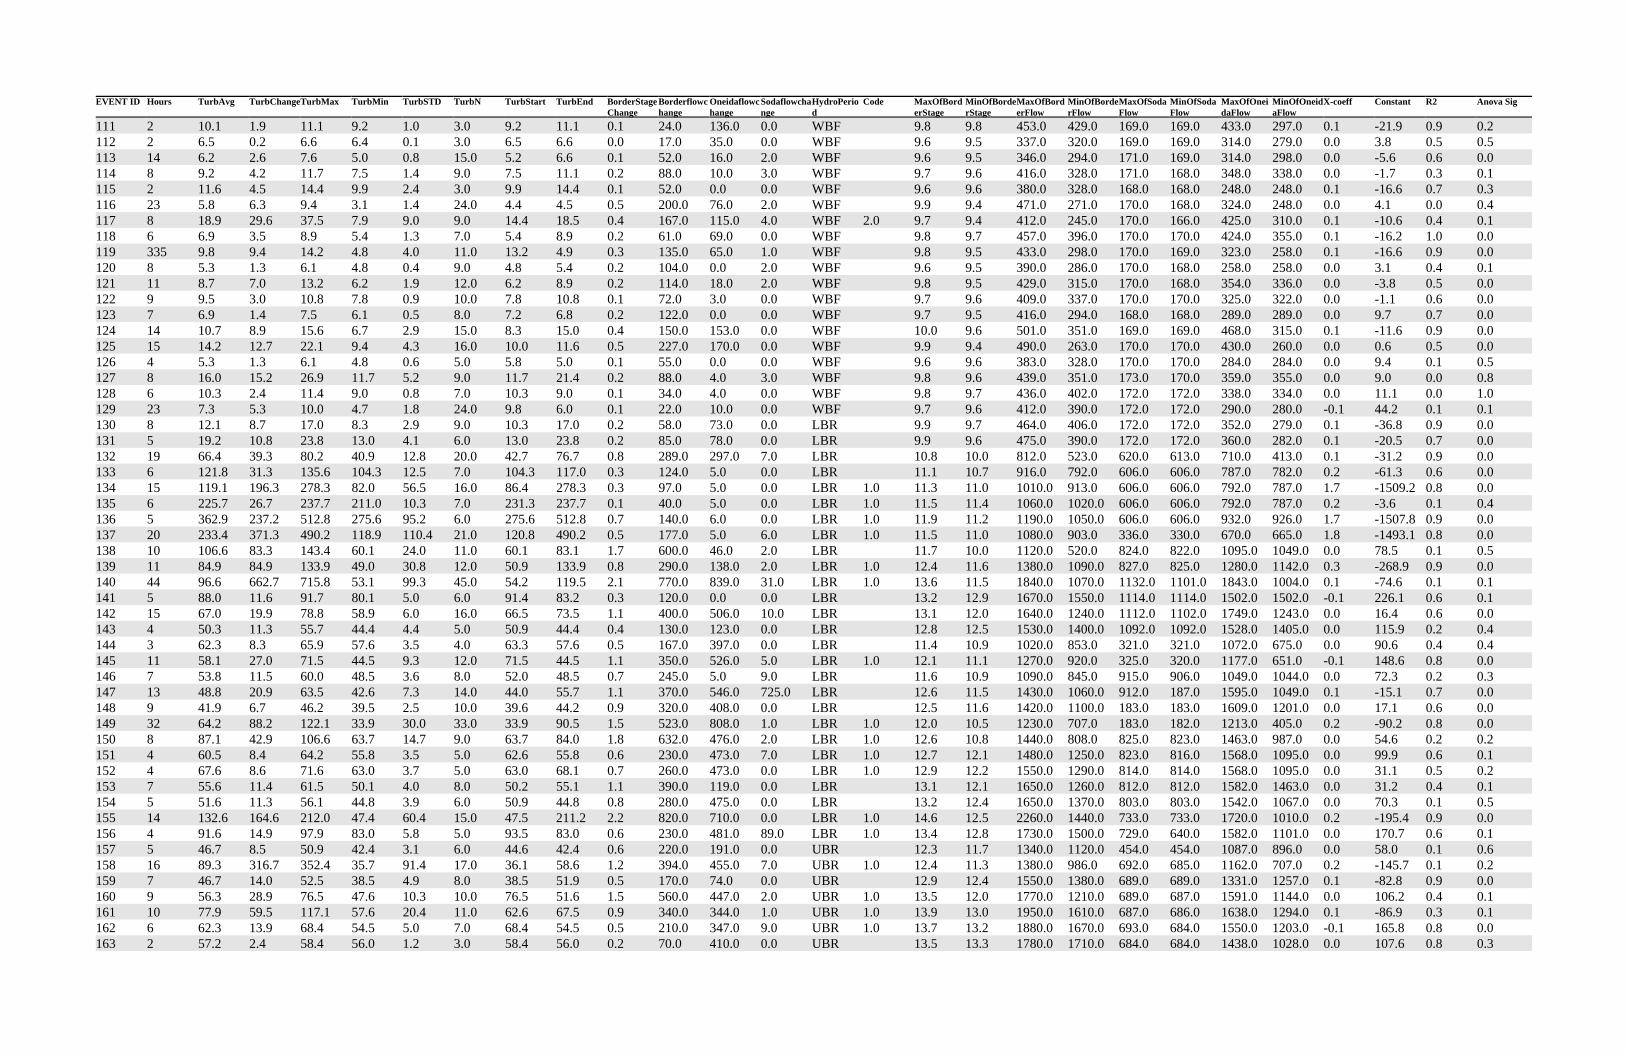
EVENT ID Hours TurbAvg TurbChangeTurbMax TurbMin TurbSTD TurbN TurbStart TurbEnd BorderStageChange
Borderflowchange
Oneidaflowchange
Sodaflowchange
HydroPeriod
Code MaxOfBorderStage
MinOfBorderStage
MaxOfBorderFlow
MinOfBorderFlow
MaxOfSodaFlow
MinOfSodaFlow
MaxOfOneidaFlow
MinOfOneidaFlow
X-coeff Constant R2 Anova Sig
111 2 10.1 1.9 11.1 9.2 1.0 3.0 9.2 11.1 0.1 24.0 136.0 0.0 WBF 9.8 9.8 453.0 429.0 169.0 169.0 433.0 297.0 0.1 -21.9 0.9 0.2112 2 6.5 0.2 6.6 6.4 0.1 3.0 6.5 6.6 0.0 17.0 35.0 0.0 WBF 9.6 9.5 337.0 320.0 169.0 169.0 314.0 279.0 0.0 3.8 0.5 0.5113 14 6.2 2.6 7.6 5.0 0.8 15.0 5.2 6.6 0.1 52.0 16.0 2.0 WBF 9.6 9.5 346.0 294.0 171.0 169.0 314.0 298.0 0.0 -5.6 0.6 0.0114 8 9.2 4.2 11.7 7.5 1.4 9.0 7.5 11.1 0.2 88.0 10.0 3.0 WBF 9.7 9.6 416.0 328.0 171.0 168.0 348.0 338.0 0.0 -1.7 0.3 0.1115 2 11.6 4.5 14.4 9.9 2.4 3.0 9.9 14.4 0.1 52.0 0.0 0.0 WBF 9.6 9.6 380.0 328.0 168.0 168.0 248.0 248.0 0.1 -16.6 0.7 0.3116 23 5.8 6.3 9.4 3.1 1.4 24.0 4.4 4.5 0.5 200.0 76.0 2.0 WBF 9.9 9.4 471.0 271.0 170.0 168.0 324.0 248.0 0.0 4.1 0.0 0.4117 8 18.9 29.6 37.5 7.9 9.0 9.0 14.4 18.5 0.4 167.0 115.0 4.0 WBF 2.0 9.7 9.4 412.0 245.0 170.0 166.0 425.0 310.0 0.1 -10.6 0.4 0.1118 6 6.9 3.5 8.9 5.4 1.3 7.0 5.4 8.9 0.2 61.0 69.0 0.0 WBF 9.8 9.7 457.0 396.0 170.0 170.0 424.0 355.0 0.1 -16.2 1.0 0.0119 335 9.8 9.4 14.2 4.8 4.0 11.0 13.2 4.9 0.3 135.0 65.0 1.0 WBF 9.8 9.5 433.0 298.0 170.0 169.0 323.0 258.0 0.1 -16.6 0.9 0.0120 8 5.3 1.3 6.1 4.8 0.4 9.0 4.8 5.4 0.2 104.0 0.0 2.0 WBF 9.6 9.5 390.0 286.0 170.0 168.0 258.0 258.0 0.0 3.1 0.4 0.1121 11 8.7 7.0 13.2 6.2 1.9 12.0 6.2 8.9 0.2 114.0 18.0 2.0 WBF 9.8 9.5 429.0 315.0 170.0 168.0 354.0 336.0 0.0 -3.8 0.5 0.0122 9 9.5 3.0 10.8 7.8 0.9 10.0 7.8 10.8 0.1 72.0 3.0 0.0 WBF 9.7 9.6 409.0 337.0 170.0 170.0 325.0 322.0 0.0 -1.1 0.6 0.0123 7 6.9 1.4 7.5 6.1 0.5 8.0 7.2 6.8 0.2 122.0 0.0 0.0 WBF 9.7 9.5 416.0 294.0 168.0 168.0 289.0 289.0 0.0 9.7 0.7 0.0124 14 10.7 8.9 15.6 6.7 2.9 15.0 8.3 15.0 0.4 150.0 153.0 0.0 WBF 10.0 9.6 501.0 351.0 169.0 169.0 468.0 315.0 0.1 -11.6 0.9 0.0125 15 14.2 12.7 22.1 9.4 4.3 16.0 10.0 11.6 0.5 227.0 170.0 0.0 WBF 9.9 9.4 490.0 263.0 170.0 170.0 430.0 260.0 0.0 0.6 0.5 0.0126 4 5.3 1.3 6.1 4.8 0.6 5.0 5.8 5.0 0.1 55.0 0.0 0.0 WBF 9.6 9.6 383.0 328.0 170.0 170.0 284.0 284.0 0.0 9.4 0.1 0.5127 8 16.0 15.2 26.9 11.7 5.2 9.0 11.7 21.4 0.2 88.0 4.0 3.0 WBF 9.8 9.6 439.0 351.0 173.0 170.0 359.0 355.0 0.0 9.0 0.0 0.8128 6 10.3 2.4 11.4 9.0 0.8 7.0 10.3 9.0 0.1 34.0 4.0 0.0 WBF 9.8 9.7 436.0 402.0 172.0 172.0 338.0 334.0 0.0 11.1 0.0 1.0129 23 7.3 5.3 10.0 4.7 1.8 24.0 9.8 6.0 0.1 22.0 10.0 0.0 WBF 9.7 9.6 412.0 390.0 172.0 172.0 290.0 280.0 -0.1 44.2 0.1 0.1130 8 12.1 8.7 17.0 8.3 2.9 9.0 10.3 17.0 0.2 58.0 73.0 0.0 LBR 9.9 9.7 464.0 406.0 172.0 172.0 352.0 279.0 0.1 -36.8 0.9 0.0131 5 19.2 10.8 23.8 13.0 4.1 6.0 13.0 23.8 0.2 85.0 78.0 0.0 LBR 9.9 9.6 475.0 390.0 172.0 172.0 360.0 282.0 0.1 -20.5 0.7 0.0132 19 66.4 39.3 80.2 40.9 12.8 20.0 42.7 76.7 0.8 289.0 297.0 7.0 LBR 10.8 10.0 812.0 523.0 620.0 613.0 710.0 413.0 0.1 -31.2 0.9 0.0133 6 121.8 31.3 135.6 104.3 12.5 7.0 104.3 117.0 0.3 124.0 5.0 0.0 LBR 11.1 10.7 916.0 792.0 606.0 606.0 787.0 782.0 0.2 -61.3 0.6 0.0134 15 119.1 196.3 278.3 82.0 56.5 16.0 86.4 278.3 0.3 97.0 5.0 0.0 LBR 1.0 11.3 11.0 1010.0 913.0 606.0 606.0 792.0 787.0 1.7 -1509.2 0.8 0.0135 6 225.7 26.7 237.7 211.0 10.3 7.0 231.3 237.7 0.1 40.0 5.0 0.0 LBR 1.0 11.5 11.4 1060.0 1020.0 606.0 606.0 792.0 787.0 0.2 -3.6 0.1 0.4136 5 362.9 237.2 512.8 275.6 95.2 6.0 275.6 512.8 0.7 140.0 6.0 0.0 LBR 1.0 11.9 11.2 1190.0 1050.0 606.0 606.0 932.0 926.0 1.7 -1507.8 0.9 0.0137 20 233.4 371.3 490.2 118.9 110.4 21.0 120.8 490.2 0.5 177.0 5.0 6.0 LBR 1.0 11.5 11.0 1080.0 903.0 336.0 330.0 670.0 665.0 1.8 -1493.1 0.8 0.0138 10 106.6 83.3 143.4 60.1 24.0 11.0 60.1 83.1 1.7 600.0 46.0 2.0 LBR 11.7 10.0 1120.0 520.0 824.0 822.0 1095.0 1049.0 0.0 78.5 0.1 0.5139 11 84.9 84.9 133.9 49.0 30.8 12.0 50.9 133.9 0.8 290.0 138.0 2.0 LBR 1.0 12.4 11.6 1380.0 1090.0 827.0 825.0 1280.0 1142.0 0.3 -268.9 0.9 0.0140 44 96.6 662.7 715.8 53.1 99.3 45.0 54.2 119.5 2.1 770.0 839.0 31.0 LBR 1.0 13.6 11.5 1840.0 1070.0 1132.0 1101.0 1843.0 1004.0 0.1 -74.6 0.1 0.1141 5 88.0 11.6 91.7 80.1 5.0 6.0 91.4 83.2 0.3 120.0 0.0 0.0 LBR 13.2 12.9 1670.0 1550.0 1114.0 1114.0 1502.0 1502.0 -0.1 226.1 0.6 0.1142 15 67.0 19.9 78.8 58.9 6.0 16.0 66.5 73.5 1.1 400.0 506.0 10.0 LBR 13.1 12.0 1640.0 1240.0 1112.0 1102.0 1749.0 1243.0 0.0 16.4 0.6 0.0143 4 50.3 11.3 55.7 44.4 4.4 5.0 50.9 44.4 0.4 130.0 123.0 0.0 LBR 12.8 12.5 1530.0 1400.0 1092.0 1092.0 1528.0 1405.0 0.0 115.9 0.2 0.4144 3 62.3 8.3 65.9 57.6 3.5 4.0 63.3 57.6 0.5 167.0 397.0 0.0 LBR 11.4 10.9 1020.0 853.0 321.0 321.0 1072.0 675.0 0.0 90.6 0.4 0.4145 11 58.1 27.0 71.5 44.5 9.3 12.0 71.5 44.5 1.1 350.0 526.0 5.0 LBR 1.0 12.1 11.1 1270.0 920.0 325.0 320.0 1177.0 651.0 -0.1 148.6 0.8 0.0146 7 53.8 11.5 60.0 48.5 3.6 8.0 52.0 48.5 0.7 245.0 5.0 9.0 LBR 11.6 10.9 1090.0 845.0 915.0 906.0 1049.0 1044.0 0.0 72.3 0.2 0.3147 13 48.8 20.9 63.5 42.6 7.3 14.0 44.0 55.7 1.1 370.0 546.0 725.0 LBR 12.6 11.5 1430.0 1060.0 912.0 187.0 1595.0 1049.0 0.1 -15.1 0.7 0.0148 9 41.9 6.7 46.2 39.5 2.5 10.0 39.6 44.2 0.9 320.0 408.0 0.0 LBR 12.5 11.6 1420.0 1100.0 183.0 183.0 1609.0 1201.0 0.0 17.1 0.6 0.0149 32 64.2 88.2 122.1 33.9 30.0 33.0 33.9 90.5 1.5 523.0 808.0 1.0 LBR 1.0 12.0 10.5 1230.0 707.0 183.0 182.0 1213.0 405.0 0.2 -90.2 0.8 0.0150 8 87.1 42.9 106.6 63.7 14.7 9.0 63.7 84.0 1.8 632.0 476.0 2.0 LBR 1.0 12.6 10.8 1440.0 808.0 825.0 823.0 1463.0 987.0 0.0 54.6 0.2 0.2151 4 60.5 8.4 64.2 55.8 3.5 5.0 62.6 55.8 0.6 230.0 473.0 7.0 LBR 1.0 12.7 12.1 1480.0 1250.0 823.0 816.0 1568.0 1095.0 0.0 99.9 0.6 0.1152 4 67.6 8.6 71.6 63.0 3.7 5.0 63.0 68.1 0.7 260.0 473.0 0.0 LBR 1.0 12.9 12.2 1550.0 1290.0 814.0 814.0 1568.0 1095.0 0.0 31.1 0.5 0.2153 7 55.6 11.4 61.5 50.1 4.0 8.0 50.2 55.1 1.1 390.0 119.0 0.0 LBR 13.1 12.1 1650.0 1260.0 812.0 812.0 1582.0 1463.0 0.0 31.2 0.4 0.1154 5 51.6 11.3 56.1 44.8 3.9 6.0 50.9 44.8 0.8 280.0 475.0 0.0 LBR 13.2 12.4 1650.0 1370.0 803.0 803.0 1542.0 1067.0 0.0 70.3 0.1 0.5155 14 132.6 164.6 212.0 47.4 60.4 15.0 47.5 211.2 2.2 820.0 710.0 0.0 LBR 1.0 14.6 12.5 2260.0 1440.0 733.0 733.0 1720.0 1010.0 0.2 -195.4 0.9 0.0156 4 91.6 14.9 97.9 83.0 5.8 5.0 93.5 83.0 0.6 230.0 481.0 89.0 LBR 1.0 13.4 12.8 1730.0 1500.0 729.0 640.0 1582.0 1101.0 0.0 170.7 0.6 0.1157 5 46.7 8.5 50.9 42.4 3.1 6.0 44.6 42.4 0.6 220.0 191.0 0.0 UBR 12.3 11.7 1340.0 1120.0 454.0 454.0 1087.0 896.0 0.0 58.0 0.1 0.6158 16 89.3 316.7 352.4 35.7 91.4 17.0 36.1 58.6 1.2 394.0 455.0 7.0 UBR 1.0 12.4 11.3 1380.0 986.0 692.0 685.0 1162.0 707.0 0.2 -145.7 0.1 0.2159 7 46.7 14.0 52.5 38.5 4.9 8.0 38.5 51.9 0.5 170.0 74.0 0.0 UBR 12.9 12.4 1550.0 1380.0 689.0 689.0 1331.0 1257.0 0.1 -82.8 0.9 0.0160 9 56.3 28.9 76.5 47.6 10.3 10.0 76.5 51.6 1.5 560.0 447.0 2.0 UBR 1.0 13.5 12.0 1770.0 1210.0 689.0 687.0 1591.0 1144.0 0.0 106.2 0.4 0.1161 10 77.9 59.5 117.1 57.6 20.4 11.0 62.6 67.5 0.9 340.0 344.0 1.0 UBR 1.0 13.9 13.0 1950.0 1610.0 687.0 686.0 1638.0 1294.0 0.1 -86.9 0.3 0.1162 6 62.3 13.9 68.4 54.5 5.0 7.0 68.4 54.5 0.5 210.0 347.0 9.0 UBR 1.0 13.7 13.2 1880.0 1670.0 693.0 684.0 1550.0 1203.0 -0.1 165.8 0.8 0.0163 2 57.2 2.4 58.4 56.0 1.2 3.0 58.4 56.0 0.2 70.0 410.0 0.0 UBR 13.5 13.3 1780.0 1710.0 684.0 684.0 1438.0 1028.0 0.0 107.6 0.8 0.3

EVENT ID Hours TurbAvg TurbChangeTurbMax TurbMin TurbSTD TurbN TurbStart TurbEnd BorderStageChange
Borderflowchange
Oneidaflowchange
Sodaflowchange
HydroPeriod
Code MaxOfBorderStage
MinOfBorderStage
MaxOfBorderFlow
MinOfBorderFlow
MaxOfSodaFlow
MinOfSodaFlow
MaxOfOneidaFlow
MinOfOneidaFlow
X-coeff Constant R2 Anova Sig
164 9 61.9 13.6 66.8 53.2 5.1 10.0 53.2 66.3 1.2 470.0 923.0 2.0 UBR 14.0 12.8 2000.0 1530.0 721.0 719.0 1644.0 721.0 0.0 12.3 0.9 0.0165 14 117.2 67.4 166.8 99.4 23.8 15.0 140.4 99.6 1.6 660.0 419.0 38.0 UBR 1.0 14.5 12.9 2210.0 1550.0 757.0 719.0 1837.0 1418.0 -0.1 278.6 0.7 0.0166 6 109.7 39.8 130.6 90.8 15.6 7.0 130.6 90.8 0.4 170.0 117.0 15.0 UBR 1.0 14.3 13.9 2140.0 1970.0 925.0 910.0 1699.0 1582.0 -0.2 596.6 1.0 0.0167 4 69.8 8.7 74.0 65.3 3.6 5.0 72.9 65.3 0.6 170.0 225.0 8.0 UBR 14.2 13.6 1990.0 1820.0 924.0 916.0 1636.0 1411.0 0.0 163.4 0.9 0.0168 6 44.2 9.4 50.7 41.3 3.1 7.0 42.7 41.3 0.8 270.0 5.0 10.0 UBR 13.8 13.0 1860.0 1590.0 912.0 902.0 1530.0 1525.0 0.0 64.4 0.1 0.4169 8 33.2 5.6 35.5 29.9 2.0 9.0 29.9 35.5 0.8 330.0 7.0 0.0 UBR 13.9 13.0 1940.0 1610.0 908.0 908.0 1600.0 1593.0 0.0 4.7 0.9 0.0170 20 38.4 9.6 43.2 33.6 2.8 21.0 42.0 38.3 1.1 450.0 632.0 9.0 UBR 14.3 13.2 2110.0 1660.0 922.0 913.0 1887.0 1255.0 0.0 20.7 0.3 0.0171 6 37.1 6.9 41.2 34.3 2.5 7.0 34.3 36.5 0.9 200.0 123.0 8.0 UBR 14.2 13.3 1900.0 1700.0 919.0 911.0 1638.0 1515.0 0.0 -1.3 0.5 0.1172 11 37.3 11.3 40.9 29.6 3.4 12.0 29.6 35.4 1.0 390.0 12.0 10.0 UBR 14.0 13.0 1990.0 1600.0 919.0 909.0 1665.0 1653.0 0.0 17.1 0.2 0.2173 13 34.9 10.2 39.9 29.7 3.1 14.0 39.2 30.6 0.4 180.0 0.0 8.0 UBR 13.8 13.4 1910.0 1730.0 845.0 837.0 1460.0 1460.0 -0.1 128.9 0.9 0.0174 13 33.6 5.0 36.4 31.4 1.7 14.0 32.1 31.4 0.6 240.0 315.0 38.0 UBR 13.8 13.2 1900.0 1660.0 826.0 788.0 1588.0 1273.0 0.0 27.1 0.0 0.5175 7 33.3 12.8 39.4 26.6 5.6 8.0 26.6 38.0 0.8 320.0 544.0 86.0 UBR 13.9 13.0 1930.0 1610.0 840.0 754.0 1836.0 1292.0 0.0 -40.2 0.9 0.0176 8 25.2 4.6 27.1 22.5 1.6 9.0 24.5 22.5 0.3 100.0 97.0 7.0 UBR 13.1 12.8 1620.0 1520.0 785.0 778.0 1314.0 1217.0 0.0 33.3 0.0 0.8177 9 29.3 9.7 34.1 24.4 3.4 10.0 24.4 30.5 1.1 410.0 615.0 7.0 UBR 13.1 12.0 1640.0 1230.0 638.0 631.0 1543.0 928.0 0.0 1.4 0.8 0.0178 6 27.8 9.6 31.3 21.7 3.5 7.0 21.7 26.3 1.0 330.0 104.0 0.0 UBR 1.0 12.5 11.5 1400.0 1070.0 631.0 631.0 1162.0 1058.0 0.0 8.3 0.3 0.2179 6 34.9 4.4 37.4 33.0 1.6 7.0 33.6 36.4 0.2 60.0 0.0 7.0 UBR 1.0 12.7 12.6 1500.0 1440.0 639.0 632.0 1059.0 1059.0 0.1 -59.4 0.8 0.0180 13 27.2 19.8 38.9 19.1 4.8 11.0 19.1 23.7 0.9 330.0 420.0 8.0 UBR 12.8 11.8 1500.0 1170.0 774.0 766.0 1165.0 745.0 0.0 1.7 0.2 0.2181 6 25.4 16.4 34.8 18.4 5.8 7.0 18.4 34.8 0.6 240.0 408.0 17.0 UBR 1.0 13.2 12.6 1690.0 1450.0 986.0 969.0 1623.0 1215.0 0.1 -64.0 0.9 0.0182 4 46.8 8.0 51.3 43.3 3.1 5.0 51.3 44.9 0.3 110.0 7.0 8.0 UBR 1.0 13.7 13.4 1870.0 1760.0 963.0 955.0 1525.0 1518.0 -0.1 169.4 0.9 0.0183 6 38.8 13.6 46.9 33.3 4.8 7.0 33.3 40.0 0.2 90.0 0.0 8.0 UBR 1.0 13.5 13.2 1780.0 1690.0 964.0 956.0 1494.0 1494.0 0.1 -154.1 0.6 0.0184 13 34.0 5.1 36.9 31.8 1.5 14.0 31.8 33.8 0.9 330.0 446.0 8.0 UBR 13.6 12.7 1830.0 1500.0 964.0 956.0 1757.0 1311.0 0.0 21.3 0.2 0.1185 10 30.2 3.6 31.3 27.7 1.1 11.0 27.7 28.8 0.6 250.0 147.0 0.0 UBR 13.3 12.7 1720.0 1470.0 957.0 957.0 1491.0 1344.0 0.0 22.6 0.1 0.3186 11 35.1 5.5 37.1 31.6 1.6 12.0 31.6 33.6 1.1 450.0 767.0 8.0 UBR 13.9 12.8 1950.0 1500.0 864.0 856.0 1825.0 1058.0 0.0 25.3 0.3 0.1187 7 25.5 8.4 31.0 22.6 2.5 8.0 31.0 22.6 0.3 110.0 507.0 0.0 UBR 12.8 12.5 1530.0 1420.0 780.0 780.0 1272.0 765.0 -0.1 105.9 0.7 0.0188 8 22.9 2.8 24.2 21.4 1.0 9.0 21.4 23.9 0.9 330.0 159.0 1.0 UBR 12.9 12.0 1550.0 1220.0 720.0 719.0 1247.0 1088.0 0.0 14.2 0.4 0.1189 8 24.1 3.6 25.2 21.6 1.1 9.0 21.6 24.1 0.7 250.0 98.0 8.0 UBR 12.5 11.8 1410.0 1160.0 610.0 602.0 1142.0 1044.0 0.0 14.0 0.3 0.1190 5 24.7 6.4 29.0 22.6 2.4 6.0 22.6 23.0 0.3 110.0 344.0 0.0 UBR 12.5 12.2 1420.0 1310.0 610.0 610.0 1136.0 792.0 0.0 32.8 0.0 0.9191 5 24.2 3.2 26.1 22.9 1.2 6.0 22.9 23.1 0.5 180.0 68.0 7.0 UBR 12.1 11.6 1270.0 1090.0 611.0 604.0 1080.0 1012.0 0.0 24.1 0.0 1.0192 5 13.2 1.2 13.6 12.4 0.4 6.0 13.2 12.4 0.1 55.0 0.0 0.0 UBR 9.5 9.3 315.0 260.0 511.0 511.0 408.0 408.0 0.0 15.0 0.1 0.5193 6 12.0 3.0 13.1 10.1 1.1 7.0 10.1 12.9 0.1 21.0 0.0 0.0 UBR 8.9 8.8 135.0 114.0 598.0 598.0 266.0 266.0 0.1 -1.9 0.7 0.0194 15 9.5 3.1 10.4 7.3 0.8 16.0 7.3 9.8 0.3 80.0 41.0 188.0 UBR 9.1 8.8 191.0 111.0 822.0 634.0 319.0 278.0 0.0 7.2 0.3 0.0195 8 15.4 36.4 42.9 6.5 11.0 9.0 6.5 12.3 0.7 254.0 0.0 7.0 UBR 9.7 8.9 396.0 142.0 822.0 815.0 464.0 464.0 0.1 -1.5 0.3 0.1196 6 17.6 5.4 20.7 15.3 1.8 7.0 15.3 16.5 0.6 198.0 0.0 0.0 UBR 10.2 9.6 578.0 380.0 927.0 927.0 737.0 737.0 0.0 14.7 0.0 0.7197 6 13.4 3.6 15.4 11.8 1.4 7.0 11.8 13.8 0.3 111.0 0.0 5.0 UBR 10.0 9.7 530.0 419.0 1181.0 1176.0 798.0 798.0 0.0 1.3 0.7 0.0198 8 22.0 10.5 25.8 15.3 4.0 9.0 15.8 24.6 0.4 120.0 11.0 116.0 UBR 10.4 10.0 643.0 523.0 1176.0 1060.0 954.0 943.0 0.1 -30.4 0.9 0.0199 4 13.4 3.8 15.3 11.5 1.4 5.0 11.5 13.9 0.1 41.0 0.0 0.0 UBR 10.0 9.9 520.0 479.0 1062.0 1062.0 751.0 751.0 0.0 -1.0 0.1 0.6200 6 15.2 5.2 18.6 13.4 1.9 7.0 13.4 18.6 0.2 60.0 0.0 8.0 UBR 9.8 9.6 453.0 393.0 1140.0 1132.0 710.0 710.0 0.1 -7.0 0.5 0.1201 4 19.2 2.3 20.0 17.7 0.9 5.0 19.8 19.2 0.1 47.0 0.0 8.0 UBR 9.9 9.8 486.0 439.0 1135.0 1127.0 745.0 745.0 0.0 21.6 0.0 0.9202 15 19.1 5.7 22.4 16.7 1.7 16.0 22.4 20.6 0.2 77.0 6.0 8.0 UBR 10.0 9.8 520.0 443.0 1139.0 1131.0 792.0 786.0 -0.1 51.9 0.6 0.0203 3 25.4 5.0 27.5 22.5 2.2 4.0 22.5 26.7 0.3 95.0 6.0 5.0 UBR 10.2 9.9 581.0 486.0 1139.0 1134.0 797.0 791.0 0.0 -0.8 0.9 0.1204 9 15.4 4.8 17.9 13.1 1.5 10.0 17.0 14.4 0.2 66.0 5.0 9.0 UBR 10.0 9.8 512.0 446.0 1138.0 1129.0 791.0 786.0 -0.1 44.1 0.7 0.0205 15 20.0 9.7 26.6 16.9 2.6 16.0 19.5 26.6 0.3 120.0 16.0 145.0 UBR 10.2 9.9 602.0 482.0 1278.0 1133.0 887.0 871.0 0.0 2.0 0.2 0.1206 19 33.8 43.4 46.8 3.4 9.4 20.0 3.4 32.6 0.4 165.0 175.0 13.0 UBR 10.7 10.2 757.0 592.0 1351.0 1338.0 1099.0 924.0 0.1 -21.8 0.3 0.0207 10 29.7 7.1 33.6 26.5 2.7 11.0 33.0 33.4 0.2 79.0 100.0 0.0 UBR 10.8 10.6 821.0 742.0 1215.0 1215.0 1205.0 1105.0 0.0 2.4 0.1 0.3208 7 31.9 2.9 33.1 30.2 1.1 8.0 32.3 30.6 0.5 194.0 0.0 14.0 UBR 10.8 10.3 800.0 606.0 1215.0 1201.0 1169.0 1169.0 0.0 39.5 0.4 0.1209 5 36.2 6.8 39.7 32.9 3.0 6.0 32.9 39.7 0.0 8.0 110.0 84.0 UBR 10.8 10.8 816.0 808.0 1210.0 1126.0 1163.0 1053.0 0.9 -654.0 0.5 0.1210 9 33.4 13.1 38.9 25.8 4.7 10.0 38.9 25.8 0.2 68.0 34.0 5.0 UBR 10.5 10.3 688.0 620.0 1121.0 1116.0 1024.0 990.0 -0.2 138.8 0.7 0.0211 7 31.3 7.7 35.1 27.4 2.7 8.0 28.3 27.4 0.2 73.0 55.0 4.0 SBF 10.2 10.0 585.0 512.0 854.0 850.0 934.0 879.0 0.0 18.0 0.0 0.6212 4 32.4 2.8 33.6 30.8 1.4 5.0 30.8 33.0 0.1 49.0 76.0 0.0 SBF 10.3 10.1 606.0 557.0 804.0 804.0 912.0 836.0 0.1 -2.8 0.7 0.1213 8 18.9 4.8 20.9 16.1 1.8 9.0 20.9 16.1 0.1 50.0 73.0 2.0 SBF 9.6 9.5 370.0 320.0 697.0 695.0 696.0 623.0 -0.1 46.9 0.9 0.0214 4 15.9 2.1 17.0 14.9 0.8 5.0 17.0 15.3 0.1 52.0 5.0 0.0 SBF 9.5 9.4 315.0 263.0 698.0 698.0 589.0 584.0 0.0 26.8 1.0 0.0215 4 21.0 4.5 23.6 19.1 1.9 5.0 19.1 23.6 0.2 91.0 10.0 7.0 SBF 9.7 9.5 419.0 328.0 698.0 691.0 716.0 706.0 0.0 4.2 0.8 0.0216 6 13.0 1.8 14.2 12.4 0.7 7.0 12.6 12.4 0.1 60.0 5.0 0.0 SBF 9.6 9.5 380.0 320.0 606.0 606.0 661.0 656.0 0.0 13.9 0.0 0.9

EVENT ID Hours TurbAvg TurbChangeTurbMax TurbMin TurbSTD TurbN TurbStart TurbEnd BorderStageChange
Borderflowchange
Oneidaflowchange
Sodaflowchange
HydroPeriod
Code MaxOfBorderStage
MinOfBorderStage
MaxOfBorderFlow
MinOfBorderFlow
MaxOfSodaFlow
MinOfSodaFlow
MaxOfOneidaFlow
MinOfOneidaFlow
X-coeff Constant R2 Anova Sig
217 8 9.1 1.9 10.1 8.2 0.7 9.0 8.7 10.1 0.2 63.0 94.0 7.0 SBF 9.3 9.1 245.0 182.0 609.0 602.0 520.0 426.0 0.0 5.1 0.4 0.1218 6 10.3 2.2 11.2 9.0 0.8 7.0 9.0 10.0 0.4 130.0 130.0 7.0 SBF 9.5 9.1 294.0 164.0 819.0 812.0 598.0 468.0 0.0 8.3 0.4 0.1219 6 8.3 2.1 9.3 7.2 0.8 7.0 8.1 9.0 0.2 55.0 75.0 70.0 SBF 9.4 9.2 267.0 212.0 889.0 819.0 623.0 548.0 0.0 2.3 0.6 0.0220 11 9.6 2.9 10.8 7.9 0.9 12.0 7.9 8.5 0.2 110.0 49.0 8.0 SBF 9.7 9.4 396.0 286.0 891.0 883.0 687.0 638.0 0.0 5.7 0.1 0.2221 20 11.7 6.7 15.8 9.1 1.7 21.0 10.9 11.9 0.9 211.0 82.0 1.0 SBF 10.4 9.5 630.0 419.0 884.0 883.0 918.0 836.0 0.0 13.6 0.0 0.6222 6 13.4 4.5 15.5 11.0 1.5 7.0 11.8 13.6 0.2 69.0 1.0 2.0 SBF 10.4 10.2 650.0 581.0 886.0 884.0 985.0 984.0 0.0 -5.8 0.3 0.2223 4 9.8 2.3 10.8 8.5 1.1 5.0 8.5 10.8 0.2 74.0 0.0 8.0 SBF 10.4 10.2 673.0 599.0 888.0 880.0 914.0 914.0 -7.6 -7.6 0.5 0.2224 11 14.5 9.1 19.7 10.6 3.0 12.0 10.6 19.7 0.6 230.0 137.0 699.0 SBF 1.0 11.0 10.4 891.0 661.0 1075.0 376.0 1118.0 981.0 0.0 -15.0 0.8 0.0225 34 20.6 8.1 25.0 16.9 2.6 13.0 22.4 24.8 0.5 198.0 151.0 313.0 SBF 1.0 11.3 10.8 1010.0 812.0 1068.0 755.0 1263.0 1112.0 0.0 -9.2 0.6 0.0226 4 12.2 0.3 12.4 12.1 0.1 5.0 12.3 12.1 0.1 35.0 90.0 8.0 SBF 10.5 10.4 700.0 665.0 757.0 749.0 868.0 778.0 0.0 16.8 0.6 0.1227 11 12.2 1.7 12.8 11.1 0.5 12.0 11.1 12.4 0.3 119.0 5.0 0.0 SBF 10.3 10.0 639.0 520.0 829.0 829.0 864.0 859.0 9.4 0.1 0.1 0.3228 7 12.6 2.4 13.6 11.2 0.8 8.0 11.2 12.2 0.3 105.0 6.0 1.0 SBF 10.5 10.2 707.0 602.0 830.0 829.0 996.0 990.0 0.0 0.1 0.1 0.4229 30 4.8 2.5 6.1 3.6 0.8 31.0 5.0 6.1 0.4 126.0 129.0 7.0 SBF 9.5 9.1 290.0 164.0 623.0 616.0 513.0 384.0 0.0 1.3 0.6 0.0230 6 6.7 3.5 8.6 5.1 1.3 7.0 5.1 7.2 0.4 182.0 0.0 0.0 SBF 9.8 9.5 460.0 278.0 619.0 619.0 683.0 683.0 0.0 0.2 0.8 0.0231 8 5.4 1.4 5.9 4.5 0.4 9.0 4.5 5.2 0.2 56.0 24.0 12.0 SBF 10.0 9.8 516.0 460.0 514.0 502.0 689.0 665.0 0.0 3.0 0.0 0.6232 10 4.7 1.3 5.4 4.1 0.4 11.0 5.4 4.6 0.1 32.0 129.0 7.0 SBF 9.7 9.6 422.0 390.0 509.0 502.0 579.0 450.0 0.0 11.0 0.3 0.1233 10 4.0 1.1 4.5 3.4 0.4 11.0 3.4 4.5 0.2 66.0 4.0 2.0 SBF 9.5 9.4 311.0 245.0 505.0 503.0 446.0 442.0 0.0 0.8 0.4 0.0234 11 3.2 1.6 4.1 2.5 0.5 12.0 2.9 3.2 0.2 121.0 46.0 2.0 SBF 9.6 9.4 370.0 249.0 528.0 526.0 481.0 435.0 0.0 1.8 0.2 0.2235 12 3.5 1.9 4.6 2.7 0.6 13.0 3.0 3.9 0.3 142.0 101.0 7.0 SBF 9.8 9.5 436.0 294.0 525.0 518.0 540.0 439.0 0.0 0.7 0.6 0.0236 10 3.8 1.7 4.7 3.0 0.4 11.0 3.8 3.0 0.2 66.0 4.0 42.0 SBF 9.9 9.7 482.0 416.0 558.0 516.0 522.0 518.0 0.0 4.6 0.0 0.8237 7 6.0 3.7 7.9 4.2 1.5 8.0 4.2 7.8 0.4 157.0 5.0 0.0 SBF 1.0 10.3 9.9 628.0 471.0 529.0 529.0 714.0 709.0 0.0 -7.3 0.9 0.0238 14 3.2 1.3 3.8 2.5 0.4 15.0 2.5 3.8 0.2 83.0 88.0 2.0 SBF 10.1 9.8 540.0 457.0 527.0 525.0 602.0 514.0 0.0 -1.6 0.7 0.0239 7 4.1 2.2 5.5 3.3 0.8 8.0 3.3 3.9 0.2 65.0 48.0 0.0 SBF 10.2 10.0 592.0 527.0 379.0 379.0 651.0 603.0 0.0 -5.6 0.3 0.2240 4 4.2 1.3 5.1 3.8 0.5 5.0 3.8 5.1 0.1 31.0 5.0 0.0 SBF 10.2 10.1 581.0 550.0 315.0 315.0 529.0 524.0 0.0 -12.5 0.5 0.2241 2 8.4 9.4 13.7 4.3 4.8 3.0 4.3 13.7 0.2 69.0 0.0 0.0 SBF 10.4 10.2 654.0 585.0 308.0 308.0 468.0 468.0 0.1 -63.4 0.8 0.3242 5 3.3 2.9 5.3 2.4 1.0 6.0 2.4 3.5 0.4 202.0 0.0 4.0 SBF 9.7 9.2 396.0 194.0 217.0 213.0 324.0 324.0 0.0 0.8 0.5 0.1243 7 5.6 4.3 8.3 4.0 1.6 8.0 4.0 7.1 0.4 134.0 0.0 0.0 SBF 1.0 10.1 9.7 553.0 419.0 215.0 215.0 484.0 484.0 0.0 -7.7 0.7 0.0244 4 3.4 1.5 4.3 2.8 0.7 5.0 2.8 3.9 0.1 48.0 3.0 0.0 SBF 9.7 9.6 399.0 351.0 170.0 170.0 306.0 303.0 0.0 -7.2 0.8 0.0245 12 4.1 0.7 4.4 3.7 0.2 13.0 4.0 4.0 0.0 37.0 1.0 54.0 SBF 9.6 9.6 383.0 346.0 220.0 166.0 306.0 305.0 0.0 3.1 0.0 0.6246 9 4.3 1.8 5.4 3.6 0.5 10.0 3.6 5.4 0.0 28.0 3.0 1.0 SBF 9.6 9.6 365.0 337.0 168.0 167.0 306.0 303.0 0.0 -4.4 0.3 0.1247 6 6.8 5.5 9.7 4.2 2.3 7.0 4.3 8.7 0.3 132.0 27.0 3.0 SBF 9.9 9.6 460.0 328.0 541.0 538.0 419.0 392.0 0.0 -8.7 0.9 0.0248 16 21.5 27.6 33.2 5.6 10.7 17.0 5.6 26.1 0.8 308.0 248.0 3.0 SBF 1.0 10.7 9.8 761.0 453.0 509.0 506.0 807.0 559.0 0.1 -35.7 0.9 0.0249 5 28.8 53.5 71.2 17.7 20.9 6.0 17.7 19.8 0.1 39.0 5.0 3.0 SBF 1.0 10.8 10.7 808.0 769.0 492.0 489.0 850.0 845.0 -0.2 192.9 0.0 0.8250 7 8.6 3.7 10.4 6.7 1.3 8.0 6.7 10.4 0.4 144.0 10.0 310.0 SBF 10.5 10.1 711.0 567.0 488.0 178.0 751.0 741.0 0.0 -5.2 0.7 0.0251 5 5.7 1.5 6.4 4.9 0.6 6.0 4.9 6.4 0.2 78.0 44.0 3.0 SBF 9.7 9.6 402.0 324.0 195.0 192.0 383.0 339.0 0.0 -1.2 0.9 0.0252 17 6.6 2.8 7.8 5.0 0.8 18.0 5.3 7.0 0.3 110.0 89.0 5.0 SBF 9.9 9.6 471.0 361.0 197.0 192.0 464.0 375.0 0.0 0.0 0.4 0.0253 6 6.0 3.1 8.1 5.0 1.0 7.0 5.0 6.4 0.2 78.0 4.0 4.0 SBF 9.8 9.6 429.0 351.0 203.0 199.0 433.0 429.0 0.0 -0.5 0.2 0.3254 6 10.7 5.8 13.0 7.2 2.3 7.0 7.2 12.7 0.3 130.0 0.0 0.0 SBF 9.9 9.6 450.0 320.0 200.0 200.0 483.0 483.0 0.0 -7.5 1.0 0.0255 6 10.0 3.3 12.5 9.2 1.2 7.0 9.2 9.8 0.1 47.0 4.0 0.0 SBF 1.0 9.7 9.6 393.0 346.0 197.0 197.0 386.0 382.0 0.0 -1.4 0.2 0.3

APPENDIX II. Storm-Influenced Hourly Data for Hydrologically Increasing Events

ID Event ID
Date Time Hydro Period
temp spcond DO% domgl depth Turb Border Stage
Border Flow
Oneida Flow
Soda Flow
ANOVA SIG
1 1 05/12/04 10:00 UBR 13.13 1.761 84.3 8.8 0.747 13.5 8.29 45 130 221 0.0092 1 05/12/04 11:00 UBR 13.54 1.761 94.8 9.81 0.845 12.2 8.21 38 130 216 0.0093 1 05/12/04 12:00 UBR 13.75 1.762 100.8 10.39 0.957 13.9 8.26 42 130 216 0.0094 1 05/12/04 13:00 UBR 14.11 1.758 109.3 11.17 1.033 13 8.37 53 130 216 0.0095 1 05/12/04 14:00 UBR 14.2 1.754 113.5 11.59 1.102 11.7 8.44 61 130 221 0.0096 1 05/12/04 15:00 UBR 14.32 1.747 119.7 12.18 1.141 12.4 8.49 67 130 221 0.0097 1 05/12/04 16:00 UBR 14.74 1.739 126.8 12.79 1.166 12.8 8.51 69 130 216 0.0098 1 05/12/04 17:00 UBR 15.06 1.733 132.4 13.26 1.195 14.5 8.53 72 130 221 0.0099 1 05/12/04 18:00 UBR 15.09 1.729 133.2 13.34 1.226 13.4 8.55 75 130 216 0.009
10 1 05/12/04 19:00 UBR 15.2 1.724 131.1 13.1 1.261 12.5 8.56 76 130 221 0.00911 1 05/12/04 20:00 UBR 15.03 1.719 124.4 12.47 1.295 15.9 8.57 78 130 216 0.00912 1 05/12/04 21:00 UBR 14.77 1.715 119.2 12.02 1.342 13.4 8.58 79 128 216 0.00913 1 05/12/04 22:00 UBR 14.49 1.707 112.2 11.37 1.379 15 8.59 81 128 216 0.00914 1 05/12/04 23:00 UBR 14.19 1.704 104.2 10.64 1.377 16.4 8.59 81 128 216 0.00915 1 05/13/04 0:00 UBR 13.88 1.702 96.5 9.92 1.387 16.9 8.6 82 128 215 0.00916 1 05/13/04 1:00 UBR 13.57 1.702 91.3 9.45 1.39 18.1 8.6 82 128 215 0.00917 1 05/13/04 2:00 UBR 13.25 1.7 87.3 9.1 1.384 18 8.59 81 128 215 0.00918 1 05/13/04 3:00 UBR 12.96 1.702 82.6 8.66 1.381 19.5 8.59 81 128 215 0.00919 2 05/23/04 23:00 UBR 14.8 1.13 97 9.8 2.463 16 9.46 311 644 1096 020 2 05/24/04 0:00 UBR 14.4 1.13 92 9.4 2.633 19 9.6 375 643 1096 021 2 05/24/04 1:00 UBR 14.1 1.13 88 9 2.773 23 9.73 419 643 1096 022 2 05/24/04 2:00 UBR 13.9 1.12 85 8.8 2.843 26 9.83 453 643 1096 023 2 05/24/04 3:00 UBR 13.6 1.08 83 8.6 2.893 27 9.89 475 643 1096 024 2 05/24/04 4:00 UBR 13.4 1.04 81 8.5 2.913 34 9.91 482 643 1096 025 2 05/24/04 5:00 UBR 13.3 1 78 8.2 2.913 34 9.93 490 643 1096 026 2 05/24/04 6:00 UBR 13.1 0.97 75 7.8 2.933 35 9.94 493 643 1096 027 2 05/24/04 7:00 UBR 12.8 0.96 72 7.6 2.953 29 9.94 493 643 1096 028 2 05/24/04 8:00 UBR 12.7 0.96 72 7.6 2.983 28 9.97 505 957 1096 029 2 05/24/04 9:00 UBR 12.8 0.97 74 7.8 3.003 21 9.98 508 973 1086 030 2 05/24/04 10:00 UBR 13.1 0.97 77 8.1 2.993 22 9.98 508 1001 1086 031 2 05/24/04 11:00 UBR 13.6 0.97 82 8.5 2.993 22 9.98 508 1007 1086 032 2 05/24/04 12:00 UBR 14.2 0.97 87 8.9 2.993 24 9.98 508 1018 1096 033 2 05/24/04 13:00 UBR 14.6 0.97 91 9.2 2.973 22 9.98 508 1198 1086 034 2 05/24/04 14:00 UBR 15.2 0.97 96 9.6 2.963 21 9.98 508 1198 1086 035 2 05/24/04 15:00 UBR 15.7 0.97 100 9.9 2.943 28 9.98 508 1271 1086 036 2 05/24/04 16:00 UBR 16.1 0.97 103 10.1 2.983 23 10 516 1271 1086 037 2 05/24/04 17:00 UBR 16.1 0.97 103 10.1 3.173 40 10.1 550 1264 1076 038 2 05/24/04 18:00 UBR 16.1 0.97 101 9.9 3.363 39 10.3 620 1264 1076 0

ID Event ID
Date Time Hydro Period
temp spcond DO% domgl depth Turb Border Stage
Border Flow
Oneida Flow
Soda Flow
ANOVA SIG
39 2 05/24/04 19:00 UBR 16.3 0.97 99 9.7 3.473 61 10.46 684 1271 1076 040 2 05/24/04 20:00 UBR 16.2 0.96 96 9.4 3.563 59 10.59 734 1271 971 041 2 05/24/04 21:00 UBR 15.9 0.93 89 8.8 3.673 70 10.72 784 1271 677 042 2 05/24/04 22:00 UBR 15.8 0.92 81 8 3.793 105 10.87 845 1264 623 043 2 05/24/04 23:00 UBR 15.9 0.91 76 7.4 3.883 122 11 900 1271 481 044 2 05/25/04 0:00 UBR 15.9 0.9 72 7.1 3.943 109 11.11 936 1264 266 045 2 05/25/04 1:00 UBR 15.7 0.89 69 6.9 3.983 105 11.18 959 1264 136 046 2 05/25/04 2:00 UBR 15.3 0.89 68 6.8 4.003 102 11.23 976 1264 136 047 2 05/25/04 3:00 UBR 14.8 0.89 68 6.9 3.983 107 11.29 997 1264 897 048 2 05/25/04 4:00 UBR 14.2 0.89 68 7 3.983 104 11.31 1000 1264 529 049 3 05/28/04 9:00 UBR 14.9 0.99 71 7.1 2.213 23 9.54 342 338 392 050 3 05/28/04 10:00 UBR 14.8 1 71 7.2 2.193 21 9.54 342 338 392 051 3 05/28/04 11:00 UBR 14.7 1.01 72 7.3 2.203 22 9.55 346 342 392 052 3 05/28/04 12:00 UBR 14.7 1.02 73 7.4 2.223 20 9.57 356 342 392 053 3 05/28/04 13:00 UBR 14.6 1.02 75 7.6 2.253 19 9.63 383 342 392 054 3 05/28/04 14:00 UBR 14.6 1.02 76 7.7 2.273 25 9.65 390 342 392 055 3 05/28/04 15:00 UBR 14.5 1.02 77 7.8 2.343 28 9.68 399 360 392 056 3 05/28/04 16:00 UBR 14.4 1.01 77 7.8 2.373 36 9.72 412 364 392 057 3 05/28/04 17:00 UBR 14.2 1.01 78 7.9 2.423 34 9.75 422 364 398 058 3 05/28/04 18:00 UBR 14 1 79 8.1 2.483 30 9.81 446 364 392 059 3 05/28/04 19:00 UBR 13.8 1 79 8.1 2.533 34 9.86 464 617 392 060 3 05/28/04 20:00 UBR 13.6 1 79 8.1 2.603 39 9.92 486 617 392 061 3 05/28/04 21:00 UBR 13.3 1.01 78 8.1 2.713 40 10 516 617 392 062 3 05/28/04 22:00 UBR 13.1 1.01 78 8.2 2.803 43 10.1 550 756 392 063 3 05/28/04 23:00 UBR 12.9 1.01 78 8.1 2.863 56 10.18 578 756 392 064 3 05/29/04 0:00 UBR 12.8 1 77 8.1 2.933 57 10.21 588 1177 392 065 3 05/29/04 1:00 UBR 12.6 0.99 76 8 2.973 64 10.25 602 1456 392 066 3 05/29/04 2:00 UBR 12.5 0.97 75 8 2.993 76 10.29 617 1201 392 067 3 05/29/04 3:00 UBR 12.4 0.95 74 7.9 3.033 84 10.31 624 850 392 068 3 05/29/04 4:00 UBR 12.2 0.93 74 7.9 3.153 91 10.39 654 845 392 069 3 05/29/04 5:00 UBR 12.1 0.91 74 7.9 3.283 94 10.54 711 845 392 070 3 05/29/04 6:00 UBR 11.9 0.88 73 7.9 3.413 113 10.67 765 845 392 071 3 05/29/04 7:00 UBR 11.6 0.84 73 7.9 3.573 127 10.83 829 845 392 072 3 05/29/04 8:00 UBR 11.4 0.79 74 8 3.883 145 11.08 926 845 392 073 3 05/29/04 9:00 UBR 11.3 0.75 74 8.1 4.163 152 11.42 1040 845 392 0
262 14 07/07/04 4:00 UBR 22.18 0.937 82.9 7.2 2.982 15.6 9.78 416 655 840 0263 14 07/07/04 5:00 UBR 21.9 0.929 78.7 6.87 2.993 18.3 9.82 429 655 840 0264 14 07/07/04 6:00 UBR 21.61 0.921 74.9 6.58 2.983 14.4 9.82 429 655 840 0

ID Event ID
Date Time Hydro Period
temp spcond DO% domgl depth Turb Border Stage
Border Flow
Oneida Flow
Soda Flow
ANOVA SIG
265 14 07/07/04 7:00 UBR 21.31 0.914 71.7 6.34 2.977 15.1 9.83 433 655 840 0266 14 07/07/04 8:00 UBR 21.09 0.912 70.1 6.22 2.976 13.7 9.83 433 665 942 0267 14 07/07/04 9:00 UBR 21 0.914 70 6.22 2.963 14.8 9.86 446 670 942 0268 14 07/07/04 10:00 UBR 21.08 0.919 72 6.39 2.958 15.1 9.82 429 670 942 0269 14 07/07/04 11:00 UBR 21.21 0.928 76.2 6.74 2.959 13.4 9.81 426 674 942 0270 14 07/07/04 12:00 UBR 21.61 0.939 82 7.21 2.954 13.8 9.8 422 674 942 0271 14 07/07/04 13:00 UBR 21.99 0.952 87.8 7.66 2.937 13.3 9.79 419 679 942 0272 14 07/07/04 14:00 UBR 22.48 0.963 95.1 8.22 2.885 15.2 9.79 419 699 942 0273 14 07/07/04 15:00 UBR 22.95 0.971 100.8 8.63 2.84 14.7 9.79 419 699 942 0274 14 07/07/04 16:00 UBR 22.98 0.975 104.6 8.95 2.833 14.8 9.81 426 699 942 0275 14 07/07/04 17:00 UBR 22.73 0.975 105.6 9.08 2.825 16.5 9.79 419 699 942 0276 14 07/07/04 18:00 UBR 22.64 0.975 105.7 9.11 2.858 13.7 9.79 419 699 942 0277 14 07/07/04 19:00 UBR 22.46 0.974 104.7 9.05 2.855 15 9.78 416 699 950 0278 14 07/07/04 20:00 UBR 22.3 0.972 103.4 8.97 2.881 13.9 9.79 419 699 942 0279 14 07/07/04 21:00 UBR 22.08 0.969 99.9 8.7 2.879 13.7 9.81 426 699 942 0280 14 07/07/04 22:00 UBR 21.95 0.964 97.7 8.53 2.945 20.1 9.79 419 699 942 0281 14 07/07/04 23:00 UBR 21.77 0.958 93.9 8.22 2.977 16.7 9.85 439 699 942 0282 14 07/08/04 0:00 UBR 21.63 0.954 90.1 7.91 3.023 18.3 9.89 457 699 932 0283 14 07/08/04 1:00 UBR 21.5 0.947 86.6 7.63 3.063 17.5 9.91 464 699 940 0284 14 07/08/04 2:00 UBR 21.37 0.94 82.9 7.32 3.063 21.9 9.97 486 699 932 0285 14 07/08/04 3:00 UBR 21.13 0.927 78.9 7 3.086 31.4 9.98 490 699 940 0286 14 07/08/04 4:00 UBR 20.89 0.926 75.3 6.71 3.088 17.6 9.94 475 699 940 0287 14 07/08/04 5:00 UBR 20.72 0.921 72.9 6.51 3.098 19.1 9.95 479 699 947 0288 14 07/08/04 6:00 UBR 20.59 0.914 70.7 6.33 3.091 17.5 9.95 479 699 940 0289 14 07/08/04 7:00 UBR 20.45 0.914 69.1 6.21 3.094 18.3 9.9 460 699 940 0290 14 07/08/04 8:00 UBR 20.32 0.921 68.4 6.17 3.111 17.1 9.95 479 719 947 0291 14 07/08/04 9:00 UBR 20.21 0.931 69.1 6.24 3.133 52.4 9.96 482 750 947 0292 14 07/08/04 10:00 UBR 20.29 0.941 71.9 6.49 3.144 27.3 9.97 486 744 947 0293 14 07/08/04 11:00 UBR 20.52 0.949 76.1 6.83 3.145 17.8 9.98 490 674 947 0294 14 07/08/04 12:00 UBR 20.9 0.954 82.4 7.34 3.143 15 9.93 471 750 947 0295 14 07/08/04 13:00 UBR 21.41 0.957 88.5 7.81 3.13 17.2 9.95 479 750 947 0296 14 07/08/04 14:00 UBR 22.09 0.959 95.5 8.32 3.105 15.3 9.96 482 750 947 0297 14 07/08/04 15:00 UBR 22.82 0.962 101.9 8.75 3.104 14.5 9.92 468 755 947 0298 14 07/08/04 16:00 UBR 23.44 0.965 107.8 9.15 3.093 13.1 9.95 479 755 947 0299 14 07/08/04 17:00 UBR 23.95 0.966 112.8 9.48 3.075 14.8 10.09 533 755 947 0300 14 07/08/04 18:00 UBR 24.1 0.967 115.8 9.7 3.078 15.5 9.94 475 755 947 0301 14 07/08/04 19:00 UBR 24.09 0.965 117.2 9.82 3.077 13.2 9.98 490 755 947 0302 14 07/08/04 20:00 UBR 24.01 0.963 117.4 9.86 3.053 15.1 9.95 479 755 947 0

ID Event ID
Date Time Hydro Period
temp spcond DO% domgl depth Turb Border Stage
Border Flow
Oneida Flow
Soda Flow
ANOVA SIG
303 14 07/08/04 21:00 UBR 23.85 0.96 115.8 9.75 3.054 14.9 9.98 490 755 947 0304 14 07/08/04 22:00 UBR 23.69 0.955 112.8 9.53 3.089 14.7 9.94 475 755 947 0305 14 07/08/04 23:00 UBR 23.48 0.949 108.2 9.17 3.135 18.4 9.99 493 755 947 0306 14 07/09/04 0:00 UBR 23.35 0.943 103.3 8.78 3.168 17.1 9.98 490 754 945 0307 14 07/09/04 1:00 UBR 23.17 0.94 98.2 8.37 3.182 16.4 10.04 512 754 945 0308 14 07/09/04 2:00 UBR 23.02 0.933 93.1 7.96 3.192 14.7 10.07 527 754 945 0309 14 07/09/04 3:00 UBR 22.84 0.922 88.1 7.56 3.204 16.5 10.05 516 754 945 0310 14 07/09/04 4:00 UBR 22.57 0.914 82.8 7.15 3.202 18.5 10.07 527 754 945 0311 14 07/09/04 5:00 UBR 22.27 0.906 77.9 6.76 3.22 18.3 10.05 516 754 945 0312 14 07/09/04 6:00 UBR 21.93 0.9 73.9 6.45 3.234 14.9 10.07 527 759 953 0313 14 07/09/04 7:00 UBR 21.58 0.898 70.6 6.21 3.236 18.7 10.04 512 759 953 0314 14 07/09/04 8:00 UBR 21.25 0.901 68.7 6.08 3.231 15.8 10.04 512 822 953 0315 14 07/09/04 9:00 UBR 21.03 0.908 68.9 6.13 3.228 19.2 10.03 508 843 953 0316 14 07/09/04 10:00 UBR 20.97 0.917 71.5 6.36 3.222 17.8 10.02 505 859 953 0317 14 07/09/04 11:00 UBR 20.96 0.927 76.1 6.77 3.221 18.4 10.07 527 859 961 0318 14 07/09/04 12:00 UBR 21.24 0.938 81.9 7.25 3.217 18 10.08 530 859 961 0319 14 07/09/04 13:00 UBR 21.69 0.947 88.8 7.79 3.198 17.8 10.04 512 859 953 0320 14 07/09/04 14:00 UBR 22.26 0.952 96.1 8.34 3.189 16.1 10.04 512 897 953 0321 14 07/09/04 15:00 UBR 22.51 0.954 101.7 8.79 3.174 16.8 10.03 508 902 961 0322 14 07/09/04 16:00 UBR 22.94 0.954 107.7 9.23 3.148 15.2 10.04 512 902 961 0323 14 07/09/04 17:00 UBR 23.36 0.954 112.8 9.59 3.155 14.9 10.04 512 902 961 0324 14 07/09/04 18:00 UBR 23.52 0.952 116.1 9.84 3.175 18.3 10.09 533 902 961 0325 14 07/09/04 19:00 UBR 23.61 0.949 118.5 10.02 3.225 18.1 10.13 547 902 961 0326 14 07/09/04 20:00 UBR 23.65 0.948 118.6 10.02 3.28 20.5 10.2 571 897 961 0327 14 07/09/04 21:00 UBR 23.55 0.942 115.9 9.82 3.312 22.4 10.21 574 897 961 0328 14 07/09/04 22:00 UBR 23.32 0.935 112.3 9.55 3.332 22.8 10.25 592 897 961 0329 14 07/09/04 23:00 UBR 23.1 0.924 106.8 9.12 3.369 27.8 10.05 516 897 961 0330 14 07/10/04 0:00 UBR 22.98 0.915 101.4 8.68 3.401 25.5 10.29 606 896 951 0331 14 07/10/04 1:00 UBR 22.75 0.908 95.1 8.18 3.429 26.3 10.25 592 896 951 0332 14 07/10/04 2:00 UBR 22.59 0.903 89.6 7.73 3.459 25.9 10.35 628 896 951 0333 14 07/10/04 3:00 UBR 22.4 0.896 84 7.27 3.48 23 10.31 613 896 951 0334 14 07/10/04 4:00 UBR 22.1 0.89 78.7 6.85 3.495 27.7 10.34 624 896 959 0335 14 07/10/04 5:00 UBR 21.72 0.889 74.2 6.51 3.53 25.2 10.34 624 896 959 0336 14 07/10/04 6:00 UBR 21.27 0.891 70.8 6.26 3.546 21.7 10.35 628 896 959 0337 14 07/10/04 7:00 UBR 20.82 0.894 68.6 6.13 3.571 19 10.33 620 896 959 0338 14 07/10/04 8:00 UBR 20.44 0.902 68.2 6.13 3.58 29 10.35 628 896 959 0339 14 07/10/04 9:00 UBR 20.18 0.91 70.1 6.33 3.594 18.1 10.34 624 896 959 0340 14 07/10/04 10:00 UBR 20.13 0.917 74 6.7 3.594 17.2 10.32 617 896 967 0

ID Event ID
Date Time Hydro Period
temp spcond DO% domgl depth Turb Border Stage
Border Flow
Oneida Flow
Soda Flow
ANOVA SIG
341 14 07/10/04 11:00 UBR 20.32 0.924 79.4 7.15 3.595 25.2 10.36 631 886 959 0528 32 08/21/04 19:00 SBF 21.73 1.188 15.9 1.4 3.412 5.2 10.33 592 890 733 0.007529 32 08/21/04 20:00 SBF 21.86 1.182 15.8 1.38 3.407 5.3 10.28 571 896 733 0.007530 32 08/21/04 21:00 SBF 21.92 1.238 14.4 1.25 3.433 5.3 10.32 588 896 733 0.007531 32 08/21/04 22:00 SBF 21.98 1.247 13.9 1.21 3.484 5.6 10.32 588 890 733 0.007532 32 08/21/04 23:00 SBF 21.98 1.285 12.5 1.09 3.537 6.4 10.39 617 890 733 0.007533 32 08/22/04 0:00 SBF 21.97 1.308 12.6 1.1 3.568 7.1 10.36 606 890 737 0.007534 32 08/22/04 1:00 SBF 21.97 1.258 12.9 1.12 3.608 6.7 10.39 617 890 737 0.007535 32 08/22/04 2:00 SBF 21.94 1.241 13.2 1.16 3.601 6.1 10.42 631 890 737 0.007536 32 08/22/04 3:00 SBF 21.9 1.345 11.9 1.04 3.603 6.8 10.38 613 890 737 0.007537 32 08/22/04 4:00 SBF 21.83 1.263 12.8 1.12 3.651 6 10.49 661 890 737 0.007538 32 08/22/04 5:00 SBF 21.74 1.283 13.4 1.18 3.723 5.7 10.54 684 885 737 0.007539 32 08/22/04 6:00 SBF 21.67 1.264 12.4 1.09 3.804 6.7 10.56 692 885 737 0.007540 32 08/22/04 7:00 SBF 21.54 1.359 13.6 1.2 3.86 6.1 10.72 765 885 737 0.007541 32 08/22/04 8:00 SBF 21.34 1.242 14.7 1.3 3.873 5.9 10.76 784 692 640 0.007542 32 08/22/04 9:00 SBF 21.07 1.229 15.7 1.39 3.871 4.8 10.7 757 595 640 0.007543 32 08/22/04 10:00 SBF 20.48 1.09 17.7 1.59 3.867 3.5 10.7 757 595 640 0.007544 32 08/22/04 11:00 SBF 20.62 1.109 17.8 1.6 3.854 4.4 10.79 796 648 640 0.007545 32 08/22/04 12:00 SBF 20.46 1.148 17.3 1.56 3.852 9.5 10.74 773 648 640 0.007546 32 08/22/04 13:00 SBF 20.38 1.15 17.4 1.57 3.831 8.3 10.93 866 648 640 0.007849 32 08/20/04 23:00 SBF 22.18 1.153 18.1 1.57 3.291 12.6 10 471 667 729 0.007850 32 08/21/04 0:00 SBF 22.02 1.112 18.5 1.61 3.299 18.9 10.01 475 667 733 0.007851 32 08/21/04 1:00 SBF 21.86 1.106 20.8 1.82 3.348 9.5 10.04 486 667 733 0.007852 32 08/21/04 2:00 SBF 21.77 1.101 19.6 1.72 3.419 10.8 10.1 508 667 733 0.007853 32 08/21/04 3:00 SBF 21.66 1.071 21.2 1.86 3.492 14.1 10.15 527 667 733 0.007854 32 08/21/04 4:00 SBF 21.63 1.083 21.5 1.88 3.533 13.2 10.22 550 667 733 0.007855 32 08/21/04 5:00 SBF 21.6 1.126 20.7 1.82 3.556 10.2 10.31 585 667 733 0.007856 32 08/21/04 6:00 SBF 21.5 1.154 20.4 1.79 3.56 9.9 10.29 578 667 733 0.007857 32 08/21/04 7:00 SBF 21.45 1.166 20.3 1.78 3.573 12.5 10.27 567 667 733 0.007858 32 08/21/04 8:00 SBF 21.13 1.069 20.9 1.85 3.574 9 10.29 578 667 733 0.007859 32 08/21/04 9:00 SBF 20.96 1.053 22.9 2.04 3.573 9.6 10.31 585 667 733 0.007860 32 08/21/04 10:00 SBF 20.72 1.018 23.6 2.11 3.57 2.9 10.34 595 667 733 0.007861 32 08/21/04 11:00 SBF 20.69 1.025 24.3 2.17 3.553 2.9 10.36 606 692 733 0.007862 32 08/21/04 12:00 SBF 20.77 1.11 20.9 1.86 3.552 3.2 10.34 595 722 733 0.007863 32 08/21/04 13:00 SBF 20.85 1.137 16.2 1.45 3.539 3.6 10.04 600 748 733 0.007864 32 08/21/04 14:00 SBF 20.89 1.172 16.5 1.47 3.533 3.9 10.35 602 748 733 0.007865 32 08/21/04 15:00 SBF 21.01 1.161 15.6 1.39 3.522 4.3 10.39 617 748 733 0.007866 32 08/21/04 16:00 SBF 21.15 1.207 15.3 1.35 3.497 4.5 10.32 588 742 733 0.007

ID Event ID
Date Time Hydro Period
temp spcond DO% domgl depth Turb Border Stage
Border Flow
Oneida Flow
Soda Flow
ANOVA SIG
867 32 08/21/04 17:00 SBF 21.29 1.206 14.7 1.3 3.472 4.8 10.3 581 742 733 0.007868 32 08/21/04 18:00 SBF 21.46 1.207 15.2 1.34 3.437 4.6 10.31 585 742 733 0.007991 81 10/20/04 10:00 SBF 10.38 1.011 46.9 5.23 2.334 5.5 9.64 370 226 46 0992 81 10/20/04 12:00 SBF 10.41 1.052 46.5 5.18 2.362 6.7 9.68 386 226 46 0993 81 10/20/04 13:00 SBF 10.42 1.071 45.4 5.05 2.409 7.1 9.69 390 226 46 0994 81 10/20/04 14:00 SBF 10.43 1.083 44.8 4.99 2.441 7 9.71 396 226 160 0995 81 10/20/04 15:00 SBF 10.48 1.092 48.6 5.41 2.462 8.2 9.74 406 226 160 0996 81 10/20/04 16:00 SBF 10.51 1.098 45.7 5.08 2.523 7.3 9.77 419 229 160 0997 81 10/20/04 17:00 SBF 10.48 1.1 43.7 4.87 2.549 10 9.79 426 229 160 0998 81 10/20/04 18:00 SBF 10.47 1.105 43.3 4.82 2.602 9.8 9.82 436 226 160 0999 81 10/20/04 19:00 SBF 10.44 1.112 41.4 4.61 2.635 16.3 9.84 443 229 160 0
1000 81 10/20/04 20:00 SBF 10.4 1.117 38.6 4.3 2.688 13.7 9.86 450 229 160 01001 81 10/20/04 21:00 SBF 10.34 1.119 36.8 4.11 2.673 17.3 9.88 457 229 160 01478 134 03/19/05 15:00 LBR 6.93 0.982 89.7 10.88 2.994 86.4 11.04 913 787 606 01479 134 03/19/05 16:00 LBR 7.16 0.981 90.9 10.96 2.985 87.7 11.05 916 787 606 01480 134 03/19/05 17:00 LBR 7.36 0.978 91.9 11.02 2.967 86.9 11.08 926 787 606 01481 134 03/19/05 18:00 LBR 7.43 0.974 92.5 11.07 2.965 84.4 11.09 930 787 606 01482 134 03/19/05 19:00 LBR 7.52 0.97 92.8 11.09 2.978 83.3 11.07 923 787 606 01483 134 03/19/05 20:00 LBR 7.68 0.967 93.2 11.09 3.004 82 11.09 930 787 606 01484 134 03/19/05 21:00 LBR 7.82 0.964 93.1 11.04 3.027 87.4 11.1 933 792 606 01485 134 03/19/05 22:00 LBR 7.88 0.962 92.9 11 3.066 89.4 11.09 930 792 606 01486 134 03/19/05 23:00 LBR 7.89 0.963 92.2 10.91 3.058 95.2 11.1 933 787 606 01487 134 03/20/05 0:00 LBR 7.84 0.964 90.9 10.78 3.064 99.8 11.16 953 787 606 01488 134 03/20/05 1:00 LBR 7.79 0.964 89.6 10.64 3.088 108.3 11.19 963 787 606 01489 134 03/20/05 2:00 LBR 7.64 0.965 88 10.48 3.104 115.4 11.16 953 787 606 01490 134 03/20/05 3:00 LBR 7.39 0.967 86.2 10.33 3.132 135 11.24 980 787 606 01491 134 03/20/05 4:00 LBR 7.09 0.964 84.2 10.17 3.157 167.1 11.26 986 787 606 01492 134 03/20/05 5:00 LBR 6.79 0.959 82.3 10.01 3.188 219.4 11.27 990 787 606 01493 134 03/20/05 6:00 LBR 6.48 0.954 80.9 9.92 3.196 278.3 11.32 1010 787 606 01501 136 03/20/05 23:00 LBR 6.4 0.899 87 10.69 3.483 275.6 11.22 1050 926 606 0.0031502 136 03/21/05 0:00 LBR 6.35 0.9 86.8 10.69 3.528 289.2 11.52 1070 932 606 0.0031503 136 03/21/05 1:00 LBR 6.27 0.901 86.3 10.64 3.622 299.8 11.6 1100 932 606 0.0031504 136 03/21/05 2:00 LBR 6.18 0.9 85.3 10.54 3.712 360.6 11.72 1140 932 606 0.0031505 136 03/21/05 3:00 LBR 6.01 0.891 83.6 10.38 3.726 439.3 11.8 1160 932 606 0.0031506 136 03/21/05 4:00 LBR 5.8 0.878 82.1 10.24 3.731 512.8 11.87 1190 932 606 0.0031507 137 03/23/05 2:00 LBR 6.47 0.958 86.9 10.66 2.723 120.8 11.01 903 665 330 01508 137 03/23/05 3:00 LBR 6.43 0.959 85.7 10.52 2.717 118.9 11.01 903 665 330 01509 137 03/23/05 4:00 LBR 6.35 0.959 84.7 10.42 2.716 122.3 11.03 910 665 330 0

ID Event ID
Date Time Hydro Period
temp spcond DO% domgl depth Turb Border Stage
Border Flow
Oneida Flow
Soda Flow
ANOVA SIG
1510 137 03/23/05 5:00 LBR 6.24 0.957 83.5 10.3 2.714 172 11.06 920 665 330 01511 137 03/23/05 6:00 LBR 6.06 0.955 82.6 10.23 2.707 135.9 11.08 926 665 330 01512 137 03/23/05 7:00 LBR 5.88 0.953 81.5 10.15 2.71 143 11.11 936 665 330 01513 137 03/23/05 8:00 LBR 5.72 0.949 80.8 10.1 2.74 158.6 11.13 943 665 330 01514 137 03/23/05 9:00 LBR 5.6 0.945 80.2 10.06 2.749 166.6 11.15 949 665 330 01515 137 03/23/05 10:00 LBR 5.53 0.941 79.9 10.03 2.783 185.1 11.21 970 665 330 01516 137 03/23/05 11:00 LBR 5.47 0.938 79.8 10.04 2.796 199.7 11.22 973 665 330 01517 137 03/23/05 12:00 LBR 5.48 0.936 79.8 10.04 2.805 210.5 11.25 983 665 330 01518 137 03/23/05 13:00 LBR 5.54 0.933 80 10.05 2.846 213.3 11.3 1000 665 330 01519 137 03/23/05 14:00 LBR 5.62 0.932 80.1 10.05 2.863 216 11.3 1000 665 330 01520 137 03/23/05 15:00 LBR 5.78 0.934 80.8 10.08 2.879 220 11.33 1010 665 330 01521 137 03/23/05 16:00 LBR 5.95 0.936 81 10.07 2.906 231.5 11.37 1020 665 330 01522 137 03/23/05 17:00 LBR 6.07 0.936 81.5 10.1 2.932 260 11.4 1030 665 330 01523 137 03/23/05 18:00 LBR 6.14 0.932 81.7 10.1 2.978 311.3 11.45 1050 665 330 01524 137 03/23/05 19:00 LBR 6.13 0.927 81.7 10.11 3.016 360.3 11.47 1050 670 330 01525 137 03/23/05 20:00 LBR 6.12 0.92 81.2 10.05 3.075 410.5 11.5 1060 670 330 01526 137 03/23/05 21:00 LBR 6.12 0.913 81 10.03 3.116 454.8 11.51 1070 665 336 01527 137 03/23/05 22:00 LBR 6.13 0.907 80.8 10 3.152 490.2 11.54 1080 665 330 01539 139 04/04/05 17:00 LBR 6.68 0.903 234.1 28.56 3.462 50.9 11.58 1090 1142 825 01540 139 04/04/05 18:00 LBR 6.82 0.902 222.3 27.03 3.567 49 11.63 1110 1142 825 01541 139 04/04/05 19:00 LBR 6.98 0.896 388.7 47.08 3.685 52.4 11.7 1130 1148 825 01542 139 04/04/05 20:00 LBR 7.03 0.89 290.1 35.09 3.805 60.8 11.84 1180 1268 825 01543 139 04/04/05 21:00 LBR 7 0.882 364 44.07 3.901 69.4 11.95 1210 1274 825 01544 139 04/04/05 22:00 LBR 6.96 0.881 206.6 25.04 4.011 80.2 12.03 1240 1274 825 01545 139 04/04/05 23:00 LBR 6.99 0.883 212.2 25.69 4.091 79.1 12.14 1280 1280 825 01546 139 04/05/05 0:00 LBR 7 0.882 207.1 25.07 4.169 87.5 12.23 1310 1280 827 01547 139 04/05/05 1:00 LBR 6.97 0.883 166.6 20.18 4.237 106.1 12.31 1340 1274 827 01548 139 04/05/05 2:00 LBR 6.89 0.885 260.7 31.65 4.233 119.2 12.33 1350 1274 827 01549 139 04/05/05 3:00 LBR 6.69 0.886 193.1 23.56 4.261 130 12.36 1360 1274 827 01550 139 04/05/05 4:00 LBR 6.44 0.885 180.1 22.11 4.284 133.9 12.41 1380 1268 827 01627 145 04/15/05 1:00 LBR 9.4 0.785 100.6 11.49 3.737 71.5 11.06 920 1049 325 01628 145 04/15/05 2:00 LBR 9.21 0.769 97.7 11.21 3.853 68 11.25 983 1177 320 01629 145 04/15/05 3:00 LBR 8.88 0.75 95 10.99 3.949 69.1 11.48 1060 1177 325 01630 145 04/15/05 4:00 LBR 8.36 0.744 93.2 10.91 4.03 65.4 11.6 1100 1177 320 01631 145 04/15/05 5:00 LBR 7.86 0.742 91.9 10.9 4.088 62 11.75 1150 1177 325 01632 145 04/15/05 6:00 LBR 7.51 0.735 91.1 10.9 4.105 59 11.86 1180 1177 320 01633 145 04/15/05 7:00 LBR 7.19 0.734 91.2 10.99 4.122 55 11.85 1180 1177 325 01634 145 04/15/05 8:00 LBR 6.96 0.739 92.1 11.16 4.135 57.5 11.92 1200 1177 320 0

ID Event ID
Date Time Hydro Period
temp spcond DO% domgl depth Turb Border Stage
Border Flow
Oneida Flow
Soda Flow
ANOVA SIG
1635 145 04/15/05 9:00 LBR 6.97 0.743 93.4 11.32 4.128 49 11.97 1220 1177 320 01636 145 04/15/05 10:00 LBR 7.2 0.743 94.8 11.43 4.109 49.2 11.95 1210 1049 320 01637 145 04/15/05 11:00 LBR 7.6 0.741 96.6 11.52 4.033 47.1 12.02 1240 867 320 01638 145 04/15/05 12:00 LBR 8.16 0.74 98.5 11.59 3.907 44.5 12.11 1270 651 320 01671 149 04/20/05 4:00 LBR 8.97 0.849 79 9.11 2.499 33.9 10.52 707 463 183 01672 149 04/20/05 5:00 LBR 8.87 0.843 78.2 9.04 2.526 34.4 10.52 707 463 183 01673 149 04/20/05 6:00 LBR 8.67 0.837 77.7 9.03 2.563 36.1 10.54 715 463 183 01674 149 04/20/05 7:00 LBR 8.41 0.833 77.6 9.08 2.598 35.7 10.55 719 463 183 01675 149 04/20/05 8:00 LBR 8.11 0.83 78.1 9.2 2.62 36.4 10.57 726 463 183 01676 149 04/20/05 9:00 LBR 8.02 0.828 79.1 9.34 2.646 41.6 10.59 734 463 183 01677 149 04/20/05 10:00 LBR 8.19 0.83 80.7 9.49 2.663 40.2 10.58 730 463 183 01678 149 04/20/05 11:00 LBR 8.34 0.832 82.6 9.67 2.699 41 10.58 730 463 183 01679 149 04/20/05 12:00 LBR 8.35 0.832 84.3 9.87 2.707 41.2 10.62 745 463 183 01680 149 04/20/05 13:00 LBR 8.43 0.835 85.8 10.04 2.726 41.8 10.6 738 463 183 01681 149 04/20/05 14:00 LBR 8.52 0.84 87.3 10.18 2.742 41.8 10.58 730 463 183 01682 149 04/20/05 15:00 LBR 8.58 0.844 88.5 10.31 2.784 40.5 10.63 749 463 183 01683 149 04/20/05 16:00 LBR 8.52 0.847 89.8 10.47 2.795 41 10.62 745 463 183 01684 149 04/20/05 17:00 LBR 8.57 0.846 91.4 10.64 2.826 42.2 10.64 753 471 183 01685 149 04/20/05 18:00 LBR 8.5 0.843 92.7 10.82 2.852 42.7 10.63 749 442 183 01686 149 04/20/05 19:00 LBR 8.43 0.845 93.9 10.98 2.887 46 10.63 749 405 183 01687 149 04/20/05 20:00 LBR 8.41 0.848 94.4 11.04 2.924 47.4 10.68 769 442 183 01688 149 04/20/05 21:00 LBR 8.45 0.849 94.3 11.02 2.978 52.7 10.7 777 454 183 01689 149 04/20/05 22:00 LBR 8.51 0.849 93.8 10.94 2.985 56.8 10.7 777 493 183 01690 149 04/20/05 23:00 LBR 8.58 0.847 93.1 10.84 2.996 60.1 10.69 773 651 183 01691 149 04/21/05 0:00 LBR 8.7 0.843 92.1 10.69 3.05 61.4 10.73 788 651 182 01692 149 04/21/05 1:00 LBR 8.84 0.836 90 10.42 3.151 66.9 10.75 796 646 182 01693 149 04/21/05 2:00 LBR 8.9 0.837 88 10.17 3.241 74.7 10.8 816 665 182 01694 149 04/21/05 3:00 LBR 8.93 0.833 84.7 9.78 3.299 91.9 10.91 862 665 182 01695 149 04/21/05 4:00 LBR 8.96 0.812 81.8 9.44 3.34 106.3 11 900 665 182 01696 149 04/21/05 5:00 LBR 8.97 0.79 80.3 9.27 3.364 102.3 11.05 916 660 182 01697 149 04/21/05 6:00 LBR 8.84 0.783 79.8 9.23 3.387 101.6 11.12 939 665 182 01698 149 04/21/05 7:00 LBR 8.62 0.783 79.9 9.3 3.478 106 11.16 953 1213 182 01699 149 04/21/05 8:00 LBR 8.38 0.786 80.3 9.39 3.724 113.8 11.18 959 1213 182 01700 149 04/21/05 9:00 LBR 8.14 0.783 80.9 9.52 3.985 118.8 11.38 1030 1213 182 01701 149 04/21/05 10:00 LBR 8.05 0.758 81.5 9.62 4.144 122.1 11.64 1110 1213 182 01702 149 04/21/05 11:00 LBR 8.14 0.719 82.4 9.71 4.199 107.6 11.83 1170 736 182 01703 149 04/21/05 12:00 LBR 8.31 0.711 83.2 9.76 4.11 90.5 12.01 1230 736 182 01737 155 04/28/05 6:00 LBR 10.18 0.666 90 10.09 3.956 47.5 12.59 1440 1010 733 0

ID Event ID
Date Time Hydro Period
temp spcond DO% domgl depth Turb Border Stage
Border Flow
Oneida Flow
Soda Flow
ANOVA SIG
1738 155 04/28/05 7:00 LBR 10.01 0.667 89.5 10.08 3.994 47.4 12.66 1470 1090 733 01739 155 04/28/05 8:00 LBR 9.77 0.665 89.9 10.18 4.047 48.7 12.67 1470 1090 733 01740 155 04/28/05 9:00 LBR 9.46 0.664 89.9 10.26 4.112 75.3 12.72 1490 1172 733 01741 155 04/28/05 10:00 LBR 9.21 0.661 90 10.33 4.172 139.3 12.85 1540 1090 733 01742 155 04/28/05 11:00 LBR 8.98 0.663 90 10.38 4.286 115.4 12.85 1540 1528 733 01743 155 04/28/05 12:00 LBR 8.82 0.665 90 10.43 4.463 99.3 12.92 1560 1623 733 01744 155 04/28/05 13:00 LBR 8.76 0.663 89.9 10.43 4.717 116.5 12.45 1600 1720 733 01745 155 04/28/05 14:00 LBR 8.67 0.646 90.4 10.51 4.934 137.8 13.39 1750 1528 733 01746 155 04/28/05 15:00 LBR 8.72 0.635 90.4 10.51 5.08 160 13.7 1870 1720 733 01747 155 04/28/05 16:00 LBR 8.97 0.637 89.8 10.37 5.194 178.3 13.98 1990 1720 733 01748 155 04/28/05 17:00 LBR 9.18 0.64 89.8 10.32 5.254 195.3 14.21 2080 1623 733 01749 155 04/28/05 18:00 LBR 9.25 0.639 90 10.32 5.313 212 14.37 2150 1623 733 01750 155 04/28/05 19:00 LBR 9.3 0.64 90.4 10.35 5.359 205.2 14.54 2230 1623 733 01751 155 04/28/05 20:00 LBR 9.31 0.642 90.5 10.36 5.389 211.2 14.62 2260 1623 733 01809 162 05/08/05 19:00 UBR 13.31 0.668 95.1 9.93 4.571 68.4 13.19 1670 1550 686 0.0051810 162 05/08/05 20:00 UBR 13.29 0.654 93.7 9.8 4.692 67.8 13.35 1730 1550 693 0.0051811 162 05/08/05 21:00 UBR 13.29 0.633 91.9 9.6 4.784 64.8 13.51 1790 1550 686 0.0051812 162 05/08/05 22:00 UBR 13.46 0.628 89.7 9.34 4.827 60.3 13.64 1850 1550 686 0.0051813 162 05/08/05 23:00 UBR 13.47 0.632 87.7 9.13 4.867 61.3 13.66 1850 1203 686 0.0051814 162 05/09/05 0:00 UBR 13.28 0.632 85.9 8.98 4.823 58.8 13.73 1880 1444 684 0.0051815 162 05/09/05 1:00 UBR 13.03 0.631 84.2 8.85 4.792 54.5 13.7 1870 1438 684 0.0051829 165 05/10/05 11:00 UBR 10.05 0.736 94.7 10.66 4.172 140.4 12.89 1550 1418 719 01830 165 05/10/05 12:00 UBR 10.08 0.709 95.7 10.76 4.294 163.6 13 1590 1418 719 01831 165 05/10/05 13:00 UBR 10.19 0.675 96.3 10.8 4.436 166.8 13.81 1600 1418 719 01832 165 05/10/05 14:00 UBR 10.56 0.659 97.7 10.86 4.565 140.3 13.29 1710 1418 757 01833 165 05/10/05 15:00 UBR 11.01 0.654 99.2 10.92 4.643 121.5 13.44 1770 1425 757 01834 165 05/10/05 16:00 UBR 11.34 0.655 100.4 10.97 4.696 107.3 13.6 1830 1637 757 01835 165 05/10/05 17:00 UBR 11.64 0.66 101.7 11.03 4.783 106.2 13.64 1850 1778 757 01836 165 05/10/05 18:00 UBR 11.8 0.66 102.9 11.12 4.864 101.2 13.78 1900 1837 757 01837 165 05/10/05 19:00 UBR 11.94 0.653 104.2 11.23 4.975 99.7 13.95 1970 1829 757 01838 165 05/10/05 20:00 UBR 11.98 0.647 103.7 11.16 5.078 99.4 14.15 2060 1778 757 01839 165 05/10/05 21:00 UBR 12.01 0.646 102.1 10.99 5.152 102.9 14.23 2090 1815 757 01840 165 05/10/05 22:00 UBR 12.11 0.649 99.6 10.69 5.216 102.7 14.4 2160 1815 757 01841 165 05/10/05 23:00 UBR 12.09 0.652 98.7 10.59 5.255 102.7 13.92 2200 1815 757 01842 165 05/11/05 0:00 UBR 11.97 0.653 96.7 10.41 5.262 103.4 14.5 2210 1522 755 01843 165 05/11/05 1:00 UBR 11.71 0.651 94.6 10.24 5.241 99.6 14.48 2200 1522 755 01844 166 05/11/05 17:00 UBR 11.42 0.668 96.3 10.49 4.964 130.6 13.93 1970 1699 910 01845 166 05/11/05 18:00 UBR 11.64 0.66 98.3 10.66 5.09 126.1 14.03 2010 1685 910 0

ID Event ID
Date Time Hydro Period
temp spcond DO% domgl depth Turb Border Stage
Border Flow
Oneida Flow
Soda Flow
ANOVA SIG
1846 166 05/11/05 19:00 UBR 11.78 0.645 99.1 10.71 5.19 118.6 14.12 2050 1671 910 01847 166 05/11/05 20:00 UBR 11.9 0.643 98.9 10.66 5.25 106.8 14.22 2090 1644 917 01848 166 05/11/05 21:00 UBR 12.04 0.647 98.6 10.6 5.298 99.4 14.29 2120 1630 925 01849 166 05/11/05 22:00 UBR 12.03 0.648 97.7 10.5 5.309 95.5 14.34 2140 1582 917 01850 166 05/11/05 23:00 UBR 11.95 0.648 96.1 10.35 5.302 90.8 14.31 2130 1582 917 01974 179 06/02/05 0:00 UBR 16.1 0.61 99.5 9.78 4.152 33.6 12.61 1450 1059 639 0.0061975 179 06/02/05 1:00 UBR 15.87 0.609 96.7 9.55 4.184 33.5 12.59 1440 1059 639 0.0061976 179 06/02/05 2:00 UBR 15.53 0.608 92.5 9.21 4.21 33 12.65 1460 1059 632 0.0061977 179 06/02/05 3:00 UBR 15.1 0.607 87.2 8.76 4.223 35 12.7 1480 1059 632 0.0061978 179 06/02/05 4:00 UBR 14.65 0.605 82.2 8.34 4.229 37.4 12.74 1500 1059 632 0.0061979 179 06/02/05 5:00 UBR 14.15 0.601 79.3 8.14 4.216 35.3 12.71 1490 1059 632 0.0061980 179 06/02/05 6:00 UBR 13.66 0.601 77.7 8.05 4.22 36.4 12.72 1490 1059 632 0.0061992 181 06/05/05 22:00 UBR 16.57 0.594 127.4 12.4 4.037 18.4 12.62 1450 1299 969 0.0011993 181 06/05/05 23:00 UBR 16.59 0.594 119.5 11.63 4.065 22.4 12.64 1460 1623 977 0.0011994 181 06/06/05 0:00 UBR 16.58 0.592 111.2 10.83 4.173 21.7 12.75 1500 1597 978 0.0011995 181 06/06/05 1:00 UBR 16.42 0.592 102.5 10.01 4.294 22 12.89 1550 1597 986 0.0011996 181 06/06/05 2:00 UBR 16.06 0.595 93.8 9.23 4.442 28.1 13.03 1610 1319 978 0.0011997 181 06/06/05 3:00 UBR 15.55 0.593 88.4 8.79 4.527 30.2 13.18 1660 1215 978 0.0011998 181 06/06/05 4:00 UBR 14.96 0.593 85.5 8.62 4.506 34.8 13.24 1690 1215 970 0.0011999 182 06/07/05 21:00 UBR 12.16 0.591 86.4 9.26 4.839 51.3 13.43 1760 1518 955 0.0082000 182 06/07/05 22:00 UBR 12.05 0.576 88.1 9.47 4.906 47.9 13.54 1810 1525 963 0.0082001 182 06/07/05 23:00 UBR 12.08 0.578 88.2 9.48 4.953 46.5 13.61 1830 1518 963 0.0082002 182 06/08/05 0:00 UBR 12.17 0.583 86.6 9.28 4.963 43.3 13.67 1860 1519 963 0.0082003 182 06/08/05 1:00 UBR 12.09 0.584 84.9 9.11 4.958 44.9 13.71 1870 1519 955 0.0082004 183 06/09/05 3:00 UBR 12.34 0.565 85.4 9.12 4.639 33.3 13.24 1690 1494 956 0.0372005 183 06/09/05 4:00 UBR 11.96 0.564 83.2 8.96 4.715 34.5 13.31 1710 1494 964 0.0372006 183 06/09/05 5:00 UBR 11.67 0.559 81.5 8.83 4.759 37.1 13.39 1750 1494 964 0.0372007 183 06/09/05 6:00 UBR 11.43 0.557 80.5 8.77 4.776 37.2 13.43 1760 1494 956 0.0372008 183 06/09/05 7:00 UBR 11.27 0.56 80.3 8.78 4.797 42.9 13.46 1770 1494 964 0.0372009 183 06/09/05 8:00 UBR 11.13 0.561 80.3 8.81 4.799 46.9 13.46 1770 1494 956 0.0372010 183 06/09/05 9:00 UBR 11.07 0.561 80.8 8.88 4.811 40 13.47 1780 1494 956 0.0372372 224 08/18/05 2:00 SBF 22.31 0.983 -0.1 -0.01 2.855 10.6 10.4 661 981 1067 02373 224 08/18/05 3:00 SBF 22.14 0.981 -0.1 -0.01 2.885 13.1 10.45 681 987 1067 02374 224 08/18/05 4:00 SBF 21.87 0.98 -0.1 -0.01 2.925 12.3 10.47 688 981 1067 02375 224 08/18/05 5:00 SBF 21.67 0.981 -0.1 -0.01 2.942 11.3 10.51 704 1112 1067 02376 224 08/18/05 6:00 SBF 21.44 0.984 -0.1 -0.01 2.945 14.2 10.55 719 1112 1067 02377 224 08/18/05 7:00 SBF 21.16 0.988 -0.1 -0.01 2.962 12.3 10.58 730 1118 1075 02378 224 08/18/05 8:00 SBF 20.84 0.994 -0.1 -0.01 3.017 12.6 10.71 780 1112 1067 0
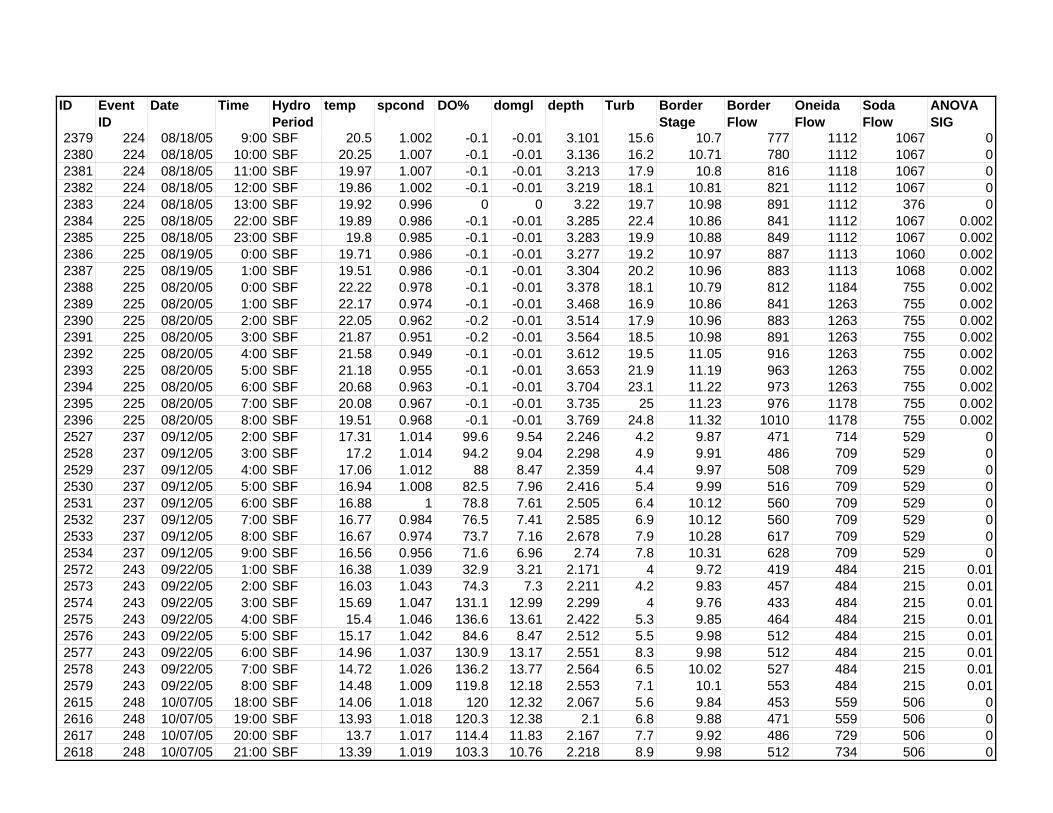
ID Event ID
Date Time Hydro Period
temp spcond DO% domgl depth Turb Border Stage
Border Flow
Oneida Flow
Soda Flow
ANOVA SIG
2379 224 08/18/05 9:00 SBF 20.5 1.002 -0.1 -0.01 3.101 15.6 10.7 777 1112 1067 02380 224 08/18/05 10:00 SBF 20.25 1.007 -0.1 -0.01 3.136 16.2 10.71 780 1112 1067 02381 224 08/18/05 11:00 SBF 19.97 1.007 -0.1 -0.01 3.213 17.9 10.8 816 1118 1067 02382 224 08/18/05 12:00 SBF 19.86 1.002 -0.1 -0.01 3.219 18.1 10.81 821 1112 1067 02383 224 08/18/05 13:00 SBF 19.92 0.996 0 0 3.22 19.7 10.98 891 1112 376 02384 225 08/18/05 22:00 SBF 19.89 0.986 -0.1 -0.01 3.285 22.4 10.86 841 1112 1067 0.0022385 225 08/18/05 23:00 SBF 19.8 0.985 -0.1 -0.01 3.283 19.9 10.88 849 1112 1067 0.0022386 225 08/19/05 0:00 SBF 19.71 0.986 -0.1 -0.01 3.277 19.2 10.97 887 1113 1060 0.0022387 225 08/19/05 1:00 SBF 19.51 0.986 -0.1 -0.01 3.304 20.2 10.96 883 1113 1068 0.0022388 225 08/20/05 0:00 SBF 22.22 0.978 -0.1 -0.01 3.378 18.1 10.79 812 1184 755 0.0022389 225 08/20/05 1:00 SBF 22.17 0.974 -0.1 -0.01 3.468 16.9 10.86 841 1263 755 0.0022390 225 08/20/05 2:00 SBF 22.05 0.962 -0.2 -0.01 3.514 17.9 10.96 883 1263 755 0.0022391 225 08/20/05 3:00 SBF 21.87 0.951 -0.2 -0.01 3.564 18.5 10.98 891 1263 755 0.0022392 225 08/20/05 4:00 SBF 21.58 0.949 -0.1 -0.01 3.612 19.5 11.05 916 1263 755 0.0022393 225 08/20/05 5:00 SBF 21.18 0.955 -0.1 -0.01 3.653 21.9 11.19 963 1263 755 0.0022394 225 08/20/05 6:00 SBF 20.68 0.963 -0.1 -0.01 3.704 23.1 11.22 973 1263 755 0.0022395 225 08/20/05 7:00 SBF 20.08 0.967 -0.1 -0.01 3.735 25 11.23 976 1178 755 0.0022396 225 08/20/05 8:00 SBF 19.51 0.968 -0.1 -0.01 3.769 24.8 11.32 1010 1178 755 0.0022527 237 09/12/05 2:00 SBF 17.31 1.014 99.6 9.54 2.246 4.2 9.87 471 714 529 02528 237 09/12/05 3:00 SBF 17.2 1.014 94.2 9.04 2.298 4.9 9.91 486 709 529 02529 237 09/12/05 4:00 SBF 17.06 1.012 88 8.47 2.359 4.4 9.97 508 709 529 02530 237 09/12/05 5:00 SBF 16.94 1.008 82.5 7.96 2.416 5.4 9.99 516 709 529 02531 237 09/12/05 6:00 SBF 16.88 1 78.8 7.61 2.505 6.4 10.12 560 709 529 02532 237 09/12/05 7:00 SBF 16.77 0.984 76.5 7.41 2.585 6.9 10.12 560 709 529 02533 237 09/12/05 8:00 SBF 16.67 0.974 73.7 7.16 2.678 7.9 10.28 617 709 529 02534 237 09/12/05 9:00 SBF 16.56 0.956 71.6 6.96 2.74 7.8 10.31 628 709 529 02572 243 09/22/05 1:00 SBF 16.38 1.039 32.9 3.21 2.171 4 9.72 419 484 215 0.012573 243 09/22/05 2:00 SBF 16.03 1.043 74.3 7.3 2.211 4.2 9.83 457 484 215 0.012574 243 09/22/05 3:00 SBF 15.69 1.047 131.1 12.99 2.299 4 9.76 433 484 215 0.012575 243 09/22/05 4:00 SBF 15.4 1.046 136.6 13.61 2.422 5.3 9.85 464 484 215 0.012576 243 09/22/05 5:00 SBF 15.17 1.042 84.6 8.47 2.512 5.5 9.98 512 484 215 0.012577 243 09/22/05 6:00 SBF 14.96 1.037 130.9 13.17 2.551 8.3 9.98 512 484 215 0.012578 243 09/22/05 7:00 SBF 14.72 1.026 136.2 13.77 2.564 6.5 10.02 527 484 215 0.012579 243 09/22/05 8:00 SBF 14.48 1.009 119.8 12.18 2.553 7.1 10.1 553 484 215 0.012615 248 10/07/05 18:00 SBF 14.06 1.018 120 12.32 2.067 5.6 9.84 453 559 506 02616 248 10/07/05 19:00 SBF 13.93 1.018 120.3 12.38 2.1 6.8 9.88 471 559 506 02617 248 10/07/05 20:00 SBF 13.7 1.017 114.4 11.83 2.167 7.7 9.92 486 729 506 02618 248 10/07/05 21:00 SBF 13.39 1.019 103.3 10.76 2.218 8.9 9.98 512 734 506 0

ID Event ID
Date Time Hydro Period
temp spcond DO% domgl depth Turb Border Stage
Border Flow
Oneida Flow
Soda Flow
ANOVA SIG
2619 248 10/07/05 22:00 SBF 13.1 1.014 90.8 9.52 2.267 11.9 10.04 533 734 506 02620 248 10/07/05 23:00 SBF 12.9 1.004 80 8.42 2.336 12.3 10.1 553 734 506 02621 248 10/08/05 0:00 SBF 12.8 0.993 71.2 7.52 2.437 15.6 10.19 585 781 509 02622 248 10/08/05 1:00 SBF 12.75 0.981 62.5 6.6 2.505 22.4 10.31 628 807 509 02623 248 10/08/05 2:00 SBF 12.7 0.972 54.8 5.8 2.543 31.5 10.39 658 807 509 02624 248 10/08/05 3:00 SBF 12.65 0.967 47.7 5.05 2.566 33.2 10.44 677 807 509 02625 248 10/08/05 4:00 SBF 12.54 0.957 41.3 4.38 2.6 27.1 10.5 700 807 509 02626 248 10/08/05 5:00 SBF 12.38 0.949 36.9 3.93 2.641 31.5 10.54 715 807 509 02627 248 10/08/05 6:00 SBF 12.22 0.948 33.6 3.59 2.672 33 10.6 738 807 509 02628 248 10/08/05 7:00 SBF 12.1 0.95 30.7 3.29 2.71 31 10.62 745 807 509 02629 248 10/08/05 8:00 SBF 11.97 0.951 29.9 3.22 2.738 32.4 10.63 749 807 509 02630 248 10/08/05 9:00 SBF 11.79 0.956 30.9 3.33 2.756 29.1 10.65 757 807 509 02631 248 10/08/05 10:00 SBF 11.59 0.959 34.8 3.77 2.769 26.1 10.66 761 807 509 0