Embed Size (px)
Citation preview

One More Example: Micro Drive Co.
This is a book example. Refer to Ch 14 Tool Kit.xls
1

2

3

4

5
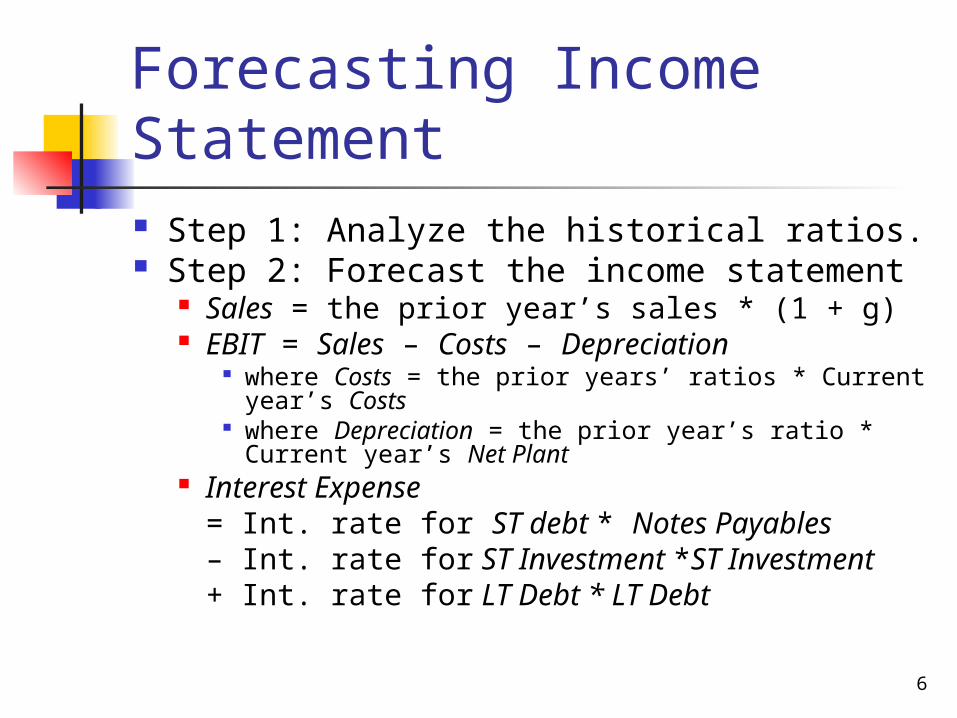
Forecasting Income Statement Step 1: Analyze the historical ratios. Step 2: Forecast the income statement
Sales = the prior year’s sales * (1 + g) EBIT = Sales – Costs – Depreciation
where Costs = the prior years’ ratios * Current year’s Costs
where Depreciation = the prior year’s ratio * Current year’s Net Plant
Interest Expense = Int. rate for ST debt * Notes Payables – Int. rate for ST Investment *ST Investment + Int. rate for LT Debt * LT Debt
6
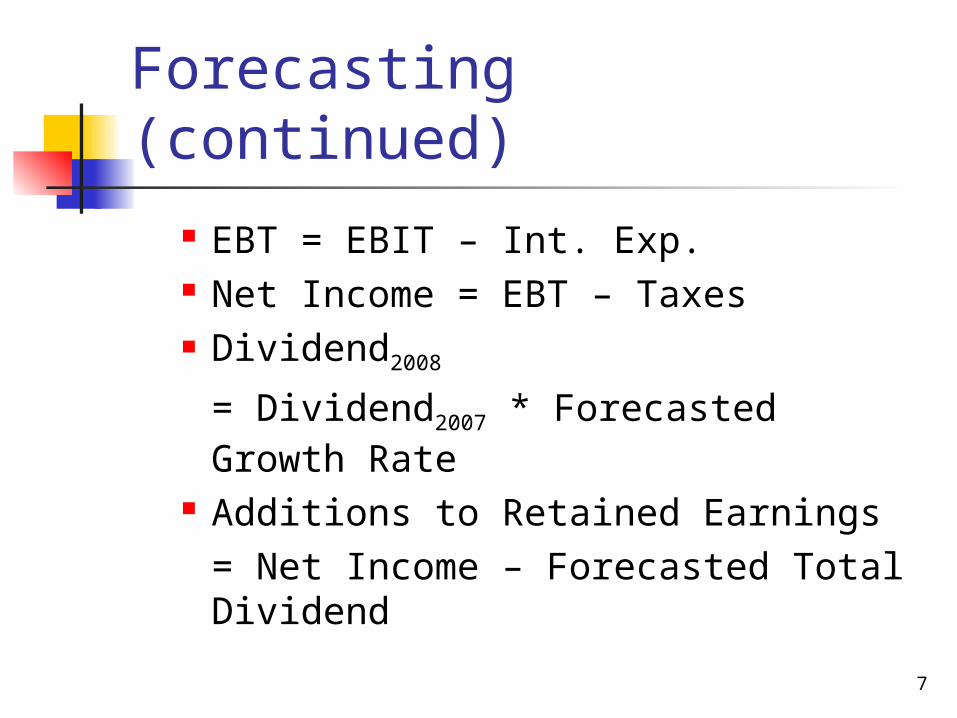
Forecasting (continued) EBT = EBIT – Int. Exp. Net Income = EBT – Taxes Dividend2008
= Dividend2007 * Forecasted Growth Rate
Additions to Retained Earnings = Net Income – Forecasted Total Dividend
7

Forecasting the Balance Sheet
Forecasting the operating asset Cash2008 = Sales2008* Cash2007/Sales2007
AR2008 = Sales2008 * AR2007/Sales2007
Inventories = the same as before
8
(Continued)
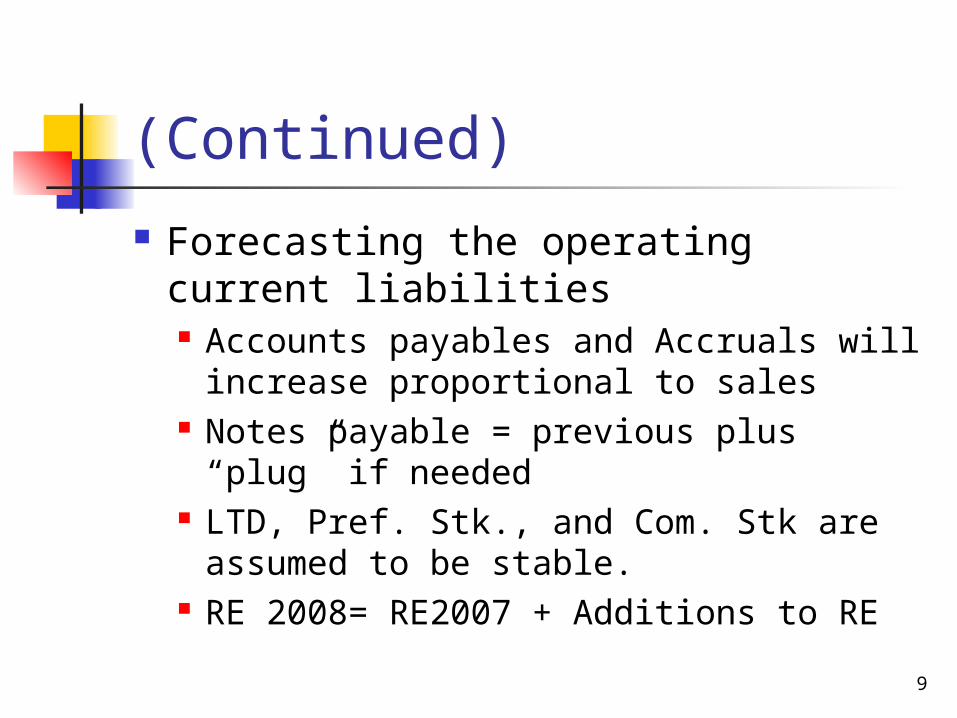
Forecasting the operating current liabilities Accounts payables and Accruals will
increase proportional to sales Notes payable = previous plus “plug” if
needed LTD, Pref. Stk., and Com. Stk are
assumed to be stable. RE 2008= RE2007 + Additions to RE
9

AFN Required assets = $2,085.3 Specified financing = $2,200 AFN = 2,200 – 2,085.3 = $114.7
additional financing is needed. We add $114.7 million into notes
payable. The plug approach : specifies the
additional amount of either notes payable or short-term investments, but not both.
10

11


![[Carrier] HMO - POS PLAN SMALL GROUP HEALTH ......Refer to N.J.A.C. 11:21-3.1 for permissible ranges. Network benefits may be structured with tiers. For an example refer to the HMO](https://img.dokumen.tips/doc/110x75/5f9bee0f7a9a892a1737ea00/carrier-hmo-pos-plan-small-group-health-refer-to-njac-1121-31.jpg)


