Embed Size (px)
Citation preview

Fact Sheet No. 48
February 2018
UIS/FS/2018/ED/48
One in Five Children, Adolescents and Youth is Out of School
This fact sheet presents the latest UIS data on education available as of
February 2018.
Three years after the adoption of Sustainable Development Goal 4 (SDG 4) and the
promise to provide universal primary and secondary education, there has been no
progress in reducing the global number of out-of-school children, adolescents and
youth. As the SDG 4–Education 2030 Steering Committee meets in Paris, the
UNESCO Institute for Statistics (UIS) has released this fact sheet, highlighting trends
at the global and regional levels, to inform discussions and provide stakeholders
with the data needed to target policies, strategies and resources to get all children,
adolescents and youth in school and learning.
Out-of-school children, adolescents and youth: Global status
and trends
No progress in reducing out-of-school numbers
In 2016, 263 million children, adolescents and youth were out of school,
representing nearly one-fifth of the global population of this age group (see Figure 1
and Table 1). The number of children, adolescents and youth who are excluded from
education fell steadily in the decade following 2000, but UIS data show that this
progress essentially stopped in recent years; the total number of out-of-school
children and youth has declined by little more than 1 million per year since 2012.
Some 63 million, or 24% of the total, are children of primary school age (about 6 to
11 years old); 61 million, or 23% of the total, are adolescents of lower secondary
school age (about 12 to 14 years old); and 139 million, or 53% of the total, are youth
of upper secondary school age (about 15 to 17 years old).
The UNESCO Institute
for Statistics (UIS) is the
statistical office of
UNESCO and is the UN
depository for global
statistics in the fields of
education, science and
technology, culture and
communication.
http://uis.unesco.org
@UNESCOstat

2 UIS Fact Sheet No. 48 | February 2018
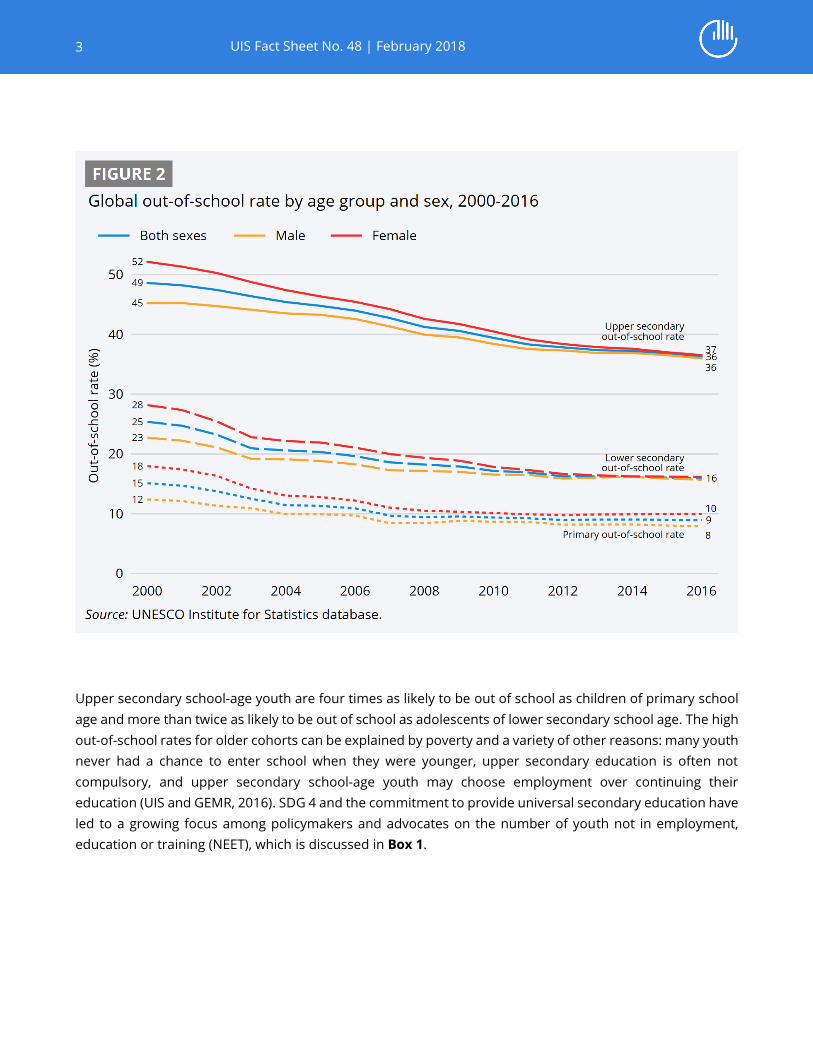
The rates of out-of-school children, adolescents and youth have followed a similar trend (see Figure 2). After
an initial decline in the years after 2000, the primary out-of-school rate has barely moved from around 9%
since 2008 and the lower secondary out-of-school rate has been at 16% since 2012. The upper secondary
out-of-school rate, which was initially at much higher levels than the primary and lower secondary out-of-
school rates, has fallen more steadily since 2000, but this trend is flattening out, with the most recent
estimate at 36%.
3 UIS Fact Sheet No. 48 | February 2018
Upper secondary school-age youth are four times as likely to be out of school as children of primary school
age and more than twice as likely to be out of school as adolescents of lower secondary school age. The high
out-of-school rates for older cohorts can be explained by poverty and a variety of other reasons: many youth
never had a chance to enter school when they were younger, upper secondary education is often not
compulsory, and upper secondary school-age youth may choose employment over continuing their
education (UIS and GEMR, 2016). SDG 4 and the commitment to provide universal secondary education have
led to a growing focus among policymakers and advocates on the number of youth not in employment,
education or training (NEET), which is discussed in Box 1.

4 UIS Fact Sheet No. 48 | February 2018
Box 1. Youth not in employment, education or training (NEET)
Out-of-school rates tend to increase with age as youth find or search for employment. But to what extent
do they have the skills to find a first job, for example? Data on employment and vocational training
provide an important perspective on the share of out-of-school youth either working or preparing for
the job market. But additional sources of information are needed to gauge the extent to which youth
are not in employment, education or training (NEET).
SDG Target 4.4 calls for a substantial increase in the number of youth and adults who have relevant
skills, including technical and vocational skills, for employment, decent jobs and entrepreneurship. To
monitor this target, additional indicators are required, especially on skills. The risk of falling within the
NEET category is generally associated with low educational attainment and weak information-
processing skills, such as poor literacy and numeracy.
As part of efforts to respond to the need for better data, the UIS is examining if the youth NEET rate for
the population aged 15 to 24 years could represent a valuable indicator. Specific questions studied by
the UIS include: What relation exists between youth NEET and youth levels of educational attainment?
How could NEET rates by sex, age group, location, educational attainment and national income inform
basic skills acquisition by youth and their preparation for labour market entry?
This work by the UIS makes use of NEET data produced by the International Labour Organization (ILO).
The NEET rate is a well-established measure that is also the official indicator for SDG Target 8.6 (“By
2020, substantially reduce the proportion of youth not in employment, education or training”).
Currently, NEET data are available for nearly 100 countries. Preliminary results from the analysis by the
UIS were presented to the Technical Cooperation Group on SDG 4–Education 2030 Indicators (TCG),
which met in January 2018. The TCG endorsed the work by the UIS and requested a progress report at
a future meeting.

5 UIS Fact Sheet No. 48 | February 2018
Table 1. Out-of-school rates and numbers by SDG region, 2016
Out-of-school children of primary school age
Region Out-of-school rate (%) Out-of-school number (millions)
Both sexes Male Female GPIA Both sexes Male Female
Europe and Northern America 3.8 4.1 3.4 0.84 2.5 1.4 1.1
Latin America and the Caribbean 5.0 5.5 4.4 0.80 3.0 1.7 1.3
Central Asia 3.3 2.8 3.8 1.27 0.2 0.1 0.1
Southern Asia 5.6 4.9 6.4 1.24 10.3 4.7 5.6
Eastern and South-Eastern Asia 4.2 3.7 4.7 1.20 7.2 3.4 3.8
Northern Africa and Western Asia 10.9 10.0 11.8 1.15 5.8 2.7 3.1
Sub-Saharan Africa 20.8 18.1 23.5 1.23 34.1 14.9 19.1
Oceania 7.4 6.5 8.3 1.22 0.3 0.1 0.2
World 8.9 7.9 10.0 1.21 63.3 29.1 34.3
Out-of-school adolescents of lower secondary school age
Region Out-of-school rate (%) Out-of-school number (millions)
Both sexes Male Female GPIA Both sexes Male Female
Europe and Northern America 2.1 2.4 1.9 0.81 0.9 0.5 0.4
Latin America and the Caribbean 7.6 7.9 7.2 0.90 2.7 1.5 1.3
Central Asia 5.8 4.8 6.9 1.30 0.3 0.1 0.2
Southern Asia 17.2 18.3 15.9 0.87 18.2 10.2 8.0
Eastern and South-Eastern Asia 9.0 9.3 8.6 0.92 8.0 4.4 3.6
Northern Africa and Western Asia 13.7 11.1 16.3 1.32 3.9 1.6 2.3
Sub-Saharan Africa 36.6 34.5 38.8 1.11 27.0 12.8 14.2
Oceania 2.4 2.5 2.3 0.92 0.0 0.0 0.0
World 15.9 15.7 16.2 1.03 61.1 31.1 30.0
Out-of-school youth of upper secondary school age
Region Out-of-school rate (%) Out-of-school number (millions)
Both sexes Male Female GPIA Both sexes Male Female
Europe and Northern America 7.6 8.2 7.0 0.86 2.8 1.5 1.3
Latin America and the Caribbean 22.2 22.8 21.6 0.94 6.9 3.6 3.3
Central Asia 18.5 17.5 19.4 1.10 0.5 0.3 0.3
Southern Asia 48.4 47.2 49.7 1.05 67.3 34.4 32.9
Eastern and South-Eastern Asia 19.3 23.0 15.2 0.66 15.8 9.9 5.9
Northern Africa and Western Asia 33.0 30.8 35.4 1.13 8.8 4.2 4.6
Sub-Saharan Africa 57.8 54.3 61.3 1.11 35.8 17.0 18.9
Oceania 32.9 37.9 27.6 0.73 0.5 0.3 0.2
World 36.3 36.0 36.5 1.01 138.5 71.1 67.4
Out-of-school children, adolescents and youth of primary, lower secondary and upper secondary age
Region Out-of-school rate (%) Out-of-school number (millions)
Both sexes Male Female GPIA Both sexes Male Female
Europe and Northern America 4.3 4.6 3.9 0.85 6.2 3.4 2.8
Latin America and the Caribbean 9.9 10.4 9.4 0.90 12.7 6.8 5.9
Central Asia 7.6 6.8 8.4 1.20 1.0 0.5 0.6
Southern Asia 22.4 21.9 22.8 1.04 95.8 49.2 46.5
Eastern and South-Eastern Asia 9.0 9.7 8.2 0.84 31.0 17.6 13.4
Northern Africa and Western Asia 17.1 15.4 18.8 1.18 18.5 8.6 10.0
Sub-Saharan Africa 32.3 29.6 35.1 1.16 96.9 44.7 52.2
Oceania 11.5 12.1 10.8 0.90 0.9 0.5 0.4
World 17.8 17.2 18.5 1.07 263.0 131.3 131.7
Notes: GPIA = adjusted gender parity index (female/male out-of-school rate).
Source: UNESCO Institute for Statistics database.

6 UIS Fact Sheet No. 48 | February 2018
The world is moving towards gender parity in out-of-school rates, although inequalities persist at regional
and country levels
The decline in out-of-school rates and numbers over the past one and a half decades occurred with a
reduction in gender disparity at the global level. Historically, girls and young women were more likely to be
excluded from education. However globally, the male and female out-of-school rates for the lower secondary
and upper secondary school-age populations are now nearly identical, while the gender gap among children
of primary school age dropped from more than five percentage points in 2000 to two percentage points in
2016.
The trend in gender parity can also be seen in the values of the adjusted gender parity index (GPIA) of the
out-of-school rate in Figure 3, a new indicator developed by the UIS and published for the first time in 2017
(UIS and GEMR, 2017). The adjusted GPI of the global primary out-of-school rate fell from 1.31 in 2000 to a
low of 1.13 in 2011, but in recent years, there was a small uptick. This was due to the continued decline of
the male out-of-school rate combined with a small increase in the female out-of-school rate. This means
that, globally, girls of primary school age are still more likely to be out of school compared to boys.
In contrast, the most recent values of the adjusted GPI for the lower secondary and upper secondary out-of-
school rates are in the gender parity range between 0.97 and 1.03, meaning that males and females in these
age groups have the same probability of being out of school.
It is important to note that global averages mask disparities at regional and country levels, which are
discussed below. In many countries, girls of all ages face considerable barriers to education (see the UIS
global education database).

7 UIS Fact Sheet No. 48 | February 2018
Regional out-of-school figures
The global out-of-school figures hide large regional differences. This section presents data for the regions
used to monitor the SDGs (see Box 2).
Box 2. SDG regions
For SDG monitoring, the world’s countries are grouped by the United Nations Statistics Division (UNSD)
into a set of geographical regions that are also used by the UIS for its reporting. However, for one SDG
region, Central and Southern Asia, the UIS reports data for two sub-regions, Central Asia and Southern
Asia, because they are very different with regard to their respective patterns of exclusion from
education. The regions used in this fact sheet are displayed in Figure 4.
Sub-Saharan Africa has the highest out-of-school rates
As in previous years, sub-Saharan Africa remains the region with the highest out-of-school rates for all age
groups (see Table 1 and Figure 5). Of the 63 million out-of-school children of primary school age, 34 million,
or more than one-half, live in sub-Saharan Africa. Southern Asia has the second-highest number of out-of-
school children with 10 million. Sub-Saharan Africa also has the highest rate of exclusion, with 21% of primary

8 UIS Fact Sheet No. 48 | February 2018
school-age children denied the right to education, followed by Northern Africa and Western Asia (11%) and
Oceania (7%).
The global lower secondary out-of-school rate (16%) is nearly twice as high as the primary out-of-school rate,
but because it is calculated for a smaller age cohort, the global number of out-of-school adolescents
(61 million) is only slightly lower than the number of primary school-age out-of-school children. Three
regions are home to nearly nine out of ten out-of-school adolescents: sub-Saharan Africa (27 million),
Southern Asia (18 million) and Eastern and South-Eastern Asia (8 million). Sub-Saharan Africa is also the
region with the highest rate of out-of-school adolescents (37%), followed by Southern Asia (17%), and
Northern Africa and Western Asia (14%).
In all regions, out-of-school rates and numbers are far higher among youth of upper secondary school age
than among younger cohorts. In total, 139 million upper secondary school-age youth were not in school in
2016, 14 million more than the combined number of out-of-school children and adolescents of primary and
lower secondary school age. The largest proportion, 67 million, live in Southern Asia, a further 36 million in
sub-Saharan Africa, and 16 million in Eastern and South-Eastern Asia. More than one-half of all youth are out
of school in sub-Saharan Africa (58%) and nearly half of all youth in Southern Asia (48%).

9 UIS Fact Sheet No. 48 | February 2018
Gender disparities persist at the regional level
In 2000, 54% of the 378 million out-of-school children, adolescents and youth were female. By 2016, the
female share of the global out-of-school population had fallen to 50%. However, these global averages mask
considerable differences at regional and national levels.
Primary school-age girls face a disadvantage in most regions, with the exception of Latin America and the
Caribbean, and Europe and Northern America, where boys are more likely to be out of school (see Table 1).
The widest gender disparities at the primary level are observed in Central Asia, with an adjusted GPI of 1.27,
although this is an artifact of very low out-of-school rates at which GPI values tend to take on extreme values.
No region has achieved gender parity among children of primary school age.
For lower secondary out-of-school rates, the widest gender disparity is observed in Northern Africa and
Western Asia, where there are 132 female adolescents out of school for every 100 male adolescents not in
school (adjusted GPI of 1.32).
Girls of every school-age group are more likely to be excluded from education than boys across sub-Saharan
Africa. For every 100 boys of primary school age out of school there are 123 girls denied the right to
education. Data suggest that girls who are able to start school tend to pursue their studies. While the gender
disparities persist, the adjusted GPI falls slightly from 1.23 for the primary school-age group to 1.11 for lower
secondary and upper secondary school-age populations.
Among regions where male adolescents are more likely to be out of school, Europe and Northern America
has the widest gender gap with an adjusted GPI of 0.81. Similar to Central Asia, this GPI value can be
explained by very low out-of-school rates in the region. As among children of primary school age, no region
has achieved gender parity, but Oceania and Eastern and South-Eastern Asia (adjusted GPI 0.92) are closest
to parity for the lower secondary school-age group.
Among upper secondary school-age youth, the largest disparities in favour of females are observed in
Eastern and South-Eastern Asia (adjusted GPI 0.66) and Oceania (adjusted GPI 0.73). Southern Asia (adjusted
GPI 1.05) and Latin America and the Caribbean (adjusted GPI 0.94) are close to gender parity.
National out-of-school figures
The countries with the highest out-of-school rates are in Africa
Turning to national data, the map in Figure 6 shows that more than one out of five children of primary school
age is out of school in several countries of sub-Saharan Africa, Northern Africa, Western Asia, and Southern
Asia. The countries with the highest out-of-school rates include South Sudan (68%), Liberia (62%), Eritrea
(57%), Equatorial Guinea (56%), Sudan (44%), and Djibouti (41%).

10 UIS Fact Sheet No. 48 | February 2018
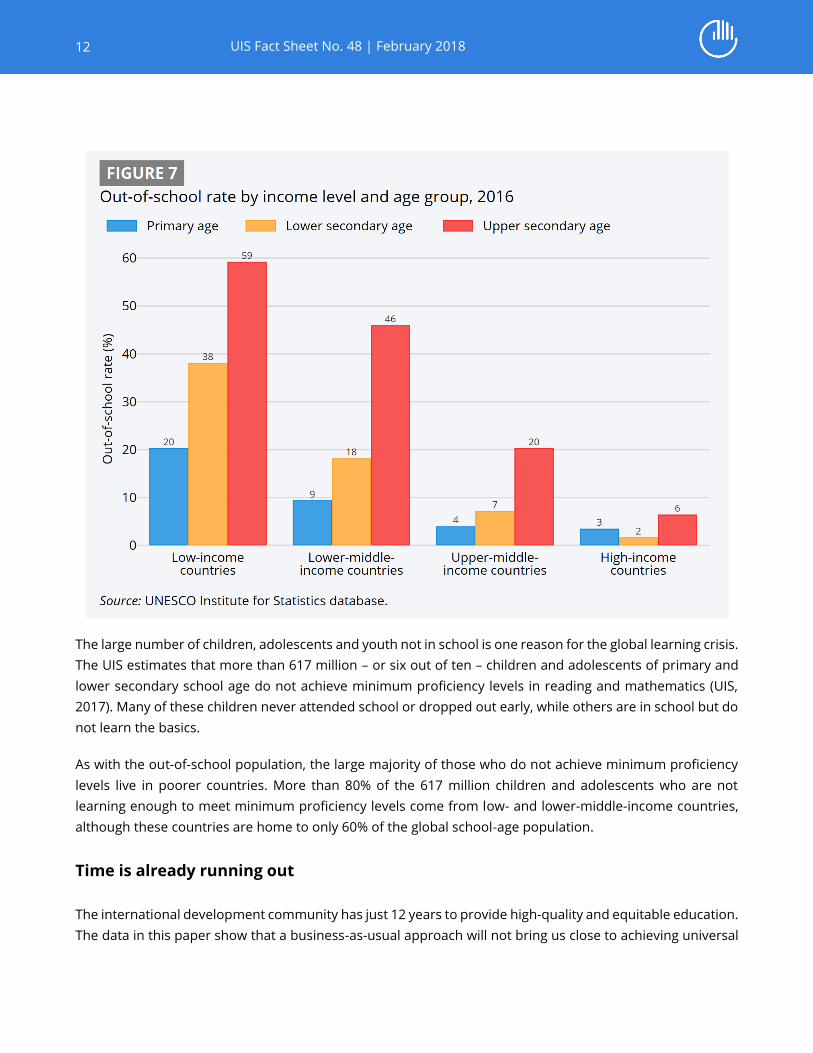
The countries with the highest out-of-school rates also tend to be among the poorest countries in the world.
The World Bank assigns countries to four groups according to their gross national income (GNI) per capita
(World Bank, 2018). In low-income countries, out-of-school rates are systematically higher than in lower-
middle-, upper-middle- and high-income countries (see Figure 7 and Table 2). The primary out-of-school rate
is 20% in low-income countries and 3% in high-income countries. The lower secondary out-of-school rate is
38% and 2%, respectively, and the upper secondary out-of-school rate is 59% and 6%, respectively. As a
group, low-income countries combined have higher out-of-school rates than all individual SDG regions,
except for sub-Saharan Africa, which has a marginally higher primary out-of-school rate.
Poverty levels are also closely linked to gender disparities in education. A comparison of male and female
out-of-school rates shows that in low-income countries females are more likely to be out of school than
males, while the opposite can be observed in high-income countries (see Table 2). This is especially true for
youth of upper secondary school age, where female out-of-school rates are higher in low-income and lower-
middle-income countries, while male out-of-school rates are higher in upper-middle-income and high-
income countries.

11 UIS Fact Sheet No. 48 | February 2018
Table 2. Out-of-school rates and numbers by country income level, 2016
Out-of-school children of primary school age
Region Out-of-school rate (%) Out-of-school number (millions)
Both sexes Male Female GPIA Both sexes Male Female
Low-income countries 20.3 17.9 22.9 1.22 21.9 9.7 12.2
Lower-middle-income countries 9.4 8.2 10.7 1.23 31.0 14.0 17.0
Upper-middle-income countries 4.0 3.8 4.2 1.11 7.9 3.9 4.0
High-income countries 3.5 3.8 3.1 0.83 2.6 1.5 1.2
World 8.9 7.9 10.0 1.21 63.3 29.1 34.3
Out-of-school adolescents of lower secondary school age
Region Out-of-school rate (%) Out-of-school number (millions)
Both sexes Male Female GPIA Both sexes Male Female
Low-income countries 38.1 34.8 41.4 1.16 19.7 9.1 10.7
Lower-middle-income countries 18.2 18.9 17.4 0.92 32.7 17.6 15.1
Upper-middle-income countries 7.2 6.9 7.5 1.08 7.9 4.0 3.9
High-income countries 1.7 1.9 1.5 0.76 0.7 0.4 0.3
World 15.9 15.7 16.2 1.03 61.1 31.1 30.0
Out-of-school youth of upper secondary school age
Region Out-of-school rate (%) Out-of-school number (millions)
Both sexes Male Female GPIA Both sexes Male Female
Low-income countries 59.2 55.6 62.9 1.12 24.1 11.4 12.7
Lower-middle-income countries 46.0 44.9 47.1 1.05 91.2 46.2 45.0
Upper-middle-income countries 20.3 22.8 17.6 0.77 20.6 12.0 8.5
High-income countries 6.4 7.0 5.8 0.83 2.7 1.5 1.2
World 36.3 36.0 36.5 1.01 138.5 71.1 67.4
Out-of-school children, adolescents and youth of primary, lower secondary and upper secondary age
Region Out-of-school rate (%) Out-of-school number (millions)
Both sexes Male Female GPIA Both sexes Male Female
Low-income countries 32.8 29.9 35.8 1.16 65.7 30.2 35.5
Lower-middle-income countries 21.9 21.3 22.6 1.06 154.9 77.9 77.0
Upper-middle-income countries 8.9 9.3 8.4 0.91 36.4 19.9 16.5
High-income countries 3.8 4.1 3.4 0.83 6.0 3.4 2.6
World 17.8 17.2 18.5 1.07 263.0 131.3 131.7
Notes: GPIA = adjusted gender parity index (female/male out-of-school rate).
Source: UNESCO Institute for Statistics database.
12 UIS Fact Sheet No. 48 | February 2018
The large number of children, adolescents and youth not in school is one reason for the global learning crisis.
The UIS estimates that more than 617 million – or six out of ten – children and adolescents of primary and
lower secondary school age do not achieve minimum proficiency levels in reading and mathematics (UIS,
2017). Many of these children never attended school or dropped out early, while others are in school but do
not learn the basics.
As with the out-of-school population, the large majority of those who do not achieve minimum proficiency
levels live in poorer countries. More than 80% of the 617 million children and adolescents who are not
learning enough to meet minimum proficiency levels come from low- and lower-middle-income countries,
although these countries are home to only 60% of the global school-age population.
Time is already running out
The international development community has just 12 years to provide high-quality and equitable education.
The data in this paper show that a business-as-usual approach will not bring us close to achieving universal

13 UIS Fact Sheet No. 48 | February 2018
primary and secondary education by 2030. There is an urgent need for greater investment in education at
the global, regional and national levels, including more resources for data collection and analysis.
As the official source of SDG 4 data, the UIS is producing the indicators and developing the methodological
tools to help countries and development partners better target policies and resources. However, the most
sophisticated indicators and methodologies will amount to little if countries are unable to collect the data.
The calls for greater investment in SDG 4 must include support to help countries leverage their data to get
every child in school and learning.
References
UNESCO Institute for Statistics (UIS) (2017). “More than One-Half of Children and Adolescents are Not
Learning Worldwide.” UIS fact sheet No. 46. Montreal: UIS.
http://uis.unesco.org/sites/default/files/documents/fs46-more-than-half-children-not-learning-en-
2017.pdf
UNESCO Institute for Statistics (UIS) and Global Education Monitoring Report (GEMR) (2016). “Leaving No
One Behind: How Far on the Way to Universal Primary and Secondary Education?” GEMR policy paper
27/UIS fact sheet No. 37. Montreal and Paris: UIS and GEMR.
http://unesdoc.unesco.org/images/0024/002452/245238E.pdf
——— (2017). “Reducing Global Poverty through Universal Primary and Secondary Education.” GEMR policy
paper 32/UIS fact sheet No. 44. Montreal and Paris: UIS and GEMR.
http://unesdoc.unesco.org/images/0025/002503/250392e.pdf
World Bank (2018). “How Does the World Bank Classify Countries?” World Bank Data Help Desk. Accessed
19 February 2018. https://datahelpdesk.worldbank.org/knowledgebase/articles/378834-how-does-the-
world-bank-classify-countries