Embed Size (px)
Citation preview
G. F. Papa
London, 13th December 2016
One Bank, One UniCreditTransform Operating Model and Maximize Commercial Bank Value
Disclaimer
This communication and the information contained herein does not contain or constitute an offer of securities for sale, or solicitation of an offer to purchase securities, in the United States, Australia, Canada or Japan or any other jurisdiction where such an offer or solicitation would require the approval of local authorities or otherwise be unlawful (the “Other Countries”). Neither this document nor any part of it nor the fact of its distribution may form the basis of, or be relied on in connection with, any contract or investment decision in relation thereto.The securities referred to herein have not been registered and will not be registered in the United States under the U.S. Securities Act of 1933, as amended (the “Securities Act”), or pursuant to the corresponding regulations in force in the Other Countries. The securities may not be offered or sold in the United States unless such securities are registered under the Securities Act, or an exemption from the registration requirements of the Securities Act is available. The Company (as defined below) does not intend to register any portion of any offering in the United States.This communication is directed only at (i) persons who are outside the United Kingdom or (ii) persons who have professional experience in matters relating to investments falling within Article 19(2) of the Financial Services and Markets Act 2000 (Financial Promotion) Order 2005, as amended from time to time (the “Order”) or (iii) high net worth entities, and other persons to whom it may lawfully be communicated, falling within Article 49(2) of the Order or (iv) certified high net worth individuals and certified and self-certified sophisticated investors as described in Articles 48, 50, and 50A respectively of the Order or (v) persons to whom this communication may otherwise be lawfully communicated (all such persons together being referred to as “relevant persons”). Any investment activity to which this communication relates will only be available to and will only be engaged with, relevant persons. Any person who is not a relevant person should not act or rely on this communication or any of its contents. This publication constitutes neither an offer to sell nor a solicitation to buy or subscribe for securities. This communication has been prepared on the basis that any offer of securities in any Member State of the European Economic Area (“EEA”) which has implemented the Prospectus Directive (each, a “Relevant Member State”), will be mad on the basis of a prospectus approved by the competent authority and published and notified to the relevant competent authority in accordance with the Prospectus Directive and/or pursuant to an exemption under the Prospectus Directive from the requirement to publish a prospectus for offers of securities.
The contents of this document are for information purposes only and is not to be construed as providing investment advice. The statements contained herein have not been independently verified. No representation or warranty, either express or implied, is made as to, and no reliance should be placed on, the fairness, accuracy, completeness, correctness or reliability of the information contained herein. Neither UniCredit S.p.A. (the “Company” and together with its consolidated subsidiaries, the “Group”) nor any of its representatives shall accept any liability whatsoever (whether in negligence or otherwise) arising in any way in relation to such information or in relation to any loss arising from its use or otherwise arising in connection with this presentation. By accessing these materials, you agree to be bound by the foregoing limitations.This press release contains certain forward-looking statement, projections, objectives, estimates and forecasts reflecting management’s current views with respect to certain future events. Forward-looking statements, projections, objectives, estimates and forecasts are generally identifiable by the use of the words “may,” “will,” “should,” “plan,” “expect,” “anticipate,” “estimate,” “believe,” “intend,” “project,” “goal” or “target” or the negative of these words or other variations on these words or comparable terminology. These forward-looking statements include, but are not limited to, all statements other than statements of historical facts, including, without limitation, those regarding the Company’s future financial position and results of operations, strategy, plans, objectives, goals and targets and future developments in the markets where the Company or any Group company participates or is seeking to participate. Due to such uncertainties and risks, readers are cautioned not to place undue reliance on such forward-looking statements as a prediction of actual results. The Group’s ability to achieve its projected objectives or results is dependent on many factors which are outside management’s control. Actual results may differ materially from (and be more negative than) those projected or implied in the forward-looking statements. Such forward-looking information involves risks and uncertainties that could significantly affect expected results and is based on certain key assumptions. All forward-looking statements included herein are based on information available to the Group as of the date hereof. No Group company undertakes any obligation to update publicly or revise any forward-looking statement, whether as a result of new information, future events or otherwise, except as may be required by applicable law. All subsequent written and oral forward-looking statements attributable to any Group company or persons acting on its behalf are expressly qualified in their entirety by these cautionary statements.The Presentation may not be retained, copied, reproduced, used, distributed, published or disclosed, in whole or in part, at any time without the prior written consent of the Company.
2
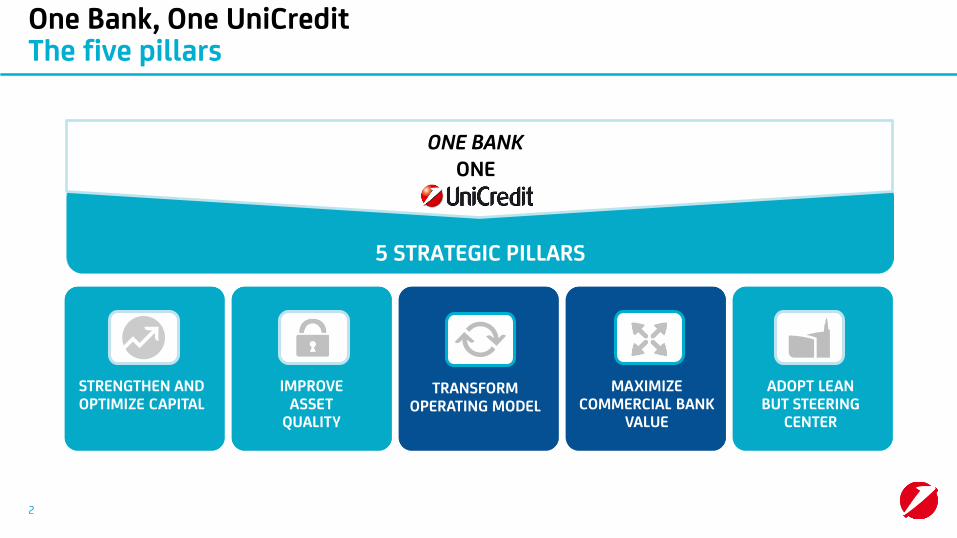
One Bank, One UniCreditThe five pillars
5 STRATEGIC PILLARS
ONE BANKONE
TRANSFORM OPERATING MODEL
ADOPT LEAN BUT STEERING
CENTER
STRENGTHEN AND OPTIMIZE CAPITAL
MAXIMIZECOMMERCIAL BANK
VALUE
IMPROVE ASSET
QUALITY

Agenda
• Country/Division Heads• Divisional highlights
• G. F. Papa• Focus on One Bank, Risk discipline and execution of the plan
Topic Speaker
• G. F. Papa• UniCredit competitive advantages andtransformation journey
• Western Europe Commercial Banking
• CEE
• CIB
• Context and UniCredit positioning
3
4
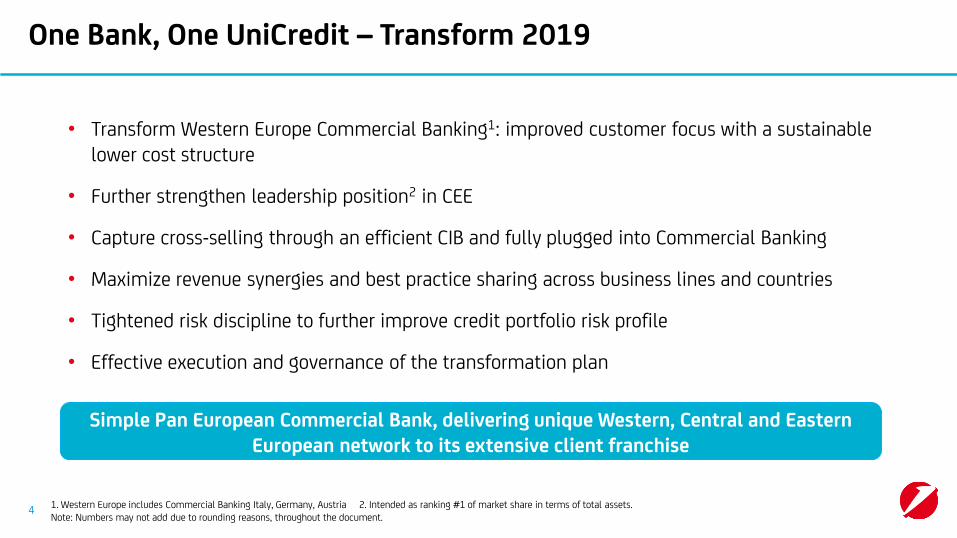
One Bank, One UniCredit – Transform 2019
• Transform Western Europe Commercial Banking1: improved customer focus with a sustainable lower cost structure
• Further strengthen leadership position2 in CEE
• Capture cross-selling through an efficient CIB and fully plugged into Commercial Banking
• Maximize revenue synergies and best practice sharing across business lines and countries
• Tightened risk discipline to further improve credit portfolio risk profile
• Effective execution and governance of the transformation plan
Simple Pan European Commercial Bank, delivering unique Western, Central and Eastern European network to its extensive client franchise
1. Western Europe includes Commercial Banking Italy, Germany, Austria 2. Intended as ranking #1 of market share in terms of total assets.Note: Numbers may not add due to rounding reasons, throughout the document.

Transform 2019 – anticipating the need for banks to evolve
UniCredit ready to seize opportunities of evolving banking environment
• Growing regulatory pressure driving simplification of business models
• Commercial Banking expected to be less affected by ongoing regulatory initiatives
Regulatory environment
• Limited GDP growth in Western Europe whilst higher in CEE
• “Lower for longer” interest rates and low-yield environment
Low growth and interest rates
Changing client behaviors
• Increasing use of remote channels
• Alternative new offerings to clients creating optionalities
5

UniCredit: simple Pan European Commercial Bank, delivering unique Western, Central and Eastern European network to its extensive client franchise
7961
Peer Av.3
7094
Peer Av.3
Focused
ITA #2 GER #3AUT #1 CEE #1714, 12 in EU4
Pan-Europeanand local
#1 #3 73%
Distinctive factories
2nd Corporate lender in EU zone3 2513 million clients 5,49013 Retail branchesScale
1. Based on public available information, including also Private Banking and Financial Service, 9M20162. UniCredit excludes Turkey and Russia with a pro-quota approach; BNP Paribas and Société Générale data calculated as of proxy of commitment at geographical level; Deutsche Bank split not available, 9M20163. Peers include: BNP Paribas, Deutsche Bank, Intesa Sanpaolo, Santander, Société Générale, EU revenues split comparison excluding Deutsche Bank; 9M2016 4. Excluding Azerbaijan, Estonia, Latvia, Lithuania; includes Bosnia and Herzegovina, Serbia (EU membership process initiated); 9M2016
Bonds and loans10
Trade Finance Bankin CEE and Austria9
Commercial bank1
% of total revenuesEU – based2
% of total revenues
Market position6Countries with banking operations
GTB powerhouseLeading CMIB8 in
core countriesClient driven CIB
revenues12
Average market share5
Structured finance
#1Syndicatedloans11
8%
Source: Dealogic, Euromoney 2016, Global Finance, OeNB
6
5. On loans, weighted average based on UniCredit geographical mix; including 100% Turkey; 9M2016 6. Based on Total Assets 9M2016. For Austria domestic assets as of end of 2015 on local GAAP (source OeNB). For Germany considering private banks 7. Based on total assets. Compared to Erste, Intesa Sanpaolo, KBC, OTP, RBI, SociétéGénérale, ranking as of 2015 8. Capital Markets and Investment Banking, 9M2016 9. Euromoney for CEE Global Finance for Austria, 2016 10. EMEA Bonds and Loans EUR denominated; 9M2016 11. EMEA Syndicated loans EUR denominated (All asset classes); 9M2016 12. CIB revenues excluding Treasury 13. Including 100% clients and branches in Turkey; 9M2016.

"Go-to" bank for European "Mittelstand" Corporates
Best in class CIB products provider
Unparalleled support forCorporates’ internationalactivities
UniCredit competitive advantages:a leading Corporate Bank in Europe
#1Bank for Trade Finance in CEEand Austria4
1. Includes 100% clients in Turkey, 9M2016 2. 9M2016 3. Peers include: BNP Paribas, Deutsche Bank, Intesa Sanpaolo, Santander, Société Générale, as of 9M2016 4. Euromoney for CEE, Global Finance for Austria, 2016 5. Share of Corporate clients groups active/booking in at least two countries, 9M2016 6. Based on total assets. Compared to Erste, Intesa Sanpaolo, KBC, OTP, RBI, Société Générale, ranking as of 2015.
Distinctive Corporate client franchise and product factories
0.6m1 SMEs andCorporate clients
#23 Corporate lender in EU zone #1 In CEE6
#1 EMEA covered bonds
#1 EMEA sponsor-driven acquisition finance
#1 EMEA syndicated loans EUR
€314bn2 SMEs andCorporate loans
35%
Corporate groups served in multiple locations5
Source: Dealogic, Euromoney 2016, Global Finance7

UniCredit competitive advantages:extensive Retail and Private client franchise in Europe
Extensive client franchise1
Key player in asset gathering1
Untapped potential in Consumer Finance1
Extensive client coverage(>38,000 sales people3)
24mRetail and Private clients2
Three main UniCredit geographies covering >30% of EU wealth4
Limited penetration of existing customer base
€133bn Retail loans
€544bnRetail and Private Total Financial Assets
30%
Share of AuC/AuMrevenues of total Retail and Private Banking
Consumer Finance5
volumes €9bn
Risk-adjusted return6
530bps
Extensive Retail and Private client franchise in Europe
1. In 9M2016 2. Includes 100% clients in Turkey, 9M2016 3. Number of clients facing FTE in Retail and Private Banking, 2015 4. Households financial assets in Italy, Germany and Austria vs. 21 EU countries in OECD, 2015 5. Personal loans, credit and revolving cards, overdrafts and salary-backed loans 6. Revenues net of cost of risk loan volumes, weighted average on UniCredit geographical asset mix.
€212bn Retail deposits
Share of Consumer Finance revenues of total Retail and Private Banking
7%
Western Europe data
8

Russia
CEE – EU2
Turkey3
UniCredit competitive advantages: leader in CEE
Leadership position in market with Total Assets of €2,500bn4
Mainly present in EU countries (62% of CEE assets)
#1 in CEE, top 5 ranked in most of CEE countries5
Well diversified ensuring resilient performance throughout the cycle
UniCredit CEE division asset mix, %1
62%
14%
24%
1. As of 9M2016 2. Bulgaria, Croatia, Czech Republic, Hungary, Romania, Slovakia, Slovenia, includes Bosnia and Herzegovina (managerially mainly under Zagrebacka Banka in Croatia) and Serbia (EU membership process initiated) 3. Assets of Turkey are considered at 40.9%. 4 Assets of Turkey are considered at 100% as of 1H2016. 5. Based on Total Assets, 2015
9

Key targets
Transform WE Commercial Banking2
Further strengthen leadership3 in CEE
Capture CIB cross-selling
2019ROAC1
€3.2bn
1. RoAC: Return on Allocated Capital (Annualized net profit / Allocated Capital); Allocated Capital based on RWA equivalent figures calculated with a CET1 ratio target of 12.5% for all the plan horizon, including deductions for shortfall and securitizations. 2. Commercial Banking Italy, Germany and Austria 3. Intended as ranking #1 of market share in terms of total assets 4. At current FX rate. At constant FX €4.5bn in 2019. Delta: €559m 5. CIB revenues excluding Treasury 6. Includes revenues on GTB, ECM, DCM, M&A, Markets products from Commercial Banking clients and structured financing products from Corporate clients. 7. Refers to CIB division 8. vs. 2 bps in 2015 9. Including 100% clients in Turkey.
Share of client-driven5
CIB revenues
Joint CIB – Commercial Banking revenues6
83.6%
13.3%8.9%
12.3%9.6%
2015
14.7%7
11.0%7
2019
Delta vs. 2015
€6.7bnCosts -€1.3bn
36bpsCoR -12bps
+€363m(+3.1%CAGR)
€4.4bnRevenues4 +€431m
110bpsCoR -64bps
57.2%Cost/income -9.1p.p.
+17.3p.p.
19bpsCoR +17bps8
Customer base reaching 28m9 clients in 2019, starting from 25m9 in 9M2016
10

Agenda
• Country/Division Heads• Divisional highlights
• G. F. Papa• Focus on One Bank, Risk discipline and execution of the plan
Topic Speaker
• G. F. Papa• UniCredit competitive advantages andtransformation journey
• Western Europe Commercial Banking
• CEE
• CIB
• Context and UniCredit positioning
11

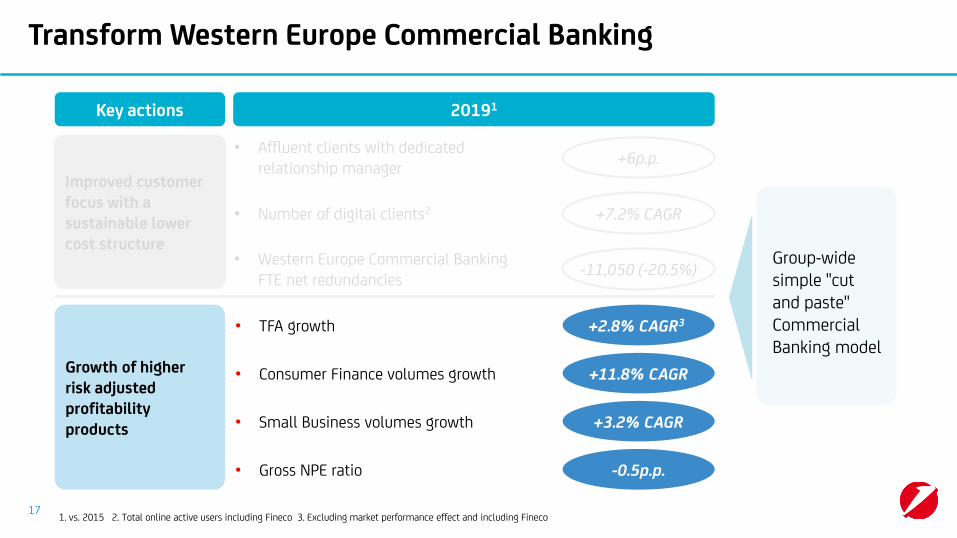
Transform Western Europe Commercial Banking
Group-wide simple "cutand paste" Commercial Banking model
-11,050 (-20.5%)• Western Europe Commercial Banking
FTE net redundancies
+6p.p.• Affluent clients with dedicated
relationship managerImproved customer focus with a sustainable lower cost structure
• Consumer Finance volumes growth +11.8% CAGR
• Small Business volumes growth +3.2% CAGR
• Gross NPE ratio -0.5p.p.
+2.8% CAGR3• TFA growth
1. vs. 2015 2. Total online active users including Fineco 3. Excluding market performance effect and including Fineco.
20191Key actions
+7.2% CAGR• Number of digital clients2
Growth of higher risk adjusted profitability products
12
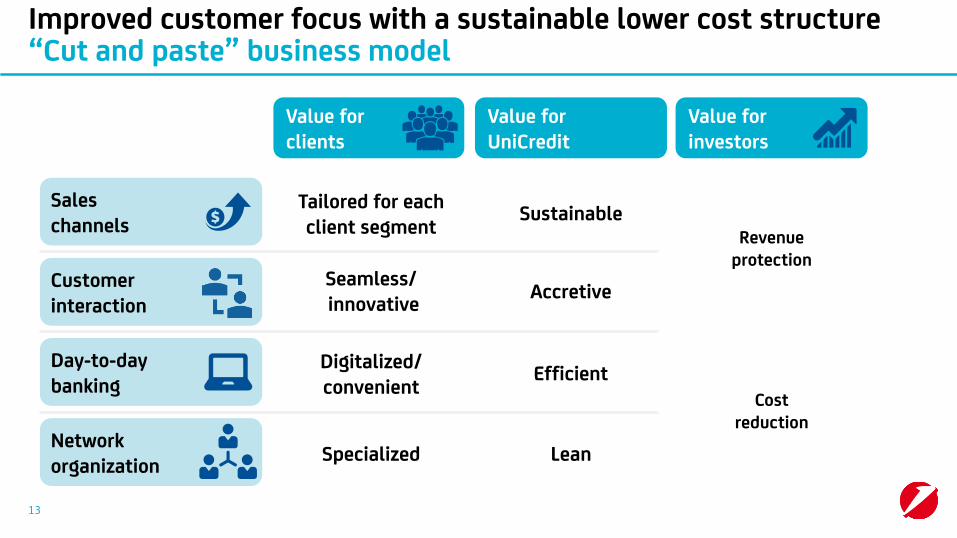
Value for clients
Value for UniCredit
Costreduction
Revenueprotection
LeanSpecializedNetworkorganization
Day-to-day banking
EfficientDigitalized/ convenient
Sales channels
SustainableTailored for each client segment
Accretive Seamless/innovative
13
Improved customer focus with a sustainable lower cost structure“Cut and paste” business model
Customerinteraction
Value for investors

Improved customer focus with a sustainable lower cost structureUniCredit leading the market
1. Retail clients with TFA ≥ €75,000 or with broad portfolio of products 2. Organizational units in the Corporate Center 3. Includes cash withdrawals, cash deposits and transfers 4. vs. 2015 5. FTE net redundancies fully secured through dedicated exit plan, redundancies will be realized by 2019.Note: all 2015 and 9M2016 figures restated assuming new Group perimeter; for Germany, Austria and Italy considered only Commercial Banking perimeter. Deltas refers to EOP figures. Numbers might be rounded
Restructuring programs in Germany, Austria and Italy, driving efficiency and streamlining
Germany: additional actions leveraging on a successful optimization program
• -41% (-234) Retail branch closuresin 2013-2015
• -16% FTE net redundancies in2013-2015
• Stable Top affluent1 clients despite branch closures
Italy: rightsizing of network and branches
• -6% (-222) Retail branch closures in 2013-2015 (-24% in 2008-2015)
• -2% FTE net redundancies in 2013-2015 (-9% in 2010-2015)
• 88% share of remote transactions3
as of 2015
20194
Austria: on track, focusing on premium advisory and streamlining of organization
• -31% (-78) Retail branch closures in 2013-2015
• -9% FTE net redundancies in 2013-2015
• -40% headquarter organizational units2
in 2015-9M2016
20194
• €300m cost savings
• -21% FTE net redundancies
• €650m cost savings
• -27% (-883) branch closures
• -21% FTE net redundancies
• €320m cost savings
• -29% (-50) branch closures
• -19% FTE with exit plan fully secured5
20194
14

Value for clients1 Value for UniCredit1
Network organization
Day-to-day banking
Sales channels
Customer interaction
Affluent clients with dedicated relationship manager
Branch closures
Delivery time to clients2
End-to-end cost efficiencies fromprocess redesign2
Remote transactions3Basic productssold online4
Dedicated network Relationship managers5
on total network
-27%
-30%
2.5X
+4p.p.
From 60%to 70%
- >50%
From 88%to 95%
Retail/ Corporate
1. 2015-2019 2. Processes redesigned end-to-end will cover 85% of FTE 3. Includes cash withdrawals, cash deposits and transfers 4. Includes current accounts, personal loans, overdraft, car insurance 5. Affluent, Private, Small Business and Corporate relationship managers.Note: numbers might be rounded
15
Improved customer focus with a sustainable lower cost structureTransform 2019 Italy

End-to-end redesign of the mostrelevant processes…
…with improved service to customers
Network and headquarter FTE, %
85%
15%
Focus on end-to-end redesign
• Setup of an “end-to-end delivery unit” with cross-functional teams between Business and IT
• Product simplification
Simplified product offering2
81
14
20152013
-85%
31
<5
20192015
0
20192015
5
Optimizedprocessing timeMinutes to issue3
Reduced time to delivery Days to activation
-84%
-100%
1. Expected FTE reduction on redesigned processes 2. Number of product variations in catalogue 3. Refers to net FTE time required to complete underlying activities.
30% FTE efficiencies1
Credit card example
Improved customer focus with a sustainable lower cost structure Italy improving whilst streamlining top products
7 products families
Other products
Already achieved
16
Transform Western Europe Commercial Banking
20191
-11,050 (-20.5%)• Western Europe Commercial Banking
FTE net redundancies
+6p.p.• Affluent clients with dedicated
relationship manager Improved customer focus with a sustainable lower cost structure
• Consumer Finance volumes growth +11.8% CAGR
• Small Business volumes growth +3.2% CAGR
• Gross NPE ratio -0.5p.p.
+2.8% CAGR3• TFA growth
1. vs. 2015 2. Total online active users including Fineco 3. Excluding market performance effect and including Fineco
Key actions
+7.2% CAGR• Number of digital clients2
Growth of higher risk adjusted profitability products
17
Group-wide simple "cutand paste" Commercial Banking model

Value chain Key actions
Growth of higher risk adjusted profitability productsConsolidate asset gathering position
20191
• Enhanced offer to clients leveraging on product offering of leading global player
• Open platform for HNWI and Private Banking
• Advanced products developed by CIB
• Network setup focused on Affluent/Private with dedicated channel for HNWI
• Scaled up remote distribution and best-in-class online brokerage
• Switch from deposits to AuM and AuC
• Fully integrated "products – distribution" approach through personal financial advisors and online/mobile banking
• Leading edge advisory model based on new technologies and multi-channel
• Advanced financial consulting services through robo-advisory, leveraging Fineco best practices
Advisory
Relationship management
Asset Management
1. vs. 2015 2. Includes Commercial Banking in Italy, Germany, Austria and Fineco 3. Excluding market performance effect.
Western EuropeRetail and Private Commercial Banking TFA2, €bn
2015
518577 +2.8%3
2019
CAGR
18

Growth of higher risk adjusted profitability productsCapture full potential of Corporate franchise across Europe
Cumulated Corporate new loans 2016-20192
>€55bn
Joint CIB-Commercial Banking Revenues3
Revenue CAGR2015-2019
+3.1%
International business4
Revenue CAGR2015-2019
+4.8%
Leverage on “go to” bank status Maximize cross-selling
• Leverage innovative CRM1 for advanced targeting and value measurement
• Increase share of wallet of best underpenetrated clients and geographies
• Implement best risk management practices to ensure quality of origination
• Enhance tailoring of client service
• Renew product offer, promoting cross-selling of value added services (CMIB products, International)
• Develop advanced account planning and opportunity identification
1. Customer Relationship Management 2. New loans to Corporate clients in Western Europe Commercial Banking (Italy, Germany, Austria); excluding CIB 3. Includes revenues on GTB, ECM, DCM, M&A, Markets products from Commercial Banking clients and structured financing products from Corporate clients 4. Client revenues outside of clients home country.
19
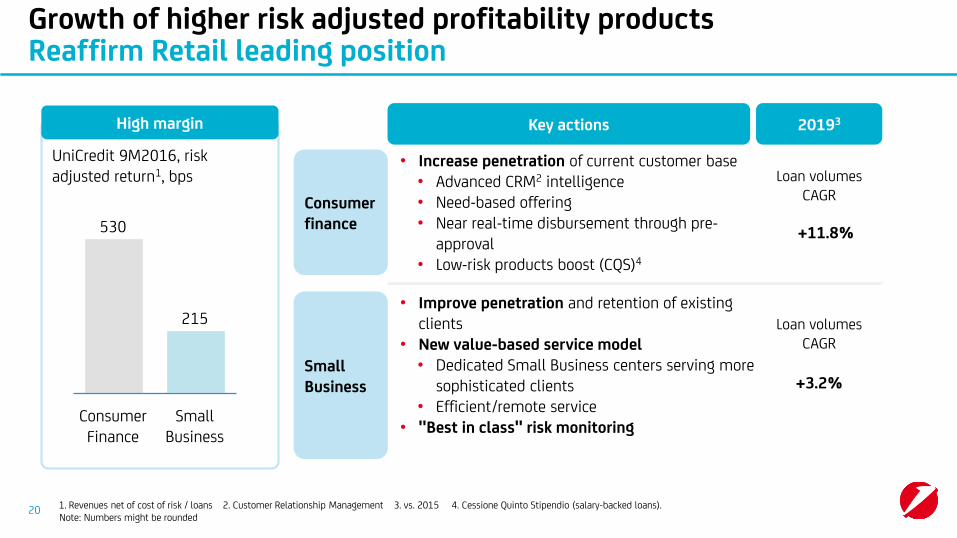
Growth of higher risk adjusted profitability productsReaffirm Retail leading position
High margin
Consumer Finance
Small Business
530
215
UniCredit 9M2016, risk adjusted return1, bps
1. Revenues net of cost of risk / loans 2. Customer Relationship Management 3. vs. 2015 4. Cessione Quinto Stipendio (salary-backed loans).
Consumer finance
Key actions 20193
Small Business
• Improve penetration and retention of existing clients
• New value-based service model• Dedicated Small Business centers serving more
sophisticated clients• Efficient/remote service
• "Best in class" risk monitoring
• Increase penetration of current customer base• Advanced CRM2 intelligence• Need-based offering• Near real-time disbursement through pre-
approval• Low-risk products boost (CQS)4
+11.8%
+3.2%
Loan volumes CAGR
Loan volumes CAGR
20Note: Numbers might be rounded

Growth of higher risk adjusted profitability productsMaintain and strengthen risk discipline
Western Europe Commercial Banking – Asset quality evolution
4.5%
20199M2016adjusted
5.1%
CoRbps
64 36
Note: Figures adjusted considering one-off LLP21
Gross NPEratio %
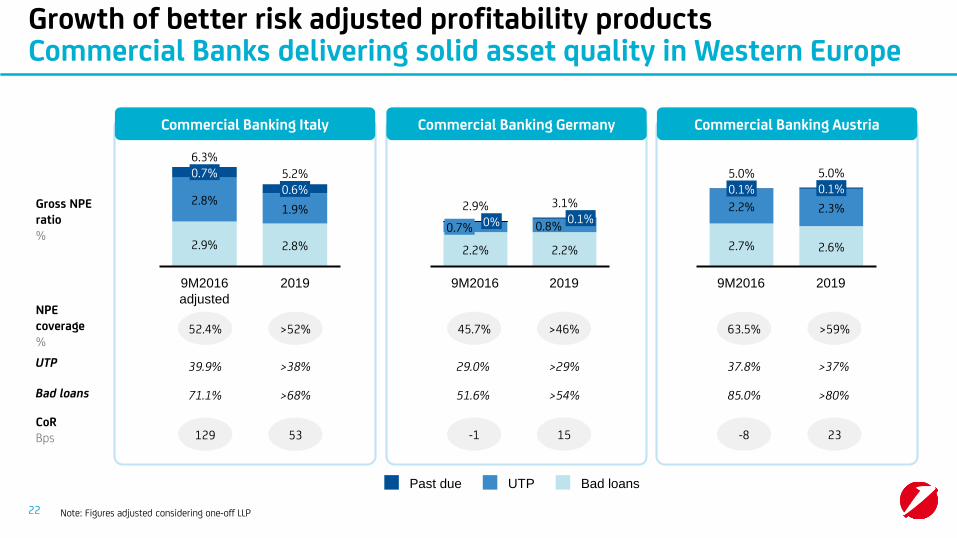
Growth of better risk adjusted profitability productsCommercial Banks delivering solid asset quality in Western Europe
52.4%
Commercial Banking Italy Commercial Banking Germany Commercial Banking Austria
Gross NPEratio%
>52%
NPEcoverage %
129 53CoRBps
45.7% >46%
-1 15
63.5% >59%
-8 23
Note: Figures adjusted considering one-off LLP
71.1% >68%Bad loans
UTP
51.6% >54% 85.0% >80%
39.9% >38% 29.0% >29% 37.8% >37%
22
0.6%
6.3%
5.2%
2.8%
1.9%
2.9%
20199M2016
adjusted
0.7%
2.8%
Past due Bad loansUTP
2.2%
0.1%
2.2%
9M2016
0.7%
3.1%
0%
2019
0.8%
2.9%
0.1%5.0%
9M2016
5.0%
2019
2.7% 2.6%
2.2%
0.1%
2.3%
Agenda
• Country/Division Heads• Divisional highlights
• G. F. Papa• Focus on One Bank, Risk discipline and execution of the plan
Topic Speaker
• G. F. Papa• UniCredit competitive advantages andtransformation journey
• Western Europe Commercial Banking
• CEE
• CIB
• Context and UniCredit positioning
23

Key actions
Further strengthen leadership in CEECEE growth by combining innovation and risk discipline
20192
1. Intended as ranking #1 of market share in terms of total assets 2. vs. 2015 3. At current FX rate, Constant FX Rate CAGR 3.4% 4. Including Turkey at 100% 5. In 2019. At current FX, 36.3% at constant FX. Note: all 2015 figures are restated assuming new Group perimeter.
Revenue growth
+2.6% CAGR3
• Primary focus on organic growthOrganic growth
Net new clients
+2.6m4
• Further strengthen leadership1
position through innovation and digital transformation
Innovation and digitalization
Cost savings culture continuousrisk discipline
• Maintain lean cost structure
• Enhanced NPE management and control cost of risk
Cost/income5
37.1%
Gross NPE ratio
8.0% (-3.8p.p.)
24

ROAC, %
Further strengthen leadership in CEEStrong and resilient risk-adjusted returns through the cycle
10.0%
2009-2014
9.6%
2015 2019
12.3%
174 110182CoRbps
Note: all 2015 figures are restated assuming new Group perimeter. RoAC: Return on Allocated Capital (Annualized net profit / Allocated Capital); Allocated Capital based on RWA equivalent figures calculated with a CET1 ratio target of 12.5% for all the plan horizon, including deductions for shortfall and securitizations.
25
Agenda
• Country/Division Heads• Divisional highlights
• G. F. Papa• Focus on One Bank, Risk discipline and execution of the plan
Topic Speaker
• G. F. Papa• UniCredit competitive advantages andtransformation journey
• Western Europe Commercial Banking
• CEE
• CIB
• Context and UniCredit positioning
26

Capture cross-selling through an efficient and fully plugged in CIB CIB successfully de-risked and simplified
14.7%1 ROAC 2015
Non core assets ring-fencing and run-off
Senior bankermodel rolled out in core countries2
Rightsizing of the organization
Business model adaptation
Risk discipline: CoR stabilized
Business refocusing
Reinforcedclient franchise
Simplification
Commonculture
established
1. RoAC: Return on Allocated Capital (Annualized net profit / Allocated Capital); Allocated Capital based on RWA equivalent figures calculated with a CET1 ratio target of 12.5% for all the plan horizon, including deductions for shortfall and securitizations.
2. Italy, Germany and Austria.27

Key actions
Capture cross-selling through an efficient and fully plugged in CIB
20193
1. Intended as ranking between #1 and #3 in 8 league tables in 9M2016 2. Global Transaction Banking 3. vs. 2015 4. CIB reveues excluding Treasury 5. As of 9M20166. Includes revenues on GTB, ECM, DCM, M&A, Markets products from Commercial Banking clients and structured financing products from Corporate clients.Source: Dealogic
• Expand leadership1 in GTB2 andDebt Finance
• Deliver capital markets and riskhedging solutions to our clients
• Leverage international network
Confirm and improve market leadership2
• Fully capture existing cross-selling opportunities
• Focus on Commercial Bankingjoint ventures
Leverage on Group synergies
Continuous cost discipline and simplification
• Ongoing cost containment initiatives • Streamline/fine-tune businesses and
operating platform
28
Client-driven revenues4 on total CIB revenues
From73%5 to 84%
Joint CIB –Commercial Banking revenues6
+€363m(+3.1%CAGR)
Costs-€201m
-3.0%CAGR

• Strengthened governance for CIB – CommercialBanking cooperation:
• JV established with Commercial Banks for ECM,DCM, M&A and Markets
• Direct senior management involvement
• Fully aligned incentive system
• Coordinated commercial activity:
• Joint client targeting and monitoring
• Joint pitching
• Joint reporting and monthly business meetings
Key actions to support cross-selling withCommercial Banking Italy JV CIB-Commercial Banking example
20192015
1. Includes revenues on FX GTB, ECM, DCM, M&A, Markets products from Commercial Banking clients.
JV CIB-Commercial Banking Italy revenues1
€m
Capture cross-selling through an efficient and fully plugged in CIB CIB as cross-selling “engine”
29
78
217

Agenda
• G. F. Papa• Focus on One Bank, Risk discipline and execution of the plan
Topic Speaker
• G. F. Papa• UniCredit competitive advantages andtransformation journey
30
• Divisional highlights
• Commercial Banking Italy
• Commercial Banking Germany
• Commercial Banking CEE
• CIB
• Country/Division Heads
• A. Casini, G. Ronca
• T. Weimer
• C. Vivaldi
• G. Bisagni, O. Khayat

Commercial Banking Italy: context and competitive advantages
UniCredit competitive advantages, 9M2016
• Macro environment showing signs of recovery (1% GDP growth 2017-2019)
• Robust fundamentals in selected areas (e.g. high saving rate)
• High NPEs is a legacy of the past which is being decisively dealt with
Market context
• Share of wallet on loans118.8%
49% • Share of customers foreign trade2
• Number of Corporate clients46,300
Corporate
€334bn • TFA3
• Number of Retail clients7.4m
Retail
12% • Retail market share4
31
1. Corporate Loans (only loans in bonis, excluding leasing and factoring) 2. UniCredit share on customers international guarantees and import letters of credit3. Total Commercial Banking Italy 4. Households loans and deposits, August 2016 Note: Numbers might be roundedSource: GDO-Italian central credit register, Prometeia
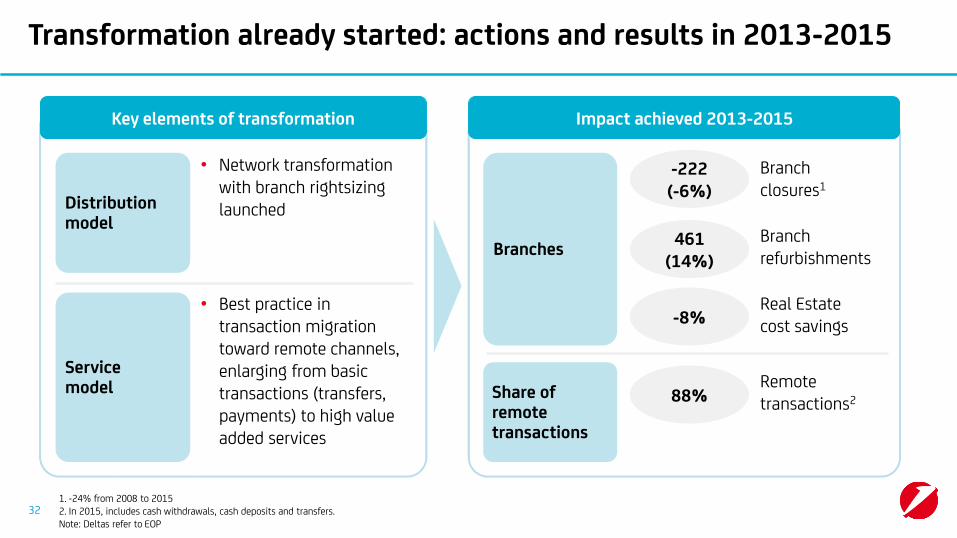
Transformation already started: actions and results in 2013-2015
1. -24% from 2008 to 2015 2. In 2015, includes cash withdrawals, cash deposits and transfers.Note: Deltas refer to EOP
Distribution model
• Network transformation with branch rightsizing launched
Servicemodel
• Best practice in transaction migration toward remote channels, enlarging from basic transactions (transfers, payments) to high value added services
Branches
-222(-6%)
Branch closures1
Share of remote transactions
88%Remote transactions2
Impact achieved 2013-2015Key elements of transformation
461(14%)
Branch refurbishments
-8%Real Estatecost savings
32

Networkorganization
• Streamlining of Italy headquarter
• Delayering and organizational simplification
• Retail/Corporate specialization
• Footprint optimization and new formats
• High value segments and remote advisorySales channels
Day-to-dayBanking
• Reduction of in-branch transactions and low valueadded functions through self-service
Key priorities: operating model transformation
Number of levels3 in network organization#
Branch network rationalization # Branches
-1
20192015
3,283-8832,4001
2019 vs. 2015
• Simplification of product range
• Streamlining and digitalization of key processesCustomerinteraction
Actions
FTE reduction for processes redesigned end-to-end
Index100%
70% -30p.p.
Remote transactions2
%88%
+7p.p.95%
1. 3,140 Branches already achieved at 9M2016 2. Includes cash withdrawals, cash deposits and transfers 3. Organizational layers composing sales network.
Already in 2017
33
4 3

Key priorities: business actions
1. Total Commercial Banking Italy
2. Cessione Quinto Stipendio (salary-backed loans).
Strengthenasset gathering
• Advisory step-up both in branch and remote
• Product innovation and conversion towards Asset under Management
Reaffirm leading position in Retail
• Improve consumer finance market share with existing clients with strict risk control and focus on safer products (CQS2)
• Regain market share of Small Business focusing on clients with good credit standing
• Strengthen cross-selling culture, leveraging on CIB and international presence
• Service model evolution (dynamic segmentation, client needs – product offer matching)
Corporate –Focus on One Bank delivery
Actions 2019
+2.2% CAGR(+€30bn)
+3.7% CAGR
+6.5p.p.
Delta vs. 2015
€365.8bn1
€84.5bn
9.0%
TFA
Retail lending volumes
ROAC
Corporate
34

Key priorities: disciplined new origination and tight monitoring
• Centralization of underwriting for selected portfolios
• Focus on investment grade customers
• Increase of share of clients eligible for automatic lending on small business
• Set up of pre-approved decision process for personal loans
• Managerial KPI to ensure sound origination
Underwriting
Monitoring
• Advanced early warning signals and automatic triggeringof classification to worst status
• Preemptive transfer to restructuring and workout
• Faster deleveraging on riskier customers vs. competitors
• Managerial KPI to monitor risk dynamics of credit portfolio
Actions
Note: Figures adjusted considering one-off LLP
Evolution
Gross NPEratio%
NPE cover. %
Bad loans
UTP
2.9%
0.7%
2.8%
2.8%
0.6%1.9%
9M2016 adjusted
6.3%5.2%
2019
UTP Bad loansPast due
52.4% >52%
CoRBps
129 53
71.1% >68%
39.9% >38%
35

Targets
CAGR 15-192015 20199M2016
Revenues -0.2%7,668 7,6135,761
2017
1. Considering one-off provisions adjustments. Note:RoAC: Return on Allocated Capital (Annualized net profit / Allocated Capital); Allocated Capital based on RWA equivalent figures calculated with a CET1 ratio target of 12.5% for all the plan horizon, including deductions for shortfall and securitizations.
-3.7%-4,620 -3,972-3,486Costs
60.3% 52.2%60.5% 61.0%Cost/income
91bps 53bps129bps1 67bpsCost of Risk
4.2% 77,008 90,68778,868 87,845RWA
6.7% 15.7%10.3% 11.5%ROAC
36
7,378
-4,504

Agenda
• G. F. Papa• Focus on One Bank, Risk discipline and execution of the plan
Topic Speaker
• G. F. Papa• UniCredit competitive advantages andtransformation journey
37
• Divisional highlights
• Commercial Banking Italy
• Commercial Banking Germany
• Commercial Banking CEE
• CIB
• Country/Division Heads
• A. Casini, G. Ronca
• T. Weimer
• C. Vivaldi
• G. Bisagni, O. Khayat

Commercial Banking Germany: context and competitive advantages
• Largest European economy (21% of EU GDP1)
• Leading EU export country (exports at 48% of GDP1)
• Resilient economic growth
Market context
Private Banking & Wealth Management
• Solid position in growing andattractive market
• Uniquely positioned to address wealth management needs of entrepreneurs
• Total TFA: €55bn• 51,000 clients
Retail
• First mover in sustainable repositioning and branch rightsizing
• Refocus client base on Affluent segment
• 41% of branches closed and state-of-the-art refurbishment of the remaining branches
• Loans growth expected to pick up
• Highly competitive banking landscape, but traditionally high share of bank financing
UniCredit competitive advantages, 9M2016
• #22 private sector lender for Mittelstandcorporates (Corporates loan book of €59bn)
• Profitable (8.5%ROAC, with 3bps of CoR)
Corporate
• "Go-to bank" for Mittelstand corporates• Access to strong international
Group network and capital markets
1. In 20152. Considering large private banks, 1H2016.Note: numbers might be rounded
38

Transformation program: successful turnaround in Retail
Value proposition
• Focus on Affluent clients, pricing based on share of wallet
Service model/target segments
• “Brick & click" with focus on branch advice and service for affluent segment
Distribution model
• Network downsizing and upgrade of remaining branches
• Full multichannel offer
Branchclosures
-234 (-41%)
• Completed within 12 months
Branch refurbishment
341(100%)
• Completed within 14 months
FTE-2,124(-16%)
• FTE net redundancies1
(-23% in Retail)
Key elements of transformation Impact achieved 2013-2015
391. Commercial Banking perimeter Note: Deltas refer to EOP
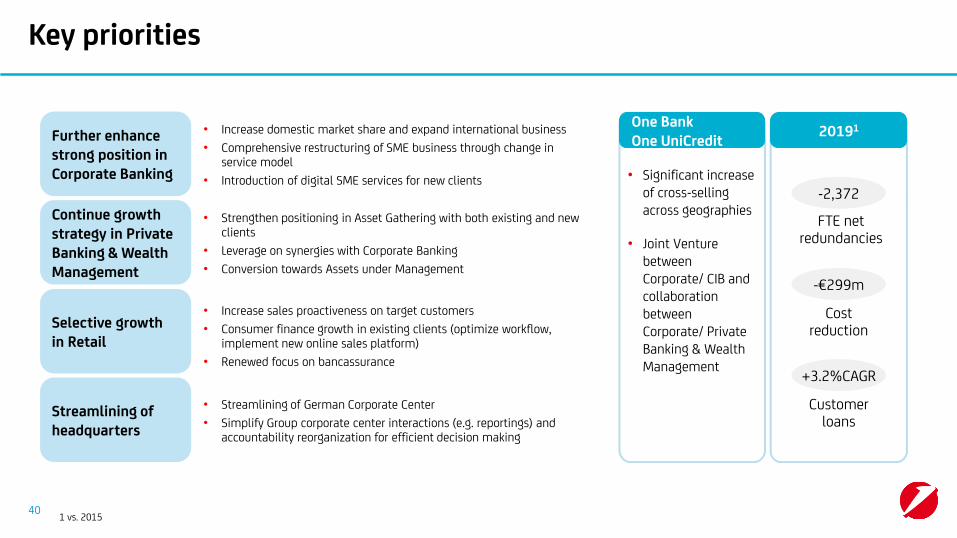
Key priorities
Selective growthin Retail
Streamlining of headquarters
Further enhance strong position in Corporate Banking
• Increase sales proactiveness on target customers
• Consumer finance growth in existing clients (optimize workflow, implement new online sales platform)
• Renewed focus on bancassurance
• Streamlining of German Corporate Center
• Simplify Group corporate center interactions (e.g. reportings) and accountability reorganization for efficient decision making
• Increase domestic market share and expand international business
• Comprehensive restructuring of SME business through change in service model
• Introduction of digital SME services for new clients
• Strengthen positioning in Asset Gathering with both existing and new clients
• Leverage on synergies with Corporate Banking
• Conversion towards Assets under Management
Continue growth strategy in Private Banking & Wealth Management
One BankOne UniCredit
• Significant increase of cross-selling across geographies
• Joint Venture between Corporate/ CIB and collaboration between Corporate/ Private Banking & Wealth Management
FTE net redundancies
-2,372
Cost reduction
-€299m
20191
Customer loans
+3.2%CAGR
1 vs. 201540

Targets
CAGR 15-192015 20199M2016
Revenues
2017
Note: RoAC: Return on Allocated Capital (Annualized net profit / Allocated Capital); Allocated Capital based on RWA equivalent figures calculated with a CET1 ratio target of 12.5% for all the plan horizon, including deductions for shortfall and securitizations.
Costs
Cost/income
Cost of Risk
RWA
ROAC
41
2,652 2,4411,847 -2.1%
-1,997 -1,698-1,432 -4.0%
75.3% 76.6% 69.6%77.5%
6bps 15bps 15bps-1bps
34,030 35,674 36,87135,015 2.0%
7.3% 4.2% 7.1%6.5%
2,461
-1,886

Agenda
• G. F. Papa• Focus on One Bank, Risk discipline and execution of the plan
Topic Speaker
• G. F. Papa• UniCredit competitive advantages andtransformation journey
42
• Divisional highlights
• Commercial Banking Italy
• Commercial Banking Germany
• Commercial Banking CEE
• CIB
• Country/Division Heads
• A. Casini, G. Ronca
• T. Weimer
• C. Vivaldi
• G. Bisagni, O. Khayat

Commercial Banking CEE: context and competitive advantages
UniCredit competitive advantages, 9M2016
• High real GDP growth (2.7% average GDP growth 2016-2019 in CEE EU1 vs. 1.3% in Euro area)
• Underpenetrated banking market (loans/GDP ratio of 52%) with younger customer base2
• High lending growth3 (9.6% in 2015)
• High risk adjusted return (market profitability4 ca. 1.5x vs. Western Europe)
Market context
• Syndicated Loans (Bookrunner and MLA)
• FSS League Tables
#1 #3
1,861 11Retail branchesin CEE7
CEE countries of presence8
• Loans market share5 increase 2013-2015
• Gross NPE ratio6 decrease 2015-9M 2016
• Cost/income vs. peers9 average-8p.p.
-1.4p.p.
+1.3p.p.
1. Bulgaria, Croatia, Czech Republic, Hungary, Romania, Slovakia, Slovenia, includes Bosnia and Herzegovina (managerially mainly under Zagrebacka Banka in Croatia) and Serbia (EU membership process initiated). If considering total CEE, GDP growth at 2.2% 2. CEE's weighted median age is 37 years vs. Western Europe's 46 years, 2015 3. The growth rate refer to CEE as a whole and it is calculated aggregating the countries’ growth rates using their share in total CEE loans and keeping the FX vs. EUR constant at the value of end-2015 4. Profitability computed as Profit before Taxes over average capital and reserves; Profit before taxes might exclude extraordinary items; Western Europe considered as average of Italy, Germany and Austria; based on 2016 forecast, with Western Europe kept constant at 2015 value 5.Gross loans at current FX (%), including BH, BG, HR, CZ, HU, RO, RU, RS, SK, SI, and TR at 40.9% 6. Including PCV 7. Including YKB in Turkey 8. Excluding Azerbaijan, Estonia, Latvia, Lithuania, considering only Retail branches 9. Data are based on 9M2016 Group reporting. UniCredit data include also TR (at equity), Baltics, PCV, CC and others (UCTAM, Consolidation, etc.). Data for ERSTE, Intesa Sanpaolo, KBC and RBI, obtained by summing the volumes for the countries of presence. Data for OTP are based on group consolidated reporting. For all groups contributions to the deposit guarantee funds and resolution funds are in Opex. Financial Transaction Tax and Special Banking Tax are excluded from Opex.Source: Company reports; Merger Markets
• DCM all Eastern European Bonds in EUR
• M&A (number of deals)
One Bank, One UniCredit
43

Key priorities: strengthen market leadership through organic growth
1. Bulgaria, Croatia, Czech Republic, Hungary, Romania, Slovakia, Slovenia, includes Bosnia and Herzegovina (managerially mainly under Zagrebacka Banka in Croatia) and Serbia (EU membership process initiated) 2. vs 2015 3. At current FX. 3.4% CAGR at Constant FX 4. Including Turkey at 100%.
EU1
Russia
Turkey
• Client acquisition leveraging on innovative onboarding approach
• Distinctive value proposition for CEE multi country Corporate clients
• Opportunistic approach to selective portfolio acquisitions
• Focus on Large Corporate and Affluent customers
• Defend current positioning following a selective lending approach compliant with sanctions framework
• Capture opportunities linked to expected economic recovery
• Focus on profitability via efficiency gains and risk containment
• Further develop digital banking, starting from already innovative positioning
Actions 20192
Revenue growth+2.6% CAGR3
Net new clients
+2.6m4
44
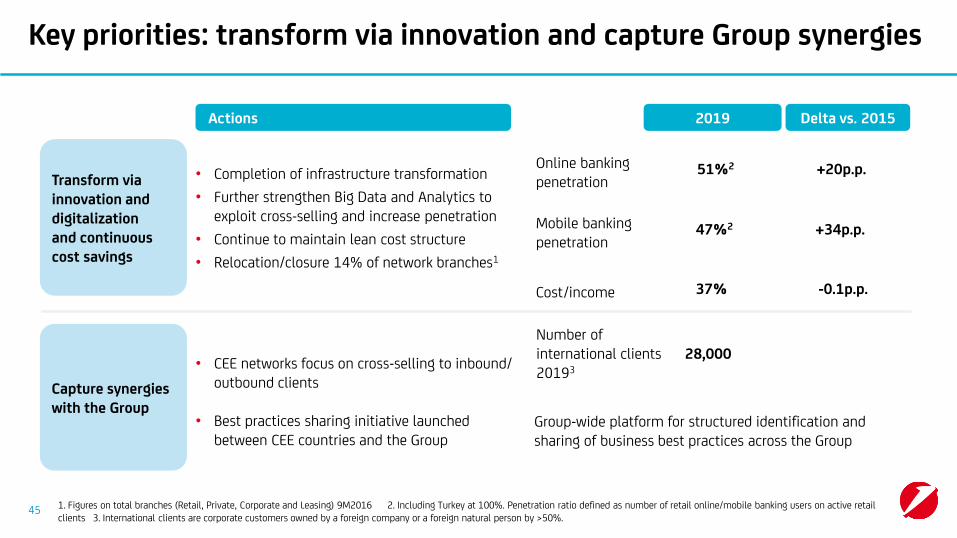
• CEE networks focus on cross-selling to inbound/ outbound clients
• Best practices sharing initiative launched between CEE countries and the Group
Key priorities: transform via innovation and capture Group synergies
Cost/income 37%
Online banking penetration
51%2
Mobile banking penetration
47%2
Number of international clients 20193
28,000
• Completion of infrastructure transformation
• Further strengthen Big Data and Analytics to exploit cross-selling and increase penetration
• Continue to maintain lean cost structure
• Relocation/closure 14% of network branches1
Capture synergies with the Group
Transform via innovation and digitalizationand continuous cost savings
Actions
1. Figures on total branches (Retail, Private, Corporate and Leasing) 9M2016 2. Including Turkey at 100%. Penetration ratio defined as number of retail online/mobile banking users on active retail clients 3. International clients are corporate customers owned by a foreign company or a foreign natural person by >50%.
Group-wide platform for structured identification and sharing of business best practices across the Group
2019 Delta vs. 2015
-0.1p.p.
+20p.p.
+34p.p.
45

Key priorities: continuous strict risk discipline
• Focus on countries with sound macro environment
• Further underwriting process centralization and a strict criteria for new origination
• Reinforced collection process
• Disposal program and enhanced repossession process leveraging on UCTAM1
• Managerial KPIs to ensure sound origination and to monitor risk dynamics
Risk discipline Evolution
73.964.0
>59%58.4%
Gross NPE ratio, %
NPE coverage, %
CoR, bps
Gross loans, €bn
0.5%
3.6%
5.3%
0.5%
2019
4.4%
9M2016
3.8%
10.3%
8.0%
UTPPast due Bad loans
109 110
Note: 9M2016 figures restated considering new Group perimeter
>72%75.8%Bad loans
>47%40.3%UTP
1 UniCredit Turn-Around Management.46

Targets
CAGR 15-192015 20199M2016
Revenues
2017
Note: RoAC: Return on Allocated Capital (Annualized net profit / Allocated Capital); Allocated Capital based on RWA equivalent figures calculated with a CET1 ratio target of 12.5% for all the plan horizon, including deductions for shortfall and securitizations.
Costs
Cost/income
Cost of Risk
RWA3
ROAC
47
€ m, current FX rate
1 3.4% CAGR at Constant FX 2 2.5% CAGR at Constant FX 3. including Turkey at 40.9% 4. 6.1% CAGR at Constant FX.
4,012 4,443 2.6%13,164
37.2% 37.1%35.5%
-1,491 -1,647 2.5%2-1,124
90,603 108,390 4.6%491,182
174bps 110bps109bps
38.5%
100,519
133bps
9.6% 12.3%14.0% 10.5%
4,106
-1,579

Agenda
• G. F. Papa• Focus on One Bank, Risk discipline and execution of the plan
Topic Speaker
• G. F. Papa• UniCredit competitive advantages andtransformation journey
48
• Divisional highlights
• Commercial Banking Italy
• Commercial Banking Germany
• Commercial Banking CEE
• CIB
• Country/Division Heads
• A. Casini, G. Ronca
• T. Weimer
• C. Vivaldi
• G. Bisagni, O. Khayat

CIB: context and competitive advantages
UniCredit competitive advantages, 9M2016
• Abundant liquidity, persisting negative rates and lowcredit spreads
Market context
1. Including prospects 2. Peers include: BNP Paribas, Deutsche Bank, Intesa Sanpaolo, Société Générale (Santander excluded for lack of CIB).Source: Dealogic, Euromoney, Global Finance
Share of client-driven revenues
• Evolving client needs creating opportunities for Regional players, with growing demand for wider spectrum of services
73%
Multinational clients group1>1,100
Financial Institutions andPublic Sectors served
>9,000
• Syndicated and Corporate Loans in Italy, Germany and CEE
• All EMEA covered Bonds
• Bank for Trade Finance in Austria, Bulgaria, Croatiaand CEE in 2016
• Bank for guarantees in 2015
Cost/Income(%)
40% 71%
Peers2UCG
#1 #1
49
Key priorities
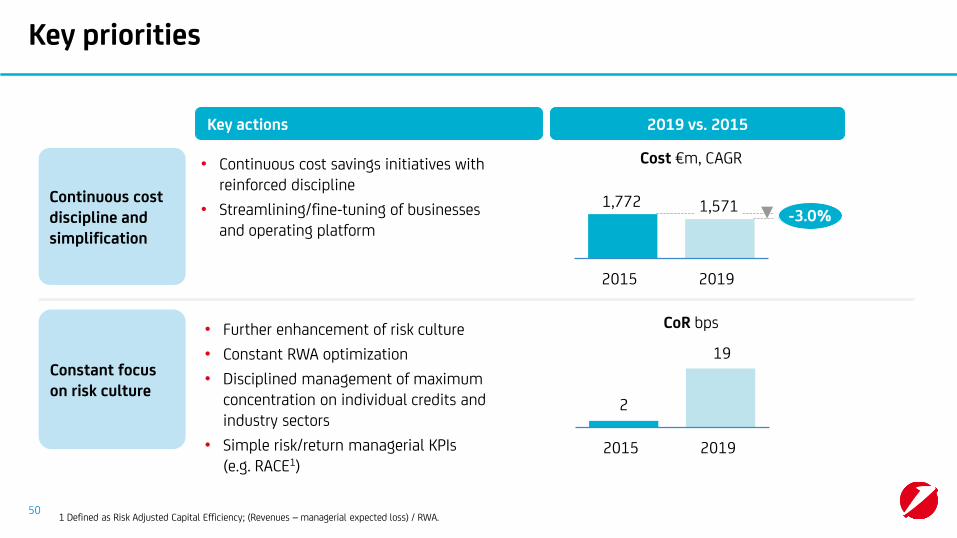
Constant focus on risk culture
Continuous cost discipline and simplification
• Further enhancement of risk culture
• Constant RWA optimization
• Disciplined management of maximum concentration on individual credits and industry sectors
• Simple risk/return managerial KPIs(e.g. RACE1)
• Continuous cost savings initiatives with reinforced discipline
• Streamlining/fine-tuning of businessesand operating platform
Cost €m, CAGR
CoR bps
Key actions 2019 vs. 2015
1,571-3.0%
2015 2019
1,772
2
19
2015 2019
1 Defined as Risk Adjusted Capital Efficiency; (Revenues – managerial expected loss) / RWA.50

Key priorities
Confirm and improve market leadership2
• Expand leadership2 in debt finance and GTB3
• Leverage international network and clients
• Intensify markets capabilities for corporate andfinancial institutions
Fully capture the commercial franchise revenue potential
Key actions 2019 vs. 2015
84%
20192015
66%
Leverage on Group synergies
• Fully capture existing cross-selling opportunitiesacross networks and divisions
• Focus on joint ventures: continue to grow Italian business (3x revenues since inception) and complete roll-out in other countries (e.g. Germany)
Joint CIB-Commercial Banking1
Revenues, € bn
2015
3.22.8
2019
1. Includes revenues on GTB, ECM, DCM, M&A, Markets products from Commercial Banking clients and structured financing products from Corporate clients2. Intended as ranking between #1 and #3 in 8 league tables in 9M2016 3. Global Transaction Banking.
Client-driven revenues% of total
51

Targets
52
€m
CAGR 15-192015 20199M2016
Revenues
2017
Costs
Cost/income
Cost of Risk
RWA
ROAC 14.7% 11.1% 11.0%15.1%
19bps
44.6% 44.6% 41.4%39.6%
-1,772 -1,571-1,297
70,754 85,199 88,27774,370
-3.0%
2bps 24bps25bps1
5.7%
3,974 3,7963,278 -1.1%
Client-driven revenues 5%
3.8% net of models recalibration
1 Considering one-off provisions adjustments. Note: RoAC: Return on Allocated Capital (Annualized net profit / Allocated Capital); Allocated Capital based on RWA equivalent figures calculated with a CET1 ratio target of 12.5% for all the plan horizon, including deductions for shortfall and securitizations.
-1,723
3,865

Agenda
• G. F. Papa• Focus on One Bank, Risk discipline and execution of the plan
Topic Speaker
• G. F. Papa• UniCredit competitive advantages andtransformation journey
53
• Divisional highlights • Country/Division Heads

Maximize synergies and best practice sharing
Germany Austria CEEItaly
CIB
Corporate-HNWI/Private/Retail synergies
International clients
54
Commercial Banking

55
Maximize synergies and best practice sharingGroup-wide cross selling initiatives
Group-wide best practice sharing platform
• New governance and incentive system
• Joint targeting and monitoringCIB – Commercial Banking cooperation
• Cross-acquisition of clients
• Single point-of-contact for individual and company needs,targeting entrepreneurs
Corporate – HNWI/ Private/Retail
synergies
• "Cut and paste" international centers fully dedicated tosupport clients
• Systematic client mapping
Internationalclient support
Key actions
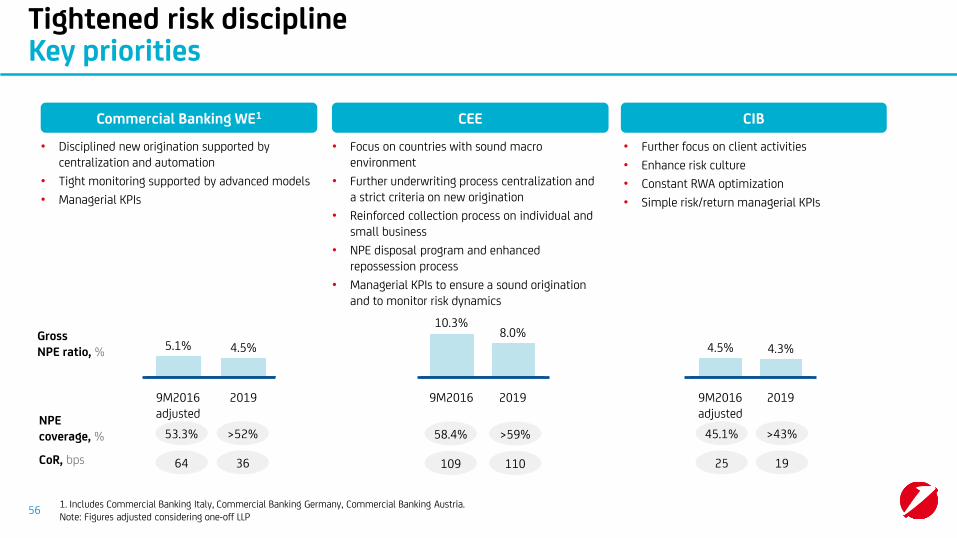
Tightened risk discipline Key priorities
Commercial Banking WE1 CEE CIB
Gross NPE ratio, %
NPEcoverage, %
CoR, bps
2019
4.5%5.1%
9M2016 adjusted
10.3%
9M2016 2019
8.0%4.3%
9M2016 adjusted
4.5%
2019
58.4% >59%
109 110
45.1% >43%
25 19
• Disciplined new origination supported by centralization and automation
• Tight monitoring supported by advanced models
• Managerial KPIs
• Focus on countries with sound macro environment
• Further underwriting process centralization and a strict criteria on new origination
• Reinforced collection process on individual and small business
• NPE disposal program and enhanced repossession process
• Managerial KPIs to ensure a sound origination and to monitor risk dynamics
• Further focus on client activities
• Enhance risk culture
• Constant RWA optimization
• Simple risk/return managerial KPIs
53.3% >52%
64 36
1. Includes Commercial Banking Italy, Commercial Banking Germany, Commercial Banking Austria. Note: Figures adjusted considering one-off LLP
56

Effective execution and governance of the transformation program Dedicated governance and monitoring
Strong empowerment and accountability
• Country and divisional leaders fully empowered to execute the transformation
• Joint staffing of business and supporting functions for initiatives implementation
Tight steering
• Structured monitoring of initiatives based on financial results, managerial KPIsand progress
• Set up of a dedicated Transformation Office to coordinate the plan
• Target achievement and corrective actions discussed in performance reviewwith CEO and General Manager
Targets• 15 Group-wide projects with a detailed execution timeline and phase-in of benefits
• Objectives defined for each initiative and geography
57

Effective execution and governance of the transformation program Managerial KPIs to steer transformation 2019
1. Including CIB division 2. Line of Business 3. Defined as Risk Adjusted Capital Efficiency.
Group-wide managerial KPIs Example of cascading – Value creation
Value creation ROAC
KPIs cascaded down to divisions
CET 1 ratio fully loaded
New business EL
Performing stock EL
∆ Gross NPE yoy
Loan and deposit volumes
Cross-selling
∆ Opex vs. target
Net new clients
Risk & capital governance
Industrial drivers and clients
Coun-try/Div1.
heads
Segment/ LOB2
/Network Heads
Network frontline
ROAC; ∆ EVA
(Revenues-EL)/client
RACE3
ROAC; ∆ EVA
Corporate/CIB
Small Bus.
ROAC; ∆ EVACorporate/CIB
Retail
Revenues/clientIndividuals
58

Effective execution and governance of the transformation program Enablers for the successful execution of the program
Extraordinary capability building
Best talent development(500 “transformation agents”)
Employee engagement
Zero-based investments (€1.6bn1 IT investment cash out over plan period)
Integrated business – “end-to-end delivery unit” (full time resources from Business, IT and relevant Departments)
Human Capital IT support
1 Excluding regulatory, cumulated amount 2017-2019.59

60
Closing remarks
One Bank, One UniCredit
Simple Pan European Commercial Bank, with CIB fully plugged in
Tightened risk discipline to further improve credit portfolio

Annex

Transformation of the network – CBK ItalyThe levers
62
Lean coordination
Network governance rationalization
Other legal entities
Focused sales channels
Products/process E2E streamlining
Migration to direct
• Higher focus on coordination and support to the network
• Rationalization of the structures
• Footprint optimization and new branch formats• Focus on high value customers and push on
remote advisory
• Simplification / reduction of products range
• Radical streamlining and digitalization
• Reduction of in-branch transactions and low value added functions through self-service
• Coordination and specialist roles in Region, Area and Districts
• Rationalization of network structures
• Factoring, Leasing, CordusioFiduciaria, SIM and SubitoCasa
• Branch / Network roles
• Only CBI, perimeter not including competence lines and UBIS
• Teller-seller/mass RMs
1.3
2.8
2.4
1.2
Total savings
0.1
7.8
Cost savings target Units impacted Initiative description FTEs ('000)