Embed Size (px)
Citation preview

Oncology investment & partnering trends – today and tomorrow
May 9th, 2019
Sarah E. Hardison, PhDTherapeutic Area Director, Clarivate Analytics
Willie T. Reaves, Jr., ACPMPODirector, Partnering Products & Services, Biotechnology Innovation Organization (BIO)

2
Agenda
• Setting the pace for 2019
• Licensing trends and Top 10 Deals
• Competitive landscape
• M&A deals
• The rest of the year
• Biopharma VC Funding Trends
• Oncology VC Funding Trends
• IPOs
• BIO Investor Event Partnering Landscape
• Q&A /Closing

3
• Oncology captured 42% of deal activity in 2018• Continuing to see volume and large deals in 2019
• Most deal activity occurs in first and last quarter• Last two quarters have seen a flurry of “mega deals”• What does this mean for the year to come?
Q4 2018-Q1 2019: Setting the pace for the year
from Cortellis 2018 Biopharma Deals & Portfolio Review

4
$-
$500
$1,000
$1,500
$2,000
$2,500
$3,000
$3,500
$4,000
0
50
100
150
200
250
300
350
400
450
500
Drug Technology Company Patent
Mill
ions
Oncology Deals, Q4 2018-Q1 2019
Volume Avg Size
$-
$100
$200
$300
$400
$500
$600
$700
$800
0
20
40
60
80
100
120
140
160
180
Mill
ions
Oncology Drug Deals, Q4 2018-Q1 2019
Volume Avg Size
Oncology deals in the last two quarters
Data from Cortellis Deals Intelligence

5
Oncology drug licensing activity
$-
$100
$200
$300
$400
$500
$600
$700
2013 2014 2015 2016 2017 2018
Mill
ions
Avg Phase II/III Deals
Phase II Phase III
Oncology drug licensing deals, Q4 2018-Q1 2019
● AZ deal with Daiichi Sanyko$6.9B, HER2 ADC
0
10
20
30
40
50
60
70
80
$-
$200
$400
$600
$800
$1,000
$1,200
$1,400
$1,600
Discovery Preclinical Phase 1Clinical
Phase 2Clinical
Phase 3Clinical
Launched
Mill
ions
Oncology Deals by Clinical Phase
Avg Size Volume
Data from Cortellis Deals Intelligence
6
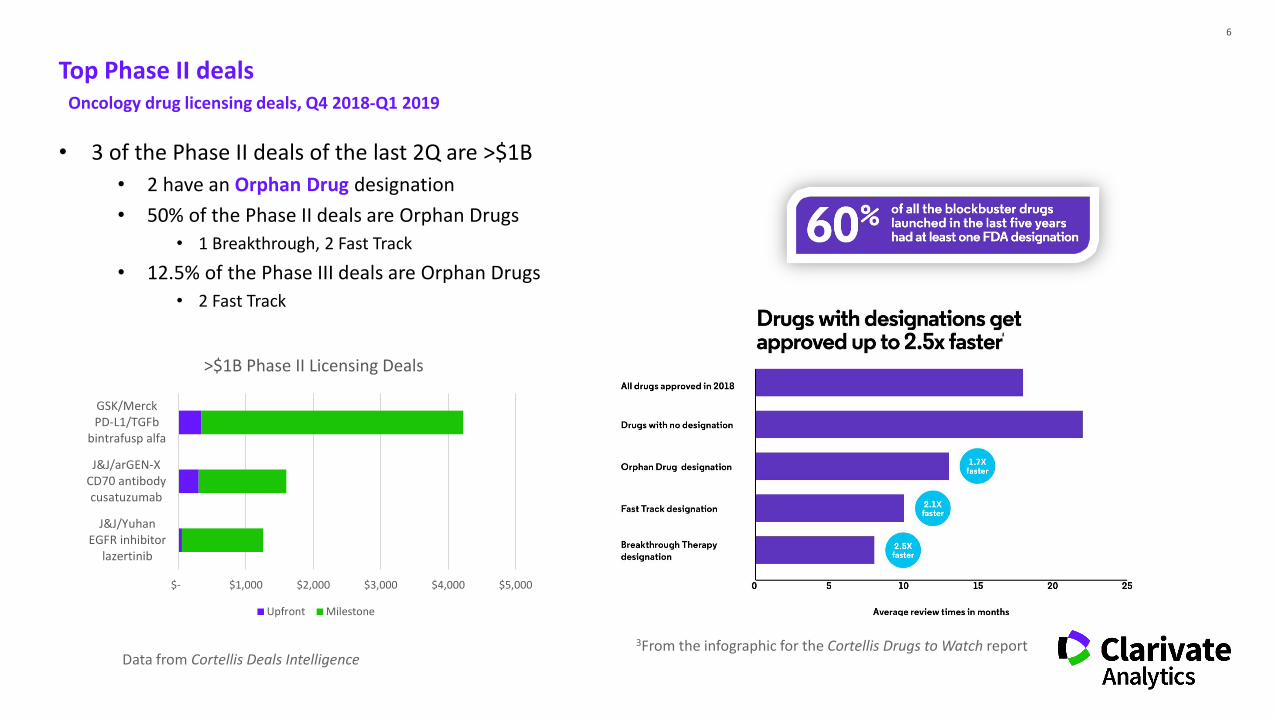
• 3 of the Phase II deals of the last 2Q are >$1B• 2 have an Orphan Drug designation• 50% of the Phase II deals are Orphan Drugs
• 1 Breakthrough, 2 Fast Track
• 12.5% of the Phase III deals are Orphan Drugs• 2 Fast Track
Top Phase II dealsOncology drug licensing deals, Q4 2018-Q1 2019
$- $1,000 $2,000 $3,000 $4,000 $5,000
J&J/YuhanEGFR inhibitor
lazertinib
J&J/arGEN-XCD70 antibodycusatuzumab
GSK/MerckPD-L1/TGFb
bintrafusp alfa
>$1B Phase II Licensing Deals
Upfront Milestone
3From the infographic for the Cortellis Drugs to Watch reportData from Cortellis Deals Intelligence

7
Predicted Success Rates of the top Phase II Deals
Forecasts from Cortellis Analytics: Drug Timeline & Success Rates module

8
Competitive landscape by indicationOncology drug licensing deals, Q4 2018-Q1 2019
NB: some drugs address >1 indication
$1,655
$1,475
$760
$533 $454
$931
$-
$200
$400
$600
$800
$1,000
$1,200
$1,400
$1,600
$1,800
Breast tumor Lung tumor Basal cell cancer Hematologicalmalignancy
Solid tumor Undefined
Mill
ions
Avg Deal Size by Indication
N=1
Data from Cortellis Deals Intelligence
9
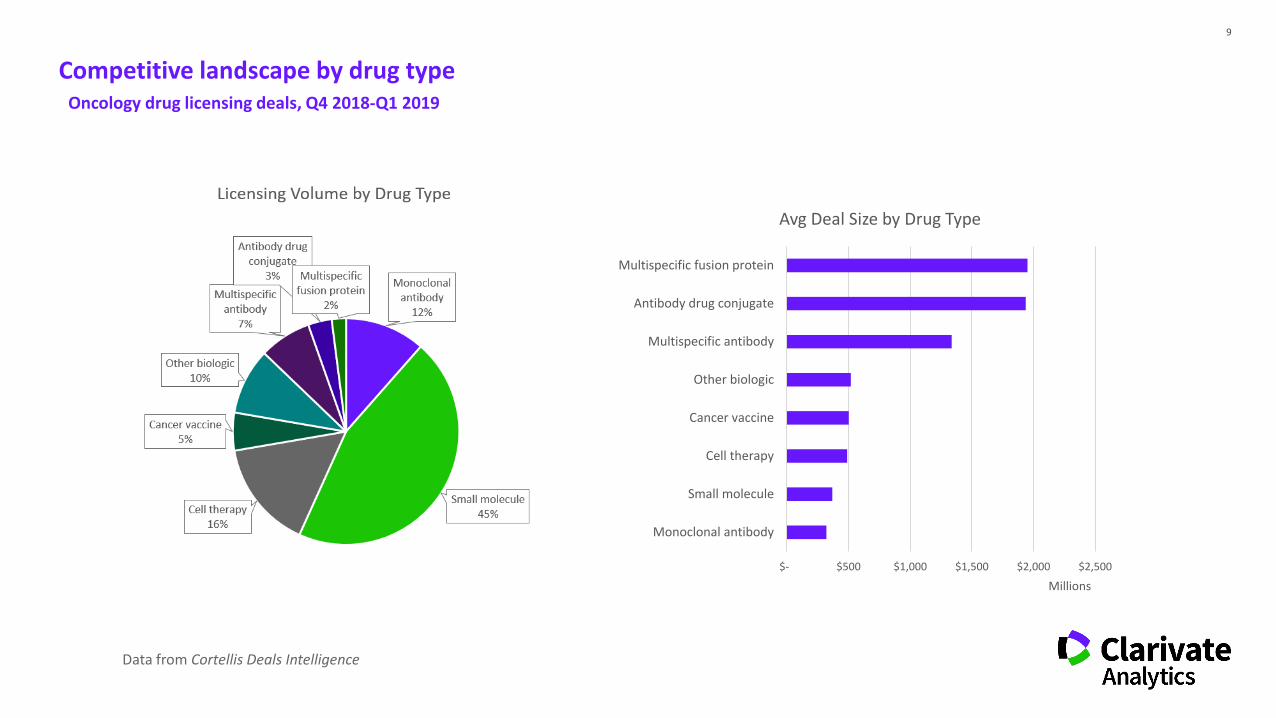
Competitive landscape by drug typeOncology drug licensing deals, Q4 2018-Q1 2019
$- $500 $1,000 $1,500 $2,000 $2,500
Monoclonal antibody
Small molecule
Cell therapy
Cancer vaccine
Other biologic
Multispecific antibody
Antibody drug conjugate
Multispecific fusion protein
Millions
Avg Deal Size by Drug Type
Data from Cortellis Deals Intelligence

10
• GSK to license Merck’s bintrafusp alfa: $4.2B• Anti-PD-L1 antibody (avelumab) fused to TGFβR extracellular domain• Currently 16 trials ongoing: Phase I and Phase II (CRC, breast, pancreas, lung)
• LG Chem to license Cue Biopharma’s CUE-101/2 molecules: $1.1B• Recombinant IL-2 fused to peptide/MHC complex• In preclinical testing, $400M in milestones• LG retain right to name next peptide for development
• Amgen to license Molecular Partner’s MP-0310: $547M• DARPin family (designed ankyrin repeats)• Has one FAP and two CD137-binding domains, “bead on a string”• In preclinical testing
Multispecific fusion protein dealsOncology drug licensing deals, Q4 2018-Q1 2019

11
Top 10 licensing deals of the last 2QOncology drug licensing deals, Q4 2018-Q1 2019
$- $2,000 $4,000 $6,000 $8,000
Cue/LG Chem
Yuhan/J&J
SQZ/Roche
arGEN-X/J&J
Tango/Gilead
Agenus/Gilead
Adaptive/Genentech
Abpro/Nanjing CTT
Merck/GSK
Daiichi Sankyo/AstraZeneca
Millions
Top 10 Licensing Deals
Data from Cortellis Deals Intelligence

12
• The top 4 deals in discovery phase are for drug discovery platforms
• $4.0B: Nanjing Chia Tai Tianqing licenses Abpro’s antibody discovery and engineering platforms (multivalent binders)
• $2.3B: Genentech licenses Adaptive Biotechnologies’ TruTCR screening platform to discover TCRs directed against tumor neoantigens
• $1.75B: Gilead licenses Tango Therapeutic’s CRISPR-based target discovery platform with an option on 5 targets
• $1.38B: Roche licenses SQZ Biotech’s cancer vaccine discovery platform (antigen-loaded APCs)
Drug discovery platforms
(All of these are Immuno-oncology)
Oncology drug licensing deals, Q4 2018-Q1 2019
13
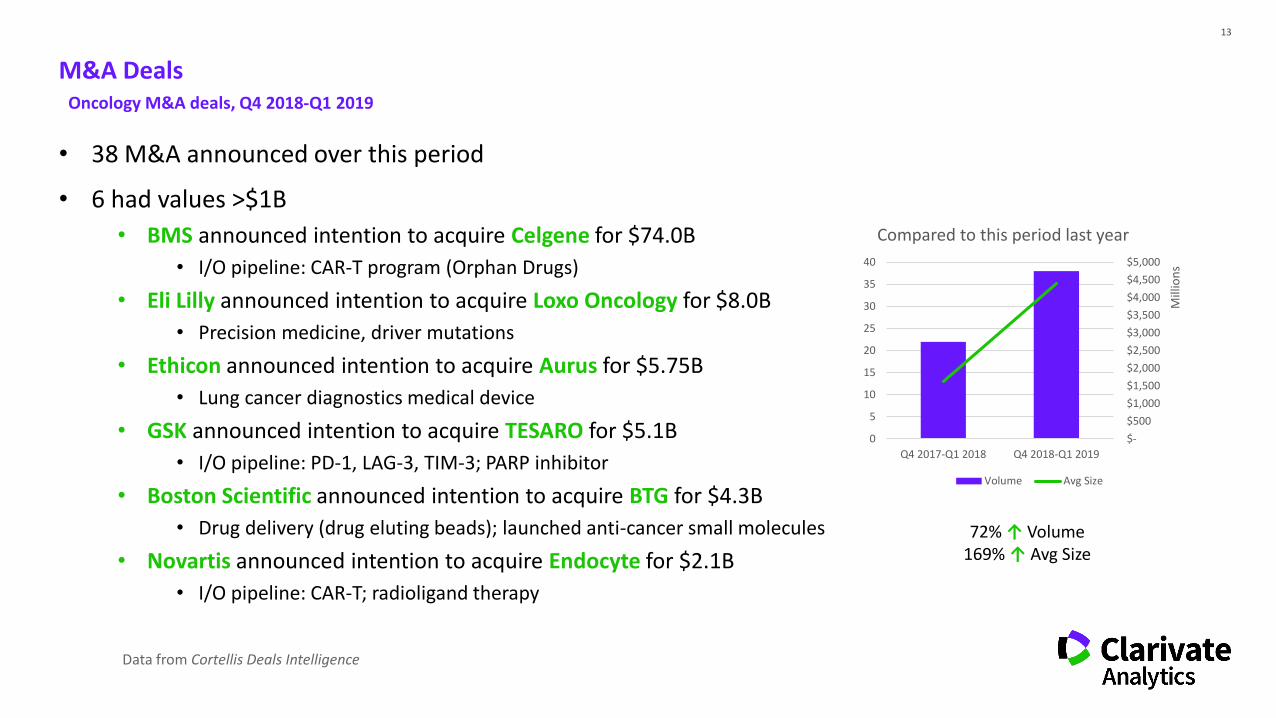
• 38 M&A announced over this period
• 6 had values >$1B• BMS announced intention to acquire Celgene for $74.0B
• I/O pipeline: CAR-T program (Orphan Drugs)
• Eli Lilly announced intention to acquire Loxo Oncology for $8.0B• Precision medicine, driver mutations
• Ethicon announced intention to acquire Aurus for $5.75B• Lung cancer diagnostics medical device
• GSK announced intention to acquire TESARO for $5.1B• I/O pipeline: PD-1, LAG-3, TIM-3; PARP inhibitor
• Boston Scientific announced intention to acquire BTG for $4.3B• Drug delivery (drug eluting beads); launched anti-cancer small molecules
• Novartis announced intention to acquire Endocyte for $2.1B• I/O pipeline: CAR-T; radioligand therapy
M&A DealsOncology M&A deals, Q4 2018-Q1 2019
$- $500 $1,000 $1,500 $2,000 $2,500 $3,000 $3,500 $4,000 $4,500 $5,000
0
5
10
15
20
25
30
35
40
Q4 2017-Q1 2018 Q4 2018-Q1 2019
Mill
ions
Compared to this period last year
Volume Avg Size
72% ↑ Volume169% ↑ Avg Size
Data from Cortellis Deals Intelligence

14
Competitive Landscape: CompaniesOncology M&A and licensing deals, Q4 2018-Q1 2019
Data from Cortellis Deals Intelligence
0
1
2
3
4
5
6
7
8
$-
$1,000
$2,000
$3,000
$4,000
$5,000
$6,000
$7,000
$8,000
$9,000
$10,000
Mill
ions
Top 10 Oncology Buyers, Q4 2018-Q1 2019
Total Deal Value Number of Transactions
0
1
2
3
4
5
6
7
8
$-
$10,000
$20,000
$30,000
$40,000
$50,000
$60,000
$70,000
$80,000
Mill
ions
BMS

15
• What will we see more of this year?• Discovery platforms for novel targets and neoantigens
• CRISPR revolution, bioinformatics, machine learning
• Multispecific drugs and new technologies for creating them
What to expect for the rest of the year
0
20
40
60
80
100
120
140
160
2005 2006 2007 2008 2009 2010 2011 2012 2013 2014 2015 2016 2017 2018
"Neoantigen" appearing in Scientific Literature
Data from pubmed.gov0
50
100
150
200
250
300
$-
$100.00
$200.00
$300.00
$400.00
$500.00
$600.00
$700.00
1995
1996
1997
1998
1999
2000
2001
2002
2003
2004
2005
2006
2007
2008
2009
2010
2011
2012
2013
2014
2015
2016
2017
2018
2019
Mill
ions
Preclinical & Discovery Stage Licensing in OncologyInflation-adjusted to 2018
Deal Size, 2018 Dollars Volume
Data from Cortellis Deals Intelligence

16
Continuing to see more from I/O
0
20
40
60
80
100
120
140
160
$-
$200
$400
$600
$800
$1,000
$1,200
2006 2007 2008 2009 2010 2011 2012 2013 2014 2015 2016 2017 2018
Mill
ions
I/O Deals, Licensing & M&AInflation-adjusted to 2018
2018 Dollars VolumeData from Cortellis Deals Intelligence

Biopharma Venture Capital Funding Trends

More funding flowing into fewer companies

U.S. Venture Capital Funding by Disease Area(Amounts in millions USD)
*Data above reflects U.S. therapeutic companiesSource: BIO Industry Analysis, Cortellis Competitive Intelligence
Disease Area 2003 2004 2005 2006 2007 2008 2009 2010 2011 2012 2013 2014 2015 2016 2017 2018Oncology $836 $1,032 $689 $680 $1,353 $1,136 $919 $616 $923 $740 $1,045 $1,225 $2,011 $1,570 $3,009 $4,434Neurology $360 $989 $473 $481 $493 $453 $532 $314 $219 $313 $355 $456 $1,000 $684 $843 $1,452Infectious $272 $460 $458 $522 $596 $435 $452 $323 $383 $167 $350 $535 $574 $782 $959 $372Other $96 $177 $256 $283 $370 $271 $225 $320 $206 $367 $283 $333 $474 $323 $676 $934Platform $208 $201 $227 $360 $208 $180 $221 $250 $146 $286 $341 $886 $1,020 $512 $450 $1,020CV $253 $230 $281 $299 $374 $221 $167 $141 $256 $283 $177 $56 $245 $51 $127 $850Endocrine $192 $200 $183 $430 $398 $209 $176 $77 $279 $284 $157 $305 $372 $887 $686 $508Metabolic $2 $176 $173 $288 $239 $93 $162 $176 $241 $371 $265 $161 $433 $176 $396 $714Ophthalmology $47 $106 $105 $174 $285 $138 $196 $92 $216 $107 $275 $272 $166 $231 $215 $206Immunology $135 $163 $67 $265 $77 $310 $157 $152 $57 $148 $171 $262 $260 $332 $194 $737Respiratory $174 $240 $64 $157 $237 $169 $106 $154 $106 $65 $60 $59 $210 $138 $170 $428Hematology $103 $88 $210 $126 $170 $109 $90 $104 $91 $150 $90 $42 $162 $66 $48 $27Gastroinstestinal $89 $131 $146 $216 $128 $207 $39 $67 $66 $87 $52 $18 $76 $18 $70 $466Psychiatry $83 $93 $274 $129 $56 $36 $50 $39 $58 $111 $44 $154 $49 $201 $35 $179TOTAL $2,849 $4,286 $3,606 $4,411 $4,984 $3,964 $3,491 $2,826 $3,247 $3,479 $3,665 $4,765 $7,050 $5,970 $7,879 $12,328
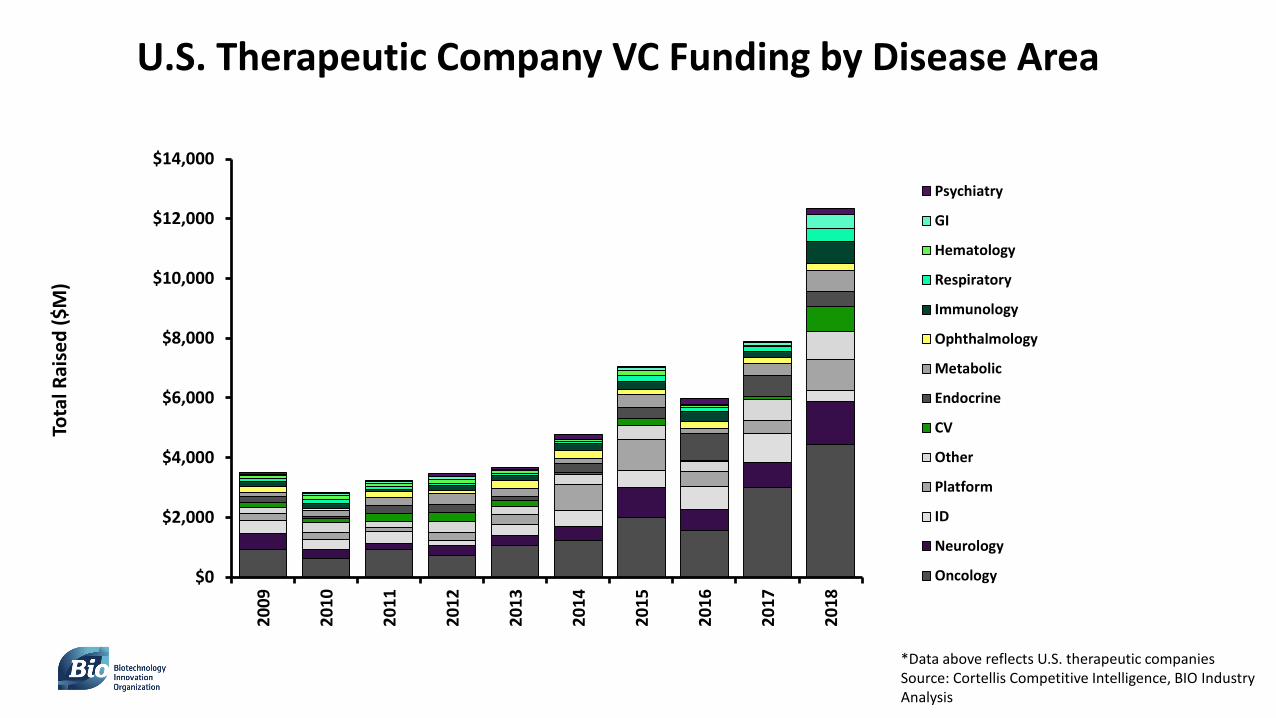
U.S. Therapeutic Company VC Funding by Disease Area
*Data above reflects U.S. therapeutic companiesSource: Cortellis Competitive Intelligence, BIO Industry Analysis
$0
$2,000
$4,000
$6,000
$8,000
$10,000
$12,000
$14,000
2009
2010
2011
2012
2013
2014
2015
2016
2017
2018
Tota
l Rai
sed
($M
)
Psychiatry
GI
Hematology
Respiratory
Immunology
Ophthalmology
Metabolic
Endocrine
CV
Other
Platform
ID
Neurology
Oncology

U.S. Therapeutic Company VC Funding by Series
*Data above reflects U.S. drug & delivery companiesSource: Cortellis Competitive Intelligence, BIO Industry Analysis
$0
$2,000
$4,000
$6,000
$8,000
$10,000
$12,000
$14,000
2009
2010
2011
2012
2013
2014
2015
2016
2017
2018
Tota
l Rai
sed
($M
)
ND Seed A B C D or later

U.S. Oncology: Investment Decade Trend
*Data above reflects U.S. companies onlySource: Cortellis Competitive Intelligence, BIO Industry Analysis
$0
$500
$1,000
$1,500
$2,000
$2,500
$3,000
$3,500
$4,000
$4,500
$5,000
2009
2010
2011
2012
2013
2014
2015
2016
2017
2018
Tota
l Inv
este
d ($
M)
Surge in I/O
BIO’s 5th Annual Emerging Therapeutic Company Investment and Deal Trends Report released at end of May!
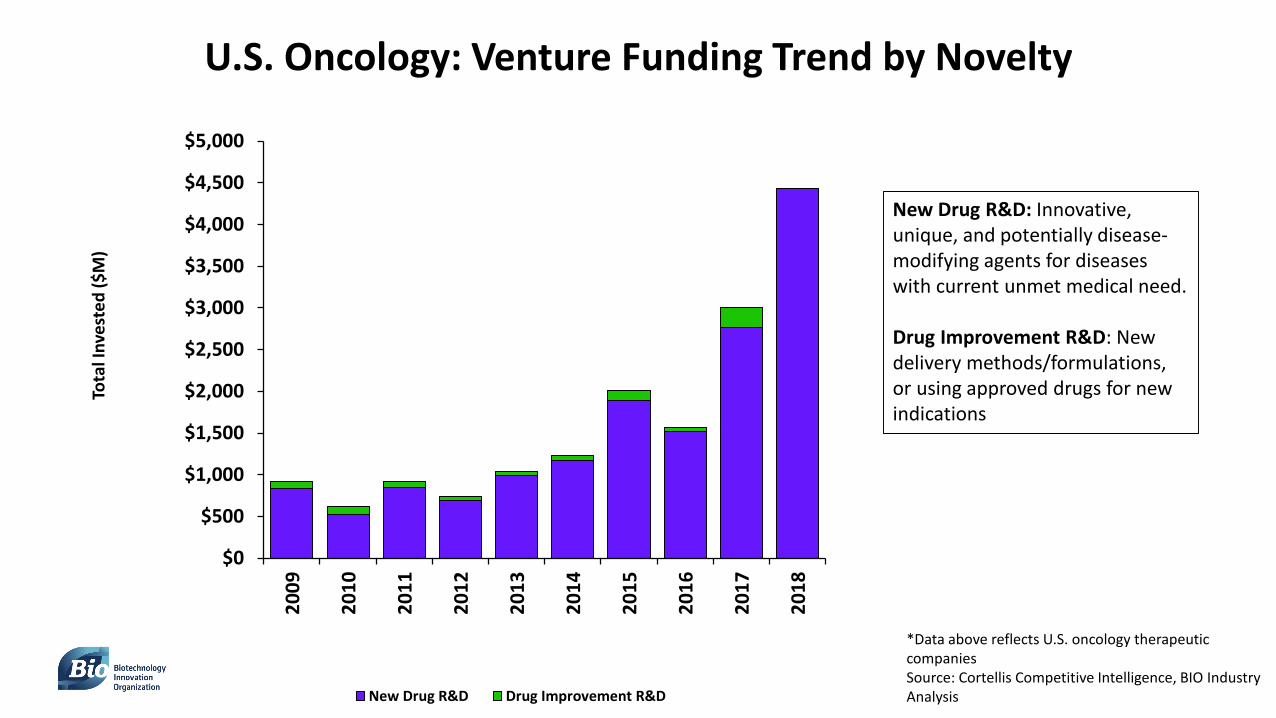
U.S. Oncology: Venture Funding Trend by Novelty
*Data above reflects U.S. oncology therapeutic companiesSource: Cortellis Competitive Intelligence, BIO Industry Analysis
$0
$500
$1,000
$1,500
$2,000
$2,500
$3,000
$3,500
$4,000
$4,500
$5,000
2009
2010
2011
2012
2013
2014
2015
2016
2017
2018
Tota
l Inv
este
d ($
M)
New Drug R&D Drug Improvement R&D
New Drug R&D: Innovative, unique, and potentially disease-modifying agents for diseases with current unmet medical need.
Drug Improvement R&D: New delivery methods/formulations, or using approved drugs for new indications

U.S. Oncology: Venture Funding Trend
*Data above reflects U.S. oncology therapeutic companiesSource: Cortellis Competitive Intelligence, BIO Industry Analysis
In 2018-1Q 2019, investment has increasingly focused on larger investments flowing into a smaller number of companies
0
20
40
60
80
100
120
$0
$500
$1,000
$1,500
$2,000
$2,500
$3,000
$3,500
$4,000
$4,500
$5,000
2009
2010
2011
2012
2013
2014
2015
2016
2017
2018
# of
Com
pani
es F
unde
d
Tota
l Inv
este
d ($
M)
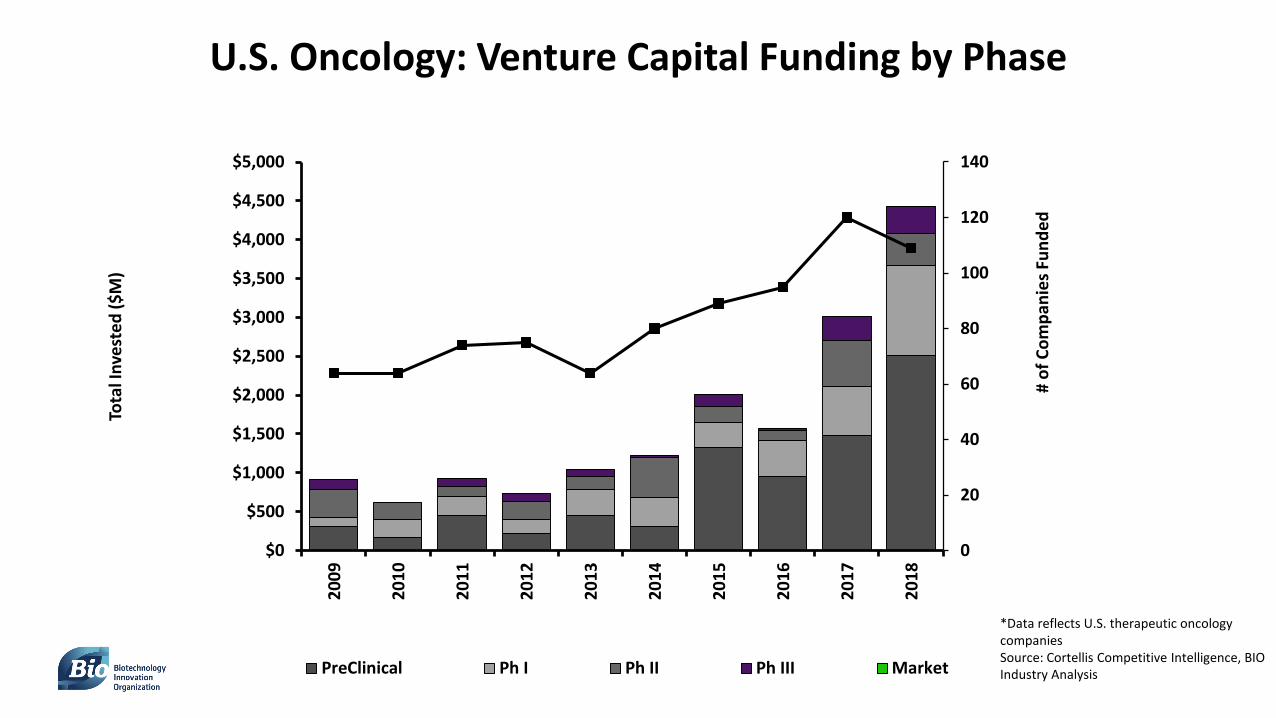
U.S. Oncology: Venture Capital Funding by Phase
0
20
40
60
80
100
120
140
$0
$500
$1,000
$1,500
$2,000
$2,500
$3,000
$3,500
$4,000
$4,500
$5,000
2009
2010
2011
2012
2013
2014
2015
2016
2017
2018
# of
Com
pani
es F
unde
d
Tota
l Inv
este
d ($
M)
PreClinical Ph I Ph II Ph III Market
*Data reflects U.S. therapeutic oncology companies Source: Cortellis Competitive Intelligence, BIO Industry Analysis

Q1 2019 Oncology IPOs
Source: BioSpace 2019 Life Science IPOs
Company Amount (USD) Research Focus
Gossamer Bio $276M Priced Oncology, immunology, inflammation
Anchiano Therapeutics $35M Filed Gene therapy for bladder cancer
Poseida Therapeutics $115M Priced CAR-T for solid tumors and hematological malignancies
TCR2 Therapeutics $75M Priced T-cell therapies for hematologic cancers and solid tumors
Harpoon Therapeutics $75.6M PricedI/O: T-cell engagers that leverage immune system to treat cancer and other disease
Precision BioSciences $126.4M PricedGene editing platform to treat cancer and cure genetic disease

April 2019 Oncology IPOs
Company Amount (USD) Research Focus
Bicycle Therapeutics $86.25M Filed Multiple oncology targets
Codiak BioSciences $86.25M Filed Exosome tx in I/O and ID
Hookipa Biotech $84M Priced Immunotherapies for cancers and ID
IDEAYA Biosciences $70M FiledPrecision medicine targeting oncogenetic pathways and synthetic lethality
NextCure $86.25M Filed Immunomedicines for cancer
Peloton Therapeutics $115M Filed Modulating HIF-2-α for cancer and other diseases
Turning Point Therapeutics $166.5M PricedTargeted oncology therapies, largely in NSCLC and advanced solid tumors
Source: BioSpace, 2019 Life Science IPOs

0 200 400 600 800 1000 1200 1400
Nutritional Disorder
Surgical Procedure
Genetic Disorder
Genitourinary Disease
Musculoskeletal Disease
Ocular Disease
Psychiatric Disorder
Degeneration
Metabolic Disorder
Hematological Disease
Respiratory Disease
Dermatological Disease
Endocrine Disease
Gastrointestinal Disease
Inflammatory Disease
Cardovascular Disease
Immune Disorder
Infectious Disease
Neurological Disease
Neoplasm
2018 BIO Investor Forum: Meetings by Root Therapeutic Area
Source: BIO One-on-One Partnering™

0
20
40
60
80
100
120
140
160
2018 BIO Investor Forum: Assets by Phase
Source: BIO One-on-One Partnering™
98% of preclinical assets were unpartnered—ripe for opportunity!
Small molecule42%
Antibody, protein, peptide20%
Vaccine7%
Drug delivery4%
Other4%
Cell therapy3%
Molecular diagnostics3%
Antisense, RNA3%
Discovery tool3%
Antibiotic3%
Other8%
2018 BIO Investor Forum: Assets by Type

Source: BIO One-on-One Partnering™
0 200 400 600 800 1000 1200
Injury
Musculoskeletal Disease
Gynecology and Obstetrics
Degeneration
Ocular Disease
Genetic Disorder
Genitourinary Disease
Metabolic Disorder
Cardiovascular Disease
Psychiatric Disorder
Dermatological Disease
Respiratory Disease
Endocrine Disease
Immune Disorder
Infectious Disease
Hematological Disease
Gastrointestinal Disease
Inflammatory Disease
Neurological Disease
Neoplasm
2019 BIO CEO & Investor Conference: Meetings by Root Therapeutic Area

Source: BIO One-on-One Partnering™
0 20 40 60 80 100 120 140
Target identification/validation
Lead discovery/optimization
Preclinical testing
Phase 1
Phase 2
Phase 3
Pre registration
Registered
On market
Assets by Phase
2019 BIO CEO & Investor Conference Assets
0 20 40 60 80 100 120 140 160 180 200
Molecular diagnostics
Generics, Biosimilar
Formulation
Other
Medical Device
Drug delivery
Antibiotic
Vaccine
Gene therapy
Cell therapy
Antisense, RNA
Antibody, protein, peptide
Small molecule
Assets by Type

What to Expect in 2019
Source: BioSpace, April 2019 Life Science IPOs
• Large VC investments in a smaller number of companies
• Focus on immune therapies, especially in oncology
• allogeneic immune treatments
• More unicorns (Alector, Gossamer, who next?)

Partnering Best Practices

The Power is in the Profile
• Clinical trials • Deal history and types • Financials/investors• Relevant assets and match potential• Therapeutic areas and indications of
focus
• Clinical trial successes • Geographic areas of interest • In v. out-licensing intention • Partner type sought
(commercialization, geographic distribution, etc.)
• Scientific milestones
Use Potential Partner’s Profile to EvaluateUse Your Company Profile to Show
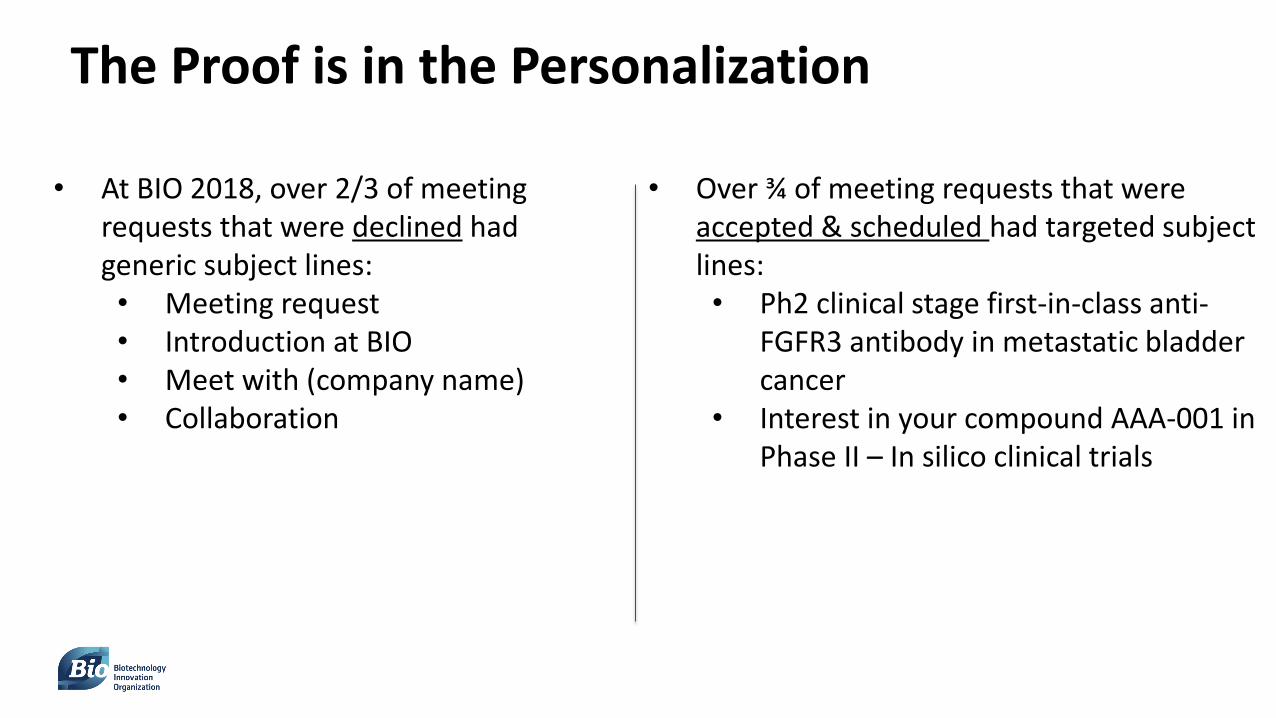
The Proof is in the Personalization
• Over ¾ of meeting requests that were accepted & scheduled had targeted subject lines:• Ph2 clinical stage first-in-class anti-
FGFR3 antibody in metastatic bladder cancer
• Interest in your compound AAA-001 in Phase II – In silico clinical trials
• At BIO 2018, over 2/3 of meeting requests that were declined had generic subject lines:• Meeting request• Introduction at BIO• Meet with (company name)• Collaboration

Q & A
Thank you!

37
More questions? Contact us
Sarah Hardison, Ph.D. Willie Reaves [email protected] [email protected]

This presentation may contain forward-looking statements regarding Clarivate Analytics. Forward-looking statements provide ClarivateAnalytics’ current expectations or forecasts of future events and may include statements regarding anticipated synergies and other future expectations. These statements involve risks and uncertainties including factors outside of Clarivate Analytics’ control that may cause actual results to differ materially. Clarivate Analytics undertakes no obligation to update or revise the statements made herein, whether as a result of new information, future events or otherwise.
Forward-Looking Statements