Embed Size (px)
Citation preview

Oncology Clinical Research Lifecycle
Robert E. Martell, MD, PhD
Medical OncologistTufts Medical Center
Associate ProfessorTufts University School of Medicine

Oncology Drug Development is Costly and High-Risk
Discovery INDStudies IND Early
ComMature
Commercial
Cas
h Fl
ow
-
+
• Grants• Private
Finance
• Angel Investors
• Venture Capitalists
• Stock Owners
Successful
Moderate
Unsuccessful
• Commercial Revenue
EarlyClin
LateClin
NDA
Cash Flow“Valley of Death”
Preclinical Clinical Development Marketed
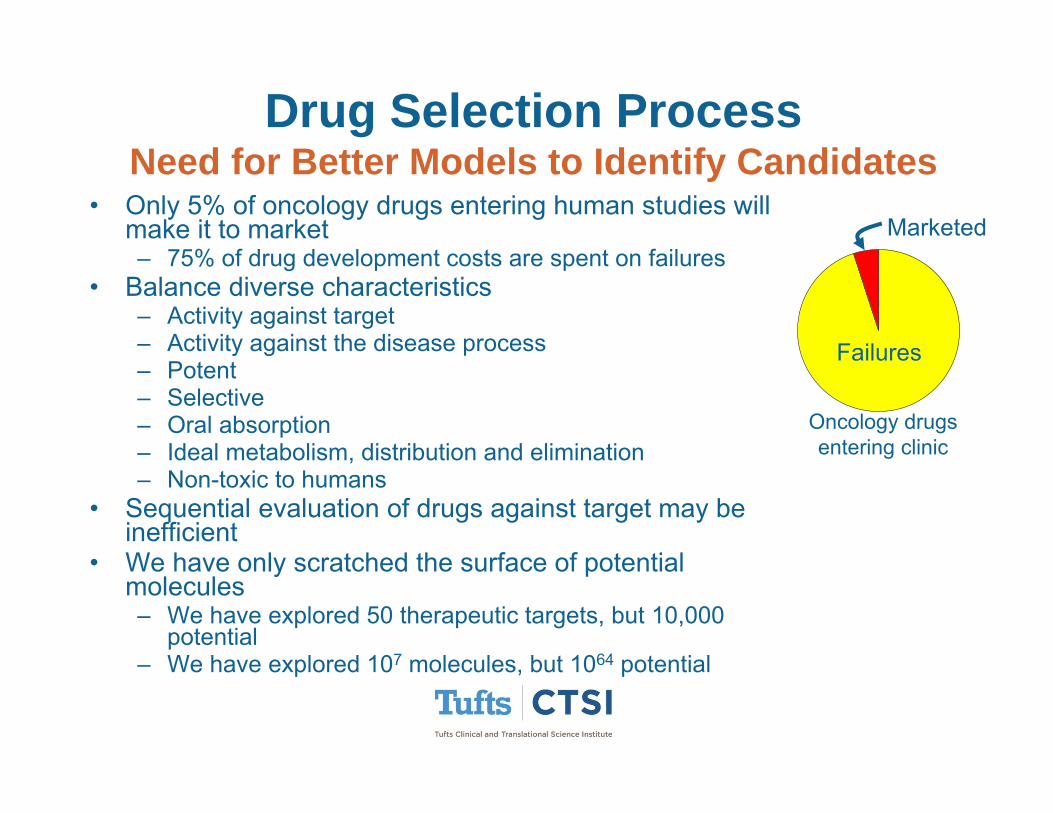
Drug Selection ProcessNeed for Better Models to Identify Candidates
• Only 5% of oncology drugs entering human studies will make it to market– 75% of drug development costs are spent on failures
• Balance diverse characteristics– Activity against target– Activity against the disease process– Potent– Selective– Oral absorption– Ideal metabolism, distribution and elimination– Non-toxic to humans
• Sequential evaluation of drugs against target may be inefficient
• We have only scratched the surface of potential molecules– We have explored 50 therapeutic targets, but 10,000
potential– We have explored 107 molecules, but 1064 potential
Failures
Marketed
Oncology drugs entering clinic

Steps for Oncology Drug Development
• Non-clinical studies; Investigational New Drug (IND) • Phase I, II and III, marketing approval and phase IV. • Drug development time (from first-in-human to approval)
– Oncology: 8 years– Non oncology: 4-6 years
• Challenges in oncology drug development– Phase I development slower
• Patients• Narrow therapeutic index of many agents • Incremental process required to safely identify a maximum tolerated
dose (MTD)• Less-than-ideal pharmacokinetic or adverse event (AE) profile is
tolerated– Phase II lack of activity is more common setting for discontinuing
development

NON-CLINICAL SUPPORT

Non-Clinical Studies To Support Human Testing
• Essential studies in US– Rodent study to identify doses that produce life-threatening and non-
life-threatening toxicity, – Non-rodent study to better characterize the tolerability of the drug in
that species • Important Studies
– Safety pharmacology, toxicokinetic, pharmacokinetic, single/repeat dose toxicity, local tolerance, genotoxicity, carcinogenicity, reproduction toxicity and pharmacodynamic studies.
• Objective– Identify a safe starting dose for phase I trials in humans– Determination of potential drug toxicities
• Unique aspects with oncology– Top dose not necessarily limited by non-clinical dosing– Carcinogenicity studies
• Not usually needed prior IND; sometimes occur after market • Important for drugs intended for chronic use, chemoprevention, or adjuvant
therapy

Determination of Safe Human Starting Dose
• Body surface area (BSA, e.g. mg/m2)– Used to relate toxicity between species – DuBois: BSA=0.007184 * weight(kg)0.425 *
height(m)0.725, – Mosteller: BSA= the square root of ([height(cm) x
weight(kg) ]/ 3600 ). • Calculation of starting dose
– Determine the dose that is severely toxic to 10% of a rodent species (STD10)
– Converted to the human equivalent dose on the basis of mg/m2
– Apply a safety factor (for example one-tenth the STD10)

PHASE 1

Gelsinger Case
• Jesse Gelsinger 18 year-old, first person publicly identified as having died in a clinical trial for gene therapy
• Mild form of ornithine transcarbamylase deficiency• Clinical trial aimed at developing a treatment for infants • On September 13 1999, he was treated and suffered a massive
immune response triggered by viral vector, led to multiple organ failure and brain death
• FDA investigation concluded that the scientists broke several rules of conduct:– Inclusion of Gelsinger despite having high ammonia levels that
should have led to his exclusion from the trial – Failure to report that two patients had experienced serious side
effects from the gene therapy – Failure to mention the deaths of monkeys given a similar treatment
in the informed consent

London/Parexel Healthy Volunteer Study
• On 13 March 2006, healthy young volunteers took part in a clinical trial
• TGN1412, developed to fight autoimmune disease and leukemia by the company TeGenero based in Würzburg, Germany
• Six volunteers became violently ill minutes after having been injected with the drug

Dosing in Early Studies• Dosing decisions
– BSA often used in oncology• Relatively little correlation between BSA and organ
function– Dose per body weight (mg/Kg) – Fixed dose
• Human dosing limit– Non-life-threatening settings: limit human
exposure to maximum animal exposure– Life-threatening, incurable disease: top animal
exposure may be exceeded if with careful, incremental dose escalation
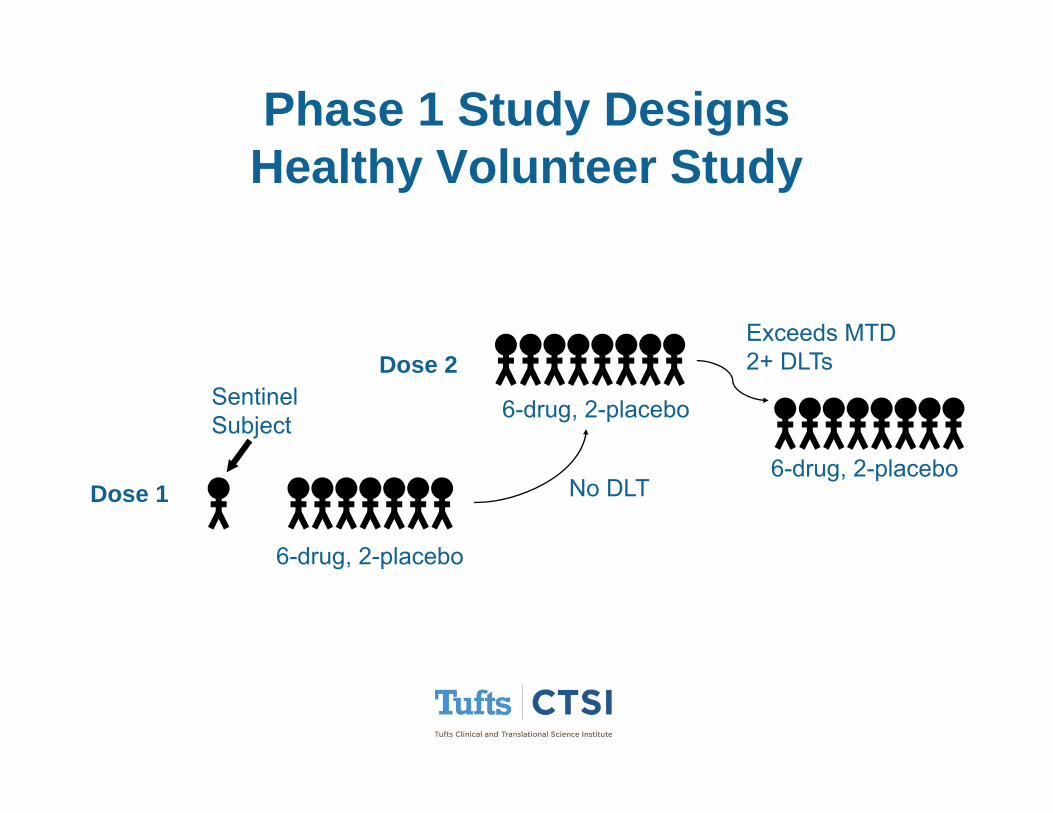
Phase 1 Study DesignsHealthy Volunteer Study
6-drug, 2-placebo
6-drug, 2-placebo
Sentinel Subject
Dose 1
Dose 2
No DLT
Exceeds MTD2+ DLTs
6-drug, 2-placebo
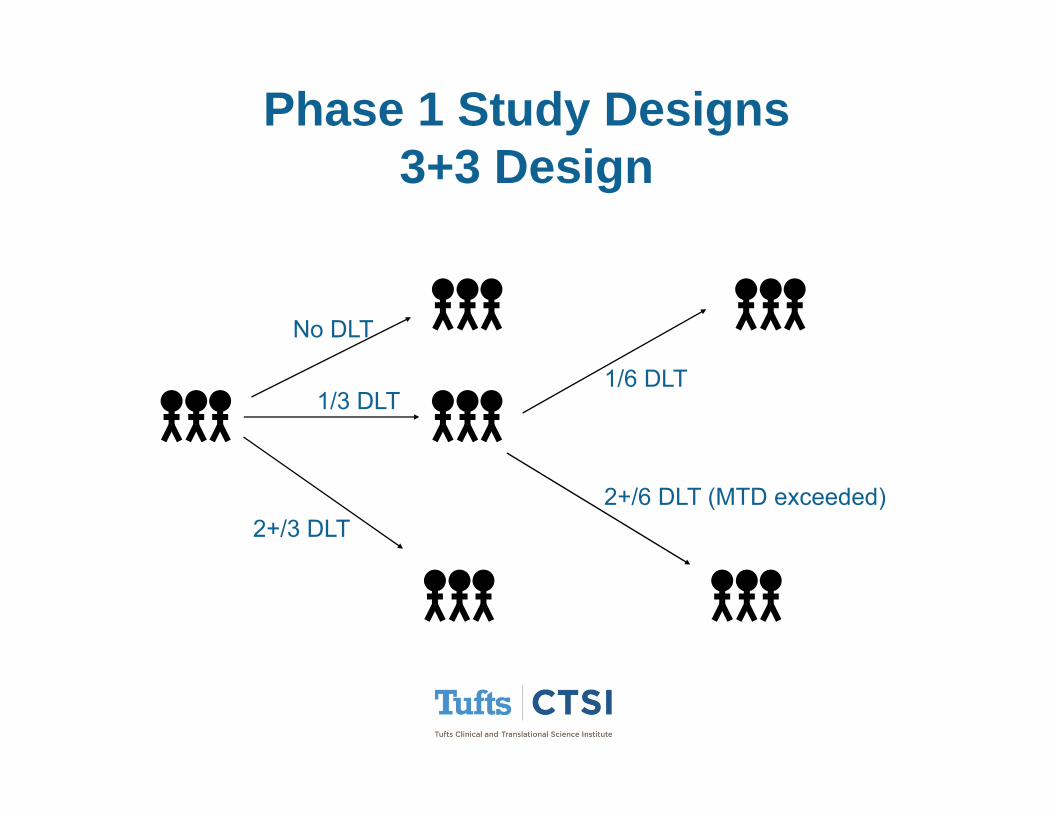
Phase 1 Study Designs3+3 Design
No DLT
1/3 DLT
2+/3 DLT
1/6 DLT
2+/6 DLT (MTD exceeded)

Trial Design: Ph 1: “Modified Toxicity Probability Interval”
• Rules conceptually similar to those used in the 3+3 design– Decisions of the mTPI design are based on posterior
probabilities calculated under a coherent probability model• Choice of target MTD and desired range• Calculated prior to study start • Decisions at intervals of less or more than 3
Ji et al JCO 2013

PHASE 2

Phase 2Key Goals
• Identify ineffective or excessively toxic drugs using a minimum number of subjects
• Explore alternate dosing and indications• Estimate safety and efficacy for phase 3 planning• Fine-tune the recommended dose for a phase III trial
population• Opportunity for regulatory approval in settings of life-
threatening disease with high unmet medical need• Always consider the eventual indication

Common Phase 2 Design
• Single-Arm, or multiple arms with different doses• Can have “reference” arm with no statistical
comparison required (as opposed to formal control)• Stopping rules, eg Simon 2-stage design
19 patients
≥4 responses
≤3 responses
DLT rate >30%
Add 30 patients
Stop
Stop

Case Study: Assessing Value of Stable Disease
• RR: Placebo=0, Sorafenib=2%12 w
Run-in
25%↓
No change
PD
Continue
Randomize
Off Study
OS HR = 0.72

Case Study: Addressing Challenge of Combinations
PD on Irin=329
Iri + Cetux 23% RR
Cetux 11% RROS HR 0.91

Trial Design: Use of Waterfall Plots to Evaluate Efficacy
• Key information– Where chart crosses 0– Where is the median?– Proportion of patients with
CR and/or PR
• Caution– Doesn’t include patients
without scan (ie early PD or toxicity)
– Doesn’t capture duration or any time dynamic
Larkin NEJM 2015

Trial Design: Immuno-Oncology Learnings
• MTD: Not identified in most Ph 1 trials of antibodies– 8% MTD; 15% PK data; 77% Max administered dose– Expansion cohorts with ~13% G3/4 toxicity (consistent with <MTD)– irAEs classically apear 8-10 weeks; Factor in RP2D determination
• Dosing: No clear consensus– Dose Response: No clear correlation– Schedule & Duration: Single dose vs defined # vs indefinite; Frequency– Route: Intratumoral vs IV vs SQ
• Expansion cohorts: Early enrichment strategy– Early molecular selection, potential for breakthrough desig. and AA– Dramatic increase in size of some ph 1 studies
• Need justification for sample size and robust stopping rules
– TILs and PD-L1+ correlate with response, but not completely sensitive or specific
Postel-Vinay et al 2015

Trial Design: Immuno-Oncology Learnings (cont.)
• Patient population– With better safety profile, consider ECOG2 in Ph1 expansions
• PK: Complexities with Antibodies– Limitations on maximum volume– High-affinity antibodies with target-mediated elimination– Receptor-mediated endocytosis, concentration-dependent half-life, circulating forms of
target receptor • PD
– Receptor occupancy (not dose correlated)– CD4/CD8/cytokines– Polymorphisms that might affect efficacy (eg FcƔRIIIa for rituximab)
• Efficacy– mWHO– RECIST– irRC
• Dissociated response• Delayed response• Pseudoprogression
– Waterfall comparisons– Disease control
Postel-Vinay et al 2015
PHASE 3

Phase 3 Key Goals
• Definitively demonstrate the safety and efficacy of a treatment in a specific population
• Study an indication where new therapy is needed, or improvement is needed
• Gain regulatory approval for a treatment

Interpretation of Trial ResultsMany Different Perspectives
• Principle Investigators• Statistical leaders• Data Monitoring Committee• Regulators• Payers• Journal editors and reviewers• Clinical experts• Guidelines committees• Physicians• Patients

Oncology Endpoints
• Clinical Benefit Endpoints– Live longer– Feel better – Function better
• Surrogates– Tumor shrinkage– Delay in progression

Endpoints For Oncology Drug Approval by FDA
0%
10%
20%
30%
40%
50%
60%
70%
80%
90%
100%
90-99 00-05 06-11
Period
Prop
ortio
n of
App
rova
ls
Time To Event
RR
Symptom
Survival
Response rate and Time-To-Event are most common endpoints
Martell 2013

Case Study: Phase 3 Design With Biomarker Classifier

Case Study: Quantify Value of Benefit
• National Institute for Health and Care Excellence (NICE) decides which drugs and treatments are available in UK
• Considerations:– Benefits patients– Help NHS meet its targets, eg improving
survival rates– Value for money or cost effective
• Quality Adjusted Life Years (QALY)– Used to measure the benefit of a treatment
based on duration and quality of life– Years of Life × Utility = QALY
• Utility: Perfect health=1.0, bedridden=0.5• Value of QALY = $55,000
– If a treatment took someone from bedridden for a year to being out of bed for several hours each day (say utility 0.6) but cost more than $2,250/year, then not recommended

Market Forces Influence Drug Cost

PHASE 4

Phase 4 Development
• Include Phase 1, 2 and 3 designs• Post marketing label expansion• Advancing standards of care• Combinations• Special populations (eg liver or renal failure)• New formulations• Health economic studies

Case Study: Approved Indication vsStandard of Care
0%10%20%30%40%50%60%70%80%90%
100%
Pre 90 90-99 00-05 06-11
Period
Prop
ortio
n of
App
rova
ls
Combination
Single and Combination
Single Agent
0%10%20%30%40%50%60%70%80%90%
100%
Pre 90 90-99 00-05 06-11
Period
Prop
ortio
n of
App
rova
ls
Combination
Single and Combination
Single Agent
Martell 2013
• The majority of approvals are for single agents
• 67% of most common indications list a combination as preferred in NCCN
1º
2º

Challenges in Developing Combinations
• Hundreds of cpds in development; multi-target and specific• Monoclonal antibodies• Small molecules• Novel biologics
• High complexity of combination development • Contribution of each agent to safety and efficacy can’t be taken
for granted• Potential overlapping toxicity• Greater complexity in study design and interpretation• Larger trial size• Delayed proof of concept
• Initial indication for most cancer compounds is as single agent• More and more drugs targeting specific signaling pathways
may require combinations as primary development strategy

General Strategies for Combinationsa) Multiple hits on same targetb) Multiple targets in same pathwayc) Multiple pathwaysd) Target compensatory processes
Dancey and Chen, Nat. Rev. Drug Discov, 2006

Therapeutic Interventions Affecting T-Cell Function in Cancer
Atkins 2015
Increase Tcell infiltration within the tumor; enhance Tcell proliferation
Promote antitumor T-cell activity
Regulate T effector and NK Cytolytic functions; prevent T-cell exhaustion

Case Study: Rare Diseases• Basket study: enrollment based on biomarker classifier rather than histology• Patients with disease associated with Abl, Kit or PDGFR across over 40 rare
indications treated with imatinib

Database: Colorectal Cancer Survival in Diabetics from VA
Database• Over 20,000 patients
with CRC, including >5,000 with DM + CRC
• Detailed data on HgA1c, creatinine , race, AJCC stage, BMI, comorbidity index, CRC treatment
• Metformin use associated with superior survival; Adjusted HR=0.82
Paulus ASCO 2014
• Diabetics taking metformin have lower incidence of cancer and better surgical outcome following neoadjuvant therapy for breast cancer

BIOMARKER DEVELOPMENT

Improved success for drugs with biomarkers

Biomarker validation and sequencing are critical

Case Study: Biomarker Classifier Practical Considerations
Individual Mutations
• Mutation/methylation of DDR genes• DDR gene expression (mRNA, protein)• DDR activity (phospho-protein)
Outcome of HR Deficiency
• DNA copy number aberrations• Microsatellite instability• LOH frequencies
Functional assessment
• RAD51 foci formation• Sensitivity to DNA-damaging agents• Genetic complementation assays
Tumor Biopsy

HRD Score vs Niraparib Sensitivity
Sensitive to niraparib
Resistant to niraparib
0
0.5
1
1.5
2
2.5
3
3.5
4
4.5
0 20 40 60 80 100
HRD score
Predicted non responders
Predicted responders
BRCA1 mut
BRCA2 mut
BRCA1 met
BRCA wt
Patient-Derived Xenografts

Challenges For Oncology Drug Development
Regulatory/Financial Interface
Off-LabelUse
IndicationSize
Historic Present Future
Cost/Indication $$ $$$ $$ ?
$$$ $$ $$ $$

Thank You