Embed Size (px)
Citation preview

Companion Diagnostics and Cancer Biomarkers
Oncogenic Characterization and PharmacologicSensitivity of Activating Fibroblast Growth FactorReceptor (FGFR) Genetic Alterations to theSelective FGFR Inhibitor ErdafitinibJayaprakash D. Karkera1, Gabriela Martinez Cardona1, Katherine Bell1, Dana Gaffney1,Joseph C. Portale1, Ademi Santiago-Walker1, Christopher H. Moy1, Peter King1,MichaelSharp1,RastislavBahleda2, FengR.Luo3, JohnD.Alvarez1,MatthewV.Lorenzi1, andSuso J. Platero1
Abstract
Fibroblast growth factor receptor (FGFR) genetic alterations arefrequently observed in cancer, suggesting that FGFR inhibitionmay be a promising therapy in patients harboring these lesions.Identification of predictive and pharmacodynamic biomarkers toselect and monitor patients most likely to respond to FGFRinhibition will be the key to clinical development of this classof agents. Sensitivity to FGFR inhibition and correlation withFGFR pathway activation status were determined in molecularlyannotated panels of cancer cell lines and xenograft models.Pathway inhibition in response to FGFR inhibitor treatment wasassessed in cell lines (both in vitro and in vivo) and in samples frompatients treated with the FGFR inhibitor JNJ-42756493 (erdafiti-nib). Frequency of FGFR aberrations was assessed in a panel ofNSCLC, breast, prostate, ovarian, colorectal, and melanomahuman tumor tissue samples. FGFR translocations and gene
amplifications present in clinical specimens were shown todisplay potent transforming activity associated with constitu-tive pathway activation. Tumor cells expressing these FGFRactivating mutants displayed sensitivity to the selective FGFRinhibitor erdafitinib and resulted in suppression of FGFR phos-phorylation and downstream signal transduction. Clinically,patients receiving erdafitinib showed decreased Erk phosphor-ylation in tumor biopsies and elevation of serum phosphate. Ina phase I study, a heavily pretreated bladder cancer patient withan FGFR3–TACC3 translocation experienced a partial responsewhen treated with erdafitinib. This preclinical study confirmedpharmacodynamics and identified new predictive biomarkersto FGFR inhibition with erdafitinib and supports further clinicalevaluation of this compound in patients with FGFR geneticalterations. Mol Cancer Ther; 16(8); 1717–26. �2017 AACR.
IntroductionThe successful development of new oncology therapies most
unequivocally requires identifying the patients most likely torespond to a particular targeted intervention. Thus, the discoveryand characterization of biomarkers that accurately distinguishthose more likely to respond patients from a broader populationis critical for successful clinical development. Examples of suchbiomarkers that have already been identified and approved aspredictors of response to therapy include human epidermal
growth factor receptor (EGFR)-2 amplification, which predictspositive response to trastuzumab in women with breast cancer(1), and KRAS mutation, which predicts resistance to the EGFRinhibitors panitumumab and cetuximab in individuals withcolorectal tumors (2, 3). In lung cancer, EGFR-activating pointmutations predict activity to EGFR tyrosine kinase inhibitorserlotinib and gefitinib (4), andALK translocation has been shownto be a predictor of response to crizotinib, a compound targetingthe ALK tyrosine kinase (5). More recently, fibroblast growthfactor receptor (FGFR)-mediated signaling has been shown toplay a role in tumor progression, and recent evidence suggests thatFGFRs are oncogenic drivers in various types of cancer (6),highlighting the need to find predictive biomarkers of FGFR tosupport clinical development.
Fibroblast growth factors (FGF) are a family of secreted factorsinvolved in signaling pathways responsible for embryonic devel-opment, cell proliferation, survival, and migration (7). Twenty-two unique FGF family members have been identified, and aredifferentially expressed in many, if not all, tissues and organsystems, albeit with different patterns and timings (7). FGFactivity is mediated by four transmembrane receptor tyrosinekinases (FGFRs 1�4; ref. 8). FGF binding induces FGFR dimer-ization, leading to phosphorylation of the intracellular tyrosinekinase domain (9, 10). The dimerization-mediated phosphory-lation leads to the activation of downstream signaling transduc-tion pathways, including FRS2, RAS, RAF, mitogen-activated
1Janssen Research and Development, LLC, Spring House, Pennsylvania. 2DrugDevelopment Department (DITEP), Gustave Roussy Cancer Campus and Uni-versity Paris-Sud, Villejuif, France. 3Janssen Research and Development, LLC,Raritan, New Jersey.
Note: Supplementary data for this article are available at Molecular CancerTherapeutics Online (http://mct.aacrjournals.org/).
Current Address for S.J. Platero: Suso Platero, Head Precision Medicine Oncol-ogy, Clinical Development Services, Covance Inc., 206 Carnegie Center, Prince-ton, NJ 08540-9375. Phone: 609-452-4893; E-mail: [email protected]
Corresponding Author: Jayaprakash D. Karkera, Janssen Research and Devel-opment, LLC, 1400McKean Road, Spring House, PA 19477. Phone: 215-628-5219;E-mail: [email protected]
doi: 10.1158/1535-7163.MCT-16-0518
�2017 American Association for Cancer Research.
MolecularCancerTherapeutics
www.aacrjournals.org 1717
on May 23, 2018. © 2017 American Association for Cancer Research. mct.aacrjournals.org Downloaded from
Published OnlineFirst April 17, 2017; DOI: 10.1158/1535-7163.MCT-16-0518

protein kinase (MAPK), PI3K/AKT, signal transducer and activatorof transcription and Phospholipase-C-g (9, 11), which culminatein transcriptional regulation that mediates the functional out-comes of FGFR activation.
The normal regulation of FGFR signaling is often geneticallysubverted to constitutively activate the pathway in a variety ofmalignancies. FGFR activation is attributed to gene amplification,chromosomal translocation, alternative splicing, or point muta-tions. Dramatic gene amplification of FGFR2 was originallyobserved in gastric tumor cell lines, highlighting the oncogenicpotential of the receptor family (12). Subsequently, FGFR familyalterations have been observed in several other malignancies,including breast cancer (FGFR1 amplification; ref. 13), bladder(FGFR3mutations; refs. 14–16), colorectal (FGFR1 amplification,FGFR2 and FGFR3 mutations; ref. 17), and hematologic cancers(FGFR3 overexpression; refs. 18, 19). More recently, FGFR1 geneamplification has also been observed in 10% of squamous cellcarcinoma (SCC) lung cancer patient samples, but not inlung adenocarcinoma (20). Notably, this aberration has beenobserved only in tumor samples from patients with a history ofsmoking. Approximately 24% of all lung cancers are of the SCCsubtype, which is most common in patients with smoking his-tories (20–22). Unlike other forms of non–small cell lung cancer(NSCLC), for which there are molecularly targeted therapiesavailable, SCC treatment options are generally limited to con-ventional chemotherapy (23). FGFR1 is one of the first actionablegenetic targets to be identified as having therapeutic potential inSCC lung cancer, as evidenced in preclinical studies of FGFR1inhibition showing regression of FGFR1 amplified tumors in axenograft model (20, 22). FGFR1 may also be a potential ther-apeutic target in other smoking-related malignancies (22, 24).
FGFR translocations have also been recently observed in abroad range of malignant cell lines, including glioblastoma,NSCLC, breast cancer, bladder cancer, and cholangiocarcinoma(6, 25, 26); however, they largely remain functionally unchar-acterized. FGFR2 was the first family member found to be acti-vated by chromosomal rearrangement (FGFR2–FRAG1) in afunctional screen to identify oncogenes in osteosarcoma (27).Recently, an FGFR3–TACC3 translocation has been reported inlung cancer (28, 29). In general, FGFR translocations result inconstitutive activation of FGFR, due to fusion of the FGFR kinasedomain with the N-terminal portion of an unrelated gene har-boring domain that promote constitutive receptor dimerization.This dimerization results in receptor phosphorylation and down-stream signaling leading to oncogenic transformation (6, 25, 27).
The identification of genetic alterations in multiple FGFRfamily members in human cancers highlights pan-FGFR inhibi-tion as a promising therapeutic approach in a variety of malig-nancies. Several small molecule FGFR inhibitors with differingselectivity and potency profiles, such as brivanib, dovitinib, AZD-4547, NVP-BGJ398, and erdafitinib, are in various stages ofclinical development. Here we determined the sensitivity ofmolecularly annotated panels of cancer cell lines to FGFRpathwayinhibition, assessed the frequency of select FGFR alterations intumor tissue samples from multiple cancers, and confirmedpathway inhibition in clinical specimens from patients treatedwith erdafitinib. These analyses revealed a high frequency of FGFRgene amplification in a variety of malignancies and tumor celllines. Cell lines harboring FGFR alterations were dependent onthe active pathway for survival and therefore sensitive to treatmentwith erdafitinib. We also extended this characterization to FGFR2
and FGFR3 chromosomal rearrangements recently identified inhuman tumors (26), highlighting the oncogenic potency of thesefusions and their sensitivity to FGFR inhibition. Collectively, thesedata further inform the oncogenic potency and frequency of FGFRgenetic alterations in human cancers and point to the use ofspecific FGFR inhibitors as a rational approach to treating patientsharboring these genetic aberrations.
Materials and MethodsExperimental gastric tumor models
All animal experiments were performed under approvedprotocols of the Institutional Animal Use and Care Committeeof Janssen Pharmaceuticals, Inc. Human gastric cancer xeno-grafts were established by injection of 106 SNU-16 cells (Amer-ican Type Culture Collection) from culture into male nude Nu/Nu rats (nude rate—Crl: NIH-Foxn1(mu) from Charles RiverLaboratories). Tumors were grown for 18 days, followed by 10days of dosing with JNJ-42883919 (precursor of the clinicalcandidate erdafitinib) or vehicle. The rats were subsequentlysacrificed, and tumors were harvested and prepared into forma-lin-fixed paraffin-embedded (FFPE) blocks. SNU-16 humangastric carcinoma cells (106 cells) were fixed in 10% neutral-buffered formalin and also processed for FFPE blocks. Tumorsections and cell blocks were cut at a thickness of 4 mm andplaced on silanized glass slides. Antigen retrieval was carried outin AR10 citrate buffer (Biogenex) for 20 minutes at 120�C in aModel 2100 Retriever (Prestige Medical). Tumor sections wereincubated with rabbit monoclonal anti-human pMAPK anti-body or rabbit monoclonal anti-human p-S6 antibody (CellSignaling Technology) at room temperature for 45minutes. Cellblock sections were incubated with rabbit polyclonal anti-human pFGFR3 (Santa Cruz Biotechnology, Inc.) at roomtemperature for 45 minutes. The Dako EnVision þ DAB rabbitdetection system (Dako North America, Inc.) was used asdescribed by the manufacturer, and sections were counter-stained in hematoxylin. All staining was carried out on a Bio-genex i6000 Automated Staining System. Slides were scannedwith an Aperio ScanScope (Leica Biosystems), and images wereanalyzed for antigen content by positive pixel quantitationusing ImageScope software.
Fluorescence in situ hybridization (FISH)The tissue microarrays (TMA) for human NSCLC, prostate,
colorectal, and breast (ER/PR-positive) cancer were constructedand manufactured at ORDIS Biomed using tissues from theBiobank of the Medical University of Graz, the Lung Biobank ofthe Institute of Pathology, and the Medical University ofInnsbruck. Tissue blocks and the TMAs for malignant melano-ma, ovarian, and breast cancer were obtained from AsterandBioscience. The TMAs were constructed with triplicate 0.6-mmdiameter cores extracted from FFPE patient tumor samples, andtissue cores derived from canis lupus kidney were used asorientation markers. Collection of tumor specimens wasapproved by local Institutional Review Boards of Innsbruckand Graz, Austria.
Dual-color FISH probes for estimation of FGFR gene locusamplification were designed, produced, and obtained fromKreatech Diagnostics (acquired by Leica Biosystem). The FGFR1probe was specific for locus 8p12 and SE8; the FGFR2 probewas specific for locus 10q26 and SE10; and the FGFR3 probe
Karkera et al.
Mol Cancer Ther; 16(8) August 2017 Molecular Cancer Therapeutics1718
on May 23, 2018. © 2017 American Association for Cancer Research. mct.aacrjournals.org Downloaded from
Published OnlineFirst April 17, 2017; DOI: 10.1158/1535-7163.MCT-16-0518

was specific for locus 4p16 and the chromosome-4 centromere(SE4). For estimation of FGFR4 gene locus amplification, aprobe specific for NSD1 (5q35) was used as a surrogate for theFGFR4 gene locus (5q33) and an hTERT (5p153) probe wasused as a hybridization control.
Probehybridizationwas executedper standardprocedureswithoptimized pretreatment conditions for the individual tissue types.In brief, 1.5–5-mm sections of TMAs were deparaffinized at 65�Cfor 30 minutes and washed with Hemo-De solvent. Tissue pre-treatment was executed with 0.2 N hydrochloric acid (20–45minutes, room temperature), followed by microwave heating(600 W, 20 minutes) and a final protease (Abbott) treatment(15–75 minutes, 37�C). For codenaturation, mixed probes (i.e.,FGFR1/SE8 and FGFR2/SE10) were applied on each section andincubated at 80�C for 5 minutes. Subsequent hybridization wasperformed at 38�C–42�C overnight (16–18 hours). Post-hybrid-ization washings were performed with 2� saline-sodium citrate/0.3% NP-40 detergent (72�C, 5 minutes). Finally, slides weredehydrated, stained with 40, 6-diamidino-2-phenylindole, andcovered with Vectashield (Vector Laboratories).
FISH signals in tumor tissue were enumerated in nonoverlap-ping nuclei with complete and intact contours. Target signals (red;i.e., FGFR1 and FGFR2) and control signals (green; i.e., SE8 andSE10)were recorded for each individual core. Digital FISH imageswere captured using a Zeiss Axiophot microscope with an Axio-cam MRm camera (Zeiss) at a magnification of 1,000�. Imageswere processed using Adobe Photoshop 7.0 and exported at aresolution of 150 pixels/inch.
Gene amplification was estimated by the gene ratio (numberof target signals vs. control). A gene ratio � 2 was defined asamplification. When gene locus amplification was restricted to<20%–50% of the tumor, an average gene ratio of <2 wascomputed (i.e., down to 1.4). These cases were classified asamplified but presenting with substantial intratumor hetero-geneity. The gene dose of either target or control was computedby the ratio of number of target signals versus nuclei evaluated.A gene dose� 3 was defined as gene dose elevation (i.e., FGFR1,FGFR2, FGFR3, or FGFR4) or polysomy of the probed chro-mosome (i.e., SE4, SE8, or SE10). Student's t-test was used todetermine statistical differences between FGFR genetic profilesin different types of prostate cancer and between SCC andadenocarcinoma in NSCLC.
FGFR fusion overexpressing cell linesRK3E cells (American TypeCultureCollection), from rat kidney
epithelial cells, were cultured in DMEM supplemented with 10%FBS and 1% antibiotics (Invitrogen). FGFR fusion gene constructswere designed and cloned into the pReceiver expression vector(Genecopoeia). Clones were transfected into RK3E cells using theAmaxa Cell Line Nucleofector (Lonza) following the manufac-turer's protocol. The stably transfected cells were selected incomplete medium with 800 mg/mL of G418 (Invitrogen). Over-expression of the fusions in the stably transfected cells wasconfirmed by real-time PCR and immunoblotting.
Colony formation assayAnchorage-independent growth of the fusion gene-overexpres-
sing cells was tested. One mL culture medium with 0.8% lowmelting point agarose was first plated into each of three wells of asix-well plate. After the agar solidified, each well received another1 mL of 0.4% agar in culture medium containing 100 cells. After
14 days, colonies were fixed and stained with 0.1% cresyl crystalviolet (Sigma-Aldrich). The number of colonies was determinedmicroscopically bymanual counting from triplicate wells for eachcell line.
Immunoblotting analysisFusion-overexpressing RK3E cells were plated in complete
growth medium, serum starved overnight, then re-fed with0.5% FBS growth media. Cells were treated with 1 mmol/L oferdafitinib and comparator compounds in the presence ofligands for 1 hour. For immunoblotting, whole-cell lysateswere collected in RIPA buffer (Thermo Fisher Scientific), andsample protein concentration was assayed using BCA ProteinAssay (Thermo Fisher Scientific). Equal amounts of protein(30 mg per lane) were loaded onto 4-12% Bis-Tris gels (Invitro-gen) followed by SDS-page. Proteins were transferred to nitro-cellulose membranes and probed with antibodies against p-FGFR (#3476), total-FGFR2 (#11835), p-MAPK (#4370), total-MAPK (#4695), p-S6 (#4858), total S6 (#2317), B-actin (#3700or #8457) (Cell Signaling Technology), and total-FGFR3 (SantaCruz Biotechnology). The membranes were blocked with Odys-sey blocking buffer (Li-Cor Biosciences) for 1 hour at roomtemperature, and then incubated overnight at 4�C in a primaryantibody solution (1:1,000) diluted in Odyssey blocking buff-er. After three washes in tris-buffered saline plus 0.1% Tween 20(TBST), the membranes were probed with goat anti-mouse ordonkey anti-rabbit IRDye 680RD or 800CW (Li-Cor Bios-ciences) labeled secondary antisera (1: 10,000) in Odysseyblocking buffer for 1 hour at room temperature. Washes wererepeated after secondary labeling and the membranes wereimaged using an Odyssey scanner and the Odyssey 3.0 analyt-ical software (Li-Cor Biosciences). Effects of erdafitinib werecompared with AZD4547 and NVP-BGJ398.
Drug response testing for FGFR fusion-overexpressing cell linesFusion-overexpressing RK3E cells were seeded into Cultur-
Plate-96 (Perkin Elmer) well plates (1,000 cells/well) in trip-licate in complete growth medium plus the ligands FGF-1 andFGF-2 (R&D Systems Inc.). After 24 hours, cells were serumstarved overnight then re-fed with 0.5% FBS growth media plusFGF-1 and FGF-2. Seventy-two hours after plating, cellswere treated with an 18-point 1:3 dilution series, starting at10 mmol/L of erdafitinib, AZD4547, and NVP-BGJ398. TheMicrotiter plates were then incubated for 72 hours and assayedfor adenosine triphosphate content using the Cell Titer-GloLuminescent Cell Viability assay (Promega Corp.) followingthe manufacturer's instructions with modifications. Briefly, thecells were allowed to equilibrate to room temperature, at whichtime a 1:1 mixture of Cell Titer-Glo reagent was added. The cellswere then placed on an orbital shaker for 2 minutes andincubated for 10 minutes at room temperature to stabilize theluminescent signal. The luminescence was quantified and themeasurements were then conducted using an Envision Multi-label plate reader (Perkin Elmer). IC50 values were calculatedusing GraphPad Prism 5.0 (GraphPad Software Inc.).
Test and authentication of cell linesThe RK3E and SNU-16 cell lines were purchased directly
from American Type Culture Collection on September 4, 2014.The cell lines were tested forMycoplasma using the MycoAlert kit(Lonza) before they were used in any experiments. After fourpassages, the cell lines were aliquoted and frozen in vials as
Predictive and Pharmacodynamic Biomarkers for Erdafitinib
www.aacrjournals.org Mol Cancer Ther; 16(8) August 2017 1719
on May 23, 2018. © 2017 American Association for Cancer Research. mct.aacrjournals.org Downloaded from
Published OnlineFirst April 17, 2017; DOI: 10.1158/1535-7163.MCT-16-0518
stocks. The transformed stable cell lines were last tested in July2015. No independent cell line authentication was performedon these cell lines.
Phase I clinical trialErdafitinib, or JNJ-42756493 (Supplementary Fig. S1), dis-
covered in collaboration with Astex Pharmaceuticals, is aninvestigational agent currently in clinical development. Thedose escalation and expansion phase I study has been previ-ously described (30).
Immunohistochemical analysis of tumorpharmacodynamic biomarkers
Tumor biopsies for pharmacodynamic analyses were option-al in the dose escalation phase but mandatory in the doseconfirmation phase. Tumor biopsy samples were collected atpretreatment (within 28 days prior to the first dose of studydrug) and posttreatment (day 1 of cycle 2 � 7 days). Immu-nohistochemical analysis was performed on the VentanaBenchmark platform using a standard protocol. The phos-pho-p44/42 MAPK (Erk1/2) (Thr202/Tyr204) (D13.14.4E)
rabbit mAb #4370 (R647) from Cell Signaling Technology wasused as the detecting antibody.
ResultsPredictive and pharmacodynamic biomarkers
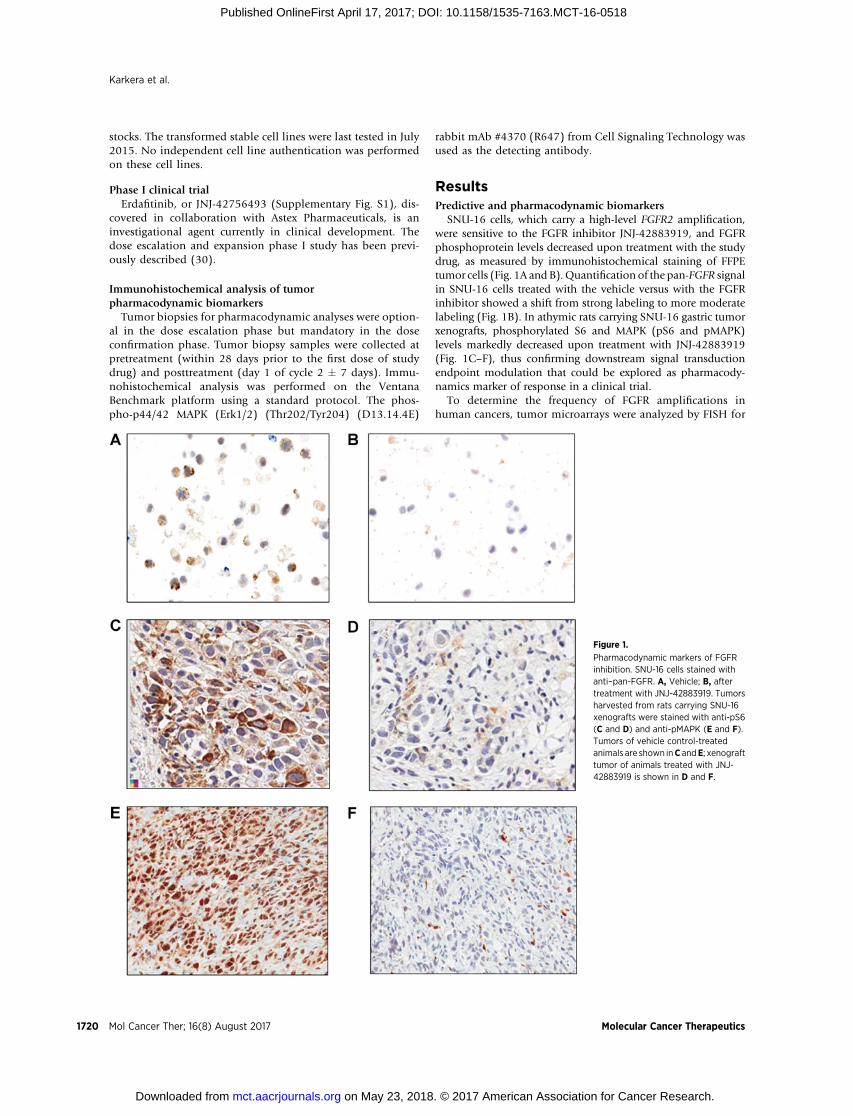
SNU-16 cells, which carry a high-level FGFR2 amplification,were sensitive to the FGFR inhibitor JNJ-42883919, and FGFRphosphoprotein levels decreased upon treatment with the studydrug, as measured by immunohistochemical staining of FFPEtumor cells (Fig. 1A and B).Quantification of the pan-FGFR signalin SNU-16 cells treated with the vehicle versus with the FGFRinhibitor showed a shift from strong labeling to more moderatelabeling (Fig. 1B). In athymic rats carrying SNU-16 gastric tumorxenografts, phosphorylated S6 and MAPK (pS6 and pMAPK)levels markedly decreased upon treatment with JNJ-42883919(Fig. 1C–F), thus confirming downstream signal transductionendpoint modulation that could be explored as pharmacody-namics marker of response in a clinical trial.
To determine the frequency of FGFR amplifications inhuman cancers, tumor microarrays were analyzed by FISH for
Figure 1.
Pharmacodynamic markers of FGFRinhibition. SNU-16 cells stained withanti–pan-FGFR. A, Vehicle; B, aftertreatment with JNJ-42883919. Tumorsharvested from rats carrying SNU-16xenografts were stained with anti-pS6(C and D) and anti-pMAPK (E and F).Tumors of vehicle control-treatedanimals are shown inC andE; xenografttumor of animals treated with JNJ-42883919 is shown in D and F.
Karkera et al.
Mol Cancer Ther; 16(8) August 2017 Molecular Cancer Therapeutics1720
on May 23, 2018. © 2017 American Association for Cancer Research. mct.aacrjournals.org Downloaded from
Published OnlineFirst April 17, 2017; DOI: 10.1158/1535-7163.MCT-16-0518

the presence and abundance of the four FGFR genes (Fig. 2). Inbreast tumor samples FGFR1, FGFR2, FGFR3, and FGFR4 wereamplified at a frequency of 11.7% (29/248), 6.6% (13/198),3% (1/29), and 8.6% (15/175), respectively. In NSCLC tumorsamples FGFR1, FGFR2, FGFR3, and FGFR4 were amplified at afrequency of 21.6% (45/208), 5.6% (11/195), 5.3% (1/19),and 5.1% (5/99), respectively (Supplementary Table S1). Inprostate tumor samples only FGFR1 and FGFR2 amplificationswere measured and the frequencies were 14.6% (14/96) and1.1% (1/94), respectively. While in ovarian cancer FGFR1 andFGFR2 were amplified at a frequency of 2.9% (1/35) and 5.6%(2/36), respectively. No FGFR family gene amplifications were
detected in either colon cancer or malignant melanoma tumorsamples (Supplementary Table S1).
Characterization of FGFR fusion genesOne tumor cell line, RT-4, in the selected tumor cell line panel
analyzed carries an FGFR3 C-terminal translocation and wassensitive to both JNJ-42541707 (IC50 ¼ 27 nmol/L) and erdafi-tinib (IC50 ¼ 0.19 nmol/L; Supplementary Table S2). Based onthis finding, we assessed the capability of other clinically relevantFGFR translocations to transform normal RK3E cells and confersensitivity to erdafitinib (26). FGFR3:TACC3v1, FGFR3:TACC3v3,FGFR3:BAIP2L1, FGFR2:BICC1, FGFR2:AFF3, FGFR2:CASP7,
Figure 2.
Fluorescence in situ hybridization analysis ofFGFR gene amplifications. A, FGFR1; B, FGFR2gene locus amplification in NSCLC;C, high-gradeFGFR1 gene locus amplification in ER/PR-positive breast cancer; D, high-grade FGFR2gene locus amplification in triple-negativebreast cancer; E, FGFR1; and F, FGFR2 low- tomoderate-grade amplification in prostatecancer; G, FGFR4 low-grade level geneamplification in breast cancer.
Predictive and Pharmacodynamic Biomarkers for Erdafitinib
www.aacrjournals.org Mol Cancer Ther; 16(8) August 2017 1721
on May 23, 2018. © 2017 American Association for Cancer Research. mct.aacrjournals.org Downloaded from
Published OnlineFirst April 17, 2017; DOI: 10.1158/1535-7163.MCT-16-0518

FGFR2:CCDC6, and FGFR2:OFD1 translocations were clonedinto vectors and transfected into untransformed RK3E recipientcells to determine the oncogenic potential of the FGFR alterationsin an anchorage-independent growth assay. All FGFR-activatingtranslocations tested conferred the ability to promote soft-agargrowth compared with wild-type FGFRs (Fig. 3A). The transfor-mation activity of these translocations was associated with con-stitutive activation of FGFR anddownstream signaling. The effectsof three pan-FGFR inhibitors, erdafitinib, AZD4547, and NVP-BGJ398, on theMAPK signaling pathway in RK3E cells expressingthese FGFR fusion genes was assessed by immunoblotting. All
FGFR inhibitors tested reduced the levels of MAPK and S6 phos-phorylation induced by the transfection of RK3E cells with FGFR3and FGFR2 fusion proteins (Fig. 3B). In contrast, the effect ofAZD4547 andNVP-BGJ398 on proliferation of these FGFR fusiongene-expressing cells was weaker than the growth inhibition byerdafitinib (Supplementary Table S2). The detection of totalFGFR2 by the FGFR2 antibody was not successful in any of theFGFR2 fusion harboring RK3E cells, but we could detect the HAtag expression in each of the FGFR2-overexpressing cell lines, thussuggesting that the FGFR2 protein was expressed (SupplementaryFig. S2). The failure to detect FGFR2 by FGFR2 antibody could
Figure 3.
Characterization of FGFR2 and FGFR3 fusion gene transformation activity and sensitivity to FGFR inhibitors. A, Effect of expression of FGFR2 and FGFR3 fusionconstructs in RK3E cells in an anchorage-independent colony assay. B, Effect of FGFR inhibitors on the MAPK signaling pathway in RK3E cells expressingstable FGFR2 and FGFR3 fusion constructs and empty vector.
Karkera et al.
Mol Cancer Ther; 16(8) August 2017 Molecular Cancer Therapeutics1722
on May 23, 2018. © 2017 American Association for Cancer Research. mct.aacrjournals.org Downloaded from
Published OnlineFirst April 17, 2017; DOI: 10.1158/1535-7163.MCT-16-0518

potentially be due to the masking of the specific epitope theFGFR2 antibody targets caused by the tertiary conformation of thefusion protein. Overall, these results demonstrate that the FGFR2and FGFR3 translocations tested are oncogenic and confer sensi-tivity to FGFR inhibitors.
Assessment of response markers in patients treatedwith erdafitinib
To confirm the utility of pharmacodynamic markers identifiedin this study, immunohistochemical analysis for phospho-Erk(pErk), a downstreammediator of the FGFR pathway, was carriedout on pretreatment and posttreatment biopsies from patientstreated with erdafitinib (30). Samples were obtained from twopatients enrolled in the phase I clinical trial of erdafitinib. Onebreast cancer patient with archival tumor harboring an FGFR1amplification was treated with erdafitinib at 12 mg daily for 2weeks and biopsied after 7 days of drug interruption (Fig. 4A). Anapproximate 40% reduction in pErk posttreatment was observed.In another patient with pleural mesothelioma of unknown FGFRstatus (Fig. 4B), a 45% reduction in pErk was observed after 3weeks of treatment with erdafitinib at 6 mg daily. Other phar-macodynamic makers such as calcium, phosphate, solubleFGF23, soluble VEGFR, soluble FGFR2, 3 and 4, and vitaminD, were also measured from sera of patients undergoing the trial.Of those, only phosphate levels showed significant dose propor-tional changes upon treatment (30). The increase of serumphosphate concentrations in response to erdafitinib, due to renaltubular FGFR inhibition (31), extends similar findings on serumphosphate levels observed for other FGFR inhibitors (32).
In the phase I study (30), a 52-year-old bladder cancer patient,enrolled in the dose escalation cohort, withmetastases to the lung
who had failed three prior therapies was treated with erdafitinib.This patient had tumor shrinkage of 38%(Fig. 5)with a confirmedpartial response by RECIST criteria (33) and stayed on treatment(at 9 mg daily) for about 10 months. The tumor shrinkage wascalculated based on target lesion measurements at baseline andposttreatment efficacy assessment time point. The FGFR3–TACC3translocation was detected in this patient's tumor sample, extend-ing the observation that these alterations are a predictor ofsensitivity to erdafitinib clinically.
DiscussionA detailed analysis of sensitive and resistant cell lines identified
FGFR gene amplification and translocations as potential markersof response to FGFR inhibitors. FGFR2 and FGFR3 translocationswere shown to be potent oncogenes and resulted in constitutiveFGFR phosphorylation and downstream signaling. Transformedcells expressing these FGFR alterations were sensitive to FGFRsmall molecule inhibition with several inhibitors in clinicaldevelopment, but erdafitinib showed the highest potency in acomparative analysis. Interestingly, a patient whose tumor har-bored an FGFR translocation, FGFR3–TACC3, showed a durablepartial response to erdafitinib by RECIST criteria, demonstratingthat the effects observed in cell lines were also applicable to cancerpatients in the clinic.
FGFR amplifications were shown to be frequent genetic eventsin a variety ofmalignancies. Preclinically, sensitivity was also seenwith FGFR amplifications in tumor cell lines and xenograftmodels, where a decrease in signaling downstream of FGFR wasdemonstrated upon administration of FGFR inhibitors. A recentreport of positive clinical activity of the FGFR inhibitor AZD4547
Figure 4.
Pharmacodynamic biomarkers modulation in patients receiving erdafitinib. Phospho-Erk staining inA, a patient with breast cancer receiving erdafitinib, 12 mg daily;B, a patient with pleural mesothelioma receiving erdafitinib, 6 mg daily. Left and right panels represent pre-dose and post-dose conditions, respectively.
Predictive and Pharmacodynamic Biomarkers for Erdafitinib
www.aacrjournals.org Mol Cancer Ther; 16(8) August 2017 1723
on May 23, 2018. © 2017 American Association for Cancer Research. mct.aacrjournals.org Downloaded from
Published OnlineFirst April 17, 2017; DOI: 10.1158/1535-7163.MCT-16-0518

in gastric and breast cancer patients with high-level amplificationof FGFR2 is very encouraging (34). Interestingly, in the currentstudy the high-level amplification of FGFR2 was observed inbreast, NSCLC, and ovarian cancers at a frequency of 6.6%,5.6%, and 6.0%, respectively. But, in a recent report (35) usingnext-generation sequencing method, researchers reported theamplification of FGFR2 in breast, NSCLC, and ovarian cancersat a frequency of 0.8%, 1.7%, and 0.3%, respectively. Similarly, ahigh-level amplification of FGFR1was reported in breast, ovarian,and NSCLC at a frequency of 14%, 5%, and 9% (NSCLC squa-mous) or 4% (NSCLC adenocarcinoma; ref. 35), respectively,whereas our data using the FISH method showed a frequency of11.7%, 2.9%, and 21.6%, respectively. The discrepancy of thefindings may be due to the different methodologies used in theassessment of the FGFR high-level amplifications. The SNU-16gastric cell line with high-level of FGFR2 amplification has beenshown to be sensitive to erdafitinib, which is in concordance withthe data reported for AZD4547 (34). However, overexpression ofFGFRs in transformation assays is not sufficient to confer a potentoncogenic effect without ligand expression (27), suggesting thatFGFR gene amplifications may be less dominant driver pathwayevents compared with translocations.
A key aspect of drug development is generating clinical datato support what dose levels are taken forward into late clinicaldevelopment. To this end, we examined FGFR-mediated signaltransduction and functional endpoints to determine maximaltarget engagement as a component of dose selection. In pre-
clinical models, downregulation of the pharmacodynamic bio-markers (pErk and pS6) was demonstrated in the SNU-16model after treatment with an FGFR inhibitor. These endpointswere subsequently shown to be modulated in two patientsreceiving erdafitinib, confirming the activity of the inhibitor onsuppressing FGFR-mediated signal transduction (36). Serumphosphate homeostasis has been reported to be controlled byFGFR activity in the renal tubules through the FGF23–klothosignaling axis and that genetic deletion of FGF23 results inupregulation of serum phosphate (32). We showed that erda-fitinib regulating serum phosphate levels in a dose dependentmanner in patients was managed clinically through chelationtherapy and was not associated with significant adverse events(30), an observation consistent with this being an on-mecha-nism class effect (26). Interestingly, FGFR-mediated phosphateincreases provide an interesting on-mechanism endpoint formonitoring clinical target engagement to support subsequentdose selection.
In conclusion, the data from this study credential FGFR ampli-fications and C-terminal translocations as dominant oncogenicevents that confer sensitivity to small molecule FGFR inhibitors.These FGFR activating alterations resulted in constitutive pathwayactivation thatwas observed preclinically and clinically.On-targetFGFR-mediated changes in phosphate regulation were observedclinically and a patient expressing a FGFR3–TACC3 translocationreceived clinical benefit from treatment with erdafitinib. Col-lectively, these observations highlight erdafitinib as a selective
A B
DC
Figure 5.
CT scan images of a patient with FGFR3–TACC3-translocated bladder cancer with a confirmed partial response in lung metastases (marked with white arrows onbaseline scans) responding to erdafitinib. A and C are baseline lung images, and B and D are posttreatment lung images at week 6 for the same patient.
Karkera et al.
Mol Cancer Ther; 16(8) August 2017 Molecular Cancer Therapeutics1724
on May 23, 2018. © 2017 American Association for Cancer Research. mct.aacrjournals.org Downloaded from
Published OnlineFirst April 17, 2017; DOI: 10.1158/1535-7163.MCT-16-0518

FGFR family inhibitor and support its ongoing clinical develop-ment in patients with activating FGFR genetic alterations.
Disclosure of Potential Conflicts of InterestF.R. Luo is an employee of Janssen and has an ownership interest in the
company stock. J.D. Alvarez is a senior scientific director at JanssenResearch and Development and has ownership interest (including patents)in the same. J.D. Karkera and A. Santiago-Walker have an ownershipinterest in the company stock (including patents). No potential conflictsof interest were disclosed by the other authors.
Authors' ContributionsConception and design: J.D. Karkera, G.M. Cardona, K. Bell, D. Gaffney,P. King, R. Bahleda, M.V. Lorenzi, S.J. PlateroDevelopment ofmethodology: J.D. Karkera, G.M. Cardona, K. Bell, D. Gaffney,P. King, R. Bahleda, J.D. Alvarez, S.J. PlateroAcquisition of data (provided animals, acquired and managed patients,provided facilities, etc.): J.D. Karkera, G.M. Cardona, K. Bell, D. Gaffney,J.C. Portale, P. King, R. Bahleda, F.R. Luo, S.J. PlateroAnalysis and interpretation of data (e.g., statistical analysis, biostatistics,computational analysis): J.D. Karkera, G.M. Cardona, K. Bell, D. Gaffney,J.C. Portale, C.H. Moy, P. King, M. Sharp, R. Bahleda, F.R. Luo, J.D. Alvarez,M.V. Lorenzi, S.J. Platero
Writing, review, and/or revision of the manuscript: J.D. Karkera, G.M. Car-dona, K. Bell, D. Gaffney, J.C. Portale, A. Santiago-Walker, P. King, M. Sharp,R. Bahleda, F.R. Luo, J.D. Alvarez, M.V. Lorenzi, S.J. PlateroAdministrative, technical, or material support (i.e., reporting or organizingdata, constructing databases): J.D. Karkera, G.M. Cardona, K. Bell, D. Gaffney,J.C. Portale, M. Sharp, J.D. AlvarezStudy supervision: J.D. Karkera, F.R. Luo, M.V. Lorenzi, S.J. Platero
AcknowledgmentsThis study was funded and supported by Janssen Research and Develop-
ment, LLC. The authors would like to thank Harry Ma for writing andeditorial assistance; and Clifford O. Motley, Dan Rhodes, Timothy Perera,Chris Takimoto, Vijay Peddareddigari, and Marcus Otte for their support andguidance.
Grant SupportThis study was financially supported by Janssen Research and Development,
LLC.The costs of publication of this articlewere defrayed inpart by the payment of
page charges. This article must therefore be hereby marked advertisement inaccordance with 18 U.S.C. Section 1734 solely to indicate this fact.
Received August 3, 2016; revised January 6, 2017; accepted April 5, 2017;published OnlineFirst April 17, 2017.
References1. Burstein HJ, Harris LN, Marcom PK, Lambert-Falls R, Havlin K, Overmoyer
B, et al. Trastuzumab and vinorelbine as first-line therapy for HER2-over-expressing metastatic breast cancer: multicenter phase II trial with clinicaloutcomes, analysis of serum tumor markers as predictive factors, andcardiac surveillance algorithm. J Clin Oncol 2003;21:2889–95.
2. Amado RG, Wolf M, Peeters M, Van Cutsem E, Siena S, Freeman DJ, et al.Wild-type KRAS is required for panitumumab efficacy in patients withmetastatic colorectal cancer. J Clin Oncol 2008;26:1626–34.
3. Karapetis CS, Khambata-Ford S, Jonker DJ, O'Callaghan CJ, Tu D, TebbuttNC, et al. K-ras mutations and benefit from cetuximab in advancedcolorectal cancer. N Engl J Med 2008;359:1757–65.
4. Pao W, Miller V, Zakowski M, Doherty J, Politi K, Sarkaria I, et al. EGFreceptor genemutations are common in lung cancers from"never smokers"and are associatedwith sensitivity of tumors to gefitinib and erlotinib. ProcNatl Acad Sci U S A 2004;101:13306–11.
5. Grande E, Bolos MV, Arriola E. Targeting oncogenic ALK: a promisingstrategy for cancer treatment. Mol Cancer Ther 2011;10:569–79.
6. Williams SV, Hurst CD, Knowles MA. Oncogenic FGFR3 gene fusions inbladder cancer. Hum Mol Genet 2013;22:795–803.
7. Ornitz DM, Itoh N. Fibroblast growth factors. Genome Biol 2001;2:REVIEWS3005.
8. Turner N, Grose R. Fibroblast growth factor signalling: from developmentto cancer. Nat Rev Cancer 2010;10:116–29.
9. Mohammadi M, Dikic I, Sorokin A, Burgess WH, Jaye M, Schlessinger J.Identification of six novel autophosphorylation sites on fibroblast growthfactor receptor 1 and elucidation of their importance in receptor activationand signal transduction. Mol Cell Biol 1996;16:977–89.
10. PlotnikovAN, Schlessinger J,Hubbard SR,MohammadiM. Structural basisfor FGF receptor dimerization and activation. Cell 1999;98:641–50.
11. Hart KC, Robertson SC, Kanemitsu MY, Meyer AN, Tynan JA, DonoghueDJ. Transformation and Stat activation by derivatives of FGFR1, FGFR3,and FGFR4. Oncogene 2000;19:3309–20.
12. Kunii K, Davis L, Gorenstein J, Hatch H, Yashiro M, Di Bacco A, et al.FGFR2-amplified gastric cancer cell lines require FGFR2 and Erbb3 signal-ing for growth and survival. Cancer Res 2008;68:2340–8.
13. Elbauomy Elsheikh S, Green AR, Lambros MB, Turner NC, Grainge MJ,PoweD, et al. FGFR1 amplification in breast carcinomas: a chromogenic insitu hybridisation analysis. Breast Cancer Res 2007;9:R23.
14. Dodurga Y, Tataroglu C, Kesen Z, Satiroglu-Tufan NL. Incidence offibroblast growth factor receptor 3 gene (FGFR3) A248C, S249C,G372C, and T375C mutations in bladder cancer. Genet Mol Res2011;10:86–95.
15. Kiemeney LA, Sulem P, Besenbacher S, Vermeulen SH, Sigurds-son A, Thorleifsson G, et al. A sequence variant at 4p16.3confers susceptibility to urinary bladder cancer. Nat Genet 2010;42:415–9.
16. van Rhijn BW, van der Kwast TH, Liu L, Fleshner NE, Bostrom PJ, Vis AN,et al. The FGFR3mutation is related to favorable pT1 bladder cancer. J Urol2012;187:310–4.
17. Jang JH, Shin KH, Park JG. Mutations in fibroblast growth factor receptor 2andfibroblast growth factor receptor 3 genes associatedwith human gastricand colorectal cancers. Cancer Res 2001;61:3541–3.
18. Chang H, Stewart AK, Qi XY, Li ZH, Yi QL, Trudel S. Immunohistochem-istry accurately predicts FGFR3 aberrant expression and t(4;14) inmultiplemyeloma. Blood 2005;106:353–5.
19. Dvorak P, Dvorakova D, Doubek M, Faitova J, Pacholikova J, Hampl A,et al. Increased expression of fibroblast growth factor receptor 3 in CD34þBCR-ABLþ cells from patients with chronic myeloid leukemia. Leukemia2003;17:2418–25.
20. Weiss J, Sos ML, Seidel D, Peifer M, Zander T, Heuckmann JM, et al.Frequent and focal FGFR1 amplification associates with therapeuticallytractable FGFR1 dependency in squamous cell lung cancer. Sci Transl Med2010;2:62ra93.
21. Garber ME, Troyanskaya OG, Schluens K, Petersen S, Thaesler Z, Pacyna-GengelbachM, et al. Diversity of gene expression in adenocarcinomaof thelung. Proc Natl Acad Sci U S A 2001;98:13784–9.
22. Turner NC, Seckl MJ. A therapeutic target for smoking-associated lungcancer. Sci Transl Med 2010;2:62ps56.
23. Network NCC. NCCN Clinical Practice Guidelines in Oncology: Non-Small Cell Lung Cancer. Version 52015.
24. Freier K, Schwaenen C, Sticht C, Flechtenmacher C, Muhling J, HofeleC, et al. Recurrent FGFR1 amplification and high FGFR1 proteinexpression in oral squamous cell carcinoma (OSCC). Oral Oncol2007;43:60–6.
25. Singh D, Chan JM, Zoppoli P, Niola F, Sullivan R, Castano A, et al.Transforming fusions of FGFR and TACC genes in human glioblastoma.Science 2012;337:1231–5.
26. Wu YM, Su F, Kalyana-Sundaram S, Khazanov N, Ateeq B, Cao X, et al.Identification of targetable FGFR gene fusions in diverse cancers. CancerDiscov 2013;3:636–47.
27. Lorenzi MV, Horii Y, Yamanaka R, Sakaguchi K, Miki T. FRAG1, a gene thatpotently activates fibroblast growth factor receptor by C-terminal fusionthrough chromosomal rearrangement. Proc Natl Acad Sci U S A1996;93:8956–61.
www.aacrjournals.org Mol Cancer Ther; 16(8) August 2017 1725
Predictive and Pharmacodynamic Biomarkers for Erdafitinib
on May 23, 2018. © 2017 American Association for Cancer Research. mct.aacrjournals.org Downloaded from
Published OnlineFirst April 17, 2017; DOI: 10.1158/1535-7163.MCT-16-0518

28. Majewski IJ, Mittempergher L, Davidson NM, Bosma A, Willems SM,Horlings HM, et al. Identification of recurrent FGFR3 fusion genes inlung cancer through kinome-centred RNA sequencing. J Pathol 2013;230:270–6.
29. Wang R, Wang L, Li Y, HuH, Shen L, Shen X, et al. FGFR1/3 tyrosine kinasefusions define a unique molecular subtype of non-small cell lung cancer.Clin Cancer Res 2014;20:4107–14.
30. Tabernero J, Bahleda R, Dienstmann R, Infante JR, Mita A, Italiano A, et al.Phase I dose-escalation study of JNJ-42756493, an oral pan-fibroblastgrowth factor receptor inhibitor, in patients with advanced solid tumors.J Clin Oncol 2015;33:3401–8.
31. Yanochko GM, Vitsky A, Heyen JR, Hirakawa B, Lam JL, May J, et al. Pan-FGFR inhibition leads to blockade of FGF23 signaling, soft tissuemineralization, and cardiovascular dysfunction. Toxicol Sci 2013;135:451–64.
32. Wohrle S, Henninger C, Bonny O, Thuery A, Beluch N, Hynes NE, et al.Pharmacological inhibition of fibroblast growth factor (FGF) receptor
signaling ameliorates FGF23-mediated hypophosphatemic rickets. J BoneMiner Res 2013;28:899–911.
33. Eisenhauer EA, Therasse P, Bogaerts J, Schwartz LH, Sargent D, Ford R, et al.New response evaluation criteria in solid tumours: revised RECIST guide-line (version 1.1). Eur J Cancer 2009;45:228–47.
34. Pearson A, Smyth E, Babina IS, Herrera-Abreu MT, Tarazona N,Peckitt C, et al. High-level clonal FGFR amplification and responseto FGFR inhibition in a translational clinical trial. Cancer Discov2016;6:838–51.
35. Helsten T, Elkin S, Arthur E, Tomson BN, Carter J, Kurzrock R. The FGFRlandscape in cancer: analysis of 4,853 tumors by next-generation sequenc-ing. Clin Cancer Res 2016;22:259–67.
36. FischerH, TaylorN, Allerstorfer S,GruschM, Sonvilla G,HolzmannK, et al.Fibroblast growth factor receptor-mediated signals contribute to themalig-nant phenotype of non-small cell lung cancer cells: therapeutic implica-tions and synergismwith epidermal growth factor receptor inhibition.MolCancer Ther 2008;7:3408–19.
Mol Cancer Ther; 16(8) August 2017 Molecular Cancer Therapeutics1726
Karkera et al.
on May 23, 2018. © 2017 American Association for Cancer Research. mct.aacrjournals.org Downloaded from
Published OnlineFirst April 17, 2017; DOI: 10.1158/1535-7163.MCT-16-0518

2017;16:1717-1726. Published OnlineFirst April 17, 2017.Mol Cancer Ther Jayaprakash D. Karkera, Gabriela Martinez Cardona, Katherine Bell, et al. Alterations to the Selective FGFR Inhibitor ErdafitinibActivating Fibroblast Growth Factor Receptor (FGFR) Genetic Oncogenic Characterization and Pharmacologic Sensitivity of
Updated version
10.1158/1535-7163.MCT-16-0518doi:
Access the most recent version of this article at:
Material
Supplementary
http://mct.aacrjournals.org/content/suppl/2017/04/15/1535-7163.MCT-16-0518.DC1
Access the most recent supplemental material at:
Cited articles
http://mct.aacrjournals.org/content/16/8/1717.full#ref-list-1
This article cites 35 articles, 19 of which you can access for free at:
Citing articles
http://mct.aacrjournals.org/content/16/8/1717.full#related-urls
This article has been cited by 1 HighWire-hosted articles. Access the articles at:
E-mail alerts related to this article or journal.Sign up to receive free email-alerts
Subscriptions
Reprints and
To order reprints of this article or to subscribe to the journal, contact the AACR Publications Department at
Permissions
Rightslink site. Click on "Request Permissions" which will take you to the Copyright Clearance Center's (CCC)
.http://mct.aacrjournals.org/content/16/8/1717To request permission to re-use all or part of this article, use this link
on May 23, 2018. © 2017 American Association for Cancer Research. mct.aacrjournals.org Downloaded from
Published OnlineFirst April 17, 2017; DOI: 10.1158/1535-7163.MCT-16-0518