Embed Size (px)
Citation preview

20 Novembre, 2010
On track to global carco
Q3 Results Review

October 28, 2011 Q3 2011 Results Review 2
CHIEF OPERATING
OFFICERS
BRAND LEADERS
INDUSTRIAL PROCESS LEADERS
CEO
Sergio
Marchionne
SUPPORT/ CORPORATE
LEADERS
EMEA Gianni Coda
NAFTA Sergio Marchionne
LATAM Cledorvino Belini
APAC Michael Manley
Parts & Service
(Mopar) Pietro Gorlier
Systems & Castings
(Comau & Teksid) Riccardo Tarantini
Components (Magneti Marelli)
Eugenio Razelli
Design Lorenzo Ramaciotti
Group Purchasing
Vilmar Fistarol
Quality Doug Betts
Product Portfolio
Management Mark Chernoby
Powertrain Coordinator
Bob Lee
Chief
Manufacturing
Officer Stefan Ketter
Chief Technology
Officer Harald Wester
Business Development
Alfredo Altavilla
Chief Human
Resource Officer
Linda Knoll
Chief
Financial
Officer
Richard Palmer
Jeep Michael Manley
Fiat Olivier François
Chief
Marketing Officer
Olivier François
Commercial Vehicles
Lorenzo Sistino
Alfa
Romeo
Abarth
Maserati Harald Wester
Lancia
Chrysler Saad Chehab
Dodge Reid Bigland
Fiat Services
& Holdings
Alessandro Baldi
A global company, one leadership team

Group financials
Autos & LCVs
Luxury & performance brands
Magneti Marelli
Fiat Powertrain
Outlook
1
2
3
4
5
6

October 28, 2011 Q3 2011 Results Review 4
Europe 28%
North America
47%
Mercosur 17%
RoW 8%
1
Europe 57%
North America 3%
Mercosur 32% RoW
8%
Q3 REVENUES BY GEOGRAPHY
Looking at Fiat from a different perspective Better geographical diversification
FY REVENUES BY GEOGRAPHY
Europe 60%
North America
3%
RoW 9%
Mercosur 28%
North America
47% Europe 30%
Mercosur 17%
RoW 6%
* Assuming 12 months of Chrysler

October 28, 2011 Q3 2011 Results Review 5
8.4
17.6
Q3 „11 Q3 „10
Net profit (€mn)
Net industrial debt
(€bn)
Liquidity (€bn)
• Increase mainly reflects seasonal working capital absorption in addition to payments to UST & Canada for purchase of interests in Chrysler (€0.5bn), and non-cash items (€0.3bn)
• Capex for the quarter amounted to €1.6bn
Trading profit (€mn)
Trading margin
• Chrysler contributing €556mn, two-thirds of Group‟s trading profit
• Ex Chrysler at €295mn, a 15% year-over-year improvement
• Total available liquidity, inclusive of undrawn credit facilities, €12.8bn for Fiat ex Chrysler and €8.0bn for Chrysler
• Increase over prior quarter also reflects closing of Fiat‟s new €1.95bn revolving credit facility, of which €1.75bn already available and undrawn at quarter-end
• September-end position includes early reimbursement of a €1.0bn credit facility and proceeds from €1.5bn bond issuances in July
Note: Q3 ‟10 figures provided herein exclude businesses transferred to Fiat Industrial under demerger
• Chrysler: 6.0%
• FGA: 2.0%
• Ferrari: 14.7%
• Maserati: 5.6%
• Components & Production Systems: 3.1%
• Fiat ex Chrysler: 3.3%
Q3 „10
256
851
Q3 „11
Q3 „10
3.0%
4.8%
Q3 „11
73
112
Q3 „11 Q3 „10
5.8
Sep 30 „11 Jun 30 „11
3.4
1
Q3 „11 highlights Strong operating performance for Chrysler & Components, resilience elsewhere
• Ex €138mn loss on mark-to-market of two Fiat stock-option related equity swaps and €57mn in net unusual charges, Group achieved a net profit of ~€300mn and Fiat ex Chrysler at break-even
• Chrysler net profit of €322mn
1.0
Jun 30 „11
20.2 20.8
Sep 30 „11
19.2 18.1
Cash & Mktable Securities
Undrawn available committed credit lines
Net revenues (€bn)
• Chrysler contribution of €9.3bn, consolidated for the first full quarter
• Fiat ex Chrysler at €8.8bn, up 4.4% on the back of growth in Luxury Brands and Components businesses
2.7

October 28, 2011 Q3 2011 Results Review 6
• Continued firm grip on costs and production levels
Tight management of production systems maintaining output levels in line with sales trend
Temporary layoffs as major source of operating flexibility at plants while minimizing social impact
Global dealer inventory down ~3% at FGA, US dealer stock down ~12% in the quarter
World Class Manufacturing delivered €120+mn for Fiat & Chrysler combined
Savings to-date in excess of €350mn in aggregate, fully on track with FY targets
Full leverage of purchasing power proceeding apace (€52+bn direct materials APV expected for FY „11 when considering also Fiat Industrial)
Fiat ex-Chrysler net purchasing savings in sight of ~€80mn FY target (€50mn Sep YTD)
Chrysler net purchasing performance substantially break-even in the quarter and for Sep YTD
• New 4-year national labor contract with UAW for Chrysler ratified on Oct 26
• Successful refinancing of Fiat‟s bank & capital market maturities due in 2011-12
Bond issuances for an aggregate amount of €1.5bn
Close of syndication of committed revolving credit facility for €1.95bn
• Simplification of share capital structure
• FY 2011 guidance for Group trading profit firmed up to more than €2.1bn, all remaining targets confirmed
1 Q3 „11 highlights (cont‟d)

October 28, 2011 Q3 2011 Results Review 7
Revenues (€mn)
15,958
(1,237)
Automobiles Components & Production
Systems
Eliminations & Others
Q3 „11
Trading profit (€mn)
Fiat Group Automobiles
• Revenues of €6.5bn, in line with prior year (+0.6% at constant exchange
rates). A more favorable sales mix, resulting from higher volumes of LCVs,
and contribution from distribution of Jeep in Europe offset by contraction in
passenger car volumes
• Trading profit of €128mn (€130mn in Q3 „10) driven by industrial
efficiencies and improvement in mix offsetting decline in volumes
Luxury & Performance brands
• Revenues for Ferrari up 17.7% , Maserati +6.0%
• Trading profit slightly improved at Ferrari despite higher R&D spending for
new products
• Maserati doubling trading profit to €8mn
Components & Production Systems (Magneti Marelli, Fiat Powertrain, Teksid, Comau)
• Revenues for Magneti Marelli +7.1%, Production Systems +46%, Teksid
+16% while Fiat Powertrain slightly down (-1%)
• Nearly doubled trading profit at Magneti Marelli together with
improvements at Teksid & Comau more than compensating for reduction at
Fiat Powertrain
Magneti Marelli 1,374
Fiat Powertrain 1,002
Teksid 229
Comau 371
769 (6)
Automobiles Components & Production
Systems
Eliminations & Others
Q3 „11
Magneti Marelli 43
Fiat Powertrain 29
Teksid 12
Comau 4
FGA 6,520
Chrysler 9,284
Ferrari 525
Maserati 142
FGA 128
Chrysler 556
Ferrari 77
Maserati 8
7.5%
12.8%
Chrysler Group LLC
• Revenues of €9.3bn resulting from a 15% worldwide shipments increase to
469k vehicles
• Trading profit at €556mn with continued positive trend in volume, mix and
price from new vehicle launches, with trading margin benefiting also from a
low amortization charge for R&D, as current spending relates to products
still in development
17,552 2,831
851 88
1 Q3 „11 Revenues and trading profit by business

October 28, 2011 Q3 2011 Results Review 8
1 From trading profit to net result Q3 „11
(€mn; IFRS) Q3 „11
Fiat w/Chrysler Q3 „11
Chrysler
Q3 Fiat
2011 2010
Trading profit 851 556 295 256
Unusual items, net (57) 3 (60) (2)
Operating income 794 559 235 254
Financial charges, net (543) (209) (334) (27)
Investment income, net 31 6 25 14
Pre-tax result 282 356 (74) 241
Taxes (170) (34) (136) (168)
Net result 112 322 (210) 73
• “Unusual items, net” includes €63mn in restructuring charges related to Fiat Group Automobiles
• “Financial charges, net” includes loss of €138mn in the mark-to-market value of two stock option-related equity swaps (€58mn gain for Q3 „10)

October 28, 2011 Q3 2011 Results Review 9
1 From trading profit to net result Sep YTD ‟11
• “Unusual items net” relates to:
Unusual income totaled €2,025 million, of which €2,017 million related to the fair value re-measurement of the 30% ownership interest held in Chrysler prior to the acquisition of control and of the right to receive an additional 5% ownership interest following achievement by Chrysler of the third Performance Event
Unusual expense totaled €1,024 million, of which €804 million ex-Chrysler (including €562 million in non-cash charges) largely attributable to the impact on Fiat‟s businesses of the strategic realignment with Chrysler‟s manufacturing and commercial activities, further accelerated following the increase of Fiat‟s ownership interest, and to one-off charges mainly related to the realignment of certain minor activities of the Group
Chrysler‟s June-September 2011 operating profit of €486 million includes €220 million in unusual expenses recognized at the date of acquisition of control in relation to an upward revaluation or “step up” of its inventories associated with the recognition of assets acquired and liabilities assumed at fair value. Due to rapid inventory turnover, in June this amount was fully written off (recognized as a one-off non-cash charge)
• “Financial charges, net” includes loss of €115mn in the mark-to-market value of two stock option-related equity swaps (€26mn gain for Sep YTD „10)
(€mn; IFRS) Sep YTD „11
Fiat w/Chrysler
Sep YTD „11 Chrysler
(Jun-Sep)
Sep YTD Fiat
2011 2010
Trading profit 1,627 706 921 793
Unusual items, net 1,001 (220) 1,221 (25)
Operating income 2,628 486 2,142 768
Financial charges, net (911) (279) (632) (355)
Investment income, net 79 6 73 93
Pre-tax result 1,796 213 1,583 506
Taxes (410) (34) (376) (437)
Net result 1,386 179 1,207 69

October 28, 2011 Q3 2011 Results Review 10
(€mn; IFRS) Q3 „11
Fiat w/Chrysler
Chrysler Q3 Fiat
2011 2010
Net Industrial (Debt)/Cash beginning of period (3,407) (2,428) (979) (4,544)
Purchase of UST and Canada additional stake in CG (1) (490) - (490) -
Adj. Net Industrial (Debt) / Cash beginning of period (3,897) (2,428) (1,469) (4,544)
Net Income 112 322 (210) 73
D&A 1,023 460 563 559
Change in Funds & Others 91 (56) 147 8
Cash Flow from Op. Activities bef. Chg. in W.C. 1,226 726 500 640
Change in Working Capital (1,430) (640) (790) (297)
Cash Flow from Operating Activities (204) 86 (290) 343
Tangible & Intangible Capex (1,562) (720) (842) (609)
Cash Flow from Operating Activities net of Capex (1,766) (634) (1,132) (266)
Change in Investments, Scope & Others (22) 254 (276) 95
Net Industrial Cash Flow (1,788) (380) (1,408) (171)
Capital Increase / Share Repurchases / Dividends (1) (2) 1 42
FX Translation Effect (86) (78) (8) (19)
Change in Net Industrial Debt (1,875) (460) (1,415) (148)
Net Industrial (Debt)/Cash end of period (5,772) (2,888) (2,884) (4,692)
• Payments of €0.5bn to UST & Canada for purchase of interests in Chrysler
• Negative working capital mainly driven by trade payable reduction due to seasonal low production levels, with Q3 „10 impacted by non-recurring cash receipts
• Increased Capex progressing broadly in line with FY guidance
• €0.3bn negative non-cash impact from derivatives valuations and FX translation
• Reduced dealer inventory levels
(1) Including Equity Recapture Agreement
1 Cash flow Q3 „11

October 28, 2011 Q3 2011 Results Review 11
1 Successfully refinanced 2011-12 maturities Fiat ex Chrysler
• Three over subscribed new bond issuances in first 9 months of the year
Five-year €1bn bond in April (6.375% coupon)
Bond issuances with aggregate value of €1.5bn in July
Three-year €0.9bn tranche (6.125% yield)
Seven-year €0.6bn tranche (7.375% yield)
1.1
1.5
1.0
2.2
1.5
1.0 1.0
0.6
0.0 0.0
0.5
1.0
1.5
2.0
2.5
Q4
2011
2012 2013 2014 2015 2016 2017 2018 > 2018
•Committed and signed €1.75bn Revolving Credit Facility (RCF) in July
•Syndication phase launched in early September and closed for €1.95bn in October
Three-year facility with 18 key relationship banks replacing a 3-year €1bn revolving credit facility originally signed in February 2009
•Facility fully undrawn at quarter-end and intended for general corporate purposes and working capital needs
•Size of new RCF equal to ~100% of bank maturities outstanding at Sep 30th 2011 and due through end of 2012
Mostly self-liquidating position related to dealer floor-plan financing in Brazil and capital leases
Bonds issued in 2011
(Principal only)

October 28, 2011 Q3 2011 Results Review 12
Note: Numbers may not add due to rounding
1 Debt maturity schedule (€bn)
1) Excluding fair value of Bonds, including interest accruals
Outstanding Sept. 30, „11
Fiat SpA (ex Chrysler)
Next 12 M
3M 2011
2012 2013 2014 2015 Beyond
4.6 Bank Debt 1.7 0.7 1.3 1.1 0.5 0.5 0.5
10.2 Capital Market (1) 2.7 1.4 1.6 1.0 2.2 1.5 2.6
1.4 Other Debt 0.9 0.9 0.1 0.1 0.0 0.1 0.2
16.1 Total Cash Maturities 5.2 2.9 2.9 2.2 2.7 2.1 3.3
11.1 Cash & Mktable Securities
1.8 Undrawn committed credit lines
12.8 Total Available Liquidity
3.1 Sale of Receivables (IFRS de-recognition compliant)
2.2 of which receivables sold to financial services JVs (FGA Capital)
Outstanding Sept. 30, „11
Chrysler Next 12 M
3M 2011
2012 2013 2014 2015 Beyond
2.6 Bank Debt 0.1 0.0 0.1 0.1 0.0 0.1 2.3
2.4 Capital Market (1) 0.1 0.1 0.0 0.0 0.0 0.0 2.3
4.9 Other Debt 0.1 0.0 0.2 0.2 0.3 0.3 3.9
9.9 Total Cash Maturities 0.3 0.1 0.3 0.3 0.3 0.4 8.5
7.0 Cash & Mktable Securities
1.0 Undrawn committed credit lines
8.0 Total Available Liquidity

October 28, 2011 Q3 2011 Results Review 13
1 Simplification of share capital structure Summary of the proposed transaction
Conversion of Fiat Preference and Savings into Ordinary (not interconditional between classes)
Preference shareholders will receive 0.850 Ordinary shares for each Preference share owned
Savings shareholders will receive 0.875 Ordinary shares for each Savings share owned
Description
Fiat EGM
Special EGM of Preference shareholders
Special EGM of Savings shareholders
Required approvals
EGMs to be held at the time of the annual shareholder meeting for the approval of 2011 financials, indicatively scheduled for early April 2012
Timing
Transaction triggers withdrawal rights for absent, abstaining and dissenting Preference and Savings shareholders
The right consists in the cash-out option at a price equal to 6 months average price prior to the publication of the notice of call of the EGM, indicatively expected by end of February 2012
Withdrawal rights
(“Diritto di recesso”)
If declared, special dividends accrued to Preference and Savings with respect to the 2011 financial year will be unaffected
Dividends
Max withdrawal rights condition: the conversion will not be completed if entitled special shareholders exercise the withdrawal right for an amount higher than €56mn for Preference and €44mn for Savings (€100mn in total, divided for each class according to the respective number of shares outstanding)
Other conditions
Simplification of capital structure: from three classes of shares that differ in voting and economic rights to one single share class
Simplification of governance: same voting and capital rights for all shareholders
Exchange at a premium for a more liquid stock for special shareholders
EPS accretive
Rationale / Benefits

October 28, 2011 Q3 2011 Results Review 14
1 Simplification of share capital structure Summary timetable
Oct Nov Dec Jan Feb Mar Apr May Sep
2011
BoD resolution and
announcement (Oct 27)
Jun
2012
Publication of the notice of call of EGMs
Fiat AGM, EGM and special EGMs of Preference and Savings
Entitled special shareholders can exercise withdrawal rights
Max withdrawal condition tested – if condition is met, conversion becomes unconditional
By end of February
Early April
Note: the Company will, within 180 days, cash-out withdrawn shares from the exercise of withdrawal rights

October 28, 2011 Q3 2011 Results Review 15
2
3.1 3.1
~13.6 0.4 0.4
~1.8
Q3 '10 Q3 '11 FY '11E
EU27 + EFTA
LATIN AMERICA
1.06 1.12
~4.2
0.27 0.31
~1.2
Q3 '10 Q3 '11 FY '11E
Autos & LCVs Quarterly industry volumes & outlook (mn units)
NORTH AMERICA
US
Industry volumes up 7% in Q3 2011 vs. prior year
Truck segments up 13% vs. a year ago (comprised 55% of industry)
Passenger car market flat
FY industry expected up ~9% over 2010
Canada
Continued robust industry in Q3, flat vs. prior year
FY market demand expected up ~2% vs. a year ago
3.1 3.3
~12.8
Q3 '10 Q3 '11 FY '11E
US
0.4 0.4
~1.6
Q3 '10 Q3 '11 FY '11E
CANADA
~5.4
1.43 1.33
In particular:
Brazilian market holding up well notwithstanding a particularly strong quarter a year ago (+1.8% to 889k units in Q3 2011, +6.7% to 2,528k units for 9 months into the year)
Flattish passenger car market and continued strong growth in LCVs (+14.8% vs. prior year) in Q3
Brazilian overall market projected to ~3.5mn units for FY 2011
Passenger cars up ~2% and robust growth for LCVs (up ~13%)
0.38 0.36
~1.7
0.04 0.04
~0.2
Q3 '10 Q3 '11 FY '11E
Passenger cars
EU27+EFTA industry up 1.7% or 52k units in Q3 driven by strong performance in Germany (+11.6%); continuing shift in demand towards higher segments, Germany & France in particular
Continued weakness in Italian market, down 6.1% to 355k units in the quarter
LCVs
Sustained growth pattern for LCVs in Q3 across all EU countries (+5.6% overall), with exception of Italy (-2.2%) & France (-4.5%); minor markets up 11.5% in aggregate
FY 2011E for Europe unchanged vs. prior forecast
Passenger car industry expected down ~1.5% vs. a year ago with slightly improved outlook for France countering persisting weakness in Italy (demand now seen down ~10-12% from 2010 levels)
LCVs up ~8% with mixed trend across major markets (Germany driving the increase while decline in France & UK and Italy now projected down ~3%)
EUROPE
Passenger cars LCVs Passenger cars LCVs

October 28, 2011 Q3 2011 Results Review 16
MARKET SHARE
(%)
2010 2011 2009
2 Autos & LCVs US & Canada – Business dynamics in Q3 „11
8.0
9.6
11.4
11.3
12.8
14.5
Q1 Q2 Q3 Q4 Q1 Q2 Q3 Q4 Q1 Q2 Q3
US
September marking the 18th-consecutive month of year-over-year sales gains
Q3 share at 11.4%, up 180 bps vs. a year ago and 340 bps compared to a low/point of 8.0% in Q3 2009
Six consecutive quarterly year-over-year share gains
Retail sales (excluding fleet) increased 41%
Retail of retail market share* increased to 10.2%, up 250 bps
Fleet mix at 26%, down from 34%
Steady increase in market share primarily resulting from momentum of 16 new and significantly refreshed products
All-new Jeep Grand Cherokee, new Chrysler 200 and Dodge Durango continue to boost sales
Canada
Share steadily increased from 2009 lows
Q3 share at 14.5%, up 170 bps from a year ago
Retail sales (excluding fleet) increased 10%
Retail of retail market share* increased to 13.4%, up 160 bps
Key performers: Jeep Wrangler (+52%), Jeep Compass (+35%), Jeep Grand Cherokee (+31%) & Ram Pickup (+9%)
*Company calculation; retail sales (excluding fleet) versus industry retail sales (excluding fleet)

October 28, 2011 Q3 2011 Results Review 17
2010 2011
2 Autos & LCVs US sales – Key vehicle contributors
Q1 Q2 Q3
+64%
+196%
Q1 Q2 Q3
+19% +13%
Q1 Q2 Q3
New
New
Q1 Q2 Q3
New
New 15k
8k 23k
10k
Q1 Q2 Q3
+64%
+112%
+38%
+63%
+52%
New
16k
New
26k

October 28, 2011 Q3 2011 Results Review 18
Autos & LCVs EU+EFTA – Passenger car business dynamics in Q3 „11
2
•Sales of 202k units in the quarter
•Q3 share at 6.5%, 60 bps lower than a year ago due to unfavorable segment & geographic mix
Italy: share gain of 50 bps unable to counter decline of aggregate share in Rest of Europe
Europe ex Italy: 3.5%, down 50 bps
Combined A- & B-segment down 310 bps from 33.6% in Q3 „10 resulting in almost 40 bps loss in FGA share
•Share performance impacted by initial contribution of Lancia Ypsilon & Fiat Freemont, and continued strength of Alfa Romeo Giulietta despite discontinuation of 5 models (Punto Classic in particular)
*Including Jeep & Chrysler
MARKET SHARE*
(%)
• Reversed trend in year-over-year change in quarterly market share
• First quarterly year-over-year share gain since Q1 2010 notwithstanding a negative 260 bps impact of phased-out models in the quarter
Strong performance of Jeep (more than 3x 2010 level) contributing 60 bps to share
Initial contribution to share improvement from Lancia New Ypsilon & Fiat Freemont (14k units in Q3)
Italy*
(market share and y-o-y change in market share)
30.6
29.4 28.8
29.3 30.0 29.9
Q2 '10 Q3 '10 Q4 '10 Q1 '11 Q2 '11 Q3 '11
-350 bps
-300 bps -230 bps
-60 bps
EU27+EFTA
7.5 7.8 8.1
8.4
7.1 6.5
31.7 31.8 32.4 32.9
29.4 29.9
2007 2008 2010 2009 2011 2006
+50 bps
-410 bps
Q2 Q3 Q4 Q1 Q2 Q3 Q4 Q1 Q2 Q3 Q4 Q1 Q4 Q2 Q3 Q1 Q3 Q4 Q3 Q1 Q2

October 28, 2011 Q3 2011 Results Review 19
Autos & LCVs EU27+EFTA – Q3 „11 sales highlights by brand
2
• Share at 4.6%, or 90 bps lower than a year ago
The most impacted brand for unfavorable segment & geographic mix
• Strong performance of recently launched Freemont
More than 18k orders taken to date
FY 2011 target confirmed at 20k+units
AWD version with 6-speed automatic transmission to round out product offering in Q4
• Brand share stable at 0.9%
Sales at 27k units in the quarter
• Robust sales of Giulietta (+29%) on first full quarter comparison
Best-in-class C-Segment player in all main EU countries
~15k orders (~120k since launch in May 2010)
~17k shipments in Q3 (64k Sep YTD), on track with FY target of 90-100k units
• Sep YTD total sales up 32.1% (20 bps share gain), exceeding 105k units
• Share doubled vs. a year ago to 0.2% on the back of new and redesigned vehicles launched in 2011
• Total sales up 135% to ~7k units (over 17k Jeeps sold at Sep YTD)
Grand Cherokee +126%
Strong performance of Compass (14x last year level)
Wrangler up 59%
• Q3 product actions
Full availability of 2WD for Compass (40% of mix)
New diesel engines delivering significant improvement in CO2
• Share up 10 bps to 0.7% albeit with weak Italian market
• Performance of New Ypsilon in line with FY 2011 target of 45-50k shipments
More than 25k orders taken to date
• Further new product intros (Thema & Voyager) available in market starting early November

October 28, 2011 Q3 2011 Results Review 20
Autos & LCVs New Panda: the “magic box” since the „80s
2
• International press event in December 2011
• Preview at dealerships in January 2012
• Available in all European markets from February and later in more than 40 countries outside Europe
• FY 2012 target of ~230k Pandas including Panda Classic as entry-level model
DESIGN EVOLUTION
Compact size (3.65m in length)
Seamless window design
Split 3D headlamps
SAFETY
Best-in-class among reference competitors
VERSATILITY & FUNCTIONALITY
Slim seats for improved roominess
Improved boot size
Integrated navigation system
TECHNOLOGY & PERFORMANCE
The widest powertrain offering in segment
Highly fuel-efficient powertrains with TwinAir covering 65-85hp range (99g/km CO2 emissions)
CNG application available on TwinAir engine
Start&Stop
Traction Plus for improved 4x2 traction in difficult conditions
Available also in 4x4 version, the best off-road vehicle in A-segment
FUN
A nippy car, easy and fun-to-drive
A colorful collection of interior trims

October 28, 2011 Q3 2011 Results Review 21
• Fiat Professional outperformed European market recording 30 bps share gain despite unfavorable market mix
Italy: 100 bps share gain driven by strong performance of small vans and car derived vehicles
EU-ex Italy: sales up 12.8% corresponding to 50 bps gain in market share on the back of New Ducato and Doblò
• Brand sales in Europe up 8.4% to 47.7k units with volume gains in almost all markets, in particular Germany, Spain & The Netherlands
MARKET SHARE*
(%)
10.611.8 12.1 12.1 11.6 11.9
45.443.3 42.5
39.941.4
42.4
*Due to unavailability of data from Italy since Jan 2011, figures reported for 2011 for that
country are an extrapolation. As there are no current market figures, possibility of a margin of error for EU totals exists
EU27+EFTA
2007 2008 2010 2009
Q2 Q3 Q4 Q1 Q2 Q3 Q4 Q1 Q2 Q3 Q4 Q1 Q4 Q2 Q3 Q1 Q3
2011
Q4 Q3 Q1
2006
Q2
Autos & LCVs EU27+EFTA – LCV business dynamics in Q3 „11
2
• Latest product introduction rounding out Fiat Professional product offerings, the most up-to-date and complete of any EU producer
• First OEM-produced drop side vehicle ensuring higher quality and reliability to customers
Payload up to 1T, a unique offer in its segment
Lower consumption/emissions levels than a pick-up, more competitive price and compact dimensions than large van-derived

October 28, 2011 Q3 2011 Results Review 22
Update on labor relations US & Italy
2
• Continued operating flexibility at plants
Sustained alignment of production systems with market demand through use of flexibility tools such as temporary layoffs, agency contract adjustments and overtime, as required
• New investments in Italy announced
Mirafiori: Confirmed intention to install most updated version of one of three main architectures on which various nameplates for various brands will be produced, starting with a Jeep SUV in 2013
Pratola Serra: new 1.8L 4-cyl. engine to be developed for Alfa Romeo
• Continued commitment to transform Italian industrial infrastructures allowing sustainable international competition
Exit from Confindustria (confederation of Italian businesses) as of Jan 1, 2012 allowing direct negotiation with Unions and correct application of contracts already signed at Pomigliano, Mirafiori and Grugliasco plants, thus securing optimized operating flexibility
• Termination of car production at Termini Imerese plant at end of 2011
• New plant and product investments
$4.5bn in investments
2,100 new entry-level jobs
• Gains for new hires
Highest max hourly rate increases to $19.28 by end of contract
No cap on new hires
• Simplified and transparent profit sharing formula
Based on 85% of worldwide Modified Operating Profit
• No additional cost for traditional employee defined benefit pension plans
New hire pension plan changed to a defined contribution plan; Legal Services Plan eliminated after 2013
• Maintained overall labor cost competitiveness with foreign transplants
~$51/hour all-in
• Ratification, performance, and quality / WCM bonuses
Ratification bonus of $3,500, 50% delayed until a financial milestone achieved
Performance and quality bonuses total $4,000 over contract period with 100% upside potential
New 4-year national labor agreement with UAW, maintaining Chrysler cost competitiveness and linking variable compensation directly to Company performance and product quality

October 28, 2011 Q3 2011 Results Review 23
Autos & LCVs Latin America – Business dynamics in Q3 „11
2
Fiat market leader for 39 consecutive quarters with share in line with FY expectations, maintaining price discipline in an increasingly competitive market
Passenger car share impacted by delay in customs clearance of Siena units from Argentina
Gap over nearest competitor of 140 bps (over 700 bps in LCVs)
Inventory levels at Sep-end in line with Q2 exit
Dealer stock at 24-days of supply
Market continuing to grow robustly over prior year (+32.2% in Q3)
Significant share gain in both passenger cars (+170 bps to 11.6%) & LCVs (+270 bps to 12.9%)
Continued strong performance of best selling products
Brazil: strong share in A/B segment, flat year-over-year at 28.0% with Novo Uno 39 bps higher than a year ago (40k shipments in the quarter)
Argentina: overall share up 190 bps to 11.9% on the back of robust performance in A/B & pick-up segments
Share gain of 200 bps to 15.1% in A/B segment with Novo Uno growing significantly quarter by quarter since market intro (+76% vs. Q1 2011)
Consolidating segment leadership of Strada (50% share, up 800 bps in Q3) with Double Cab version driving the increase (50% mix)
Successful launch of Fiat 500 & Freemont in September with very good initial reception
Both models imported from Mexico benefiting from FTA
Cost base for Fiat 500 now particularly competitive compared to model previously imported from Europe
Novo Palio commercially available in November
(presented on Oct 4th in Turkey)
26.2 26.3 24.4 24.5 23.7
21.9
10.5 10.4 10.7 10.1 10.0 11.9
MARKET SHARE (PASSENGER CARS & LCVS; %)
2007 2008 2010 2009
Q1 Q2 Q3 Q4 Q1 Q2 Q3 Q4 Q1 Q2 Q3 Q4 Q3 Q1 Q2 Q4 Q2
2011
Q3 Q4
2006
Q1 Q3

October 28, 2011 Q3 2011 Results Review 24
Flex/ Gas 1.0L
Flex 1.0-2.0L
Flex >2.0L
Gas 1.0-2.0L
Gas >2.0L
LCVs Trucks
7%
37%
11%
41%
18%
48%
25%
4%
34%
0%
30%
55%
13%
43%
Autos & LCVs Update on “Brazil Maior” tax regime
2
New Government tax measures increased IPI rates (Federal VAT) on imported vehicles by 30 p.p.
New IPI rates to enter into force in Dec 2011 (expiring year-end 2012)
Local production in Brazil and automotive imports from Mercosul & Mexico not be affected by new tax measures upon certain conditions
Minimum local content representing 65% of total net revenues of each company
Minimum of 0.5% of revenues invested in local R&D
Local manufacturing consisting of at least 6 out of 11 activities (i.e. assembling, painting, engine and transmission assembling…)
Before
After
Local
production
(tax exempted)
76%
Import
(tax
exempted) 14%
Imported
under new
taxation 10%
Under new tax regime, market weight of tax exempted imported vehicles expected to slightly increase from current levels
Prices for vehicles imported from non-Mexico & Mercosul countries expected to reflect tax increase

October 28, 2011 Q3 2011 Results Review 25
On sale in North American markets since early 2011
Produced in Mexico, now distributed through 123 dealers in US (increasing to 130+ by year-end 2011)
~30k shipments at Sep YTD
Run-rate target of 45-50k units annually
Fiat 500 & Fiat 500C already available in market, Abarth version on sale from 2012
Named candidate for “2012 North America Car of the Year”
Named “Top Safety Pick for 2011”
Launched in Brazil in September 2011
1.5k orders in just one month
FY 2011 target of ~8k units
An iconic, successful and multi-awarded product in Europe
A leading position in A-segment
More than 770k shipments since launch in 2007 (~440k outside of Italy)
~32k shipments in Q3 (~130k at Sep YTD)
On sale in China since Sep 2011
Imported from Mexico
Peak annual target of ~8k units
Autos & LCVs Fiat 500 around the world
2

October 28, 2011 Q3 2011 Results Review 26
3 Luxury & performance brands – Ferrari Quarterly margin sequentially improving in 2011
Shipments by region (%)
USA 31.3%
European Top-5 32.6%
China, Hong Kong & Taiwan
10.3%
Japan 3.2%
Others 22.5%
• Top-line of €525mn, up 17.7%
1,588 shipments, up 13.6% on the back of strong sales performance of 12-cylinder models, the new FF in particular
North America remaining #1 market (+1% vs. a year ago)
China, Hong Kong & Taiwan up 49% to 164 shipments
Notable performance in Germany (+93%), France (+54%) & Switzerland (+43%)
• Trading profit at €77mn, 14.7% margin
Trading profit holding up (+€1mn vs. a year ago) despite higher R&D spending for new products
Margin improvement of 80 bps from Q2 2011
FF (available in market since June)
458 Spider
(first ever mid-rear engine 8-cylinder, unveiled at Frankfurt Motor Show, sales starting November 2011)

October 28, 2011 Q3 2011 Results Review 27
Luxury & performance brands – Maserati Paving the way for the future
Shipments by region (%)
USA 38.9%
European Top-5 19.5%
China, Hong Kong & Taiwan
19.2%
Japan 4.5%
Others 17.0%
Brand new SUV Concept (Kubang)
(the first ever SUV in brand‟s history presented at Frankfurt Motor Show)
• Revenues up 6.0% to €142mn
1,459 shipments, up 6.7%
North America up 16%
China, Hong Kong & Taiwan up 2.4x last year levels
• Trading profit of €8mn, doubling over a year ago
Margin at 5.6%, a 260 bps improvement over Q3 ‟10
3

October 28, 2011 Q3 2011 Results Review 28
4
• Revenues up 7.1% to €1.4bn on the back of strong performance of Lighting and Electronic Systems
Growth across regions with Brazil, North America and China driving the increase
Improvement in Europe driven by Lighting (particularly to German customers) and LCVs
Sales to third-party customers remaining above 55%
• Trading profit at €43mn, margin at 3.1%
Increased sales volumes and manufacturing efficiencies more than offset cost pressures from higher materials prices
Margin up 130 bps vs. a year ago
Operational update
• Additional orders for €265mn taken in the quarter
Main contracts relating to German and French customers in Lighting and Electronic Systems
• JV established with Chinese automotive components maker Wanxiang Qianchao for production of shock absorbers
Electronic Systems
Powertrain
Exhaust Systems Suspension Systems
Plastic C. and M. Shock Absorbers
After Market
Magneti Marelli FY profitability target in sight
32%16%
12%40%
High-Tech business lines accounting for 60% of revenues
387
228
143
443
226
167
Automotive Lighting Powertrain Electronics
Q3 '10 Q3 '11
+14.5%
-(0.9)%
+16.8%
Revenues trend by business line (€mn)

October 28, 2011 Q3 2011 Results Review 29
• Start of production of 2.0 MultiJet for Ducato family in the quarter
A 115hp diesel engine embedding leading edge technology of MultiJet II to replace previous entry-level Euro4 100hp 2.2L
Reduced consumption and increased capacity at equal GVW
• CO2 emissions of just 169 g/km, 13% less than equivalent version with previous engine application
• Announced investment for a new gas engine for Alfa Romeo to reconnect the brand to its historical roots
A 1.8L 4-cyl direct injection turbo engine made entirely of aluminum with max output of 300hp, designed for both transversal and longitudinal applications
• Highly fuel efficient, compliant with future emissions standards in both Europe & US
Most advanced technological engine with features at the very best in its category and characteristic of Alfa Romeo engines
Start of production at Pratola Serra plant (Italy) beginning in early 2013
5 Fiat Powertrain Technology always to the forefront
• Revenues at €1.0bn, substantially in line with last year
Engines down 5.1% vs. prior year to 532k units
• Gas engines: volumes up +2% in Latin America more than offset by decline of Fire applications in Europe (-28%)
• Diesel engines: volumes holding up (+5%) driven by applications on Giulietta & LCVs
Transmissions in line with previous year at 526k units
• Trading profit at €29mn or €16mn less than a year ago mainly due to lower volumes and higher raw material cost
Margin at 2.9%

October 28, 2011 Q3 2011 Results Review 30
Revenues in excess of €58bn
Trading profit in excess of €2.1bn (revised from ~€2.1bn)
Net profit at ~€1.7bn
Capital expenditure of ~€5.5bn
Net industrial debt between ~€5.0 and ~5.5bn
Total available liquidity expected greater than €18bn
Outlook 6

APPENDIX

October 28, 2011 Q3 2011 Results Review 32
Q3 „11 Reported revenues & trading profit
Q3 „11 Q3 ‟10
Cons. Industrial Financial Cons. Industrial Financial
Revenues 17,552 17,481 98 8,444 8,390 71
of which
Automobiles 15,958 15,880 98 7,090 7,033 71
FGA 6,520 6,447 91 6,550 6,497 66
Chrysler 9,284 9,284 0 - - -
Ferrari 525 520 7 446 442 5
Maserati 142 142 0 134 134 0
Components 2,831 2,831 0 2,634 2,634 0
Others & Elim. (1,237) (1,230) 0 (1,280) (1,277) 0
Trading profit 851 829 22 256 238 18
of which
Automobiles 769 747 22 210 192 18
FGA 128 108 20 130 113 17
Chrysler 556 556 0 - - -
Ferrari 77 75 2 76 75 1
Maserati 8 8 0 4 4 0
Components 88 88 0 78 78 0
Others & Elim. (6) (6) 0 (32) (32) 0
(€mn)

October 28, 2011 Q3 2011 Results Review 33
Q3 „11 - Chrysler Net income reconciliation (from IFRS to US GAAP)
1) Under IFRS, development costs for vehicle project production are capitalized as intangible assets if the development costs can be measured reliably and the economic feasibility of the product support the view that the development expenditure will generate future economic benefits. Capitalized development costs include all direct and indirect costs that could be directly attributable to the development process. These costs are subsequently amortized to expense on a straight-line basis from the start of production over the estimated production cycle. Under US GAAP, with the exception of certain software development costs, development costs are expensed as incurred in accordance with ASC 730, Research and Development Costs
Three Months ended September 30, 2011
Four Months ended September 30, 2011
Euros USD Euros USD
Chrysler Net Income (Loss) - IFRS €
322 $
453 €
179 $
252
Reconciling Items:
Capitalization of development costs1)
(147)
(208)
(180)
(253)
Other
(25)
(33)
185
260
(172)
(241)
5
7
Chrysler Net Income - US GAAP €
150 $
212 €
184 $
259

October 28, 2011 Q3 2011 Results Review 34
Q3 „11 - Chrysler Net debt reconciliation (from IFRS to US GAAP)
September 30, 2011
Euros USD
Chrysler Net Debt - IFRS € 2,888 $ 3,899
Unamortized purchase accounting adjustments1) (563) (759)
Classification and other differences:
Accrued interest (202) (273)
Other 1 1
(201) (272)
Net Industrial Debt - US GAAP € 2,124 $ 2,868
1) In connection with the transaction, all financial liabilities were re-measured to their fair value as of the first date of consolidation. The unamortized balance primarily relates to the fair value adjustment on the VEBA Trust Note

October 28, 2011 Q3 2011 Results Review 35
Chrysler Group LLC Net revenues & trading profit
8,542
9,284
Q3 '10 Pro-forma Q3' 11
340
556
Q3 '10 Pro-forma Q3 '11
380
433407
382
485
514
469
Q1 '10 Q2 '10 Q3 '10 Q4 '10 Q1 '11 Q2 '11 Q3 '11
Vehicle Shipments (000)
• Net revenues up 8.8% (19% in US$ terms) driven primarily by increased demand for Chrysler Group‟s 16 all-new or significantly refreshed cars and trucks launched in 2010
• Revenue increase driven by 15% year-over-year increase in vehicle shipments and improved pricing and mix
• Shipments seasonally decreased from Q2 „11 due to model-year changeover
• Trading profit benefitted from increased shipments and improved pricing and mix, partially offset by increased advertising of new products and slightly higher industrial costs

October 28, 2011 Q3 2011 Results Review 36
Chrysler Group LLC Trading profit variance & margin
• Unadjusted volumes increased by 62k units on continued success of new and refreshed products
• Mix and net price improved primarily due to 2011 model year vehicle launches and increased US retail penetration
• Industrial costs primarily impacted by higher commodity and transportation costs, partially offset by lower depreciation & amortization
• SG&A primarily reflects increased advertising expenditures
(€mn)
340
556237
119
(15)
(95)(30)
Q3 '10
Pro-forma
Volume Mix & Net
Price
Industrial
Costs
SG&A Other Q3 '11*
4.0%
6.0%

October 28, 2011 Q3 2011 Results Review 37
123 132
151 152
55 66
74 87
15
4
17
Q3 '10 Q3 '11
301 331
50
58 18
18 34
45 4
17
Q3 '10 Q3 '11
U.S.
Canada
Mexico
Int‟l
Units (000s)
407 407
469
+30
+8
-0-
+11
2011 +/- 2010
+9
+11
+13
+15
2011 +/- 2010
+1
+15%
Contract Mfg +13 Contract Mfg +13
469
Chrysler Group LLC Q3 worldwide vehicle shipments

October 28, 2011 Q3 2011 Results Review 38
114 160
147
164
57
68 83
93
11
Q3 '10 Q3 '11
293
369
55
61
18
19
35
47
Q3 '10 Q3 '11
U.S.
Canada
Mexico
Int‟l
401 401
496 496
+76
+6
+1
+12
2011 +/- 2010
+46
+11
+11
+10
2011 +/- 2010
+17
+24%
Note – Excludes contract manufactured vehicles, primarily for Fiat (17k in Q3 2011 and 4k in Q3 2010)
Units (000s)
Chrysler Group LLC Q3 worldwide vehicle sales
October 28, 2011 Q3 2011 Results Review 39
403 379
460
543 517
539
481 460
Q3‟04 Q3‟05 Q3‟06 Q3‟07 Q3‟08 Q3‟09 Q3‟10
Unit Shipments (x000)
NET REVENUES (€MN)
TRADING PROFIT (€MN)
6,550
Q3 „11 Q3 „10
Q3 „10 Q3 „11
130
6,520
128
Q3„11
Fiat Group Automobiles Net revenues & trading profit
• Revenues flat with improved mix offset by 4.3% decline in volumes
Passenger cars: 366k shipments, down 6.6% or 26k
LCVs: shipments up +5.4% to 95k
• Reduction in volumes driven by persisting weakness in domestic market and tough comps vs. prior year in Brazilian market
Brazil shipments nearing 200k units in quarter, recording a reduction of 7k vehicles more than offset by volume increase in Argentina (+54% to 27k shipments)
Good performance in Germany (+8.6%) unable to offset declines in most of other European countries, driven by unfavorable market & segment mix

October 28, 2011 Q3 2011 Results Review 40
Fiat Group Automobiles Trading profit variance & margin
(€mn)
Q3 ‟10 Volume Price & Mix
Purchasing Net
Production Cost
Absorp.
SG&A R&D Q3 „11 Other
• Excluding 5k Jeeps increase, overall shipments down ~26k units
• Improved mix from LCVs & first full quarter of sales for Fiat Freemont & New Lancia Ypsilon partially offset by competitive pressure on existing products in EU
• Purchasing & WCM efficiencies on track to FY target
• R&D spending in line with cadence of new products
• SG&A driven by higher advertising due to launches in EU
• Other mainly relates to FX translation
(28)
130 2
128
2.0% 2.0%
10
14
(23)
18
5
October 28, 2011 Q3 2011 Results Review 41
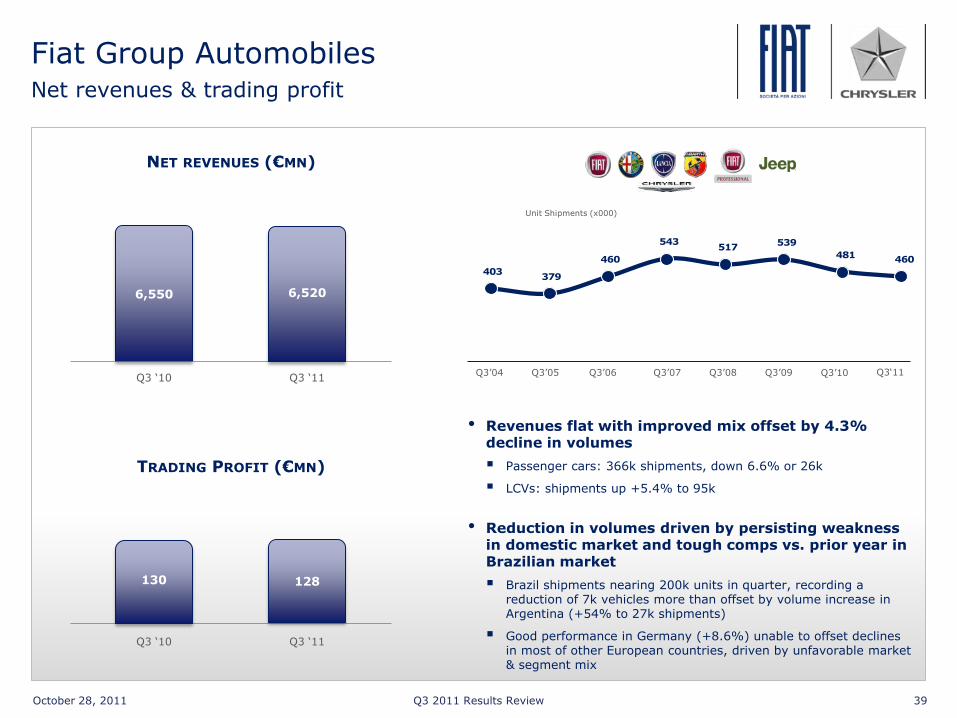
1 Excluding Chrysler Group vehicles 2Due to unavailability of data from Italy since Jan 2011, figures reported for 2011 for that country are an extrapolation. As they are no current market figures, possibility of a margin of error for EU totals exists
Fiat Group Automobiles Q3 „11 market & market share (ex Dodge, Ferrari & Maserati)
Passenger Cars Units 000
Q3 Unit Change
% Change 2011 2010
EU27 Market 3,114.1 3,062.0 52.1 1.7%
Registrations 201.5 217.9 -16.4 -7.5%
Mkt Share % 6.5% 7.1% -0.6
Italy Market 355.3 378.4 -23.1 -6.1%
Registrations 106.2 111.1 -4.9 -4.4%
Mkt Share % 29.9% 29.4% 0.5
Germany Market 779.1 698.1 81.0 11.6%
Registrations 23.9 22.5 1.4 6.1%
Mkt Share % 3.1% 3.2% -0.1
France Market 436.2 445.1 -8.9 -2.0%
Registrations 16.0 18.9 -2.8 -15.0%
Mkt Share % 3.7% 4.2% -0.5
U.K. Market 523.5 527.0 -3.5 -0.7%
Registrations 15.2 17.1 -2.0 -11.5%
Mkt Share % 2.9% 3.2% -0.3
Spain Market 182.4 184.2 -1.8 -1.0%
Registrations 5.2 5.7 -0.5 -8.5%
Mkt Share % 2.9% 3.1% -0.2
Poland Market 63.9 68.4 -4.5 -6.6%
Registrations 4.3 5.8 -1.5 -26.5%
Mkt Share % 6.7% 8.5% -1.8
Brazil1 Market 698.7 707.3 -8.6 -1.2%
Registrations 153.0 165.4 -12.4 -7.5%
Mkt Share % 21.9% 23.4% -1.5
Light Commercial Vehicles2 Units 000
Q3 Unit
Change %
Change 2011 2010
EU27 Market 401.5 380.4 21.1 5.6%
Registrations 47.7 44.0 3.7 8.4%
Mkt Share % 11.9% 11.6% 0.3
Italy Market 35.7 36.5 -0.8 -2.2%
Registrations 15.1 15.1 0.0 0.0%
Mkt Share % 42.4% 41.4% 1.0
Germany Market 74.4 65.2 9.1 14.0%
Registrations 8.5 7.0 1.5 21.3%
Mkt Share % 11.4% 10.7% 0.7
France Market 89.1 93.4 -4.2 -4.5%
Registrations 7.2 7.2 0.0 0.2%
Mkt Share % 8.1% 7.7% 0.4
U.K. Market 68.0 63.2 4.7 7.5%
Registrations 2.9 2.9 0.0 -0.9%
Mkt Share % 4.3% 4.6% -0.3
Spain Market 22.3 21.6 0.7 3.4%
Registrations 2.1 1.8 0.3 14.7%
Mkt Share % 9.3% 8.4% 0.9
Poland Market 10.6 9.4 1.2 13.0%
Registrations 2.2 2.0 0.2 10.8%
Mkt Share % 20.9% 21.3% -0.4
Brazil1 Market 190.7 166.1 24.6 14.8%
Registrations 42.2 41.3 0.8 2.0%
Mkt Share % 22.1% 24.9% -2.8

October 28, 2011 Q3 2011 Results Review 42
Fiat Group Automobiles Sep YTD 2011 market & market share (ex Dodge, Ferrari & Maserati)
1 Excluding Chrysler Group vehicles 2Due to unavailability of data from Italy since Jan 2011, figures reported for 2011 for that country are an extrapolation. As they are no current market figures, possibility of a margin of error for EU totals exists
Passenger Cars Units 000
YTD Sep Unit Change
% Change 2011 2010
EU27 Market 10,462.7 10,547.2 -84.5 -0.8%
Registrations 742.5 835.7 -93.2 -11.2%
Mkt Share % 7.1% 7.9% -0.8
Italy Market 1,369.5 1,543.8 -174.2 -11.3%
Registrations 406.8 474.4 -67.6 -14.2%
Mkt Share % 29.7% 30.7% -1.0
Germany Market 2,401.7 2,166.9 234.9 10.8%
Registrations 78.2 72.5 5.7 7.9%
Mkt Share % 3.3% 3.3% 0.0
France Market 1,661.3 1,657.5 3.8 0.2%
Registrations 62.1 69.5 -7.3 -10.6%
Mkt Share % 3.7% 4.2% -0.5
U.K. Market 1,553.1 1,635.7 -82.6 -5.0%
Registrations 46.1 52.8 -6.6 -12.6%
Mkt Share % 3.0% 3.2% -0.2
Spain Market 623.9 787.2 -163.3 -20.7%
Registrations 19.5 26.1 -6.6 -25.2%
Mkt Share % 3.1% 3.3% -0.2
Poland Market 202.6 215.5 -12.9 -6.0%
Registrations 15.1 19.2 -4.1 -21.4%
Mkt Share % 7.4% 8.9% -1.5
Brazil1 Market 2,002.4 1,915.1 87.3 4.6%
Registrations 442.9 441.7 1.1 0.3%
Mkt Share % 22.1% 23.1% -1.0
Light Commercial Vehicles2 Units 000
YTD Sep Unit
Change %
Change 2011 2010
EU27 Market 1,335.2 1,235.6 99.6 8.1%
Registrations 174.9 161.0 13.9 8.6%
Mkt Share % 13.1% 13.0% 0.1
Italy Market 137.4 138.2 -0.7 -0.5%
Registrations 62.1 61.7 0.4 0.7%
Mkt Share % 45.2% 44.6% 0.6
Germany Market 230.4 198.7 31.7 15.9%
Registrations 29.7 22.7 7.0 31.1%
Mkt Share % 12.9% 11.4% 1.5
France Market 318.3 312.0 6.2 2.0%
Registrations 30.0 27.9 2.1 7.7%
Mkt Share % 9.4% 8.9% 0.5
U.K. Market 204.1 175.1 29.0 16.6%
Registrations 7.9 6.9 1.0 14.0%
Mkt Share % 3.9% 4.0% -0.1
Spain Market 78.8 86.9 -8.1 -9.3%
Registrations 7.3 7.4 -0.2 -2.2%
Mkt Share % 9.2% 8.6% 0.6
Poland Market 31.3 27.9 3.3 11.9%
Registrations 6.3 6.3 0.0 0.7%
Mkt Share % 20.2% 22.4% -2.2
Brazil1 Market 525.4 454.5 70.9 15.6%
Registrations 119.3 106.9 12.3 11.5%
Mkt Share % 22.7% 23.5% -0.8

October 28, 2011 Q3 2011 Results Review 43
204 197
112104
127
115
39
44
Q3 '10 Q3 '11
(3.4)%
(7.0)%
(9.4)%
14.8%
357383
377 331
279289
74 84
H1 '10 H1 '11
Brazil
Italy
EU27 ex
Italy
RoW
- (4.3)%
7.4%
(12.2)%
3.5%
1,087 481
460
560 580
489 435
406404
113129
Sep YTD '10 Sep YTD '11
3.5%
(11.0)%
(0.5)%
(1.3)%
13.9%
1,568 1,087
* Incl. shipments w/buyback, Chrysler Group shipments in Europe, ex JVs and Ferrari & Maserati
13.5%
1,547
Fiat Group Automobiles Worldwide unit shipments by region, Cars & LCVs (unit/000)*
Brazil
Italy
EU27 ex Italy
RoW

October 28, 2011 Q3 2011 Results Review 44
90 95
272026
341 306
28
27
Q3 '10 Q3 '11
194 218
11357
53
784 726
5177
H1 '10 H1 '11
- (4.3)%
1,087 481
460
284 313
3197779
1,125 1,032
79104
YTD Sep '10 YTD Sep '11
(1.3)%
1,568 1,087 1,547
12.5%
(6.2)%
(7.4)%
51.1%
13x
5.4%
(9.8)%
(3.5)%
26.7%
3.5x
10.2%
2.5%
(8.3)%
31.6%
6.3x
Fiat Group Automobiles Worldwide unit shipments by brand, Cars & LCVs (unit/000)*
* Incl. shipments w/buyback, Chrysler Group shipments in Europe, ex JVs and Ferrari & Maserati

October 28, 2011 Q3 2011 Results Review 45
521521
468527
556612
556 592 600665
542
402465
582 541 582 543 583506 515 549 591
483
Q1 Q2 Q3 Q4 Q1 Q2 Q3 Q4 Q1 Q2 Q3 Q4 Q1 Q2 Q3 Q4 Q1 Q2 Q3 Q4 Q1 Q2 Q3
Production & Purchases
(„000 units)
2006
509530
469502
569600
537571
591631
532
463
525
630
557565
580
545500
517527
562 484
485516
460
520
541
579
543
571
564
645
517
428
465
591
539556 532
554
481514 519
568
460
Q1 Q2 Q3 Q4 Q1 Q2 Q3 Q4 Q1 Q2 Q3 Q4 Q1 Q2 Q3 Q4 Q1 Q2 Q3 Q4 Q1 Q2 Q3
Registrations Shipments
Registrations & Shipments
Fiat Group Automobiles Worldwide production volumes, shipments & registrations
2007 2008 2009 2010 2011

October 28, 2011 Q3 2011 Results Review 46
Fiat Group Automobiles Inventory trend by quarter
• Total inventory flat compared to previous quarter
• Company inventory slightly increasing due to stock in transit from Argentina to Brazil (delay in customs clearance)
Months of Supply (as per average of latest 3 months)
Company Inventory
Dealer Inventory
2008
2.5
1.4
1.92.0
Q1 Q2 Q3 Q4 Q1 Q2 Q3 Q4 Q1 Q2 Q3 Q4 Q1 Q2 Q3
2009 2010 2011

October 28, 2011 Q3 2011 Results Review 47
Components Teksid & Comau
197
Q3 „10 Q3 2011
229
Q3 „10 Q3 2011
12
Q3 „10 Q3 2011
254
371
Q3 „10 Q3 2011
• Revenues up 16.2%
Cast Iron up 14.6% driven by positive performance in Mercosur, NAFTA & Europe
• Trading profit up 33.3% primarily on volume increases
• Revenues up 46%
All business lines up with Body Welding and Powertrain Systems and activities in China making a significant contribution
• Trading profit of €4mn, attributable to Body Welding operations and activities in China
• Order intake of €256mn for the quarter, up 5.3% vs. a year ago
4
-0- 9

October 28, 2011 Q3 2011 Results Review 48
Fiat ex Chrysler Net debt breakdown (€bn)
Note: Numbers may not add due to rounding
June 30, „11
Sept 30, „11
Cons. Ind. Fin. Cons. Ind. Fin.
16.4 13.4 3.1 Gross Debt* 17.0 13.9 3.1
(0.4) (0.4) - Derivatives M-to-M, Net (0.1) (0.1) -
(12.2) (12.0) (0.2) Cash & Mktable Securities (11.1) (10.9) (0.2)
3.8 1.0 2.9 Net Debt 5.8 2.9
2.9
* Net of intersegment receivables

October 28, 2011 Q3 2011 Results Review 49
Fiat ex Chrysler Gross debt (€bn)
Note: Numbers may not add due to rounding
Outstanding June 30, „11
Outstanding Sept 30, „11
15.7 Cash Maturities 16.1
5.5 Bank Debt 4.6 8.8 Capital Market (1) 10.2 1.4 Other Debt 1.4
0.7 Securitization and Sale of Receivables (on
book) 0.7
0.0 ABS / Securitization 0.0 0.0 Warehouse Facilities 0.0 0.7 Sale of Receivables 0.7
0.1 Adjust. for Hedge Accounting on Fin.
Payables 0.2
16.4 Gross Debt 17.0
(12.2) Cash & Mktable Securities (11.1)
(0.4) Derivatives Fair Value (0.1)
3.8 Net Debt 5.8
0.0 Undrawn committed credit lines 1.8
(1) Excluding fair value of Bonds, including interest accruals

October 28, 2011 Q3 2011 Results Review 50
Chrysler Gross debt (€bn)
Note: Numbers may not add due to rounding
Outstanding Jun 30, „11
Outstanding Sep 30, „11
9.4 Cash Maturities (1) 9.9
2.5 Bank Debt 2.6
2.2 Capital Market 2.4
4.7 Other Debt 4.9
0.1 Securitization and Sale of Receivables
(on book) 0.0
0.1 ABS / Securitization 0.0
9.5 Gross Debt 9.9
(7.0) Cash & Mktable Securities (7.0)
(0.0) Derivatives Fair Value (0.0)
2.4 Net Debt 2.9
0.9 Undrawn committed credit lines 1.0
(1) Including accrued Interest

October 28, 2011 Q3 2011 Results Review 51
Financial charges breakdown Q3 „11 vs. Q3 „10
Average Outstanding
(€bn)
Rate/Spread
(%)
Net Charges (€mn)
2010 2011 Chg
Net Industrial Debt Q3 2011 (2.3) 5.8% (33) +18
Net Industrial Debt Q3 ‟10 (4.5) 4.5% (51)
“Cost of Carry” Q3 2011 (11.4) 3.5% (100) -65
“Cost of Carry” Q3 ‟10 (1) (6.7) 2.0% (35)
Equity Swap (related to stock option plans) 58 (138) -196
IAS 19 (interest cost on pension & OPEB) (12) (10) +2
Others
(indirect Taxes on banking transactions, fees, FX, interest cost on long-term provisions, discount of certain receivables...)
13 (53) -66
NET FINANCIAL CHARGES (Fiat) (27) (334) -307
Chrysler Group - (209) -209
NET FINANCIAL CHARGES (Fiat w/ Chrysler) (27) (543) -516
(1) Net of cash deposited by Fiat Industrial

October 28, 2011 Q3 2011 Results Review 52
Safe Harbor Statement
Cer ta i n i n fo rmat i on i n c l uded i n t h i s
p resen ta t i on , i n c l ud i ng , w i t hou t l im i ta t i on ,
any f o recas t s i n c l uded here i n , i s f o rwa rd
l ook i ng and i s sub j ec t t o impor tan t r i sks and
uncer t a i n t i es t ha t cou l d cause ac tua l resu l t s
t o d i f f e r ma te r i a l l y . The Group ‟ s bus i nesses
i nc l ude i t s au tomot i ve , au tomot i ve- re l a t ed and
o ther sec t o rs , and i t s ou t l ook i s p redominan t l y
based on i t s i n t e rp re ta t i on o f what i t
cons i de rs t o be the key economi c f a c t o r s
a f f ec t i ng these bus i nesses . Fo rward - l ook i ng
s t a t emen t s w i th rega rd t o t he Group ' s
bus i nesses i nvo l ve a number o f impor tan t
fa c t o r s t ha t a re sub j ec t t o change , i n c l ud i ng ,
bu t no t l im i t ed t o: t he many i n t e r re l a t ed
fa c to r s t ha t a f f ec t consumer con f i dence and
wor l dw ide demand fo r au tomot i ve and
au tomot i ve - re l a t ed p roduc t s ; governmen ta l
p rog rams; genera l economi c cond i t i ons i n each
o f t he Group ' s marke t s ; l eg i s l a t i on ,
pa r t i cu l a r l y t ha t re l a t i ng t o au tomot i ve-
re l a t ed i s sues , t he env i ronmen t , t rade and
commerce and i n f ra s t ru c tu re deve l opmen t ;
a c t i ons o f compet i t o r s i n t he va r i ous
i ndus t r i es i n wh i ch the Group competes ;
produc t i on d i f f i cu l t i e s , i n c l ud i ng capac i ty and
supp l y cons t ra i n t s and excess i nven to ry
l eve l s ; l abo r re l a t i ons ; i n t e res t ra t es and
cu r rency exchange ra t es ; po l i t i ca l and c i v i l
un res t ; ea r thquakes and o ther r i sks and
uncer t a i n t i es . Any o f the assumpt i ons
under l y i ng t h i s p resen ta t i on o r any o f the
c i r cumstances o r da ta men t i oned i n t h i s
p resen ta t i on may change . Any f o rward - l ook i ng
s t a t emen t s con ta i ned i n t h i s p resen ta t i on
speak on l y a s o f t he da te o f t h i s p resen ta t i on .
F i a t does assume and exp ress l y d i s c l a ims any
ob l i ga t i on t o upda te t hese f o rward - l ook i ng
s t a t emen t s . F i a t does no t a ssume and
express l y d i s c l a ims any l i ab i l i t y i n connec t i on
w i th any i naccu rac i es i n any o f t hese f o rward -
l ook i ng s ta t emen t s o r i n connec t i on w i t h any
u se by any th i rd par t y o f su ch f o rward - l ook i ng
s ta temen t s . Th i s p resen ta t i on does no t
rep resen t i nves tmen t adv i ce o r a
recommenda t i on f o r t he pu rchase o r sa l e o f
f i nanc i a l p roduc t s and/o r o f any k i nd o f
f i nanc i a l se rv i ces . F i na l l y , t h i s p resen ta t i on
does no t rep resen t an i nves tmen t so l i c i t a t i on
i n I t a l y , pu rsuan t t o Sec t i on 1 , l e t t e r ( t ) o f
Leg i s l a t i ve Dec ree no . 58 o f Februa ry 24 ,
1998 , a s amended, nor does i t r ep resen t a
s im i l a r so l i c i t a t i on a s con temp la ted by the
l aws i n any other count ry or s ta te .

October 28, 2011 Q3 2011 Results Review 53
Contacts
Marco Auriemma +39-011-006-3290 Vice President
Alexandra Deschner +39-011-006-2308
Paolo Mosole +39-011-006-1064
Sara Nicola +39-011-006-2572
Maristella Borotto +39-011-006-2709
fax: +39-011-006-3796
email: [email protected]
website: www.fiatspa.com