Embed Size (px)
Citation preview

ON T H E S I G N O F SLOPE I N T H E LEARNING O F LINEAR F U N C T I O N S
HANNES EISLER and KRISTER SPOLANDER
Psychological Laboratories, University of Stockholm, Sweden
EISLER, H. & SPOLANDER, K. On the sign of slope in the learning of linear functions. Scand. J. Psychol., 1969, II, 176-184. -Three groups of subjects were presented with pairs of values (E and S) of three different linear func- tions E = a + bS. In a test phase they had to indicate the E-values that cor- responded to the S-values. The values were represented as distances marked on straight lines. Two groups, one a control group, had a positive slope, the third group a negative. The squared s u m of the S-E differences was kept constant. All groups had roughly the same performance as measured by the squared sum of deviations from empirical and correct E-values. The learning curves indicated, however, that some learning had taken place in the group with the negative slope. It was concluded that a principle rather than a func- tion was learned.
In associative learning the subjects are typically presented with two sets of stimuli, here denoted by S and E, in a one-to-one pairing. In the test which follows upon the learning the subjects are presented with S only, and have to predict E. In what Carroll (1963) terms ‘functional learning’, S and E are quantified and related by a fixed function, E=f(S).
In the experiments reported here and in those by Carroll (1963) and Bjorkman (1965) with which the present experiments are compared, the S- and E-values took the form of distances on parallel straight lines. During learning both S and E were given; during testing the subjects had to mark off the distance E, corresponding to the distance S,.
Subjects who learn the function E=f(S) , in the sense of giving a response at least close to E, on being presented with an instance of S, say S,, may have achieved this result in different ways. Without claiming to have carried out a complete logical analysis, it seems worth considering the following three possibilities.
Case (i). The subject ‘associates’ single Es with single Ss. In this case, the subject does not make use of the quantitative relation constructed by the experimenter.
Case (ii). The subject learns thefunction E=f (S ) in the genuine sense. (‘Intuitive Mode’ in Sjoberg’s (1968) terminology.) In this case the subject makes use of the quantitative relation constructed by the experimenter.
Case (iii). The subject learns a principle enabling him to generate correct responses. (‘Analytic Mode’ in Sjoberg’s (1968) terminology.) In this case the subject solved his problem by a different route than the one intended and expected by the experimenter, probably a route of which the experimenter was unaware.
Whether Case (i) obtains is easily tested by introducing new stimuli in the test part. If these stimuli are different enough from the stimuli given under the learning part, forcing the subject to intra- or extrapolate, and his responses to these stimuli follow the function E=f(S) as well as the old stimuli used in the learning part, Case (i) can be ruled out.
I t is harder to distinguish Case (ii) (cp. Carroll, 1963; Bjorkman, 1965) from Case (iii)
176 Scand. 1. Psychol., Vol. 11, 1970

THE SIGN OF SLOPE IN THE LEARNING OF LINEAR FUNCTIONS ‘77
(cp. Lindahl, 1964, 1968). One method used by Lindahl (1964, 1968) in her experiments on concept formation, was simply to ask the subjects how they go about producing their responses. This was not done in any of the experiments on functional learning dealt with here. But the empirical data may give some guidance. If, e.g., systematic deviations between correct and empirical Es are found, and this outcome can be explained by a simple principle, Case (iii) seems most reasonable. In the absence of systematic deviations there seems to be no way of distinguishing between Cases (ii) and (iii) from data, though we were inclined to interpret data by the learning of a simple principle, if one could be found, over functional learning proper.
The investigation reported here had a narrower aim than the introduction may lead one to suppose, viz. to make a further comparison between the learning of linear functions with a positive and a negative slope respectively. The data obtained, together with Carroll’s (1963) and Bjorkman’s (1965) results, may nevertheless shed some light on the issues men- tioned above.
Carroll’s, Bjorkman’s and the present study all used essentially the same procedure. A value on the E-continuum was determined by a linear function, E = a + bS. The sign of b thus determined whether the linear function to be learned had a positive or a negative slope. Carroll (1963) did not find any significant difference between the learning of these two types of function, though no definite conclusion could be drawn owing to different ranges of the two E-continua. (Carroll’s functions were E = I .283 S - 59.3, E = - 0.945 S + 326.0, respectively, E and S in mm.)
Bjorkman (1965) repeated this experiment with the functions E = I .2 S - 24, and E =
= - I .2 S + 276. The same S-continuum was used and the E-continua were reversed, thereby ensuring the same range as well as the same spacing. The placing of the two functions in the coordinate system, however, resulted in different S-E differences between the func- tions with a positive and a negative slope (C(S-E)2=2680 and 321,980, respectively). It seems rather probable that an increase in the squared sum of differences between correspond- ing S- and E-values increases the difficulty of the task. Also the closeness of the function to the origin should affect the difficulty. In Bjorkman’s study the main independent vari- able (positive and negative slope) was confounded with (i) the differences between S and E (suitably measured as X(S-E)2 and (ii) the position of the functions relative the origin (the constant a in E = a + bS).
In the experiment reported below we tried to avoid confounding independent variables and we also used a control group so as to study the different effects separately.
THE EXPERIMENT
Stimuli As in Carroll’s (1963) and Bjorkman’s (1965) experiments, the stimuli were varying distances
marked off on straight lines. Table I gives the lengths of the S- and E-lines for all three func- tions used, of which two had a positive and one a negative slope (A, B, and C).
The material consists of two parts. Stimuli 1-10 constitute the learning part, stimuli I 1-22 the test part. Of the 12 stimuli in the test part, 7 are intrapolated and 5 also appear in the earning part.
Scad. 1. PsychoX, Vol. 11, 1970
178
Design
H. EISLER AND K. SPOLANDER
Three experimental groups were used (A, B, and C), one for each function. Groups A and B learned the positive linear functions E =3S -64, and E =3S -448. Group C learned the negative function E = - 3 s +512 (E- and S-values in mm). The position of the three func- tions in the coordinate system is given in Fig. I.
TABLE I. Lengths of S- and E-lines in mm. Italicised S-values are intrapolated stimuli.
Positive slope Negative slope
no. S E S E S E
A B C S-E assignment - P -
I 34 38 222 218 96 224
2 40 56 216 200 I03 203 48 80 208 176 109 185 56 104 200 152 116 I 64
5 64 I28 192 I28 124 140
6 70 146 I 86 I I 0 129 125
7 76 164 I80 92 136 104
8 82 I82 I74 74 I44 80
I 0 96 224 I 60 32 158 38
3 4
9 92 212 164 44 150 62
I1 34 38 222 218 96 224 I 2 38 5 0 218 206 IOI 209 '3 44 68 212 188 I09 185 '4 50 86 206 170 114 170 I5 54 98 202 158 TI9 I55 16 60 I 16 196 140 125 I37 I7 64 I28 192 I28 129 125 I8 70 146 I 86 I I0 I34 I I0
I9 80 176 I76 80 I39 95 20 86 I94 170 62 I44 80 21 92 2 1 2 I 64 44 1.52 56 22 96 224 I 60 32 158 38
The following variables were considered critical for the group comparisons. I. Sections of the continua. As can be seen in Fig. I and Table I the E-sectors of the three
functions are practically identical. As a consequence of the requirement of equal sums of squared S-E differences, this is not the case for the S-sectors. A possible effect caused by this difference between groups A and C can be controlled by group B, where such an effect should appear still more pronounced. If there is no difference in results between groups A and B, a difference between groups A and C cannot be attributed to the difference in sec- tions of the continua.
2 . Distance offunction from origin. Because of the identical slopes (disregarding the sign) the distance from the origin of the three functions is proportional to the (absolute) y-intercepts. I t is thus seen that the distance is approximately the same for functions B and C and again group B can be used as a control group.
Scand. I . Psychol., VoL. I I, 1970

‘79
3. Sum of squared S-E differences. As mentioned before, this is the same for all three func- tions, viz. C(S - E)* = 130,734. For every single S-E difference in A there is a correspond- ing one in B and C. The sums are the same for the learning material too.
THE SIGN OF SLOPE I N THE LEARNING OF LINEAR FUNCTIONS
FIG. I. The position of the three functions in the coordinate system for groups A, B, and C.
0 50 100 150 200 250
Stimulus continuum S
4. Proportion of positive and negative S-E differences. For A, all these differences are negative, for B all are positive, and for C half are positive and half negative. Again, group B can be used as a control group, provided that the difficulty of the task is different for positive and negative deviations. If, however, the difficulty were to depend on the relative proportions of positive and negative deviations, group B cannot serve as a control in this respect.
5. Range of stimuli. The width of variation is 62 and 186 mm for S and E respectively, for all three functions. It is assumed that for this experiment, a possible difference in subjective range due to context effects for the same physical range is so small as not to affect the learning.
6. Spacing. S- and E-intervals vary between 4-10 and 12-30 mm for groups A and B, and 4-8 and 15-24 for group C.
Group B thus has the task of acting as a control for differences in (I) the functions’ distances from the origin, (2) the functions’ S-sectors, and (3) the proportions of positive S-E differences.
Subjects
randomly divided into 3 groups (A, B, and C) with 7 subjects in each. Twenty-one sixth-grade pupils, average age about 12 years, served as subjects. They were
Procedure Each subject was given 6 booklets, one for each of the 6 trials. The first part of each booklet
contained the training material and the latter part the test material. The total number of training stimuli was thus 60 and of test stimuli 72 for each subject. Each page of the booklet contained two lines, @e stimulus line, S, above the ‘response’ line, E. The lines, 230 mm long and 20 mm apart, were mimeographed onto the middle of the page (297 x 210 mm), parallel with the longer edge. On the upper line the S-distance was marked off by two vertical slashes 2 mm high. In like manner the E-distances were marked on the lower line in the learning part. In the test part, the right slash of the E-line was lacking and had to be provided by the subject, thus indicating the E-value associated with its S-value. Every second page was blank to avoid distraction from the next page. A page with a diagonal red line indicated the end of the training part. The pairs occurred in different random orders in every booklet in both the training and the test parts.
Scand. I . Psychol., Vol. 11, 1970

I 80 H. EISLER AND K. SPOLANDER
The subjects turned the page as directed by the experimenter, about every 8th second. There was a pause of I min between the training and test part and of 2 min between trials.
The oral instructions particularly emphasized that the upper and lower line belonged to- gether. Instances of training and test stimuli were shown. The instruction took about 20 min, and the whole procedure, run as a group experiment, about 60 min.
Results Two learning indicators were used:
I. The sum of the squared deviations between the subjects' response E' and the cor- rect response E, i.e. Z(E'-E)2. This indicator is a sensitive measure for systematic as well as for random errors (Bjorkman, 1965).
2. The constants a and b in the response function E'=a+bS. Fig. z gives the sum of the squared deviations for all three groups. ifjpqp~ w m :5 : s 2
a
0 e
5 ' 0 0 2 4 6 0 2 4 6 0 2 4 6
Trial
FIG. 2. Sum of squared deviation, Z(E'-E)*, as a function of trial number for groups A, B, and C.
I t is seen that there is no learning at all for group A, at least not after the first trial, some learning for group B, and most learning for group C. The peak for trial z in group C is worth noting and will be commented on later. No statistical test was made to see whether learning really has taken place in groups B and C. A scrutiny of the individual learning curves (not shown) reveals, however, that in group A one of the 7 observers seems to have exhibited some learning and another one had very low deviations already in trial I; in group B, 4 out of 7 subjects showed an improvement, whereas in group C only 2 out of 7 did not show any improvement.
One-way analyses of variance did not show any significant F-ratios between groups. These analyses were carried out for the total performance (all trials), all 6 trials one by one, trials combined into blocks of 2 and into blocks of 3. The S.D.s within the groups were very large; many F-ratios were below unity.
Fig. 3 and Table 2 give the slopes b of the fitted lines E' = a + bS with the absolute values of the slopes increasing downward in order to facilitate comparison with Fig. 2. It will be seen that Figs. z and 3 exhibit the same trend.
S c a d 1. Psychol., Vol. 11, 1970

THE SIGN OF SLOPE IN THE LEARNING OF LINEAR FUNCTIONS 181
As for the y-intercept, it will be seen from Table 2 that this approaches the correct value with increasing number of trials for groups B and C, most clearly for the latter.
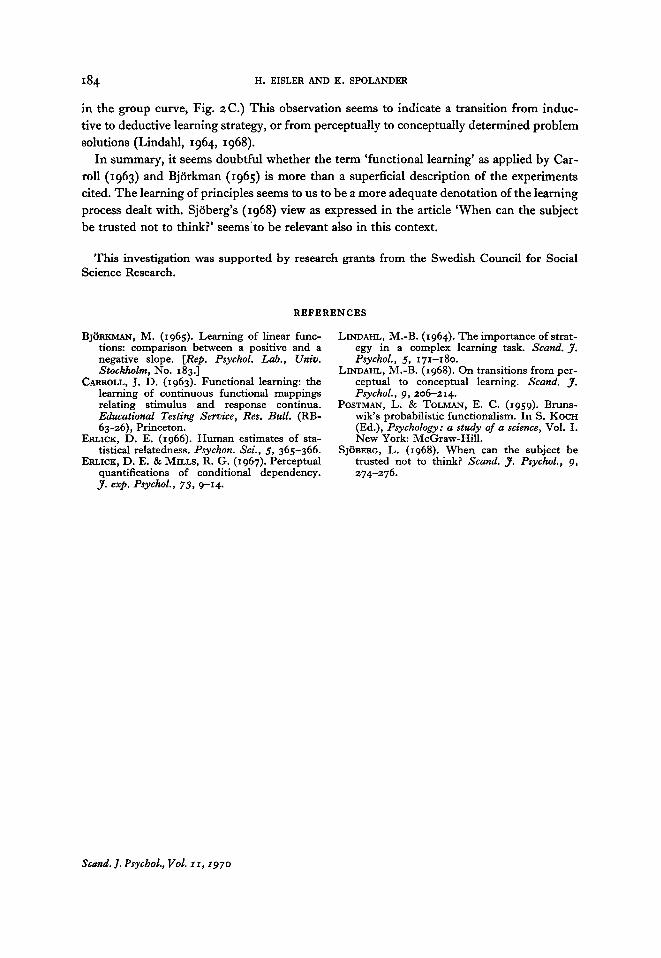
Fig. 4 gives the mean E'-values for the first and last trial for all 3 groups together with the fitted function E' = a + bS (computed from all observations, not from the means) and
0 2 4 6 0 2 4 6 0 2 4 6
Trial
FIG. 3. Slopes b in the functions E' = a + bS as a function of trial number for groups A, B, and C.
the correct function. Once again there is no learning for group A (the slope is unchanged, and the scatter, if anything, increases), some learning for group B (better agreement between fitted and correct slope, less scatter), and that group C is somewhat superior to group B.
TABLE 2. y-intercepts and slopes in the function E' = a + bS. The computations are based on all observations, not on the group means.
Group
A B C P P -
Trial a b a b a b
I 69.98 0.81 7.61 0.71 285.74 -1.29 2 55.30 1.10 -165.33 1.61 274.81 -1.28 3 57.62 1.16 -157.47 1.48 258.24 -1.07 4 50.16 1.21 - 91.05 1.16 278.69 -1.36 5 75.71 0.76 -120.23 1.33 327.50 -1.67 6 78.10 0.81 -188.56 1.67 370.37 -2.13
-448.00 3.00 512.00 -3.00 Correct -64.00 3.00 values
CONCLUSION AND DISCUSSION
From the data it may be concluded (i) that the performance of the three groups is roughly the same, and (ii) that most learning takes place in group C and none in group A. These results seem somewhat contradictory, but whereas (i) is based on a statistical test, (ii) is derived simply from looking at the curves. Group B seems to have functioned satisfactorily as a control group for performance, but as to the learning curves, all 3 groups seem dif- ferent.
12 - 701945 Scasd. J. Psychol., Vol. 11, I970

I 82 H. EISLER AND K. SPOLANDER
~~ 0
B Trial 6
1
1 5 0
5 0
A Trial I
2 5 5 0 7 5 100 0
, I t !
~ O ~ :
C Tr ial 6
100 125 150 175
I 2 0 0
w
5 150
5 - C 0 0
100 C 0 a VI * a
50
0
I I I
0
A Trial 6
I I 1 8 -
2 5 5 0 7 5 100
1 175 2 0 0 225 250 150 1 7 5 200 225 250
St imulus c o n l l n u u r n 5
FIG. 4. Mean response plotted vs. stimuli for the first and last trial for groups A, B, and C. The intrapolated values are indicated by a larger circle. The fitted function E ' = a + b S (based on all values, not on the means) (thick line) and the correct function (thin line) are also shown.
Scrmd. J . Psychol., Vol. XI, 1970

THE SIGN OF SLOPE IN THE LEARNING OF LINEAR FUNCTIONS 183
The fact that there was no significant difference in performance may be due to any of
(I) The small size of the groups, particularly in relation to the large S.D.S. (2) The difficulty of the material to be learned. The large S.D.s and deviations, com-
pared to Bjorkman’s data, point in this direction. A longer learning period might have given different results.
(3) S-E differences rather than sign of slope determines the difficulty of linear functions to be learned.
The arguments presented above should be regarded as formal rather than substantial, presupposing Case (ii), genuine functional learning, to prevail.
As a matter of fact, there are several indications that the subjects had applied or learned a principle, not a function, i.e. that Case (iii) obtained. Assume that the function to be learned had been E = S. This would have entailed that in the learning part each slash on the E-line was exactly below the slash on the S-line. Does it seem reasonable to suppose that the subjects are learning a function, when their task, in concrete terms, was simply to put one mark below another one? In like manner, in the somewhat more complicated func- tion E = S + a, would not the principle ‘put the mark a fixed length to the right of the mark given’ prove more expedient than the learning of a function? In all three experiments with positive slopes and small y-intercepts, i.e. Carroll’s (1963), Bjorkman’s (1965), and our group A, the slopes obtained empirically are close to unity. Since both Carroll and Bjorkman chose y-intercepts that counteracted the effect of a prescribed slope exceeding unity, i.e. yielded smaller S-E differences than the slopes of 1.28 and 1.2 alone would have given, the slopes close to unity obtained in their cases can probably be referred to the principle of marking off equal distances. One can further speculate that the subjects noted that there was no exact agreement between the S- and E-distances and attributed this discrepancy with the simplest principle (E = S) to a probabilistic rather than a strict relation between S and E (cf. Brunswik‘s ‘probabilistic functionalism’, see e.g. Postman & Tolman, 1959), which they tried to imitate. That subjects are sensitive to probabilistic relations is shown e.g., by the experiments of Erlick (1966) and Erlick & Mills (1967). In Bjorkman’s experi- ment with a slope of - 1.2, an empirical slope close to - 1.0 was again obtained. We are inclined to interpret this outcome as an application of the principle ‘mark off the given S-distance leftwards from a fixed point near the right end of the E-line’. Because of the difficulty of (u) displacing the distance and (b ) always finding the same fixed point to start from, worse performance and greater scatter is to be expected, and only in this sense isa linear function with a negative slope more difficult to learn than one with a positive slope.
Our group A seems to have stubbornly adhered to the above principle ‘put the mark a fixed length to the right of the mark given’, whereas our group B seems to have started out with the same principle, but then either switched to genuine function learning or applied some more complicated principle. In both cases, the values of the parameter corresponding to the slope improved gradually (see Table 2 and Fig. 3) and Cases (ii) and (iii) cannot be distinguished.
Group C is of particular interest because of the peak in the learning curve found in all subjects in one of the trials 2-4. This peak is always followed by a rapid improvement in the next trial. (Because of the different peak locations this does not emerge quite so clearly
Scad. 1. Psychol., Vol. XI, 1970
the following factors.
‘84 H. EISLER AND K. SPOLANDER
in the group curve, Fig. 2C.) This observation seems to indicate a transition from induc- tive to deductive learning strategy, or from perceptually to conceptually determined problem solutions (Lindahl, 1964, 1968).
In summary, it seems doubtful whether the term ‘functional learning’ as applied by Car- roll (1963) and Bjorkman (1965) is more than a superficial description of the experiments cited. The learning of principles seems to us to be a more adequate denotation of the learning process dealt with. Sjoberg’s (1968) view as expressed in the article ‘When can the subject be trusted not to think?’ seems’to be relevant also in this context.
This investigation was supported by research grants from the Swedish Council for Social Science Research.
REFERENCES
BJORKMAN, M. (1965). Learning of linear func- tions: comparison between a positive and a negative slope. [Rep. Psychol. Lab., Univ. Stockholm, No. 183.1
CARROLL, J. D. (1963). Functional learning: the learning of continuous functional mappings relating stimulus and response continua. Educational Testing Service, Res. Bull. (RB- 63-26), Princeton.
ERLICK, D. E. (1966). Human estimates of sta- tistical relatedness. Psychon. Sci., 5 , 365-366.
ERLICK, D. E. & MILLS, R. G. (1967). Perceptual quantifications of conditional dependency. J. exp. Psychol., 73, 9-14.
LINDAHL, M.-B. (1964). The importance of strat- egy in a complex learning task. Scand. J . Psychol., 5 , 171-180.
LINDAHL, M.-B. (1968). On transitions from per- ceptual to conceptual learning. Scand. J . Psychol., 9, 206-214.
wik’s probabilistic functionalism. In S. KOCH (Ed.), Psychology: a study of a science, Vol. I. New York NIcGraw-Hill.
SJOBERG, L. (1968). When can the subject be trusted not to think? Scand. J . Psychol., 9, 274-276.
POSTMAN, L. & TOLMAN, E. C. (1959). B ~ s -
Scand. J . PJychol,, Vol. XI, 1970