Embed Size (px)
Citation preview

National Aeronautics andSpace AdministrationIS20George C. Marshall Space Flight CenterMarshall Space Flight Center, Alabama35812
Robert M. Wilson and David H. HathawayMarshall Space Flight Center, Marshall Space Flight Center, Alabama
NASA/TP—2008–215413
On the Relationship Between Solar Wind Speed, Earthward-Directed Coronal Mass Ejections, Geomagnetic Activity, and the Sunspot Cycle Using 12-Month Moving Averages
June 2008

The NASA STI Program…in Profile
Since its founding, NASA has been dedicated to the advancement of aeronautics and space science. The NASA Scientific and Technical Information (STI) Program Office plays a key part in helping NASA maintain this important role.
The NASA STI program operates under the auspices of the Agency Chief Information Officer. It collects, organizes, provides for archiving, and disseminates NASA’s STI. The NASA STI program provides access to the NASA Aeronautics and Space Database and its public interface, the NASA Technical Report Server, thus providing one of the largest collections of aeronautical and space science STI in the world. Results are published in both non-NASA channels and by NASA in the NASA STI Report Series, which includes the following report types:
• TECHNICAL PUBLICATION. Reports of completed research or a major significant phase of research that present the results of NASA programs and include extensive data or theoretical analysis. Includes compilations of significant scientific and technical data and information deemed to be of continuing reference value. NASA’s counterpart of peer-reviewed formal professional papers but has less stringent limitations on manuscript length and extent of graphic presentations.
• TECHNICAL MEMORANDUM. Scientific and technical findings that are preliminary or of specialized interest, e.g., quick release reports, working papers, and bibliographies that contain minimal annotation. Does not contain extensive analysis.
• CONTRACTOR REPORT. Scientific and technical findings by NASA-sponsored contractors and grantees.
• CONFERENCE PUBLICATION. Collected papers from scientific and technical conferences, symposia, seminars, or other meetings sponsored or cosponsored by NASA.
• SPECIAL PUBLICATION. Scientific, technical, or historical information from NASA programs, projects, and missions, often concerned with subjects having substantial public interest.
• TECHNICAL TRANSLATION. English-language translations of foreign scientific and technical material pertinent to NASA’s mission.
Specialized services also include creating custom thesauri, building customized databases, and organizing and publishing research results.
For more information about the NASA STI program, see the following:
• Access the NASA STI program home page at <http://www.sti.nasa.gov>
• E-mail your question via the Internet to <[email protected]>
• Fax your question to the NASA STI Help Desk at 301– 621–0134
• Phone the NASA STI Help Desk at 301– 621–0390
• Write to: NASA STI Help Desk NASA Center for AeroSpace Information 7115 Standard Drive Hanover, MD 21076–1320

�
NASA/TP—2008–215413
On the Relationship Between Solar Wind Speed, Earthward-Directed Coronal Mass Ejections, Geomagnetic Activity, and the Sunspot Cycle Using 12-Month Moving AveragesRobert M. Wilson and David H. HathawayMarshall Space Flight Center, Marshall Space Flight Center, Alabama
June 2008
Nat�onal Aeronaut�cs andSpace Adm�n�strat�on
Marshall Space Fl�ght Center • MSFC, Alabama 35812
��
Ava�lable from:
NASA Center for AeroSpace Informat�on7115 Standard Dr�ve
Hanover, MD 21076 –1320301– 621– 0390
Th�s report �s also ava�lable �n electron�c form at<https://www2.st�.nasa.gov>

���
TABLE OF CONTENTS
1. INTRODUCTION .............................................................................................................. 1
2. RESULTS AND DISCUSSION ......................................................................................... 3
2.1 Behav�oral Character�st�cs Dur�ng Cycle 23 (1996 –2006) ............................................. 3 2.2 Cycl�c and Pred�ct�ve Aspects of the Sunspot/Geomagnet�c Record (1868 –2006) ......... 9
3. SUMMARY ........................................................................................................................ 24
APPENDIx ............................................................................................................................. 25
REFERENCES ....................................................................................................................... 77

�v
LIST OF FIGURES
1. Var�at�on of sunspot number R (panel (a)), the aa geomagnet�c �ndex (panel (b)), the number of halo and part�al halo CMEs NH+PH (panel (c)) and solar w�nd speed v �n km s–1 (panel (d)) for the �nterval January 1996–December 2006. See text for deta�ls ..................................................................................................... 4
2. Var�at�on of the res�dual or follow�ng recurrent component aaI for the �nterval January 1996 –December 2006 .................................................................................. 5
3. The rat�o aaI/aa (us�ng the 12-mo mov�ng averages) for the �nterval January 1996 –December 2006 .................................................................................. 6
4. Scatter plot of NH+PH versus R (January 1996 –December 2006) ............................. 7
5. Var�at�on of (a) aa, (b) v, and (c) coverage for the �nterval January 1964 –December 2006 .................................................................................. 8
6. Var�at�on of aa for the �nterval July 1868 –January 1890: (a) Cycle 11 aam; (b) cycle 12 aam; (c) cycle 12 aaM ............................................................................. 11
7. Var�at�on of aa for the �nterval January 1890 –January 1920: (a) Cycle 13 aam; (b) cycle 14 aam; (c) cycle 15 aam and aaM ............................................................... 12
8. Var�at�on of aa for the �nterval January 1920 –January 1940: (a) Cycle 16 aam; (b) cycle 17 aam ........................................................................................................ 13
9. Var�at�on of aa for the �nterval January 1940 –January 1960: (a) Cycle 18 aam; (b) cycle 19 aam ........................................................................................................ 14
10. Var�at�on of aa for the �nterval January 1960 –January 1980: (a) Cycle 20 aam; (b) cycle 21 aam′ ........................................................................................................ 15
11. Var�at�on of aa for the �nterval January 1980 –January 2000: (a) Cycle 22 aam; (b) cycle 23 aam ........................................................................................................ 16
12. Var�at�on of aa for the �nterval January 2000 –January 2007 ..................................... 17
13. Var�at�on of selected parametr�c values for cycles 11–23: (a) Rm; (b) RM; (c) ASC; (d) PER; (e) aam*; (f) aaM*. See text for deta�ls ....................................................... 18

v
LIST OF FIGURES (Continued)
14. Var�at�on of selected t�m�ng s�gnature values for cycles 11–23: (a)–(h) are t(1)–t(8). See text for deta�ls ................................................................................ 19
15. Scatter plots of (a) Rm (cycle n+1), and (b) RM (cycle n+1) versus aaM* (cycle n); (c) Rm, and (d) RM versus aam*. See text for deta�ls ................................................ 21
16. Scatter plots (a)–(c) of observed values of RM versus pred�cted values of RM, based on spec�fic b�var�ate fits, and observed values (d) of Rm versus pred�cted values of Rm, based on a spec�fic b�var�ate fit. See text for deta�ls ............................ 22

v�
LIST OF TABLES
1. Correlat�ve results based on smoothed values (1996–2006) ........................................ 8
2. Selected parametr�c values (cycles 11–23) .................................................................. 10
3. SOHO/LASCO/CME counts .................................................................................... 25
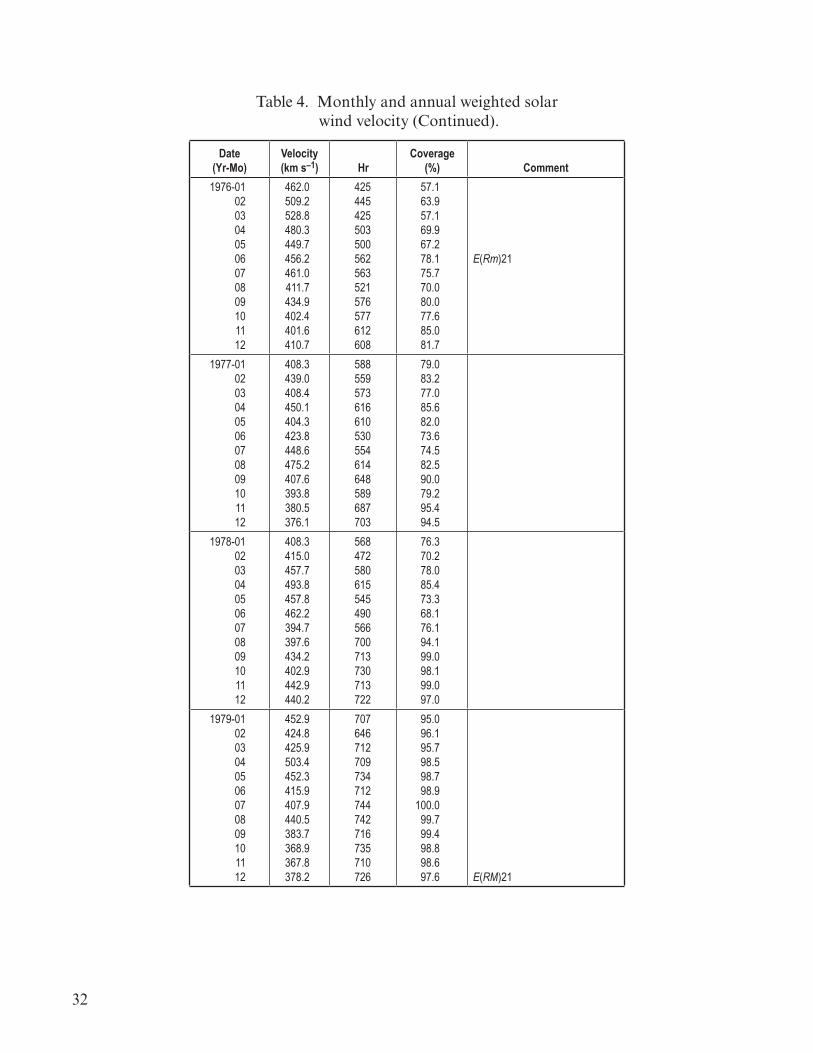
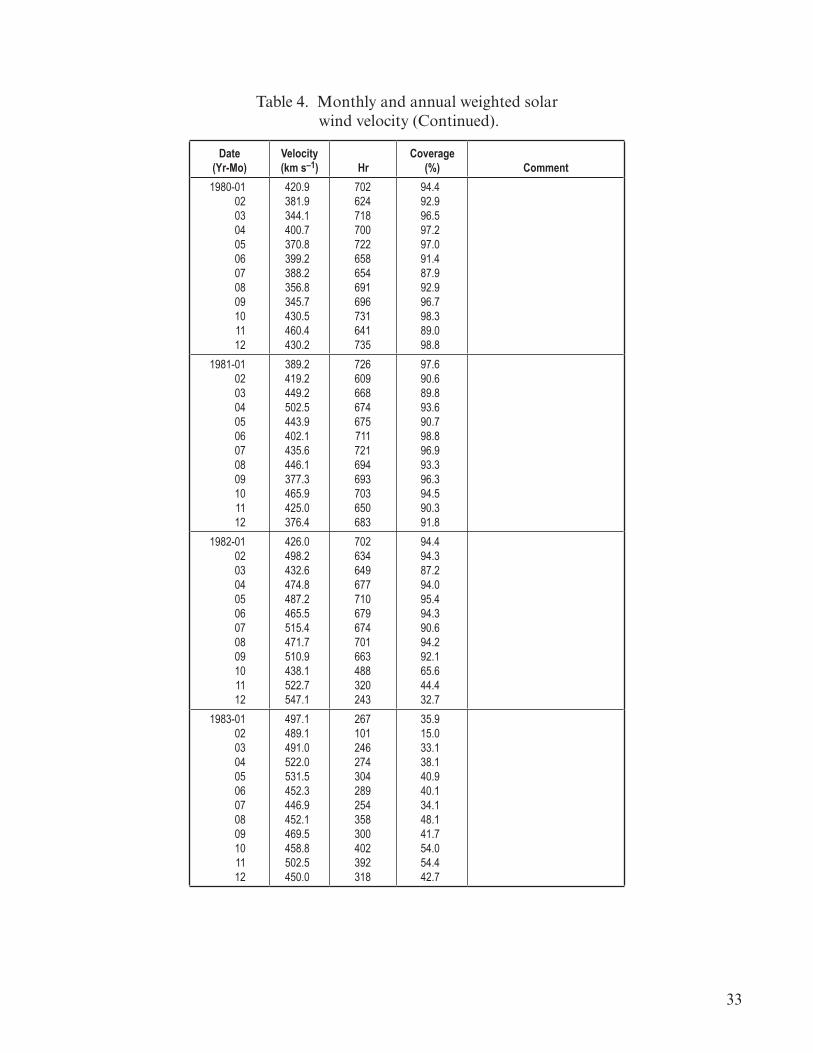
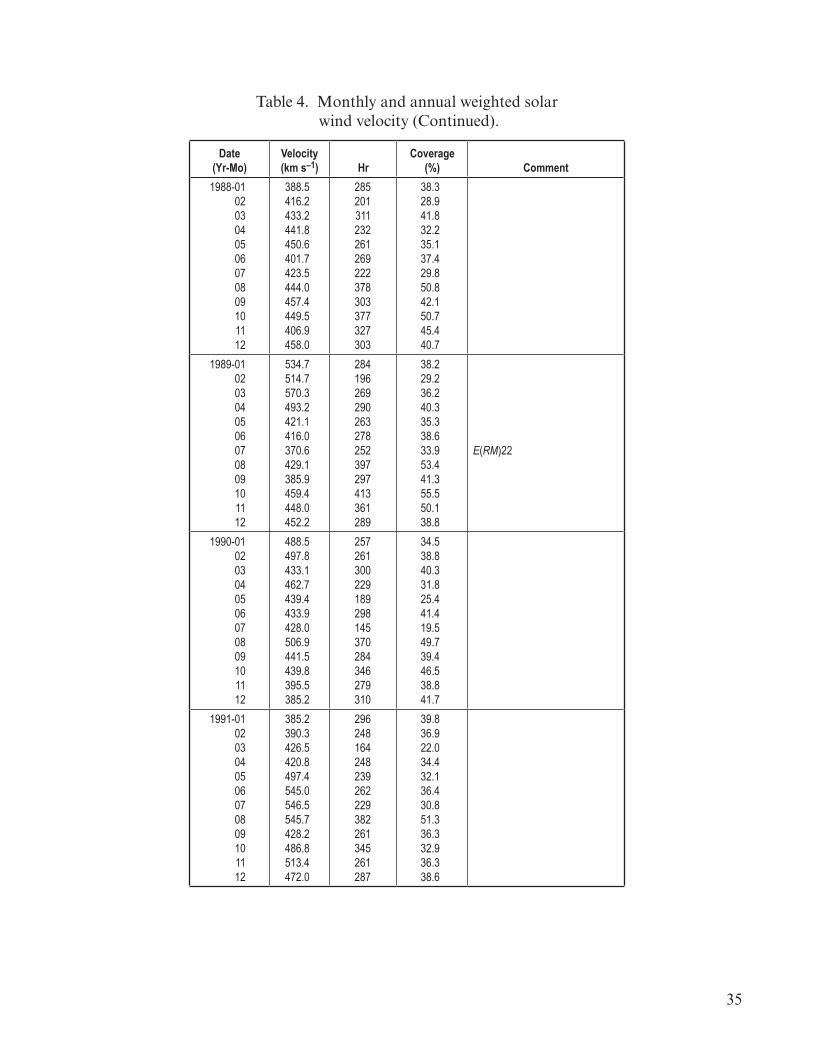
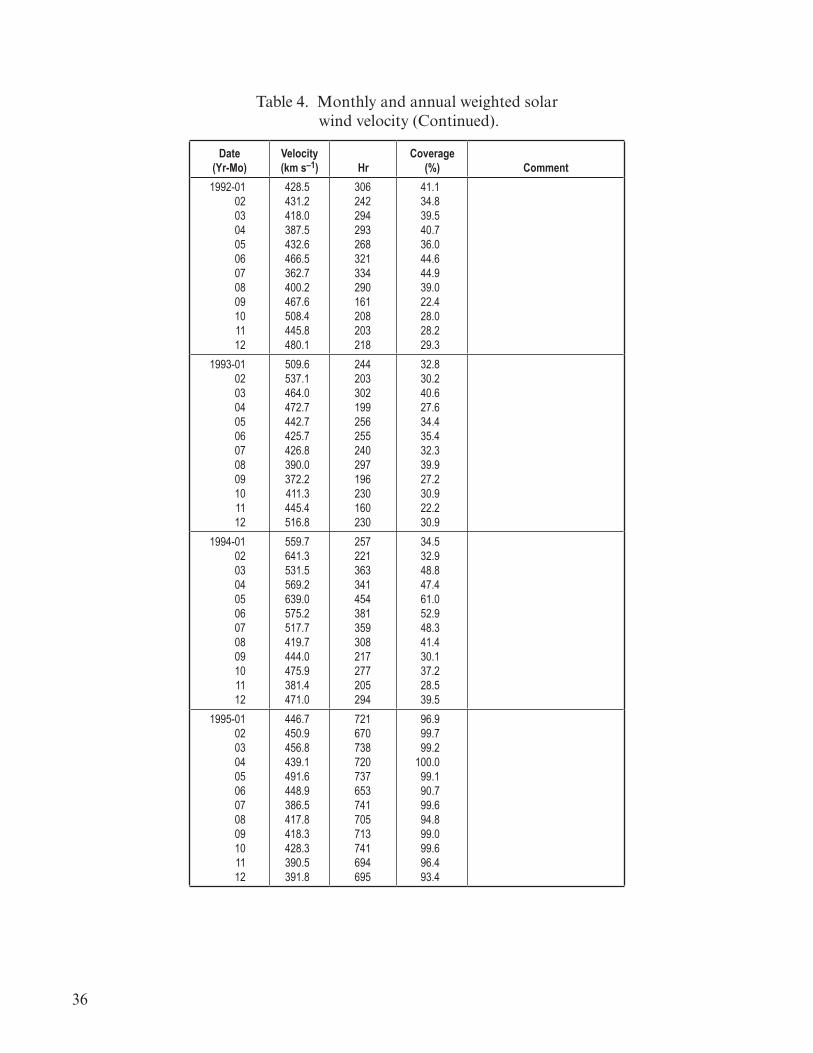
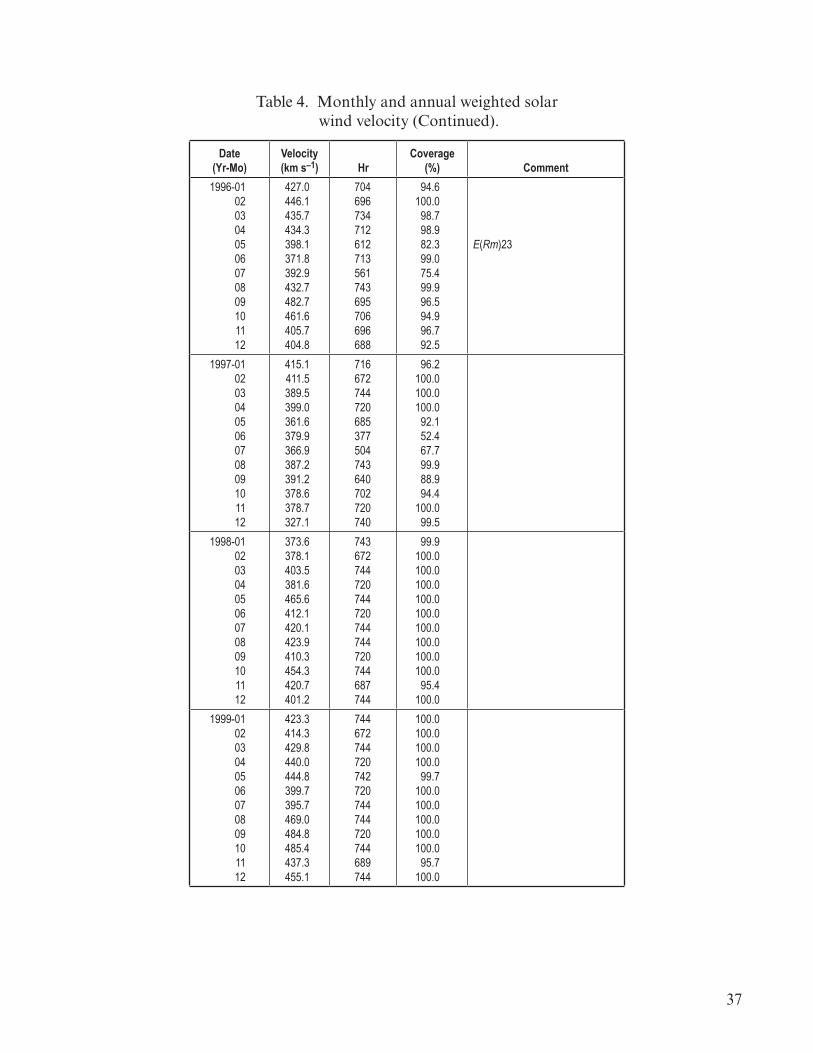
4. Monthly and annual we�ghted solar w�nd veloc�ty ..................................................... 29
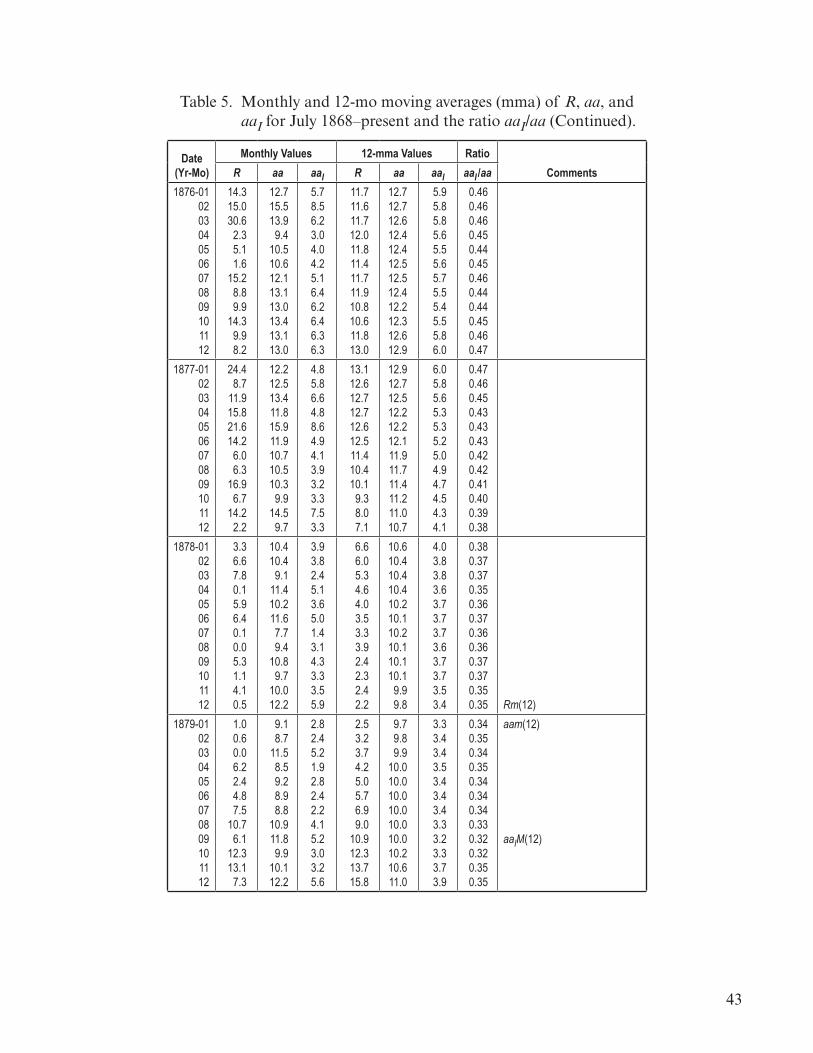
5. Monthly and 12-mo mov�ng averages (mma) of R, aa, and aaI for July 1868–present and the rat�o aaI/aa ................................................................. 41

v��
LIST OF ACRONYMS AND SYMBOLS
AU astronom�cal un�t
CME coronal mass eject�on
IMF �nterplanetary magnet�c field
IP �nterplanetary
LASCO the Large Angle and Spectrometr�c Coronagraph exper�ment
LP long per�od
mma monthly mov�ng average
nT nano Tesla
SOHO Solar and Hel�ospher�c Observatory
SP short per�od
TP Techn�cal Publ�cat�on

v���
NOMENCLATURE
aa the aa geomagnet�c �ndex
aaI the res�dual or follow�ng recurrent component of aa
aaIm the m�n�mum value of the 12-mo mov�ng average of aaI
aaIM the max�mum value of the 12-mo mov�ng average of aaI
aaIm′ a spec�fic geomagnet�c �ndex
aam the m�n�mum value of the 12-mo mov�ng average of aa
aam* the m�n�mum value of aa �n the v�c�n�ty of Rm
aam′ a spec�fic geomagnet�c �ndex
aaM the max�mum value of the 12-mo mov�ng average of aa
aaM* the max�mum value of aa dur�ng the decl�ne of a sunspot cycle
aaR the lead�ng sporad�c component of aa
ASC the ascent durat�on �n months
Ap a spec�fic geomagnet�c �ndex
Ci a spec�fic geomagnet�c �ndex
cl confidence level
E(aam) the epoch of occurrence of aam
E(aam*) the epoch of occurrence of aam*
E(aaM) the epoch of occurrence of aaM
E(aaM*) the epoch of occurrence of aaM*
E(aaIm) the epoch of occurrence of aaIm
�x
NOMENCLATURE (Continued)
E(aaIM) the epoch of occurrence of aaIM
E(NH+PHm) the epoch of occurrence of NH+PHm
E(NH+PHM) the epoch of occurrence of NH+PHM
E(Rm) the epoch of occurrence of Rm
E(RM) the epoch of occurrence of RM
E(vm) the epoch of occurrence of vm
E(vM) the epoch of occurrence of vM
n number
NCME the number of coronal mass eject�on events
NH+PH the number of halo and part�al halo events
NH+PHm the m�n�mum value of the 12-mo mov�ng average of NH+PH
NH+PHM the max�mum value of the 12-mo mov�ng average of NH+PH
P probab�l�ty
PER per�od �n months
r coeffic�ent of correlat�on
r 2 coeffic�ent of determ�nat�on
R sunspot number
Rm the m�n�mum value of the 12-mo mov�ng average of R
RM the max�mum value of the 12-mo mov�ng average of R
Rmax the max�mum sunspot ampl�tude
se standard error of est�mate

x
NOMENCLATURE (Continued)
t(1) the t�me �n months between E(RM) and E(aaM*)
t(2) the t�me �n months between E(aaM*) and the follow�ng cycle’s E(Rm)
t(3) the t�me �n months between E(aaM*) cycle n and E(aaM*) cycle n+1
t(4) the t�me �n months between E(aaM*) cycle n and E(aam*) cycle n+1
t(5) t�me �n months between E(RM) cycle n and E(aam*) cycle n+1
t(6) the t�me �n months between E(Rm) and E(aam*)
t(7) the t�me �n months between E(aam*) and E(RM)
t(8) the t�me between E(aam*) cycle n and E(aam*) cycle n+1
v the solar w�nd speed (veloc�ty)
vm the m�n�mum value of the 12-mo mov�ng average of v
vM the max�mum value of the 12-mo mov�ng average of v
x the �ndependent var�able
y the dependent var�able (the regress�on equat�on)

1
TECHNICAL PUBLICATION
ON ThE RELATIONShIp BETWEEN SOLAR WIND SpEED, EARThWARD-DIRECTED CORONAL MASS EjECTIONS, GEOMAGNETIC ACTIvITY, AND ThE SUNSpOT CYCLE
USING 12-MONTh MOvING AvERAGES
1. INTRODUCTION
About 30 years ago, on the bas�s of the Ci �ndex, N.P. Ch�rkov1 suggested that the solar w�nd veloc�ty and geomagnet�c act�v�ty were both correlated w�th solar act�v�ty. In part�cular, Ch�rkov found that the geomagnet�c act�v�ty max�mum lagged about 1.5 – 2 yr beh�nd the solar act�v�ty max�-mum �n odd-numbered cycles and 2 – 5 yr �n even-numbered cycles, attr�but�ng the �ncreased geo-magnet�c act�v�ty dur�ng the decl�n�ng port�on of a solar cycle to the presence of coronal holes, the source for recurrent, h�gh-speed, solar w�nd streams.2– 4 Furthermore, Ch�rkov noted that the range of var�at�ons �n geomagnet�c act�v�ty was greater �n even-numbered cycles rather than �n odd-num-bered cycles (as ev�nced by the rat�o of max�mum to m�n�mum values �n geomagnet�c act�v�ty), and he went on to pred�ct that cycle 21 should have �ts max�mum �n solar w�nd veloc�ty �n 1980 –1982, and cycle 22 should have �ts max�mum �n 1995 – 1996 and should be s�ngle-peaked.
To descr�be the late-occurr�ng geomagnet�c peak �n solar cycles, Feynman5 suggested decom-pos�ng the aa geomagnet�c �ndex �nto two spec�fic components — the lead�ng sporad�c component (that port�on assoc�ated d�rectly w�th solar act�v�ty, as descr�bed us�ng sunspot number, denoted here as aaR) and the res�dual or follow�ng recurrent component (that port�on that rema�ns, hav-�ng removed the sporad�c component, denoted here as aaI, wh�ch equals aa–aaR). Soon thereafter, Sargent6 developed a s�mple �ndex based on half-day values of the aa �ndex to descr�be the follow-�ng recurrent component, call�ng �t the 27-day recurrence �ndex, where h�gher values of the �ndex �nd�cate the presence of both h�gh-speed streams and coronal holes, and lower values �nd�cate the lack of both h�gh-speed streams and coronal holes. Sargent went on to state, on the bas�s of descr�b-�ng sunspot cycles us�ng 12-mo mov�ng averages of monthly mean sunspot number, that the onset of recurrent act�v�ty �s generally abrupt and that the term�nat�on of recurrent act�v�ty �s almost as abrupt as at onset, but occurs about 1 yr �nto the new cycle, and that dur�ng odd-numbered cycles the recurrent state lasts about 1.5 – 3 yr, wh�le last�ng about 3 – 5 yr dur�ng even-numbered cycles.
Russell and Mull�gan7 suggested that the long-term var�at�on of geomagnet�c act�v�ty m�ght be caused by a long-term var�at�on �n the solar w�nd veloc�ty, the solar w�nd dens�ty, or the �nter-planetary magnet�c field (IMF). Gaz�s et al.8 found a correlat�on (r = 0.8) between solar w�nd speed and the Ap geomagnet�c �ndex (when the coverage was greater than or equal to 85%). Crooker and McAll�ster,9 Watar� and Watanabe,10 and R�chardson, Cl�ver, and Cane11 found that coronal mass eject�ons (CMEs) also contr�bute to the overall geomagnet�c act�v�ty dur�ng the solar cycle.

2
Rangarajan and Barreto12 exam�ned long-term var�at�ons �n the solar w�nd veloc�ty and IMF �nten-s�ty, not�ng that solar w�nd speed max�m�zes about 22 mo after solar max�mum and m�n�m�zes about a year after solar m�n�mum, w�th no apparent relat�onsh�p ex�st�ng between the ampl�tude of sunspot number R and solar w�nd speed v. R�chardson, Cane, and Cl�ver13 showed that h�gh-speed streams account for about two-th�rds of the long-term aa averages at solar m�n�mum, wh�le at solar max�-mum, structures assoc�ated w�th trans�ents account for about half of the long-term aa averages.
In th�s Techn�cal Publ�cat�on (TP), the relat�onsh�p between solar w�nd speed, geomag-net�c act�v�ty (the aa �ndex), and the solar cycle �s reexam�ned us�ng 12-mo mov�ng averages, where the solar w�nd speed �s determ�ned us�ng the Omn� merged 1-hr 1 AU �nterplanetary (IP) data <http://cdaweb.gsfc.nasa.gov/>. Th�s study, the second �n a two-part study, expands upon our pre-v�ous study us�ng annual averages.14 Also exam�ned �s the relat�onsh�p between earthward-d�rected CMEs and the solar w�nd speed and geomagnet�c/solar cycle, where the earthward-d�rected CMEs are the halo and part�al halo events extracted from the SOHO/LASCO CME catalog, <http://cdaw.gsfc.nasa.gov/CME_l�st/>.

3
2. RESULTS AND DISCUSSION
2.1 Behavioral Characteristics During Cycle 23 (1996–2006)
F�gure 1 d�splays the var�at�ons of (a) sunspot number R, (b) the aa geomagnet�c �ndex, (c) the number of halo and part�al halo CMEs NH+PH, and (d) solar w�nd speed v �n km s–1 for the �nterval January 1996 –December 2006, essent�ally cover�ng all of sunspot cycle 23. For R, aa, and v, plotted are the monthly means (the th�n jagged l�nes) and the 12-mo mov�ng averages (the th�ck smoothed l�nes), and for NH+PH, plotted are the observed monthly counts (the th�n jagged l�ne) and the 12-mo mov�ng average counts (the th�ck smoothed l�ne). For each parameter, the m�n�mum and max�mum values and the�r dates of occurrence are �dent�fied. Thus, based on the 12-mo mov-�ng averages, Rm = 8.0 (May 1996), RM = 120.8 (Apr�l 2000), aam = 15.8 (September/October 1997), aaM = 38.0 (August 2003), NH+PHm ≤1.3 (on or before July 1996), NH+PHM = 18.0 (November 2000), vm = 376.4 km s–1 (October 1997) and vM = 547.1 km s–1 (August 2003).
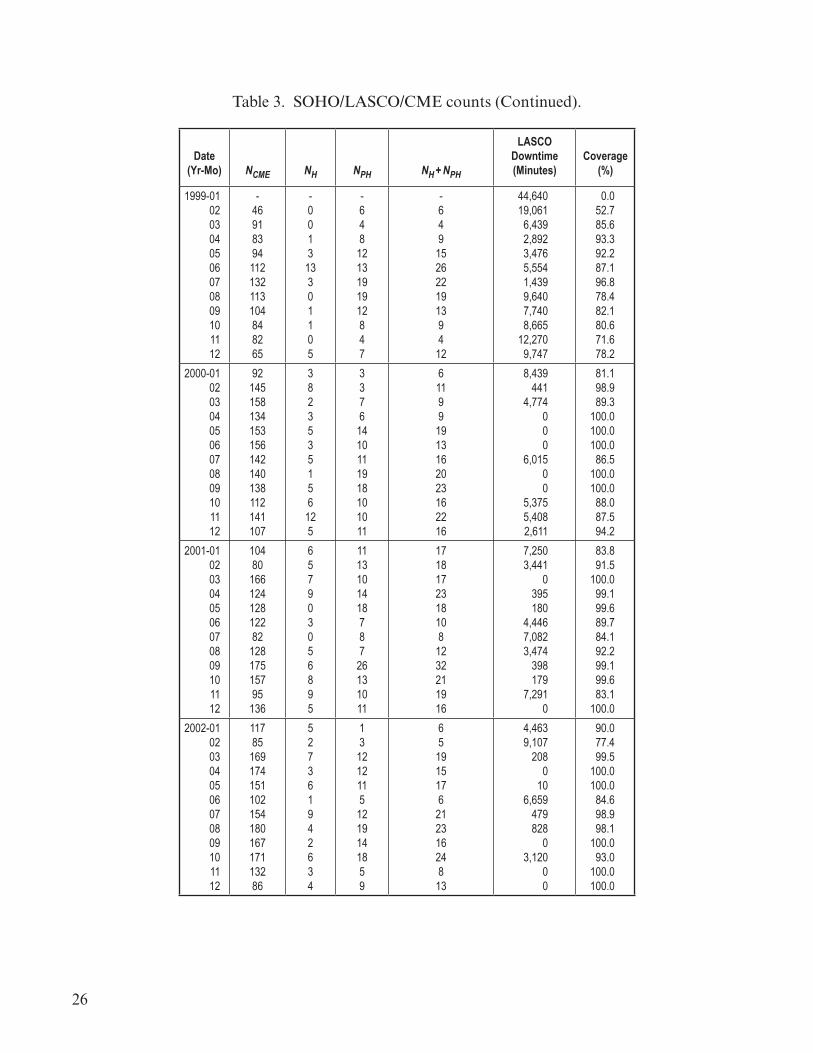
Halo and part�al halo events are those earthward-d�rected CMEs as determ�ned us�ng the C2-telescope of the Large Angle and Spectrometr�c Coronagraph (LASCO) onboard the Solar and Hel�ospher�c Observatory (SOHO). Of the 11,618 events l�sted �n the SOHO/LASCO CME cata-log (1996–2006), 393 events were descr�bed as halo CMEs and 811 events were descr�bed as be�ng poss�bly part�al halo CMEs; one �nfers at least 1,204 poss�ble earthward-d�rected CMEs (or about 10.4% of all cataloged CMEs). For the �nterval 1996–2006, coverage averaged 86.3%; one �nfers that the corrected numbers m�ght be as much as 15.9% h�gher. Table 3 �n the append�x l�sts the monthly counts of each group�ng of CMEs, the cumulat�ve downt�me �n m�nutes for LASCO, and the percent coverage for each month January 1996–December 2006 and annually 1996–2006.
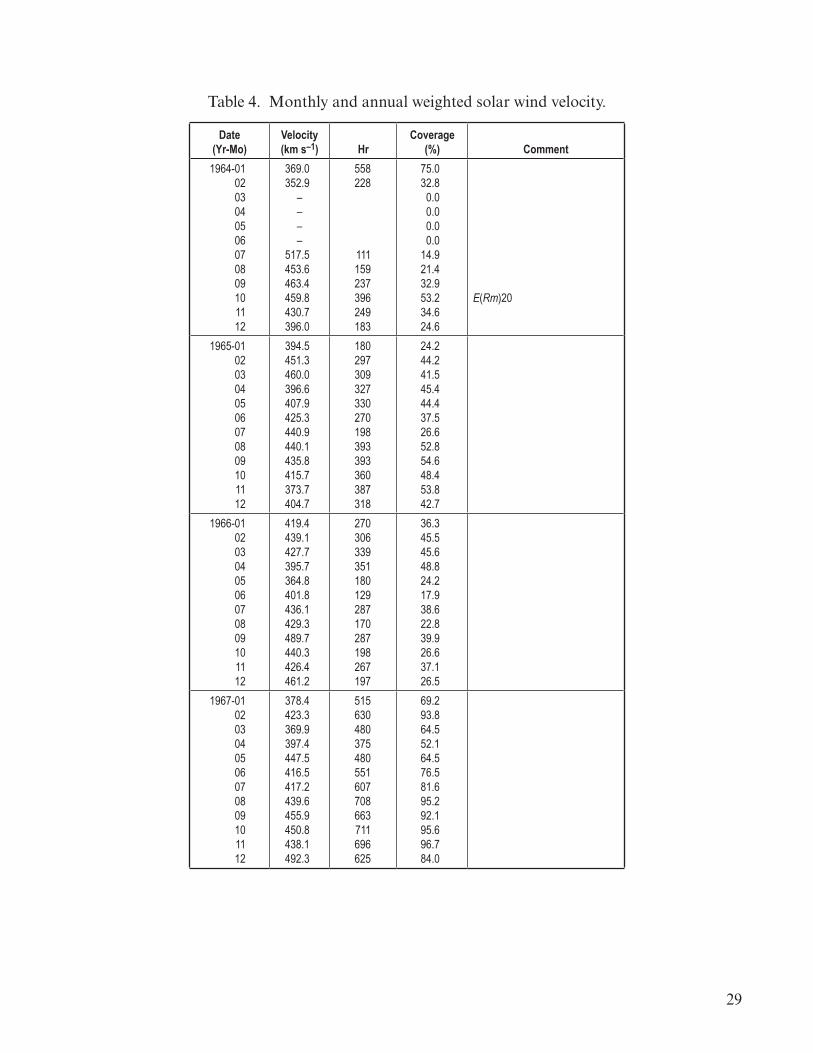
Solar w�nd speeds are based on the average m�n�mum and max�mum da�ly solar w�nd speeds for each month (l�ken to the computat�on of mean temperature on Earth <http://cl�mate.arm.ac.uk/cal�brated.html>). As an example, on January 1, 1996, solar w�nd speeds were recorded for each hour of the day, hav�ng a max�mum of 423 km s–1 and a m�n�mum of 387 km s–1, thereby �nferr�ng an average of the extremes of 405 km s–1. Observat�ons are ava�lable for each day of the month, cover�ng 704 hr (94.6% coverage). The average of the da�ly max�mum-m�n�mum averages, we�ghted accord�ng to the number of hours of da�ly observat�on, was 427.0 km s–1, and th�s value represents the we�ghted-average solar w�nd speed for January 1996 that �s plotted �n figure 1. Table 4 �n the append�x l�sts the monthly we�ghted solar w�nd speed �n km s–1, and the cumulat�ve hours of obser-vat�on and the percent coverage for each month January 1964 – July 2007 and annually 1996 – 2006.

4
vm = 376.4 km s–1
E(vm): October 1997vM = 547.1 km s–1
E(vM): August 2003
E(vm)
E(vM)
E(aaM)
aam 15.8E(aam): September/October 1997
aaM 38.0E(aaM): August 2003
E(aam)
23
Rm = 8.0E(Rm): May 1996
RM = 120.8E(RM): April 2000
E(Rm)
E(RM)
v(k
m s
–1)
NH
+PH
(Obs
erve
d)aa
R
200
150
100
50
0
50
40
30
20
10
0
30
20
10
0
600
500
400
3001996 1998 2000 2002 2004 2006
1996 1998 2000 2002 2004 2006
1996 1998 2000 2002 2004 2006
1996 1998 2000 2002 2004 2006
Year
NH+PHm≤1.3
NH+PHM=18.0E(NH+PHM)E(NH+PHM):=November 2000
E(NH+PHM):On or Before July 1996
(a)
(b)
(c)
(d)
F�gure 1. Var�at�on of sunspot number R (panel (a)), the aa geomagnet�c �ndex (panel (b)), the number of halo and part�al halo CMEs NH+PH (panel (c)) and solar w�nd speed v �n km s–1 (panel (d)) for the �nterval January 1996–December 2006. See text for deta�ls.

5
Pla�nly, for cycle 23, an odd-numbered cycle, the max�mum of geomagnet�c act�v�ty (aaM) follows max�mum sunspot ampl�tude (RM) by 40 mo (3.3 yr), co�nc�d�ng w�th the max�mum �n solar w�nd speed (vM) and not the max�mum �n earthward-d�rected CMEs (NH+PHM). Such a find�ng �s �n contrast to that noted earl�er by Ch�rkov, whose prev�ous stud�es suggested that odd-numbered cycles had geomagnet�c peaks about 1.5 – 2 yr after sunspot max�mum. The observed aaM �s the h�ghest ever recorded and the rat�o of aaM to aam �s 2.4, �nd�cat�ng a 140% �ncrease �n geomagnet�c act�v�ty from aam to aaM. Recall also that Ch�rkov prev�ously had noted that odd-numbered cycles had a smaller range of var�at�on (max�mum to m�n�mum) as compared to even-numbered cycles, typ�cally 60 – 80%. Clearly, the var�at�on observed �n cycle 23 has been much more robust and �s �n stark contrast to that descr�bed by Ch�rkov. The s�multaneous peak�ng of aaM and vM some 40 mo after Rmax �s also �n contrast to that reported by Rangarajan and Barreto, who stated that solar w�nd speed max�m�zes about 22 mo after solar max�mum.
F�gure 2 shows the var�at�on of the res�dual or follow�ng recurrent component aaI for the same t�me �nterval (January 1996–December 2006), where the aaI component �s determ�ned as aa – aaR (the lead�ng sporad�c component). The th�n l�ne represents the monthly mean value of aaI, and the th�ck l�ne �s �ts 12-mo mov�ng average. The value of aaIm equals 8.3 (September–October 1997), occurr�ng some 16 – 17 mo after Rm and occurr�ng s�multaneously w�th aam and vm, and the value of aaIM equals 28.9 (August 2003), occurr�ng s�multaneously w�th aaM and vM. The rat�o aaIM to aaIm measures about 3.5. Table 5 �n the append�x l�sts the monthly mean and 12-mo mov-�ng averages for R, aa, and aaI for July 1868–present and l�sts the rat�o aaI/aa. (Monthly values of aa pr�or to 1957 were adjusted by add�ng 3 nT to the observed value, �n order to compensate for movements of the magnetometers used �n determ�nat�on of the monthly aa value.15,16 The value of aaI = aa – aaR, where aaR = 6.3 + 0.0462 R, based on the scatter plot of monthly mean adjusted aa values versus R for the �nterval January 1868 – the present, th�s l�ne be�ng establ�shed by the aa and R po�nts for February 1880 and June 1999. It should be noted that a stronger relat�onsh�p between monthly mean adjusted aa and R would result �f a d�fferent b�nn�ng techn�que were employed.17)
1996 1998 2000 2002 2004 2006Year
aal
50
40
30
20
10
0
aal aa–aaR, aaR 6.3 0.0462R (Based on aa vs. R, January 1868–present)
E(aalm): September/October 1997 E(aalM): August 2003
aalm 8.3 aalM 28.9
E(aalm)
E(aalM)
F�gure 2. Var�at�on of the res�dual or follow�ng recurrent component aaI for the �nterval January 1996 –December 2006.
6
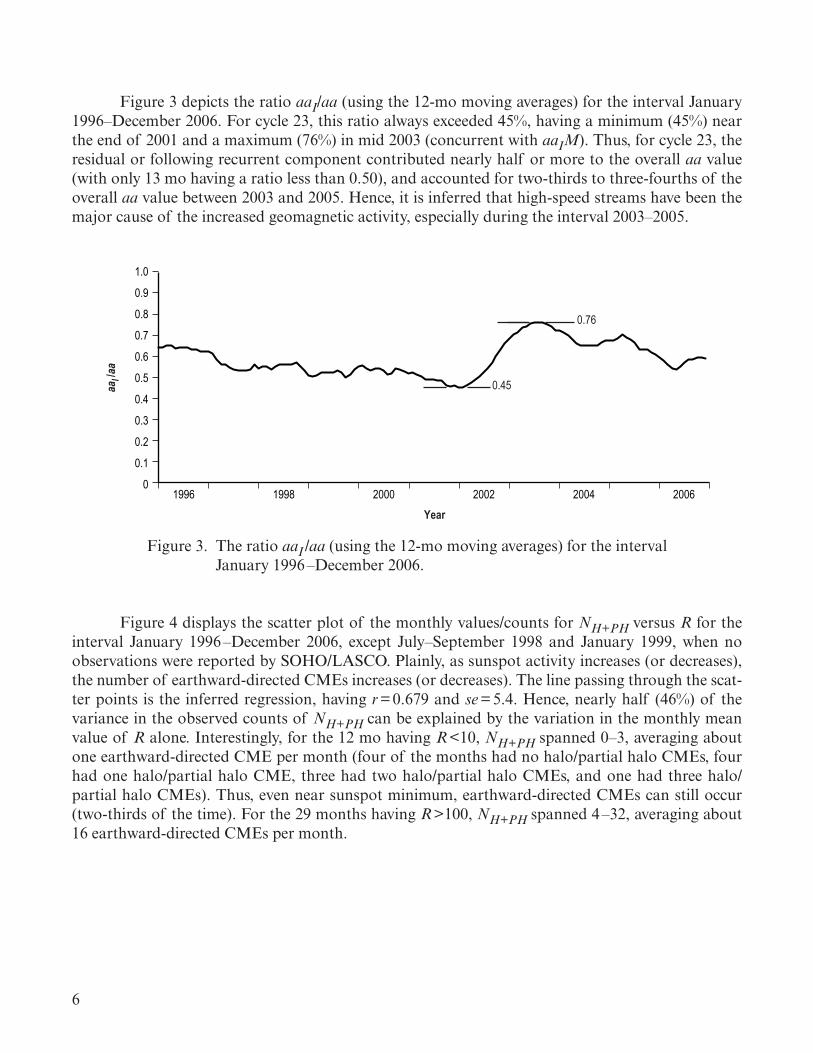
F�gure 3 dep�cts the rat�o aaI/aa (us�ng the 12-mo mov�ng averages) for the �nterval January 1996–December 2006. For cycle 23, th�s rat�o always exceeded 45%, hav�ng a m�n�mum (45%) near the end of 2001 and a max�mum (76%) �n m�d 2003 (concurrent w�th aaIM). Thus, for cycle 23, the res�dual or follow�ng recurrent component contr�buted nearly half or more to the overall aa value (w�th only 13 mo hav�ng a rat�o less than 0.50), and accounted for two-th�rds to three-fourths of the overall aa value between 2003 and 2005. Hence, �t �s �nferred that h�gh-speed streams have been the major cause of the �ncreased geomagnet�c act�v�ty, espec�ally dur�ng the �nterval 2003–2005.
1996 1998 2000 2002 2004 2006
Year
aal/
aa
0.45
0.76
1.0
0.9
0.8
0.7
0.6
0.5
0.4
0.3
0.2
0.1
0
F�gure 3. The rat�o aaI /aa (us�ng the 12-mo mov�ng averages) for the �nterval January 1996 –December 2006.
F�gure 4 d�splays the scatter plot of the monthly values/counts for NH+PH versus R for the �nterval January 1996 –December 2006, except July–September 1998 and January 1999, when no observat�ons were reported by SOHO/LASCO. Pla�nly, as sunspot act�v�ty �ncreases (or decreases), the number of earthward-d�rected CMEs �ncreases (or decreases). The l�ne pass�ng through the scat-ter po�nts �s the �nferred regress�on, hav�ng r = 0.679 and se = 5.4. Hence, nearly half (46%) of the var�ance �n the observed counts of NH+PH can be expla�ned by the var�at�on �n the monthly mean value of R alone. Interest�ngly, for the 12 mo hav�ng R <10, NH+PH spanned 0–3, averag�ng about one earthward-d�rected CME per month (four of the months had no halo/part�al halo CMEs, four had one halo/part�al halo CME, three had two halo/part�al halo CMEs, and one had three halo/part�al halo CMEs). Thus, even near sunspot m�n�mum, earthward-d�rected CMEs can st�ll occur (two-th�rds of the t�me). For the 29 months hav�ng R >100, NH+PH spanned 4 –32, averag�ng about 16 earthward-d�rected CMEs per month.

7
January 1996–December 2006 (except July–September 1998 and January 1999)(n 128)
Observed Values
y
R
y 2.404 0.116xr 0.679, r 2 0.460se 5.410, cl 99.9%
NH
+PH
35
30
25
20
15
10
5
00 50 100 150 200
F�gure 4. Scatter plot of NH+PH versus R (January 1996 –December 2006).
Obv�ously, a compar�son of 12-mo mov�ng averages for the var�ous parameters plotted �n figures 1 and 2 should reveal close assoc�at�ons between aaI, aa, and v and between NH+PH and R. Table 1 shows the results of correlat�on analys�s. Indeed, the results are h�ghly s�gn�ficant stat�st�cally. The �nferred regress�on between v and aaI �s g�ven by v = 344.4 + 7.335 aaI, hav�ng r = 0.931 (�nferr�ng that nearly 87% of the var�ance �n v can be expla�ned s�mply by the var�at�on �n aaI alone, or v�ce versa). Almost as strong �s the �nferred regress�on between v and aa; that �s, the comb�ned sporad�c and recurrent components. Its �nferred relat�onsh�p �s g�ven by v = 294.1 + 6.599 aa, hav�ng r = 0.916 (�nferr�ng that about 84% of the var�ance �n v can be s�mply expla�ned by the var�at�on �n aa alone, or v�ce versa). The �nferred regress�on between NH+PH and R �s g�ven by 3.4 + 0.107 R, hav�ng r = 0.870 (�nferr�ng that more than 75% of the var�ance �n NH+PH can be s�mply expla�ned by the var�at�on �n R alone, or v�ce versa). The �nferred regress�ons between NH+PH and aa, v, or aaI are cons�derably weaker and can only expla�n, respect�vely, about 11, 4, and 3% of the var�ance, or v�ce versa. The �nferred regress�on between v and R can only expla�n about 3% of the var�ance, or v�ce versa. Thus, solar w�nd speed �s strongly assoc�ated w�th the aa geomagnet�c �ndex, part�cularly the follow�ng recurrent component aaI, and the number of earthward-d�rected CMEs �s strongly assoc�ated w�th sunspot number R.

8
Table 1. Correlat�ve results based on smoothed values (1996 –2006).
Regression r se cl n
aaI = –5.9 + 0.857 aav = 344.4 + 7.335 aaIv = 294.1 + 6.599 aaN(H + PH) = 3.4 + 0.107 RN(H + PH) = 3.3 + 0.302 aaN(H + PH) = –1.2 + 0.026 vv = 431.9 + 0.176 RN(H + PH) = 6.1 + 0.411 aaI
0.9380.9310.9160.8700.3360.2050.1840.177
1.613.515.1
2.54.74.7
36.811.9
>>99.9>>99.9>>99.9>>99.9
>99.9>95>95<95
132132132101101101132101
F�gure 5 compares the var�at�on of 12-mo mov�ng averages of (a) aa, (b) v and (c) percent coverage of solar w�nd observat�ons for the �nterval 1964 –2006. Ident�fied �n the figure are the occur-rences of Rm and RM for cycles 20–23. As prev�ously noted, the �nferred regress�on between v and aa �s extremely well correlated for the �nterval 1996 –2006. For the ent�re �nterval 1964 –2006, the �nferred regress�on, wh�le rema�n�ng qu�te strong, �s observed to be sl�ghtly weaker (r �s reduced from 0.916 to 0.734 and se �ncreased from 15.1 to 24.0), obv�ously due to the poor coverage of solar w�nd speed pr�or to 1995. Even so, there �s extremely close correlat�on between the parameters, w�th the general behav�or of bumps and d�ps occurr�ng s�multaneously �n both data sets. (Because of the strong correlat�on between aaI and aa, a s�m�lar plot (not shown) �s found compar�ng v and aaI.)
1965 1970 1975 1980
Year
1985 1990 1995 2000 2005
1965 1970 1975 1980 1985 1990 1995 2000 2005
1965 1970 1975 1980 1985 1990 1995 2000 2005Cov
erag
e (%
)v
aa
(a)
(b)
(c)
v 294.075 6.599 aar 0.916, r 2 0.839se 15.1, cl 99.9%
v 324.590 5.231 aar 0.734, r 2 0.539se 24.0, cl 99.9%
v vs aa1996–2006(n 132)
1965–2006(n 472)
10050
0
600
500
400
300
40
20
0
E(Rm)20 E(RM)20 E(RM)21 E(RM)23E(RM)22E(Rm)21 E(Rm)23E(Rm)22
E(Rm)20 E(RM)20 E(RM)21 E(RM)23E(RM)22E(Rm)21 E(Rm)23E(Rm)22
F�gure 5. Var�at�on of (a) aa, (b) v, and (c) coverage for the �nterval January 1964 –December 2006.
9
2.2 Cyclic and predictive Aspects of the Sunspot/Geomagnetic Record (1868 –2006)
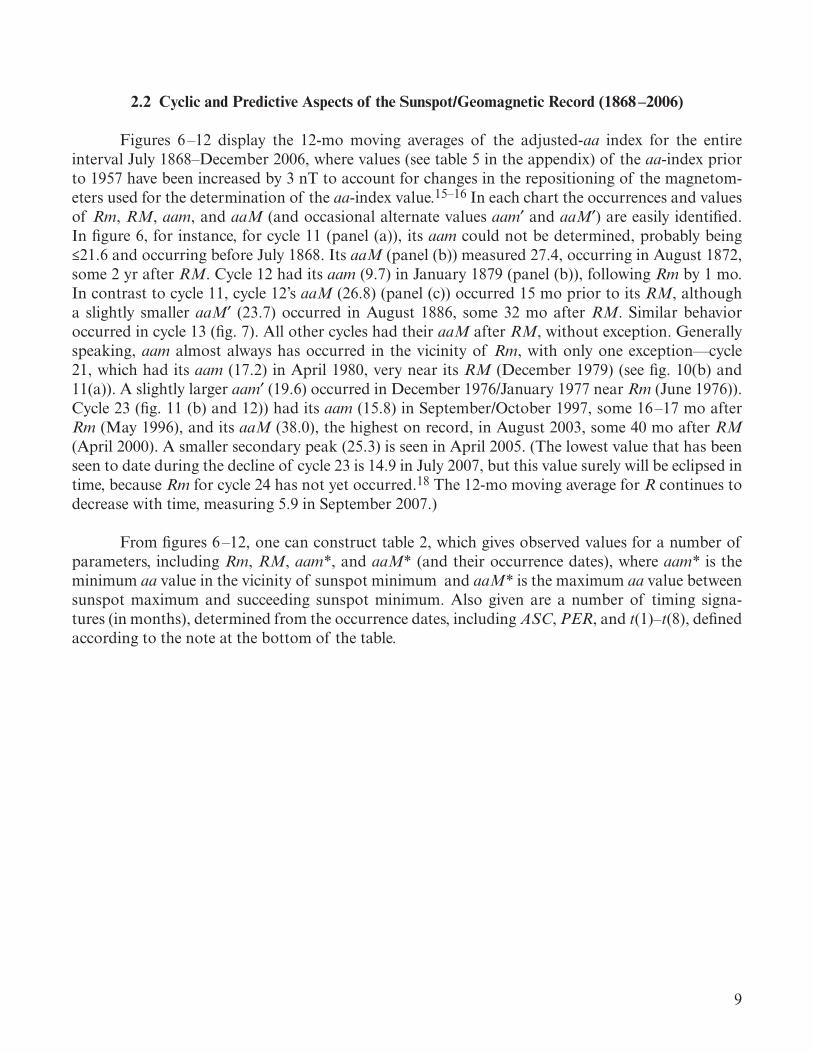
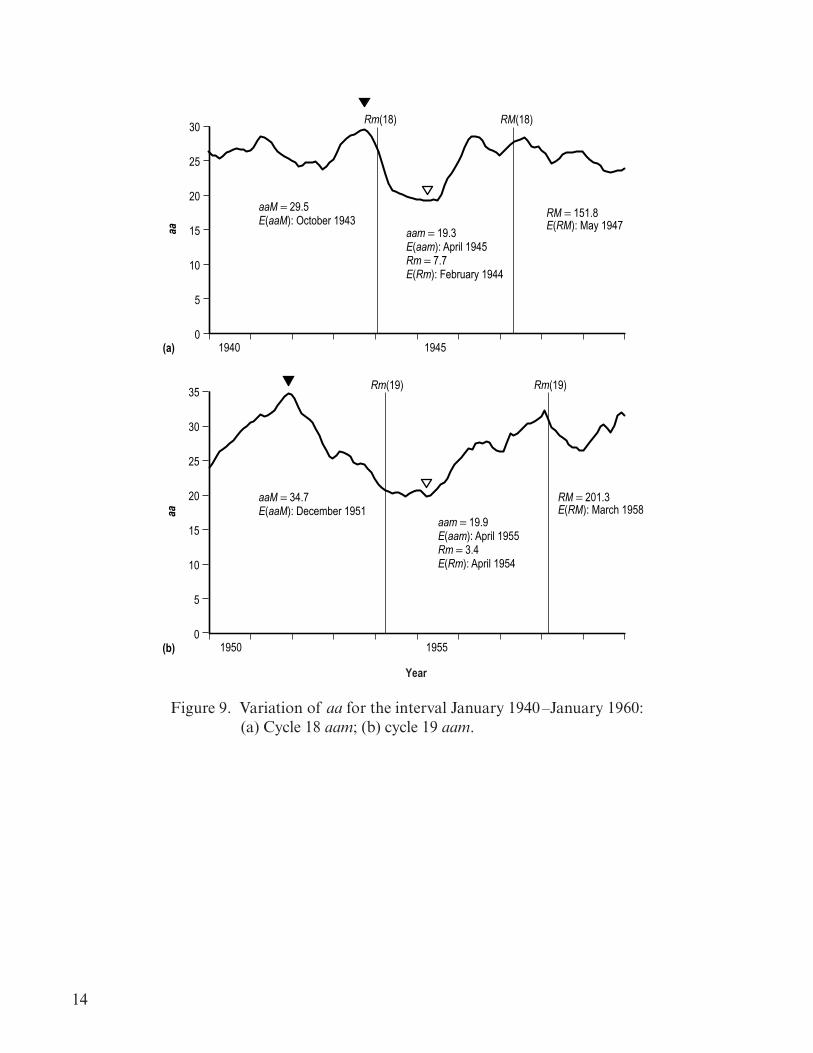
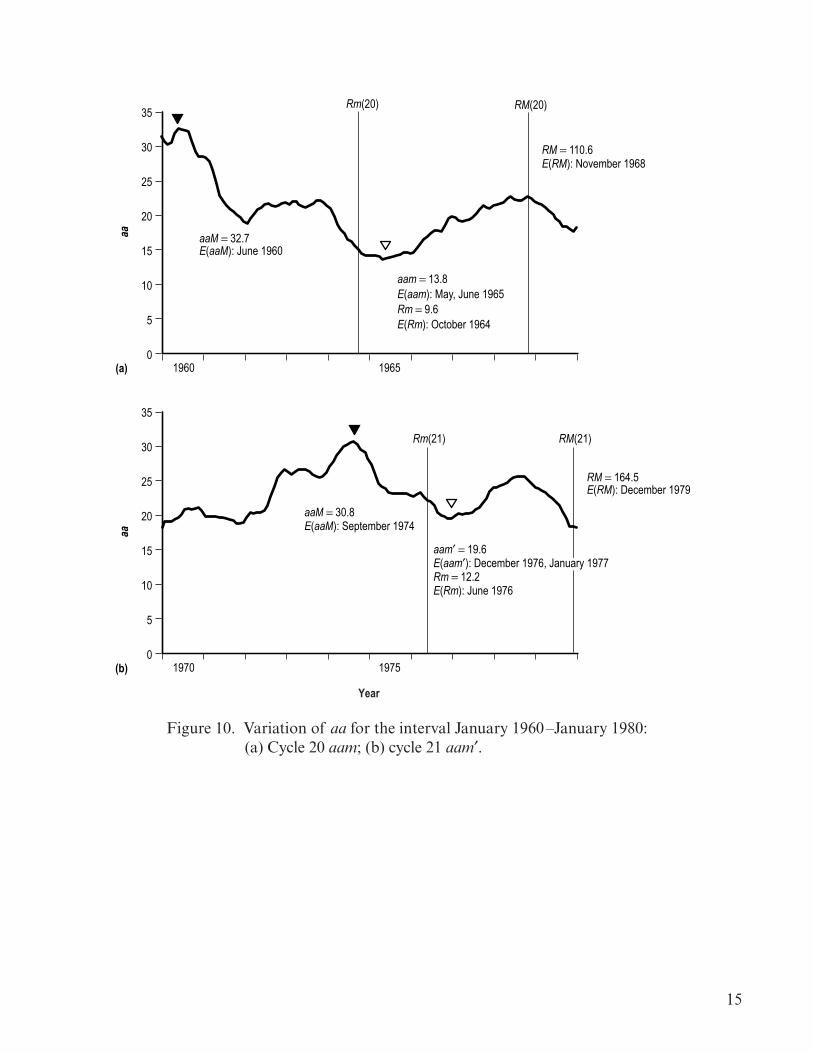
F�gures 6 –12 d�splay the 12-mo mov�ng averages of the adjusted-aa �ndex for the ent�re �nterval July 1868–December 2006, where values (see table 5 �n the append�x) of the aa-�ndex pr�or to 1957 have been �ncreased by 3 nT to account for changes �n the repos�t�on�ng of the magnetom-eters used for the determ�nat�on of the aa-�ndex value.15–16 In each chart the occurrences and values of Rm, RM, aam, and aaM (and occas�onal alternate values aam′ and aaM′) are eas�ly �dent�fied. In figure 6, for �nstance, for cycle 11 (panel (a)), �ts aam could not be determ�ned, probably be�ng ≤21.6 and occurr�ng before July 1868. Its aaM (panel (b)) measured 27.4, occurr�ng �n August 1872, some 2 yr after RM. Cycle 12 had �ts aam (9.7) �n January 1879 (panel (b)), follow�ng Rm by 1 mo. In contrast to cycle 11, cycle 12’s aaM (26.8) (panel (c)) occurred 15 mo pr�or to �ts RM, although a sl�ghtly smaller aaM′ (23.7) occurred �n August 1886, some 32 mo after RM. S�m�lar behav�or occurred �n cycle 13 (fig. 7). All other cycles had the�r aaM after RM, w�thout except�on. Generally speak�ng, aam almost always has occurred �n the v�c�n�ty of Rm, w�th only one except�on—cycle 21, wh�ch had �ts aam (17.2) �n Apr�l 1980, very near �ts RM (December 1979) (see fig. 10(b) and 11(a)). A sl�ghtly larger aam′ (19.6) occurred �n December 1976/January 1977 near Rm (June 1976)). Cycle 23 (fig. 11 (b) and 12)) had �ts aam (15.8) �n September/October 1997, some 16 –17 mo after Rm (May 1996), and �ts aaM (38.0), the h�ghest on record, �n August 2003, some 40 mo after RM (Apr�l 2000). A smaller secondary peak (25.3) �s seen �n Apr�l 2005. (The lowest value that has been seen to date dur�ng the decl�ne of cycle 23 �s 14.9 �n July 2007, but th�s value surely w�ll be ecl�psed �n t�me, because Rm for cycle 24 has not yet occurred.18 The 12-mo mov�ng average for R cont�nues to decrease w�th t�me, measur�ng 5.9 �n September 2007.)
From figures 6 –12, one can construct table 2, wh�ch g�ves observed values for a number of parameters, �nclud�ng Rm, RM, aam*, and aaM* (and the�r occurrence dates), where aam* �s the m�n�mum aa value �n the v�c�n�ty of sunspot m�n�mum and aaM* �s the max�mum aa value between sunspot max�mum and succeed�ng sunspot m�n�mum. Also g�ven are a number of t�m�ng s�gna-tures (�n months), determ�ned from the occurrence dates, �nclud�ng ASC, PER, and t(1)–t(8), defined accord�ng to the note at the bottom of the table.

10
Table 2. Selected parametr�c values (cycles 11–23).
Cycle Rm E(Rm) RM E(RM) aam* E(aam*) aaM* E(aaM*) ASC PER t(1) t(2) t(3) t(4) t(5) t(6) t(7) t(8)
11121314151617181920212223
5.22.25.02.61.55.63.47.73.49.6
12.212.38.0
03-186712-187803-189001-190208-191308-192309-193302-194404-195410-196406-197609-198605-1996
140.574.687.964.2
105.478.1
119.2151.8201.3110.6164.5158.5120.8
08-187012-188301-189402-190608-191704-192804-193705-194703-195811-196812-197907-198904-2000
–9.7
13.68.9
11.212.416.219.319.913.819.617.515.8
–01-187908-189009-190109-191310-192406-193404-194504-195506-196501-197701-198710-1997
27.423.723.922.227.432.029.534.732.730.834.636.738.0
08-187208-188606-189401-191112-191805-193010-194312-195106-196009-197412-198209-199108-2003
41604649485643394749423447
141135142139120121125122126140123116–
24325
59162578552770362640
764391315640
42852214556–
16894
19995
13716198
10217199
105143
–
774887327049184060284973–
1018092918674969587988599–
–15
–41
149
1412
874
17
–594153474234253541353030
–139133144133116130120122139120129
–
Note: aam* is the minimum value of aa in the vicinity of E(Rm). Cycle 21 actually had a later occurring aam = 17.2 at 04-1980. aaM* is the maximum value of aa between E(RM) for cycle n and E(Rm) for cycle n+1. Cycle 12 and 13 actually had higher aaM values before E(RM) equal to 26.8 at 09-1882 and 27.1 at 07-1892, respectively. The aam* value for cycle 14 is the last occurrence of 8.9; the same value was observed at 12-1900, 05- and 08-1901. The aam* value for cycle 15 is the last occurrence of 11.2; the same value was observed was observed at 08-1913. The aam* value for cycle 16 is the last occurrence of 12.4; the same value was observed at 09-1924. The aaM* value for cycle 16 is the last occurrence of 32.0; the same value was observed at 04-1930. The aam* value for cycle 20 is the last occurrence of 13.8; the same value was observed at 05-1965. The aam* value for cycle 21 is the last occurrence of 19.6; the same value was observed at 12-1976. The aam* value for cycle 22 is the last occurrence of 17.5; the same value was observed at 12-1986. The aam* value for cycle 23 is the last occurrence of 15.8; the same value was observed at 09-1997. The lowest value of aa observed during the decline of cycle 23 is 15.5 at 04-2006. ASC is the ascent duration in months from E(Rm) to E(RM). PER is the cycle duration or period (in mo) between E(Rm) cycle n and E(Rm) cycle n+1. The PER for cycle 23 is presently unknown, but will be longer than 131 mo (R = 9.9 at 04-2007). t(1) is the time in months between E(RM) and E(aaM*). t(2) is the time in months between E(aaM*) and the following cycle’s E(Rm). t(3) is the time in months between E(aaM*) cycle n and E(aaM*) cycle n+1. t(4) is the time in months between E(aaM*) cycle n and E(aam*) cycle n+1. t(5) is the time in months between E(RM) cycle n and E(aam*) cycle n+1. t(6) is the time in months between E(Rm) and E(aam*). t(7) is the time in months between E(aam*) and E(RM). t(8) is the time between E(aam*) cycle n and E(aam*) cycle n+1. For cycle 23, t(8) is presently unknown, but will be longer than 114 months.

11
1860
aam ≤ 21.6E(aam): Before July 1868Rm = 5.2E(Rm): March 1867
1865
Year
Rm(11)
1870
aaM = 27.4E(aaM): August 1872RM = 140.5E(RM): August 1870
aaM´ = 23.7E(aaM´): August 1886
1875
RM(11) Rm(12)
1880
aaM = 26.8E(aaM): September 1882RM = 74.6E(RM): December 1883
aam = 9.7E(aam): January 1879Rm = 2.2E(Rm): December 1878
1885
RM(12)
(a)
(b)
(c)
30
25
20
15
10
5
0
aa
30
25
20
15
10
5
0
aa
30
25
20
15
10
5
0
aa
F�gure 6. Var�at�on of aa for the �nterval July 1868 –January 1890: (a) Cycle 11 aam; (b) cycle 12 aam; (c) cycle 12 aaM.

12
1890 1895
Year
1900 1905
Rm(14) RM(14)
1910 1915
(a)
(b)
(c)
30
25
20
15
10
5
0
aa
30
25
20
15
10
5
0
aa
30
25
20
15
10
5
0
aa
aam 13.6E(aam): July 1890Rm 5.0E(Rm): March 1890
aaM 27.1E(aaM): July 1892RM 87.9E(RM): January 1894
aaM´ 23.9E(aaM´): June 1894
RM(13)Rm(13)
aam 8.9E(aam): December 1900; May, August, September 1901Rm 2.6E(Rm): January 1902
aaM 27.4E(aaM): December 1918RM 105.4E(RM): August 1917
aaM 22.2E(aaM): January 1911
RM = 64.2E(RM): February 1906
aam 11.2E(aam): August, September 1913Rm 1.5E(Rm): August 1913
RM(15)Rm(15)
F�gure 7. Var�at�on of aa for the �nterval January 1890 –January 1920: (a) Cycle 13 aam; (b) cycle 14 aam; (c) cycle 15 aam and aaM.

13
1920
aam = 12.4E(aam): September, October 1924Rm = 5.6E(Rm): August 1923
RM = 78.1E(RM): April 1928
1925
1930 1935
Year
RM(16)
RM = 119.2E(RM): April 1937
Rm(16)
aam = 16.2E(aam): June 1934Rm = 3.4E(Rm): September 1933
Rm(17)
aaM = 32.0E(aaM): April, May 1930
RM(17)
(a)
(b)
30
25
20
15
10
5
0
aa
35
30
25
20
15
10
5
0
aa
F�gure 8. Var�at�on of aa for the �nterval January 1920 –January 1940: (a) Cycle 16 aam; (b) cycle 17 aam.
14
aam 19.3E(aam): April 1945Rm 7.7E(Rm): February 1944
RM 151.8E(RM): May 1947
aaM 29.5E(aaM): October 1943
RM(18)
RM 201.3E(RM): March 1958
Rm(18)
aam 19.9E(aam): April 1955Rm 3.4E(Rm): April 1954
Rm(19)
aaM 34.7E(aaM): December 1951
Rm(19)
1940 1945
1950 1955
Year
(a)
(b)
30
25
20
15
10
5
0
aa
35
30
25
20
15
10
5
0
aa
F�gure 9. Var�at�on of aa for the �nterval January 1940 –January 1960: (a) Cycle 18 aam; (b) cycle 19 aam.
15
aam 13.8E(aam): May, June 1965Rm 9.6E(Rm): October 1964
RM 110.6E(RM): November 1968
Rm(20)
aaM 32.7E(aaM): June 1960
RM(20)
RM(21)
aam 19.6
Rm 12.2E(Rm): June 1976
Rm(21)
aaM 30.8E(aaM): September 1974
RM 164.5E(RM): December 1979
E(aam ): December 1976, January 1977
1970 1975
Year
(a)
(b)
35
30
25
20
15
10
5
0
aa
1960 1965
35
30
25
20
15
10
5
0
aa
F�gure 10. Var�at�on of aa for the �nterval January 1960 –January 1980: (a) Cycle 20 aam; (b) cycle 21 aam′.

16
aaM 34.6E(aaM): November, December 1982
aam 17.5E(aam): December 1986, January 1987Rm 12.3E(Rm): September 1986
RM 158.5E(RM): July 1989
Rm(22)
aam 17.2E(aam): April 1980
RM(22)
aam 15.8E(aam): September, October 1997Rm 8.0E(Rm): May 1996
Rm(23)
aaM 36.7E(aaM): September 1991
1990 1995
Year
(a)
(b)
40
35
30
25
20
15
10
5
0
aa
1980 1985
35
30
25
20
15
10
5
0
aa
F�gure 11. Var�at�on of aa for the �nterval January 1980 –January 2000: (a) Cycle 22 aam; (b) cycle 23 aam.
17
RM(23)
aaM 38.0E(aaM): August 2003
RM 120.8E(RM): April 2000
2000 2005
Year
40
35
30
25
20
15
10
5
0
aa
F�gure 12. Var�at�on of aa for the �nterval January 2000 –January 2007.
F�gures 13 and 14 prov�de a v�sual dep�ct�on of the parametr�c and t�m�ng values g�ven for cycles 11–23 �n table 2. For each of the parameters and t�m�ng s�gnatures (except for PER), the med�an �s g�ven, as well as the means and standard dev�at�ons (�n parentheses) for selected group-�ngs of cycles (cycles 11–16, 17–23, and 11–23 and even- and odd-numbered cycles). Thus, for Rm and RM, the�r med�ans are, respect�vely, 5.2 and 119.2, and cycles of late (cycles 17–23) have had both h�gher Rm (8.1) and RM (146.7), on average, as compared to earl�er cycles (3.7 and 91.8, cycles 11–16). Also, odd-numbered cycles have averaged 5.5 and 134.2 for Rm and RM, respect�vely, as compared to 6.7 and 106.3 for even-numbered cycles. Because of the Waldme�er effect,19–23 a s�m�-lar �nverse behav�or �s seen �n ASC; namely, cycles of late (cycles 17–23), on average, have r�sen from m�n�mum to max�mum ampl�tude more qu�ckly (43 mo) than earl�er cycles (50 mo, cycles 11–16). ASC for odd-numbered cycles has averaged 44.9 mo, as compared to 47.8 mo for even-numbered cycles. The d�fferences �n means24 for the var�ous group�ngs are not stat�st�cally �mportant for RM or ASC, and runs test�ng25 suggests that the�r values are d�str�buted randomly. However, for Rm, although runs test�ng suggests a random d�str�but�on for �t, the d�fference �n means �s stat�st�cally �mportant for cycles of late as compared to earl�er cycles, and l�near correlat�on analys�s suggests a stat�st�cally �mportant �ncrease �n Rm w�th t�me, such that Rm (24)90 = 10.8 ± 4.7, �nferr�ng only a 5% probab�l�ty that cycle 24’s Rm w�ll exceed 15.5 or be smaller than 6.1. (Through September 2007, the 12-mo mov�ng average of R equals 5.9, �nferr�ng that the occurrence of Rm �s most �mm�nent.)

18
1510
10
15
50
5
020 25
1510 20 25
1510 20 25
1510 20 25
1510 20 25
1510 20 25
Sunspot Cycle Number
Rm(24)90 = 10.8 ± 4.7Rm
y = –5.435 + 0.676xr = 0.722, r 2 = 0.521se = 2.631, cl > 99%
median = 5.2
y
Note: R = 7.7 in June 2007
aam* (24)90 = 19.7 ± 5.1
y = 1.627 + 0.754xr = 0.710, r 2 = 0.504se = 2.841, cl > 99%
y = 10.615 + 1.157xr = 0.880, r 2 = 0.774se = 2.491, cl > 99.9%
100
200
150
RM
median = 119.2
30
40
60
50
ASC
PER
100
150
15
40
30
20
20
10
5
aam
*aa
M*
11–16: 131.2 (10.0)17–22: 125.3 (8.0)11–22: 129.2 (9.5)Even: 128.8 (10.4)Odd: 129.5 (9.5)
11–16: 26.1 (3.6)17–23: 33.9 (3.1)11–23: 30.3 (5.1)Even: 30.0 (5.9)Odd: 30.5 (4.9)
12–16: 11.2 (1.9)17–23: 17.4 (2.3)12–23: 14.8 (3.8)Even: 13.6 (4.2)Odd: 16.1 (3.4)
median = 30.8 nT
LP90 = 139.4 ± 5.8 months
SP90 = 121.9 ± 6.7 months
Period Gap
median = 47 months
median = 14.8 nT
Note: aa = 15.5 in April 2006
aaM* (24)90 = 38.4 ± 4.5
y
y
(a)
(b)
(c)
(d)
(e)
(f)
11–16: 3.7 (1.8)17–23: 8.1 (3.7)11–23: 6.1 (3.6)Even: 6.7 (4.0)Odd: 5.5 (3.6)
11–16: 91.8 (27.6)17–23: 146.7 (32.1)11–23: 121.3 (40.6)Even: 106.3 (41.0)Odd: 134.2 (38.4)
11–16: 50.0 (6.9)17–23: 43.0 (5.3)11–23: 46.2 (6.8)Even: 47.8 (9.9)Odd: 44.9 (2.8)
F�gure 13. Var�at�on of selected parametr�c values for cycles 11–23: (a) Rm; (b) RM; (c) ASC; (d) PER; (e) aam*; (f) aaM*. See text for deta�ls.

19
1510
40
0
80
20 25
1510 20 25
1510 20 25
1510 20 25
1510 20 25
1510 20 25
1510 20 25
1510 20 25Sunspot Cycle Number
t(1)
median = 32 months
median = 44 months
y
50
0
100
t(2)
median = 121 months
median = 49 months
median = 91.5 months
median = 7.5 months
median = 38 months
median = 130 months
100
200
150
t(3)
20
40
60
80
t(4)
100
–10
0
20
10
t(6)
t(7)
t(8)
80t(5)
60
40
20
0
100
160
140
120
t(7)(24)90
= 25.6 ± 12.2 months
y = 76.291 – 2.112xr = –0.765, r2 = 0.585se = 6.738, cl > 99.5%
(a)
(b)
(c)
(d)
(e)
(f)
(g)
(h)
11–16: 26.8 (18.3)17–23: 47.4 (20.7)11–23: 37.9 (21.6)Even: 44.5 (19.2)Odd: 32.3 (23.3)
11–16: 56.2 (23.1)17–22: 34.3 (20.2)11–22: 45.3 (23.6)Even: 36.5 (12.5)Odd: 54.0 (29.8)
11–16: 142.3 (42.0)17–22: 119.7 (30.3)11–22: 131.0 (36.9)Even: 115.7 (28.9)Odd: 146.3 (40.0)
11–16: 60.5 (20.8)17–22: 44.7 (20.3)11–22: 52.6 (21.3)Even: 45.0 (16.1)Odd: 60.2 (24.5)
11–16: 87.3 (9.5)17–22: 93.3 (5.9)11–22: 90.3 (8.2)
Even: 89.5 (10.3)Odd: 91.2 (6.4)
12–16: 3.4 (6.7)17–23: 10.1 (4.5)12–23: 7.3 (6.3)
Even: 6.2 (7.2)Odd: 8.5 (5.6)
12–16: 48.4 (7.6)17–23: 32.9 (5.1)12–23: 39.3 (10.0)
Even: 41.7 (13.0)Odd: 37.0 (6.0)
12-16: 133.0 (10.6)17-22: 126.7 (7.5)12-22: 129.5 (9.1)
Even: 131.2 (11.4)Odd: 127.6 (6.2)
F�gure 14. Var�at�on of selected t�m�ng s�gnature values for cycles 11–23: (a)–(h) are t(1)–t(8). See text for deta�ls.

20
For PER, on the bas�s of the 12-mo mov�ng average, cycles appear to be d�str�buted �nto long-per�od (LP) cycles, hav�ng a cycle durat�on exceed�ng 134 mo, and short-per�od (SP) cycles, hav-�ng a cycle durat�on less than 127 mo, w�th only a 5% probab�l�ty that an LP cycle w�ll have a cycle durat�on as short as 133 mo and an SP cycle w�ll have a cycle durat�on as long as 129 mo. The PER for cycle 23, although presently unknown, w�ll be longer than 134 mo, thus mak�ng �t an LP cycle. Through September 2007, cycle 23 has already pers�sted 136 mo, and through December 2007, there has yet to be an occurrence of a h�gh-lat�tude, new-cycle spot. Moreover, the number of spotless days has dramat�cally �ncreased,18,26,27 espec�ally �n September, October, and November 2007, these be�ng character�st�cs �nd�cat�ng the nearness of cycle m�n�mum. Wh�le there �s no real d�fference �n averages for PER between even- and odd-numbered cycles, PER for cycles of late has averaged 6 mo shorter �n durat�on as compared to the earl�er cycles. (Note added �n proof: A h�gh-lat�tude, new-cycle spot was finally reported �n January 2008, and a second h�gh-lat�tude, new-cycle spot was reported �n Apr�l 2008.)
For aam* and aaM*, cycles of late have averaged 17.4 and 33.9, respect�vely, as compared to 11.2 and 26.1 for the earl�er cycles, and the d�fference �n means �s found to be stat�st�cally �mpor-tant for both aam* and aaM*. Furthermore, l�near regress�on analys�s y�elds stat�st�cally �mportant regress�ons for both aam* and aaM* as well, so one can �nfer only a 5% probab�l�ty that cycle 24’s aam* w�ll be smaller than 14.6 or larger than 24.8, and only a 5% probab�l�ty that cycle 24’s aaM* w�ll be smaller than 33.9 or larger than 42.9. (The lowest value of the 12-mo mov�ng average of aa dur�ng the decl�ne of cycle 23 �s 14.9 �n July 2007.)
Concern�ng the t�m�ng s�gnatures (fig. 14), on average, the t�mes �n months between RM and aaM* (t(1)) are 47.4 and 26.8 mo for cycles 17–23 and 11–16, respect�vely, and 44.5 and 32.3 mo for even- and odd-numbered cycles, respect�vely. The t�mes �n months between aaM* and Rm (t(2)) are 34.3 and 56.2 mo for cycles 17–23 and 11–16, respect�vely, and 36.5 and 54.0 mo for even- and odd-numbered cycles, respect�vely. The t�mes �n months between aaM* (cycle n) and aaM* (cycle n+1) (t(3)) are 119.7 and 142.3 mo for cycles 17–23 and 11–16, respect�vely, and 115.7 and 146.3 mo for even- and odd-numbered cycles, respect�vely. The t�mes �n months between aaM* (cycle n) and aam* (cycle n+1) (t(4)) are 44.7 and 60.5 mo for cycles 17–23 and 11–16, respect�vely, and 45.0 and 60.2 months for even- and odd-numbered cycles, respect�vely. The t�mes �n months between RM (cycle n) and aam* (cycle n+1) (t(5)) are 93.3 and 87.3 mo for cycles 17–23 and 11–16, respect�vely, and 89.5 and 91.2 mo for even- and odd-numbered cycles, respect�vely. The t�mes �n months between Rm and aam* (t(6)) are 10.1 and 3.4 mo for cycles 17–23 and 11–16, respect�vely, and 6.2 and 8.5 mo for even- and odd-numbered cycles, respect�vely. The t�mes �n months between aam* and RM (t(7)) are 32.9 and 48.4 mo for cycles 17–23 and 11–16, respect�vely, and 41.7 and 37.0 mo for even- and odd-numbered cycles, respect�vely. The t�mes �n months between aam* (cycle n) and aam* (cycle n+1) (t(8)) are 126.7 and 133.0 mo for cycles 17–23 and 11–16, respect�vely, and 131.2 and 127.6 mo for even- and odd-numbered cycles, respect�vely. Of the var�ous t�m�ng s�gnatures, the only stat�st�-cally �mportant d�fference �n means �s the one for t(7), the t�me between aam* and RM, compar�ng cycles of late w�th earl�er cycles. L�near correlat�on analys�s of t(7) suggests a stat�st�cally �mportant decrease w�th t�me of t(7), such that t(7)90 = 25.6 ± 12.2 mo for cycle 24, �nferr�ng only a 5% probab�l-�ty that RM w�ll follow cycle 24’s aam* by more than about 38 mo or less than about 13 mo.
From figure 13, stat�st�cally �mportant upward trends are strongly suggested for Rm, aam*, and aaM*. It should be ment�oned that a marg�nally s�gn�ficant upward trend �s h�nted for RM as
21
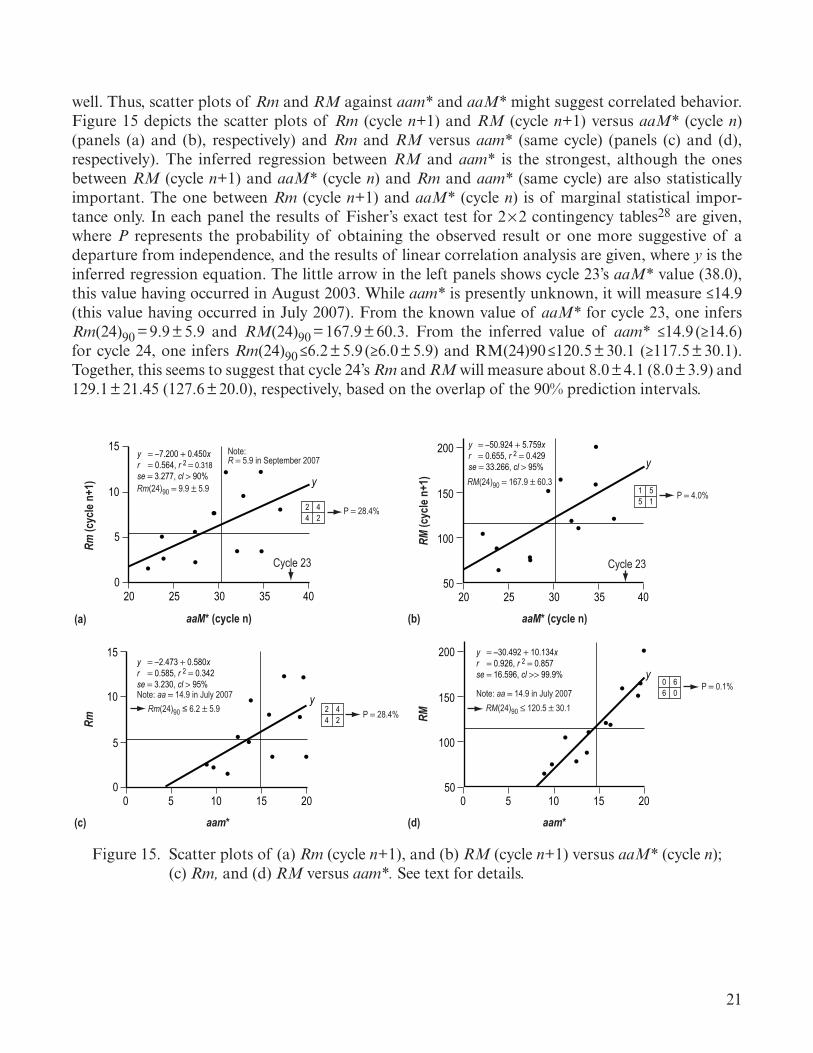
well. Thus, scatter plots of Rm and RM aga�nst aam* and aaM* m�ght suggest correlated behav�or. F�gure 15 dep�cts the scatter plots of Rm (cycle n+1) and RM (cycle n+1) versus aaM* (cycle n) (panels (a) and (b), respect�vely) and Rm and RM versus aam* (same cycle) (panels (c) and (d), respect�vely). The �nferred regress�on between RM and aam* �s the strongest, although the ones between RM (cycle n+1) and aaM* (cycle n) and Rm and aam* (same cycle) are also stat�st�cally �mportant. The one between Rm (cycle n+1) and aaM* (cycle n) �s of marg�nal stat�st�cal �mpor-tance only. In each panel the results of F�sher’s exact test for 2 × 2 cont�ngency tables28 are g�ven, where P represents the probab�l�ty of obta�n�ng the observed result or one more suggest�ve of a departure from �ndependence, and the results of l�near correlat�on analys�s are g�ven, where y �s the �nferred regress�on equat�on. The l�ttle arrow �n the left panels shows cycle 23’s aaM* value (38.0), th�s value hav�ng occurred �n August 2003. Wh�le aam* �s presently unknown, �t w�ll measure ≤14.9 (th�s value hav�ng occurred �n July 2007). From the known value of aaM* for cycle 23, one �nfers Rm(24)90 = 9.9 ± 5.9 and RM(24)90 = 167.9 ± 60.3. From the �nferred value of aam* ≤14.9 (≥14.6) for cycle 24, one �nfers Rm(24)90 ≤6.2 ± 5.9 (≥6.0 ± 5.9) and RM(24)90 ≤120.5 ± 30.1 (≥117.5 ± 30.1). Together, th�s seems to suggest that cycle 24’s Rm and RM w�ll measure about 8.0 ± 4.1 (8.0 ± 3.9) and 129.1 ± 21.45 (127.6 ± 20.0), respect�vely, based on the overlap of the 90% pred�ct�on �ntervals.
2520
5
0
2 44 2
10
15
30 35 40 2520 30 35 40
50 10 15 2050 10 15 20
aaM* (cycle n)aaM* (cycle n)
Cycle 23
P 28.4%
Rm
(cyc
le n
+1)
y –7.200 0.450xr 0.564, r 2 0.318se 3.277, cl 90%Rm(24)90 9.9 5.9
Note:R 5.9 in September 2007
y
2 44 2
aam*aam*
P 28.4%
Rm
y –2.473 0.580xr 0.585, r 2 0.342se 3.230, cl 95%
Rm(24)90 ≤ 6.2 5.9
Note: aa 14.9 in July 2007 y
100
50
1 55 1
150
200
5
0
10
15
100
50
150
200
Cycle 23
P 4.0%
RM
(cyc
le n
+1)
y –50.924 5.759xr 0.655, r 2 0.429se 33.266, cl 95%
RM(24)90 167.9 60.3
y
0 66 0
P 0.1%
RM
y –30.492 10.134xr 0.926, r 2 0.857se 16.596, cl 99.9%
RM(24)90 120.5 30.1
Note: aa 14.9 in July 2007
y
(a) (b)
(c) (d)
F�gure 15. Scatter plots of (a) Rm (cycle n+1), and (b) RM (cycle n+1) versus aaM* (cycle n); (c) Rm, and (d) RM versus aam*. See text for deta�ls.

22
F�gure 16 plots observed values of RM versus pred�cted values of RM, based on spec�fic b�var�ate fits,29 and also observed values of Rm versus pred�cted values of Rm, based on a spe-c�fic b�var�ate fit. The l�nes pass�ng through the data po�nts are the 1:1 l�nes. For RM (Observed, cycle n+1) versus the aaM* (cycle n) and aam* (cycle n+1) (panel (a)), RM (Pred�cted) = –38.314 + 0.456 aaM* + 9.750 aam*, r = 0.927, and se = 17.4. Us�ng aaM*(23) = 38.0 and aam*(24) ≤14.9 y�elds RM(24)90 ≤124.3 ± 31.9 (or ≥121.4 ± 30.1 based on aaM* = 38.0 and aam* ≥14.6), essent�ally the same as us�ng the s�ngle-var�ate fit between RM and aam* (see fig. 15, panel (d), ≤120.5 ± 30.1 and ≥117.5 ± 30.1, respect�vely). Hence, there appears to be no mean�ngful �mprovement �n the pred�ct�on of cycle 24’s RM when us�ng both aaM* (cycle n) and aam* (cycle n+1) as compared to just us�ng aam* (cycle n+1) alone.
100
100
0
0
200
200
RM (Predicted)aam*, Rm
Rm (Predicted)aaM*, aam*
RM (Predicted)aaM*, aam*
RM (Predicted)aaM*, Rm
RM
(Obs
erve
d)
100
0
200
RM
(Obs
erve
d)
100
0
200
RM
(Obs
erve
d)
50
0100 2000
100 2000
5
10
15
10 15
Rm
(Obs
erve
d)
(a) (b)
(c) (d)
F�gure 16. Scatter plots (a)–(c) of observed values of RM versus pred�cted values of RM, based on spec�fic b�var�ate fits, and observed values (d) of Rm versus pred�cted values of Rm, based on a spec�fic b�var�ate fit. See text for deta�ls.

23
S�m�larly, the b�var�ate fit for RM (cycle n+1) based on aaM* (cycle n) and Rm (cycle n+1) �s RM (Pred�cted) = –40.351 + 1.483 Rm + 5.096 aaM*, hav�ng r = 0.664 and se = 34.654. Us�ng aaM* = 38.0 and Rm ≤5.9 y�elds RM(24)90 ≤162.0 ± 62.2., wh�ch �s essent�ally the same as us�ng the s�ngle-var�ate fit between RM and aaM* alone (see fig. 15, panel (b), = 167.9 ± 60.3).
L�kew�se, the b�var�ate fit of RM based on Rm and aam* (all for the same cycle) �s RM (Pre-d�cted) = –33.854 – 1.354 Rm + 10.920 aam*, hav�ng r = 0.931 and se = 16.886. Us�ng aam* ≤14.9 and Rm ≤5.9 y�elds RM(24)90 ≤120.9 ± 30.6, wh�ch �s essent�ally the same as us�ng the s�ngle-var�ate fit between RM and aam* alone (see fig. 15, panel (d), ≤120.5 ± 30.1). Us�ng aam* ≥14.6 and Rm ≤5.9 y�elds RM(24)90 ≈ 117.6 ± 30.6.
The b�var�ate fit of Rm (cycle n+1) based on aaM* (cycle n) and aam* (cycle n+1) �s Rm (Pred�cted) = –6.709 + 0.247 aaM* + 0.372 aam*, hav�ng r = 0.628 and se = 3.267. Us�ng aaM* = 38.0 and aam* ≤14.9 y�elds Rm(24)90 ≤8.2 ± 5.9 (or ≥8.1 ± 5.9, us�ng aaM* = 38.0 and aam* ≥14.6), wh�ch �s essent�ally the same as us�ng the s�ngle-var�ate fits between Rm and aaM* (see fig. 15, panel (a), 9.9 ± 5.9) or between Rm and aam* (see fig. 15, panel (c), ≤6.2 ± 5.9).
Wh�le the b�var�ate fits have sl�ghtly h�gher coeffic�ents of correlat�on than the s�ngle-var�ate fits, they do not appear to prov�de any mean�ngful �ncrease �n prec�s�on for the pred�ct�on of Rm or RM. Of the var�ous fits, the one between RM and aam* has prov�ded the greatest pred�ct�ve ab�l-�ty (essent�ally, th�s �s Ohl’s method).30 Therefore, s�nce aam* �s dest�ned to be ≤14.9 (and probably ≥14.6), �t appears h�ghly l�kely that cycle 24 w�ll not be as large as prev�ously pred�cted,16,31,32 based solely on aaM*. There appears to be only a 5% chance that cycle 24’s RM w�ll be greater than 150.6. If aam* �s presumed to be equal to 14.6 (the lowest expected value based on the 90% pred�ct�on �nterval of aam* versus sunspot cycle number, see fig. 13, panel (e), aam*(24)90 = 19.7 ± 5.1), then RM(24)90 = 117.5 ± 30.1, �nferr�ng only a 5% chance that RM would exceed 147.6.
24
3. SUMMARY
For cycle 23 (1996–2006), an odd-numbered cycle, the max�mum of geomagnet�c act�v�ty (aaM) follows max�mum sunspot ampl�tude (RM) by 40 mo (3.3 yr), co�nc�d�ng w�th the max�mum �n solar w�nd speed (vM) and not the max�mum �n earthward-d�rected CMEs (NH+PHM, the num-ber of halo and part�al halo events). Such a find�ng �s �n contrast to that noted by Ch�rkov, whose earl�er stud�es suggested that odd-numbered cycles had geomagnet�c peaks about 1.5 –2 yr after sun-spot max�mum. The observed aaM �s the h�ghest ever recorded, and the rat�o of aaM to aam �s 2.4, wh�ch �nd�cates a 140% �ncrease �n geomagnet�c act�v�ty from aam to aaM. Th�s �s also �n contrast to that found by Ch�rkov, who prev�ously had noted that odd-numbered cycles had a smaller range of var�at�on (max�mum to m�n�mum) as compared to even-numbered cycles, typ�cally 60–80%. The s�multaneous peak�ng of aaM and vM some 40 mo after Rmax also �s �n contrast to that reported by Rangarajan and Barreto, who stated that solar w�nd speed max�m�zes about 22 mo after solar max�-mum. Correlat�on analys�s suggests strong correlat�on between aa (and aaI, the follow�ng recurrent component) and v, hav�ng an r equal to about 0.92, and between the number of halo and part�al halo CMEs and sunspot number, hav�ng an r equal to about 0.87.
Stat�st�cally �mportant r�ses have occurred between cycles 11 and 23 �n Rm, aam*, and aaM*, such that for cycle 24 the 90% pred�ct�on �ntervals are, respect�vely, 10.8 ± 4.7, 19.7 ± 5.1, and 38.4 ± 4.5, �nferr�ng only a 5% probab�l�ty that Rm(24) ≤6.1 (R measures 5.9 �n September 2007), aam*(24) ≤14.6 (the lowest value of aa that has been seen dur�ng the decl�ne of cycle 23 measures 14.9 �n July 2007) and aaM*(24) ≤33.9. Of the var�ous t�m�ng s�gnatures that were exam�ned, only t(7), the t�me between E(aam*) and E(RM), has shown a stat�st�cally �mportant downward trend. Th�s suggests t(7) = 26 ± 12 mo for cycle 24 and one �nfers that once E(aam*) has been seen (wh�ch usually follows E(Rm) by about 7 mo), RM should follow w�th�n 38 mo, w�th 95% confidence.
Stat�st�cally �mportant correlat�ons are found between RM(cycle n + 1) and aaM*(cycle n) and between RM(cycle n) and aam*(cycle n), the latter be�ng the stronger (r = 0.93 as compared to r = 0.66). S�nce aaM* �s known for cycle 23 (38.0, August 2003), one est�mates RM(24) = 168 ± 60. The value of aam* l�kely w�ll be ≤14.9 (the lowest value of aa that has been seen thus far dur�ng the decl�ne of cycle 23) and very probably ≥14.6 (from above), so that RM(24) l�kely w�ll be ≥117.5 ± 30.1. Based on the overlap, RM(24) should measure about 128 ± 20.

25
AppENDIx
Table 3. SOHO/LASCO/CME counts.
Date (Yr-Mo) NCME NH NPH NH + NPH
LASCO Downtime (Minutes)
Coverage(%)
1996-010203040506070809101112
661818148231819192433
000100010011
000000140213
000100150224
13,23024,52529,42626,36613,203
3,5867,7313,7461,312
9768,6172,266
70.441.334.139.070.491.782.791.697.097.880.194.9
1997-010203040506070809101112
182218263634312644405036
110310112241
012212001443
122522113684
4,162240
2,8823,250
370179913496
4,702398
3,1413,902
90.799.493.592.599.299.698.098.989.199.192.791.3
1998-010203040506070809101112
62857987
106118
---
347957
412334---372
13331110---161
54561414---4133
1,023667
4,1002,047
6799,549
44,64044,64043,20030,13417,17719,626
97.798.390.895.398.577.9
0.00.00.0
32.560.256.0
26
Table 3. SOHO/LASCO/CME counts (Cont�nued).
Date (Yr-Mo) NCME NH NPH NH + NPH
LASCO Downtime (Minutes)
Coverage(%)
1999-010203040506070809101112
-46918394112132113104848265
-0013
13301105
-648
1213191912847
-64915262219139412
44,64019,061
6,4392,8923,4765,5541,4399,6407,7408,665
12,2709,747
0.052.785.693.392.287.196.878.482.180.671.678.2
2000-010203040506070809101112
92145158134153156142140138112141107
3823535156
125
3376
1410111918101011
611991913162023162216
8,439441
4,774000
6,01500
5,3755,4082,611
81.198.989.3
100.0100.0100.0
86.5100.0100.0
88.087.594.2
2001-010203040506070809101112
10480
16612412812282
12817515795
136
657903056895
1113101418787
26131011
17181723181081232211916
7,2503,441
0395180
4,4467,0823,474
398179
7,2910
83.891.5
100.099.199.689.784.192.299.199.683.1
100.0
2002-010203040506070809101112
11785
16917415110215418016717113286
527361942634
13
1212115
1219141859
65191517621231624813
4,4639,107
2080
106,659
479828
03,120
00
90.077.499.5
100.0100.0
84.698.998.1
100.093.0
100.0100.0

27
Table 3. SOHO/LASCO/CME counts (Cont�nued).
Date (Yr-Mo) NCME NH NPH NH + NPH
LASCO Downtime (Minutes)
Coverage(%)
2003-010203040506070809101112
12685
104153122765484781107560
0020530224
120
1255769311
1262
12577111233316182
2754,647
00
89916,94912,165
629303
4,764277
2,844
99.488.5
100.0100.0
98.060.872.798.699.389.399.493.6
2004-010203040506070809101112
89949488
12697
1086657
10310375
300411817474
75357
14956354
10539815176137128
5,2770
7,37614,574
07,647
228198
14,229964776
13,631
88.2100.0
83.566.3
100.082.399.599.667.197.898.269.5
2005-010203040506070809101112
1119395
106139101145122797673
105
1020285
1767101
9435
1451173284
196372210281310385
0181
5,431385
2,2515,525
0474
3,441265692
3,024
100.099.687.899.195.087.2
100.098.992.099.498.493.2
2006-010203040506070809101112
102714780
10981
12597
109739455
010130130113
302512103131
312642233244
2211,0359,033
1830
4,590195
8,97717,278
4,2696,2507,203
99.597.479.899.6
100.089.499.679.960.090.485.583.9

28
Table 3. SOHO/LASCO/CME counts (Cont�nued).
Date (Yr-Mo) NCME NH NPH NH + NPH
LASCO Downtime (Minutes)
Coverage(%)
19961997199819992000200120022003200420052006
20638170710061618149716881127110012451043
417292758635230405914
11203911212214712169737522
1537681391802101739911313436
134,98424,635
217,482131,563
33,06334,13624,87443,75264,90021,66959,234
74.495.358.675.093.793.595.391.787.795.988.7
Note: CME means coronal mass ejection. NCME means number of CMEs. NH means number of halo CMEs. NPH means number of partial halo CMEs
29
Table 4. Monthly and annual we�ghted solar w�nd veloc�ty.
Date(Yr-Mo)
Velocity(km s–1) Hr
Coverage (%) Comment
1964-010203040506070809101112
369.0352.9
––––
517.5453.6463.4459.8430.7396.0
558228
111159237396249183
75.032.8
0.00.00.00.0
14.921.432.953.234.624.6
E(Rm)20
1965-010203040506070809101112
394.5451.3460.0396.6407.9425.3440.9440.1435.8415.7373.7404.7
180297309327330270198393393360387318
24.244.241.545.444.437.526.652.854.648.453.842.7
1966-010203040506070809101112
419.4439.1427.7395.7364.8401.8436.1429.3489.7440.3426.4461.2
270306339351180129287170287198267197
36.345.545.648.824.217.938.622.839.926.637.126.5
1967-010203040506070809101112
378.4423.3369.9397.4447.5416.5417.2439.6455.9450.8438.1492.3
515630480375480551607708663711696625
69.293.864.552.164.576.581.695.292.195.696.784.0

30
Table 4. Monthly and annual we�ghted solar w�nd veloc�ty (Cont�nued).
Date(Yr-Mo)
Velocity(km s–1) Hr
Coverage (%) Comment
1968-010203040506070809101112
447.3467.4468.5471.9471.6485.3457.9479.0456.1493.9498.0451.5
639674742671616579281348277111128423
85.996.899.793.282.880.437.846.838.514.917.856.9
E(RM)20
1969-010203040506070809101112
439.1449.5460.4417.2426.6395.8365.6410.6409.3396.0415.7418.1
634640566500255339373658573456489569
85.295.276.169.434.347.150.188.479.661.367.976.5
1970-010203040506070809101112
384.7407.8461.0428.4412.9407.5468.0419.0438.0419.6443.3376.8
632522426489441321516423405465376359
84.977.757.367.959.344.669.456.956.362.552.248.3
1971-010203040506070809101112
474.6464.5427.9434.5422.6420.7448.5
––––
480.7
520364571597579491300
0000
60
69.954.276.782.977.868.240.3
0.00.00.00.08.1

31
Table 4. Monthly and annual we�ghted solar w�nd veloc�ty (Cont�nued).
Date(Yr-Mo)
Velocity(km s–1) Hr
Coverage (%) Comment
1972-010203040506070809101112
447.4417.2404.1378.5414.3392.1350.6
––
390.6419.0370.5
471534614591530222141
00
315447405
63.376.782.582.171.230.819.0
0.00.0
42.362.154.4
1973-010203040506070809101112
484.7511.3526.1565.3529.4527.0478.3426.2411.3461.2431.5444.4
618603658547634662627420453414684670
83.189.788.476.085.291.984.356.562.955.695.090.1
1974-010203040506070809101112
520.3500.2540.1524.2522.4552.6543.3515.5533.7547.7521.8525.4
732663744717711720741723672687681688
98.498.7
100.099.695.6
100.099.697.293.392.394.692.5
1975-010203040506070809101112
513.3553.6543.5502.4478.1484.0495.3440.1403.8396.7477.3509.3
700642669664607627643506481404409418
94.195.589.992.281.687.186.468.066.854.356.856.2
32
Table 4. Monthly and annual we�ghted solar w�nd veloc�ty (Cont�nued).
Date(Yr-Mo)
Velocity(km s–1) Hr
Coverage (%) Comment
1976-010203040506070809101112
462.0509.2528.8480.3449.7456.2461.0411.7434.9402.4401.6410.7
425445425503500562563521576577612608
57.163.957.169.967.278.175.770.080.077.685.081.7
E(Rm)21
1977-010203040506070809101112
408.3439.0408.4450.1404.3423.8448.6475.2407.6393.8380.5376.1
588559573616610530554614648589687703
79.083.277.085.682.073.674.582.590.079.295.494.5
1978-010203040506070809101112
408.3415.0457.7493.8457.8462.2394.7397.6434.2402.9442.9440.2
568472580615545490566700713730713722
76.370.278.085.473.368.176.194.199.098.199.097.0
1979-010203040506070809101112
452.9424.8425.9503.4452.3415.9407.9440.5383.7368.9367.8378.2
707646712709734712744742716735710726
95.096.195.798.598.798.9
100.099.799.498.898.697.6
E(RM)21
33
Table 4. Monthly and annual we�ghted solar w�nd veloc�ty (Cont�nued).
Date(Yr-Mo)
Velocity(km s–1) Hr
Coverage (%) Comment
1980-010203040506070809101112
420.9381.9344.1400.7370.8399.2388.2356.8345.7430.5460.4430.2
702624718700722658654691696731641735
94.492.996.597.297.091.487.992.996.798.389.098.8
1981-010203040506070809101112
389.2419.2449.2502.5443.9402.1435.6446.1377.3465.9425.0376.4
726609668674675711721694693703650683
97.690.689.893.690.798.896.993.396.394.590.391.8
1982-010203040506070809101112
426.0498.2432.6474.8487.2465.5515.4471.7510.9438.1522.7547.1
702634649677710679674701663488320243
94.494.387.294.095.494.390.694.292.165.644.432.7
1983-010203040506070809101112
497.1489.1491.0522.0531.5452.3446.9452.1469.5458.8502.5450.0
267101246274304289254358300402392318
35.915.033.138.140.940.134.148.141.754.054.442.7

34
Table 4. Monthly and annual we�ghted solar w�nd veloc�ty (Cont�nued).
Date(Yr-Mo)
Velocity(km s–1) Hr
Coverage (%) Comment
1984-010203040506070809101112
449.2452.6511.0552.0464.5480.8447.2484.3584.7450.0505.1546.5
303200322
32255229227262139197
74102
40.728.743.3
4.434.331.830.535.219.326.510.313.7
1985-010203040506070809101112
491.7500.3454.6504.8371.5449.1500.8521.7477.3479.6485.7465.8
141146251259303195270310189252220142
19.021.733.736.040.727.136.341.726.333.930.619.1
1986-010203040506070809101112
522.0629.4470.6428.5401.3411.0408.9511.6508.7483.5408.5393.8
287142254317338371325372287345286265
38.621.134.144.045.451.543.750.039.946.439.735.6
E(Rm)22
1987-010203040506070809101112
397.4487.4478.0351.4341.7386.6381.2472.3505.4486.9488.8411.2
318233327305289335288406266313323264
42.734.744.042.438.846.538.754.636.942.144.935.5
35
Table 4. Monthly and annual we�ghted solar w�nd veloc�ty (Cont�nued).
Date(Yr-Mo)
Velocity(km s–1) Hr
Coverage (%) Comment
1988-010203040506070809101112
388.5416.2433.2441.8450.6401.7423.5444.0457.4449.5406.9458.0
285201311232261269222378303377327303
38.328.941.832.235.137.429.850.842.150.745.440.7
1989-010203040506070809101112
534.7514.7570.3493.2421.1416.0370.6429.1385.9459.4448.0452.2
284196269290263278252397297413361289
38.229.236.240.335.338.633.953.441.355.550.138.8
E(RM)22
1990-010203040506070809101112
488.5497.8433.1462.7439.4433.9428.0506.9441.5439.8395.5385.2
257261300229189298145370284346279310
34.538.840.331.825.441.419.549.739.446.538.841.7
1991-010203040506070809101112
385.2390.3426.5420.8497.4545.0546.5545.7428.2486.8513.4472.0
296248164248239262229382261345261287
39.836.922.034.432.136.430.851.336.332.936.338.6
36
Table 4. Monthly and annual we�ghted solar w�nd veloc�ty (Cont�nued).
Date(Yr-Mo)
Velocity(km s–1) Hr
Coverage (%) Comment
1992-010203040506070809101112
428.5431.2418.0387.5432.6466.5362.7400.2467.6508.4445.8480.1
306242294293268321334290161208203218
41.134.839.540.736.044.644.939.022.428.028.229.3
1993-010203040506070809101112
509.6537.1464.0472.7442.7425.7426.8390.0372.2411.3445.4516.8
244203302199256255240297196230160230
32.830.240.627.634.435.432.339.927.230.922.230.9
1994-010203040506070809101112
559.7641.3531.5569.2639.0575.2517.7419.7444.0475.9381.4471.0
257221363341454381359308217277205294
34.532.948.847.461.052.948.341.430.137.228.539.5
1995-010203040506070809101112
446.7450.9456.8439.1491.6448.9386.5417.8418.3428.3390.5391.8
721670738720737653741705713741694695
96.999.799.2
100.099.190.799.694.899.099.696.493.4
37
Table 4. Monthly and annual we�ghted solar w�nd veloc�ty (Cont�nued).
Date(Yr-Mo)
Velocity(km s–1) Hr
Coverage (%) Comment
1996-010203040506070809101112
427.0446.1435.7434.3398.1371.8392.9432.7482.7461.6405.7404.8
704696734712612713561743695706696688
94.6100.0
98.798.982.399.075.499.996.594.996.792.5
E(Rm)23
1997-010203040506070809101112
415.1411.5389.5399.0361.6379.9366.9387.2391.2378.6378.7327.1
716672744720685377504743640702720740
96.2100.0100.0100.0
92.152.467.799.988.994.4
100.099.5
1998-010203040506070809101112
373.6378.1403.5381.6465.6412.1420.1423.9410.3454.3420.7401.2
743672744720744720744744720744687744
99.9100.0100.0100.0100.0100.0100.0100.0100.0100.0
95.4100.0
1999-010203040506070809101112
423.3414.3429.8440.0444.8399.7395.7469.0484.8485.4437.3455.1
744672744720742720744744720744689744
100.0100.0100.0100.0
99.7100.0100.0100.0100.0100.0
95.7100.0

38
Table 4. Monthly and annual we�ghted solar w�nd veloc�ty (Cont�nued).
Date(Yr-Mo)
Velocity(km s–1) Hr
Coverage (%) Comment
2000-010203040506070809101112
478.8498.4408.2434.0460.5477.4469.8437.6455.3412.7474.5393.5
744696744720744720736740720744718744
100.0100.0100.0100.0100.0100.0
98.999.5
100.0100.0
99.7100.0
E(RM)23
2001-0102030405 0607 0809101112
373.5394.9423.1518.6429.8437.1429.8438.6430.5419.8437.1408.0
744672744720744720744744719744701744
100.0100.0100.0100.0100.0100.0100.0100.0
99.9100.0
97.4100.0
2002-01020304050607 08 09 101112
395.7414.3442.3456.6442.9396.4448.7434.0413.8485.3489.3473.7
744672744720744720744744720744718744
100.0100.0100.0100.0100.0100.0100.0100.0100.0100.0
99.7100.0
2003-010203040506070809101112
472.9514.3524.4528.5586.6608.5561.9572.1532.2523.6571.5515.9
744671744720744720744744720685708744
100.099.9
100.0100.0100.0100.0100.0100.0100.0
92.198.3
100.0

39
Table 4. Monthly and annual we�ghted solar w�nd veloc�ty (Cont�nued).
Date(Yr-Mo)
Velocity(km s–1) Hr
Coverage (%) Comment
2004-010203040506070809101112
542.3481.4497.7440.0425.9435.8491.6399.6407.5387.6478.1454.8
744695744720743720744744718744720743
100.099.9
100.0100.0
99.9100.0100.0100.0
99.7100.0100.0
99.9
2005-010203040506070809101112
568.2491.4483.9442.4474.2447.0443.5489.1496.1409.1442.6458.5
691672744715744720744744710744720744
92.9100.0100.0
99.3100.0100.0100.0100.0
98.6100.0100.0100.0
2006-010203040506070809101112
403.6392.4427.3425.4418.7451.1403.7414.1420.0437.7429.1513.3
744672744720743720744720719744717697
100.0100.0100.0100.0
99.9100.0100.0100.0
99.9100.0
99.693.7
2007-01020304050607
479.4427.9449.3440.2444.2427.0430.9
744672744719744720731
100.0100.0100.0
99.9100.0100.0
98.3

40
Table 4. Monthly and annual we�ghted solar w�nd veloc�ty (Cont�nued).
Date(Yr-Mo)
Velocity(km s–1) Hr
Coverage (%) Comment
1964196519661967196819691970197119721973197419751976197719781979198019811982198319841985198619871988198919901991199219931994199519961997199819992000200120022003200420052006
418.4420.2429.2430.7467.8419.9421.9440.6403.2486.0529.1488.8446.8416.7433.2418.3394.0427.5477.6479.0482.0473.6456.9457.6432.1455.9447.0474.7430.5450.0528.1430.7425.3382.4412.4440.1449.7428.4441.3542.8453.5469.9427.9
2121376229817041548960525375348242706990847967706317727174148593827282077140350523422678358936673469358932683222313828123677852882607963872687278770874087588688877986898684
24.142.934.080.462.569.161.439.748.679.896.877.371.983.084.698.194.293.781.540.026.730.641.041.939.541.037.336.835.732.142.097.494.090.999.699.699.899.8
100.099.299.999.299.1
E(Rmin)20 E(Rmax)20 E(Rmin)21 E(Rmax)21 E(Rmin)22 E(Rmax)22 E(Rmin)23 E(Rmax)23
Note: For each month, velocity is the weighted average of the daily minimum and maximum observed velocities (weighted by daily hours), based on the Omni tape and expressed in km s–1. For each year, vel is the weighted average of the monthly averages (weighted by monthly hours) and expressed in km s–1.

41
Table 5. Monthly and 12-mo mov�ng averages (mma) of R, aa, and aaI for July 1868–present and the rat�o aaI/aa.
Date(Yr-Mo)
Monthly Values 12-mma Values Ratio
CommentsR aa aaI R aa aaI aaI /aa
1868-010203040506070809101112
15.515.726.536.626.731.129.034.447.261.659.167.6
13.518.922.623.919.320.924.422.326.928.916.216.6
6.511.915.115.911.813.216.814.418.419.8
7.27.2
19.321.524.227.631.735.539.242.945.847.150.556.9
21.622.222.723.123.824.1
13.514.014.214.615.115.2
0.630.630.630.630.630.63
1869-010203040506070809101112
60.959.952.741.0
103.9108.4
59.279.680.659.378.1
104.3
22.126.525.232.426.122.120.322.832.720.917.617.6
13.017.416.524.215.010.811.312.822.711.97.76.5
61.464.668.069.470.172.474.677.684.393.8
101.7105.8
24.023.824.124.023.723.824.024.024.023.823.523.3
14.814.514.614.514.214.214.214.213.813.212.512.1
0.620.610.610.600.600.600.590.590.580.550.530.52
1870-010203040506070809101112
77.3114.9157.6160.0176.0135.6132.4153.8136.0146.4147.5130.0
24.526.124.128.723.819.317.024.438.129.224.822.8
14.614.510.515.0
9.46.74.6
11.025.516.111.710.5
110.0116.2121.6127.5134.0138.0139.6140.5140.2139.6138.5135.4
23.123.023.323.924.925.025.125.125.225.425.525.4
11.711.311.411.712.012.312.412.312.412.712.812.8
0.510.490.490.490.480.490.490.490.490.500.500.50
RM(11)
1871-010203040506070809101112
88.3125.3143.2162.4145.5
91.7103.0110.180.389.0
105.490.4
22.227.724.334.120.120.024.426.520.622.931.018.6
11.815.611.420.3
7.19.5
13.315.110.612.519.8
8.1
132.3129.3125.1120.4116.3112.9110.8110.3107.8103.0
98.998.0
25.726.125.524.524.524.524.324.324.524.324.124.2
13.313.813.412.612.813.012.812.913.213.213.213.4
0.520.530.530.510.520.530.530.530.540.540.550.55

42
Table 5. Monthly and 12-mo mov�ng averages (mma) of R, aa, and aaI for July 1868–present and the rat�o aaI/aa (Cont�nued).
Date(Yr-Mo)
Monthly Values 12-mma Values Ratio
CommentsR aa aaI R aa aaI aaI /aa
1872-010203040506070809101112
79.5120.1
88.4102.1107.6109.9105.5
92.9114.6102.6112.083.9
19.930.926.026.423.320.628.228.123.641.527.923.4
9.919.115.615.412.0
9.217.017.512.030.516.413.2
98.998.399.0
101.0101.9101.9102.0101.7101.6100.9
97.492.2
24.424.624.825.726.426.527.227.427.127.026.927.3
13.513.814.014.815.415.416.216.416.116.116.216.7
0.550.560.560.580.580.580.600.600.590.600.600.61
1873-010203040506070809101112
86.7107.0
98.376.247.944.866.968.247.147.155.449.2
32.323.527.023.723.728.723.521.722.219.517.515.0
22.012.316.213.915.220.314.112.213.711.08.66.4
87.885.281.476.271.567.765.262.458.454.452.452.0
27.427.026.725.724.323.522.722.021.420.820.519.7
17.116.916.615.914.714.113.412.912.412.011.710.9
0.620.630.620.620.600.600.590.590.580.580.570.55
aam(11), aaIM(11)
1874-010203040506070809101112
60.864.246.432.044.638.267.861.328.034.328.929.3
20.719.015.622.116.915.716.015.918.620.717.213.0
11.69.77.2
14.38.57.66.66.8
11.012.8
9.65.3
51.851.550.449.147.445.542.739.136.836.134.632.7
18.818.317.917.817.817.716.816.916.816.516.216.0
10.19.69.29.29.39.39.08.88.88.58.38.2
0.540.520.510.520.520.530.540.520.520.520.510.51
1875-010203040506070809101112
14.621.533.829.111.523.912.514.6
2.412.717.7
9.9
13.016.415.615.615.913.014.711.616.114.812.711.4
6.09.17.78.09.15.67.84.69.77.95.64.6
29.825.522.520.519.217.917.116.816.315.113.712.5
15.915.615.315.014.614.314.214.214.113.713.312.9
8.28.18.07.77.47.27.17.17.06.76.36.0
0.520.520.520.510.510.500.500.500.500.490.470.47
43
Table 5. Monthly and 12-mo mov�ng averages (mma) of R, aa, and aaI for July 1868–present and the rat�o aaI/aa (Cont�nued).
Date(Yr-Mo)
Monthly Values 12-mma Values Ratio
CommentsR aa aaI R aa aaI aaI /aa
1876-010203040506070809101112
14.315.030.6
2.35.11.6
15.28.89.9
14.39.98.2
12.715.513.9
9.410.510.612.113.113.013.413.113.0
5.78.56.23.04.04.25.16.46.26.46.36.3
11.711.611.712.011.811.411.711.910.810.611.813.0
12.712.712.612.412.412.512.512.412.212.312.612.9
5.95.85.85.65.55.65.75.55.45.55.86.0
0.460.460.460.450.440.450.460.440.440.450.460.47
1877-010203040506070809101112
24.48.7
11.915.821.614.2
6.06.3
16.96.7
14.22.2
12.212.513.411.815.911.910.710.510.3
9.914.5
9.7
4.85.86.64.88.64.94.13.93.23.37.53.3
13.112.612.712.712.612.511.410.410.1
9.38.07.1
12.912.712.512.212.212.111.911.711.411.211.010.7
6.05.85.65.35.35.25.04.94.74.54.34.1
0.470.460.450.430.430.430.420.420.410.400.390.38
1878-010203040506070809101112
3.36.67.80.15.96.40.10.05.31.14.10.5
10.410.4
9.111.410.211.67.79.4
10.89.7
10.012.2
3.93.82.45.13.65.01.43.14.33.33.55.9
6.66.05.34.64.03.53.33.92.42.32.42.2
10.610.410.410.410.210.110.210.110.110.1
9.99.8
4.03.83.83.63.73.73.73.63.73.73.53.4
0.380.370.370.350.360.370.360.360.370.370.350.35
Rm(12)
1879-010203040506070809101112
1.00.60.06.22.44.87.5
10.76.1
12.313.1
7.3
9.18.7
11.58.59.28.98.8
10.911.89.9
10.112.2
2.82.45.21.92.82.42.24.15.23.03.25.6
2.53.23.74.25.05.76.99.0
10.912.313.715.8
9.79.89.9
10.010.010.010.010.010.010.210.611.0
3.33.43.43.53.43.43.43.33.23.33.73.9
0.340.350.340.350.340.340.340.330.320.320.350.35
aam(12) aaIM(12)
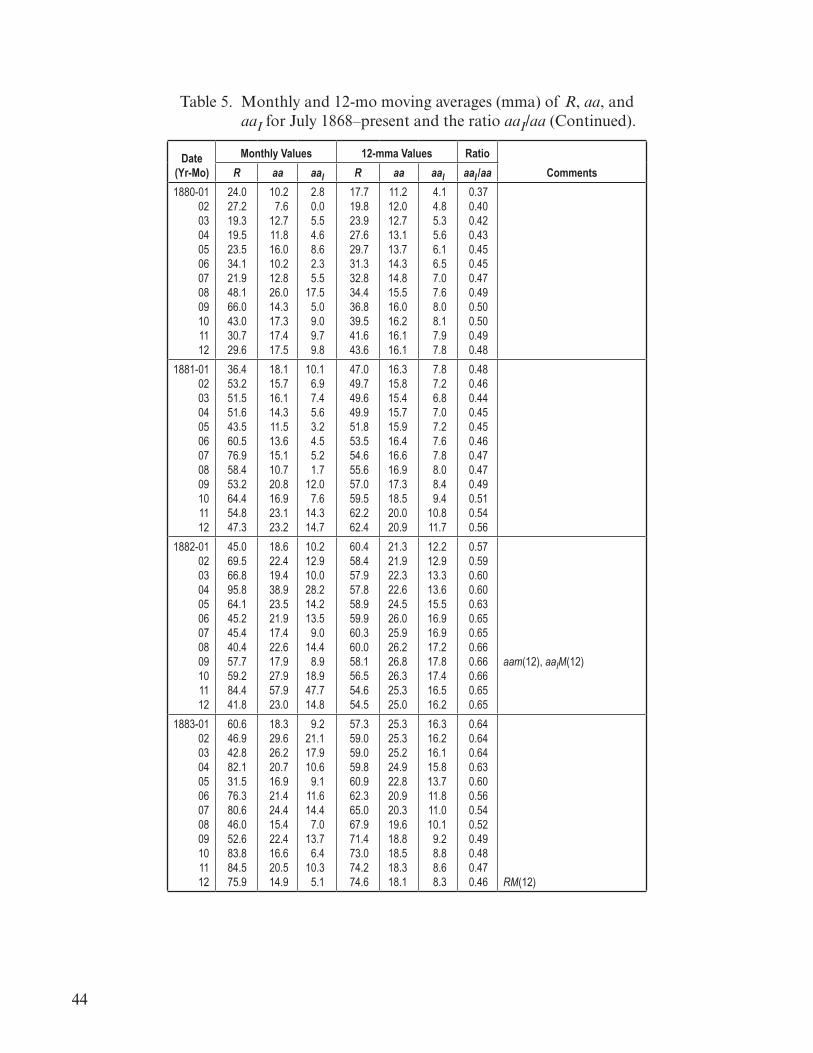
44
Table 5. Monthly and 12-mo mov�ng averages (mma) of R, aa, and aaI for July 1868–present and the rat�o aaI/aa (Cont�nued).
Date(Yr-Mo)
Monthly Values 12-mma Values Ratio
CommentsR aa aaI R aa aaI aaI /aa
1880-010203040506070809101112
24.027.219.319.523.534.121.948.166.043.030.729.6
10.27.6
12.711.816.010.212.826.014.317.317.417.5
2.80.05.54.68.62.35.5
17.55.09.09.79.8
17.719.823.927.629.731.332.834.436.839.541.643.6
11.212.012.713.113.714.314.815.516.016.216.116.1
4.14.85.35.66.16.57.07.68.08.17.97.8
0.370.400.420.430.450.450.470.490.500.500.490.48
1881-010203040506070809101112
36.453.251.551.643.560.576.958.453.264.454.847.3
18.115.716.114.311.513.615.110.720.816.923.123.2
10.16.97.45.63.24.55.21.7
12.07.6
14.314.7
47.049.749.649.951.853.554.655.657.059.562.262.4
16.315.815.415.715.916.416.616.917.318.520.020.9
7.87.26.87.07.27.67.88.08.49.4
10.811.7
0.480.460.440.450.450.460.470.470.490.510.540.56
1882-010203040506070809101112
45.069.566.895.864.145.245.440.457.759.284.441.8
18.622.419.438.923.521.917.422.617.927.957.923.0
10.212.910.028.214.213.5
9.014.4
8.918.947.714.8
60.458.457.957.858.959.960.360.058.156.554.654.5
21.321.922.322.624.526.025.926.226.826.325.325.0
12.212.913.313.615.516.916.917.217.817.416.516.2
0.570.590.600.600.630.650.650.660.660.660.650.65
aam(12), aaIM(12)
1883-010203040506070809101112
60.646.942.882.131.576.380.646.052.683.884.575.9
18.329.626.220.716.921.424.415.422.416.620.514.9
9.221.117.910.6
9.111.614.4
7.013.7
6.410.3
5.1
57.359.059.059.860.962.365.067.971.473.074.274.6
25.325.325.224.922.820.920.319.618.818.518.318.1
16.316.216.115.813.711.811.010.1
9.28.88.68.3
0.640.640.640.630.600.560.540.520.490.480.470.46
RM(12)

45
Table 5. Monthly and 12-mo mov�ng averages (mma) of R, aa, and aaI for July 1868–present and the rat�o aaI/aa (Cont�nued).
Date(Yr-Mo)
Monthly Values 12-mma Values Ratio
CommentsR aa aaI R aa aaI aaI /aa
1884-010203040506070809101112
91.586.987.576.166.551.253.155.861.947.836.647.2
12.017.220.418.515.716.018.415.916.419.019.816.1
1.56.9
10.18.76.37.39.67.07.2
10.511.87.6
72.471.772.471.367.864.661.358.856.654.253.655.2
17.617.417.117.017.017.117.317.517.417.117.417.8
7.97.77.57.47.67.88.18.58.58.38.69.0
0.450.440.440.440.450.460.470.490.490.490.490.51
1885-010203040506070809101112
42.871.849.855.073.083.766.550.039.638.730.921.7
16.118.416.216.924.117.115.920.625.018.916.615.0
7.88.87.68.1
14.46.96.5
12.016.910.8
8.97.7
57.157.456.254.954.453.251.649.247.647.445.241.1
17.817.918.418.818.618.418.618.919.520.420.821.2
8.88.99.59.99.89.79.9
10.311.011.912.413.0
0.490.500.520.530.530.530.530.540.560.580.600.61
1886-010203040506070809101112
29.925.957.343.730.727.130.316.921.4
8.60.3
13.0
20.720.030.524.525.524.522.221.022.024.623.623.5
13.012.521.616.217.816.914.513.914.717.917.316.6
37.234.332.230.227.525.824.623.220.516.714.713.8
21.722.021.922.022.623.223.523.723.422.922.622.0
13.714.114.114.315.015.716.116.316.115.715.615.0
0.630.640.640.650.660.680.690.690.690.690.690.68
aam′(12), aaIM’(12)
1887-010203040506070809101112
10.313.2
4.26.9
20.015.723.321.4
7.46.66.9
20.7
19.825.818.123.520.215.515.420.121.817.017.518.1
13.018.111.616.913.0
8.58.0
12.815.210.410.910.8
13.113.012.611.912.112.713.213.012.913.012.411.5
21.421.021.020.720.119.619.519.318.918.818.718.8
14.414.114.113.813.212.712.512.312.011.911.812.0
0.670.670.670.670.660.650.640.640.630.630.630.64

46
Table 5. Monthly and 12-mo mov�ng averages (mma) of R, aa, and aaI for July 1868–present and the rat�o aaI/aa (Cont�nued).
Date(Yr-Mo)
Monthly Values 12-mma Values Ratio
CommentsR aa aaI R aa aaI aaI /aa
1888-010203040506070809101112
12.77.17.85.17.07.13.12.88.82.1
10.76.7
21.118.818.119.322.217.415.816.618.017.918.217.0
14.212.211.412.815.610.8
9.410.211.311.511.419.4
10.38.67.97.87.87.36.35.85.85.85.65.3
18.918.818.518.418.418.418.017.517.217.016.415.8
12.212.111.811.711.812.212.211.711.411.210.610.0
0.650.640.640.640.640.660.680.670.660.660.650.63
1889-010203040506070809101112
0.88.56.74.32.46.49.4
20.66.52.10.26.7
12.813.916.814.513.112.816.415.517.516.521.414.7
6.57.2
10.28.06.76.29.78.2
10.910.115.1
8.1
5.66.67.27.16.76.36.56.35.95.75.75.6
15.615.615.615.515.615.615.615.715.515.315.014.9
9.89.89.79.69.79.49.09.19.08.78.58.3
0.630.630.620.620.620.600.580.580.580.570.570.56
1890-010203040506070809101112
5.30.65.11.64.81.3
11.68.5
17.211.29.67.8
14.614.712.911.311.410.212.913.216.818.616.211.2
8.18.46.44.94.93.86.16.59.7
11.89.54.5
5.55.05.05.86.67.07.48.69.8
10.813.116.5
14.614.414.214.314.213.813.613.714.215.216.517.3
8.17.87.77.77.67.27.07.07.58.49.6
10.2
0.550.540.540.540.540.520.510.510.530.550.580.59
Rm(13) aam(13)aaIM(13)
1891-010203040506070809101112
13.522.210.420.541.148.358.833.053.851.541.932.5
13.317.223.525.426.614.614.118.025.323.619.419.1
6.49.9
16.718.218.4
6.15.1
10.216.514.911.211.3
20.523.526.029.232.234.637.942.546.350.053.756.5
17.517.818.318.919.219.720.421.623.223.723.724.0
10.310.410.811.211.411.812.313.414.715.114.915.1
0.590.580.590.590.590.600.600.620.630.640.630.63

47
Table 5. Monthly and 12-mo mov�ng averages (mma) of R, aa, and aaI for July 1868–present and the rat�o aaI/aa (Cont�nued).
Date(Yr-Mo)
Monthly Values 12-mma Values Ratio
CommentsR aa aaI R aa aaI aaI /aa
1892-010203040506070809101112
69.175.649.969.679.676.376.5
101.462.870.565.478.6
22.438.039.223.328.020.636.625.023.126.018.625.1
12.928.230.613.818.010.826.814.013.916.4
9.315.2
58.462.065.266.468.171.073.273.473.975.376.377.0
25.226.426.626.626.726.927.126.425.024.023.122.6
16.217.317.317.317.217.317.416.715.314.213.312.7
0.640.660.650.650.640.640.640.630.610.590.580.56
aam(13), aaIM(13)
1893-010203040506070809101112
75.073.065.788.184.789.988.6
129.277.980.075.193.8
21.122.021.316.914.920.017.521.422.423.821.416.9
11.312.312.0
6.54.79.57.19.1
12.513.811.66.3
78.079.781.582.583.384.385.386.186.085.285.686.7
21.820.820.620.520.520.320.020.721.421.622.022.4
11.810.810.610.410.410.1
9.810.411.111.311.712.1
0.540.520.510.510.510.500.490.500.520.520.530.54
1894-010203040506070809101112
83.284.652.381.6
101.298.9
106.070.365.975.556.660.0
22.136.822.920.321.922.929.223.925.520.024.814.9
12.026.614.210.210.912.018.014.416.210.215.9
5.8
87.986.283.282.581.679.477.275.675.375.473.871.3
23.023.623.823.823.823.923.622.921.422.722.822.6
12.613.313.713.713.713.913.713.112.713.013.113.0
0.550.560.580.580.580.580.580.570.590.570.570.58
RM(13) aam′(13), aaIM ′(13)
1895-010203040506070809101112
63.367.261.076.967.571.547.868.957.767.947.270.7
18.323.725.923.619.520.520.813.418.825.625.417.5
9.114.316.813.710.110.912.3
3.99.8
16.216.9
7.9
67.765.264.864.263.563.562.560.759.958.255.152.5
22.121.320.620.620.821.021.522.022.121.921.921.8
12.712.011.311.311.611.712.312.912.812.412.612.6
0.570.560.550.550.560.560.570.590.580.570.580.58

48
Table 5. Monthly and 12-mo mov�ng averages (mma) of R, aa, and aaI for July 1868–present and the rat�o aaI/aa (Cont�nued).
Date(Yr-Mo)
Monthly Values 12-mma Values Ratio
CommentsR aa aaI R aa aaI aaI /aa
1896-010203040506070809101112
29.057.452.043.827.749.045.027.261.328.738.042.6
28.326.524.720.123.514.618.521.020.720.416.016.7
20.717.510.111.815.9
6.010.113.411.612.8
7.98.4
51.549.648.046.544.543.042.341.639.538.037.135.2
21.521.722.122.021.421.020.419.418.718.618.518.3
12.312.613.113.012.512.211.610.710.310.510.510.4
0.570.580.590.590.580.580.570.550.550.560.570.57
1897-010203040506070809101112
40.629.429.131.020.011.327.621.848.114.3
8.433.3
14.917.017.125.117.514.912.213.613.916.815.520.1
6.79.39.5
17.410.3
8.14.66.35.49.88.8
12.3
32.932.031.230.128.326.625.825.726.326.025.626.3
18.117.516.916.516.316.416.616.717.016.916.616.7
10.29.79.28.88.78.99.19.29.59.49.19.2
0.560.550.540.530.530.540.550.550.560.560.550.55
1898-010203040506070809101112
30.236.438.314.525.822.3
9.031.434.834.430.912.6
16.418.023.416.318.017.216.417.524.417.016.515.9
8.710.015.3
9.310.5
9.99.79.7
16.59.18.89.0
26.025.625.425.727.527.626.324.722.721.921.120.3
17.017.317.918.318.418.318.118.318.218.018.118.1
9.59.8
10.410.810.810.710.610.810.810.710.810.8
0.560.570.580.590.590.580.590.590.590.590.600.60
1899-010203040506070809101112
19.59.2
18.114.2
7.720.513.5
2.98.4
13.07.8
10.5
17.320.718.517.118.816.414.514.316.512.311.615.0
10.114.011.410.112.1
9.27.67.99.85.44.98.2
20.419.417.115.113.212.211.711.511.210.911.311.3
18.017.817.316.816.416.116.015.615.114.714.213.5
10.710.610.2
9.89.59.39.18.68.17.77.16.5
0.590.600.590.580.580.580.570.550.540.520.500.48

49
Table 5. Monthly and 12-mo mov�ng averages (mma) of R, aa, and aaI for July 1868–present and the rat�o aaI/aa (Cont�nued).
Date(Yr-Mo)
Monthly Values 12-mma Values Ratio
CommentsR aa aaI R aa aaI aaI /aa
1900-010203040506070809101112
9.413.6
8.616.015.212.1
8.34.38.3
12.94.50.3
16.411.815.410.112.5
7.68.18.98.1
10.08.38.3
6.74.98.73.15.50.71.42.41.43.11.82.0
10.710.510.610.610.4
9.99.18.27.66.85.95.4
12.912.411.811.411.210.710.2
9.99.29.29.08.9
5.95.44.84.34.13.73.43.22.92.62.42.4
0.460.440.410.380.370.350.330.320.320.280.270.27
aaIM(14)
1901-010203040506070809101112
0.22.44.50.0
10.25.80.71.00.63.73.80.0
10.210.0
9.48.29.18.98.59.08.98.38.59.3
3.93.62.91.92.32.32.22.72.61.82.03.0
4.84.43.93.22.82.83.03.13.33.63.32.8
9.09.09.09.08.99.09.08.98.99.09.19.1
2.52.52.62.62.52.62.52.52.52.62.72.6
0.280.280.290.290.280.290.280.280.280.290.300.29
aam(14)
1902-010203040506070809101112
5.50.0
12.40.02.81.40.92.37.6
16.310.3
1.1
9.010.5
8.910.8
8.58.39.29.19.9
10.110.5
9.0
2.44.22.04.52.11.92.92.73.23.03.72.6
2.62.73.13.94.75.05.26.06.87.99.5
10.6
9.19.19.29.39.49.59.59.59.49.59.7
10.1
2.62.72.72.82.93.03.02.92.82.93.03.3
0.290.300.290.300.310.320.320.310.300.310.310.33
Rm(14)
1903-010203040506070809101112
8.317.013.526.114.616.327.928.811.138.944.545.6
9.58.89.6
13.210.714.313.717.116.929.219.216.4
2.81.72.75.73.77.26.19.5
10.121.110.8
8.0
12.314.615.816.919.322.525.426.627.929.631.433.5
10.511.011.712.713.914.615.215.916.216.416.817.0
3.64.04.65.76.77.27.88.38.68.89.09.1
0.340.360.390.450.480.490.510.520.530.540.540.54

50
Table 5. Monthly and 12-mo mov�ng averages (mma) of R, aa, and aaI for July 1868–present and the rat�o aaI/aa (Cont�nued).
Date(Yr-Mo)
Monthly Values 12-mma Values Ratio
CommentsR aa aaI R aa aaI aaI /aa
1904-010203040506070809101112
31.624.537.243.039.541.950.658.230.154.238.054.6
18.015.511.716.015.913.413.713.114.115.914.513.5
10.28.13.77.77.85.25.14.16.47.16.44.7
35.537.739.741.141.541.642.946.449.850.550.751.3
16.916.816.515.815.014.714.615.015.716.116.216.2
9.08.78.37.66.86.56.46.67.17.57.57.5
0.530.520.500.480.450.440.440.440.450.470.460.46
1905-010203040506070809101112
54.885.856.539.348.049.073.058.855.078.7
107.255.5
18.923.219.619.513.516.714.719.719.214.123.013.6
10.112.910.711.45.08.15.0
10.710.4
4.211.74.7
52.553.554.656.660.563.463.160.458.559.560.661.6
16.416.717.217.317.618.017.617.216.916.616.416.4
7.77.98.48.48.58.78.48.17.97.67.37.2
0.470.470.490.490.480.480.480.470.470.460.450.44
1906-010203040506070809101112
45.531.364.555.357.763.2
103.647.756.117.838.964.7
10.520.416.914.514.314.215.314.917.115.612.519.4
2.112.7
7.65.65.35.04.26.48.28.54.4
10.1
63.464.263.861.355.953.555.159.662.762.461.760.1
16.316.115.815.815.415.215.816.516.916.917.217.5
7.16.86.66.76.56.57.07.57.77.78.08.5
0.440.420.420.420.420.430.440.450.460.460.470.49
RM(14)
1907-010203040506070809101112
76.4108.2
60.752.642.940.449.754.385.065.461.547.3
19.428.217.215.119.717.819.818.419.721.417.514.5
9.616.9
8.16.4
11.49.6
11.29.69.5
12.18.46.0
56.955.056.459.662.662.860.555.951.450.350.450.6
17.918.218.518.819.319.318.918.518.519.019.319.2
8.99.49.69.8
10.110.1
9.99.69.8
10.410.610.6
0.500.520.520.520.520.520.520.520.530.550.550.55
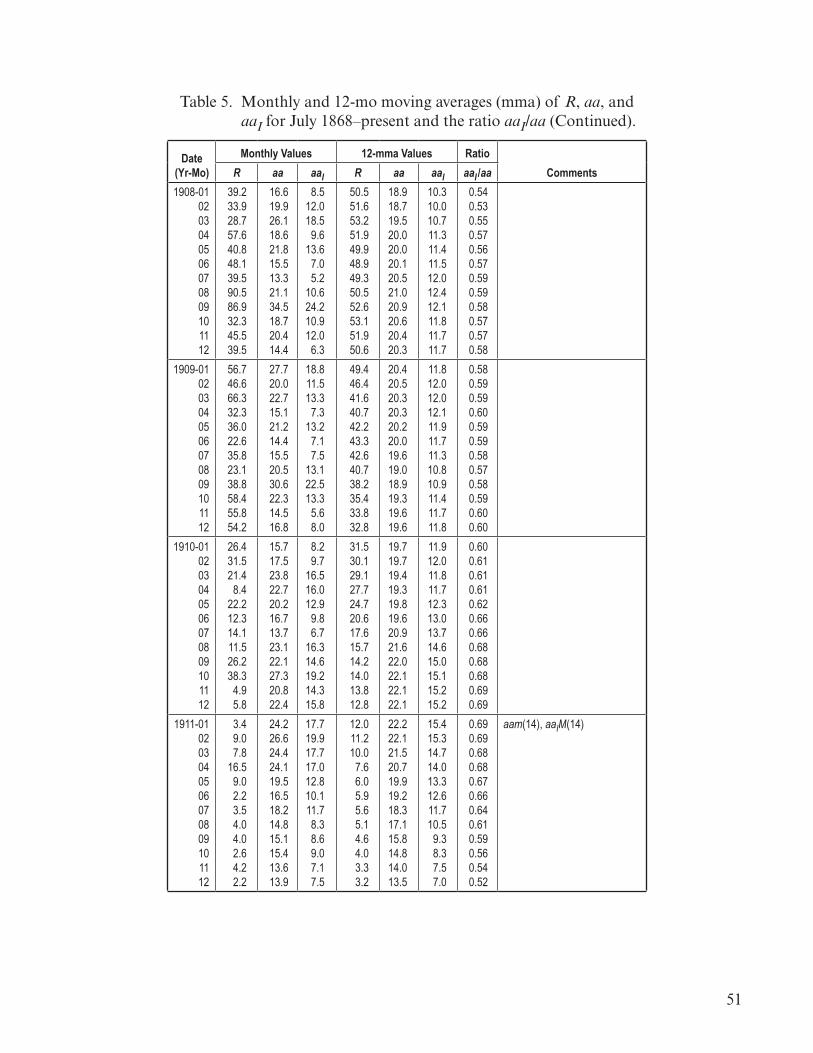
51
Table 5. Monthly and 12-mo mov�ng averages (mma) of R, aa, and aaI for July 1868–present and the rat�o aaI/aa (Cont�nued).
Date(Yr-Mo)
Monthly Values 12-mma Values Ratio
CommentsR aa aaI R aa aaI aaI /aa
1908-010203040506070809101112
39.233.928.757.640.848.139.590.586.932.345.539.5
16.619.926.118.621.815.513.321.134.518.720.414.4
8.512.018.5
9.613.6
7.05.2
10.624.210.912.0
6.3
50.551.653.251.949.948.949.350.552.653.151.950.6
18.918.719.520.020.020.120.521.020.920.620.420.3
10.310.010.711.311.411.512.012.412.111.811.711.7
0.540.530.550.570.560.570.590.590.580.570.570.58
1909-010203040506070809101112
56.746.666.332.336.022.635.823.138.858.455.854.2
27.720.022.715.121.214.415.520.530.622.314.516.8
18.811.513.3
7.313.2
7.17.5
13.122.513.3
5.68.0
49.446.441.640.742.243.342.640.738.235.433.832.8
20.420.520.320.320.220.019.619.018.919.319.619.6
11.812.012.012.111.911.711.310.810.911.411.711.8
0.580.590.590.600.590.590.580.570.580.590.600.60
1910-010203040506070809101112
26.431.521.4
8.422.212.314.111.526.238.3
4.95.8
15.717.523.822.720.216.713.723.122.127.320.822.4
8.29.7
16.516.012.9
9.86.7
16.314.619.214.315.8
31.530.129.127.724.720.617.615.714.214.013.812.8
19.719.719.419.319.819.620.921.622.022.122.122.1
11.912.011.811.712.313.013.714.615.015.115.215.2
0.600.610.610.610.620.660.660.680.680.680.690.69
1911-010203040506070809101112
3.49.07.8
16.59.02.23.54.04.02.64.22.2
24.226.624.424.119.516.518.214.815.115.413.613.9
17.719.917.717.012.810.111.78.38.69.07.17.5
12.011.210.0
7.66.05.95.65.14.64.03.33.2
22.222.121.520.719.919.218.317.115.814.814.013.5
15.415.314.714.013.312.611.710.5
9.38.37.57.0
0.690.690.680.680.670.660.640.610.590.560.540.52
aam(14), aaIM(14)

52
Table 5. Monthly and 12-mo mov�ng averages (mma) of R, aa, and aaI for July 1868–present and the rat�o aaI/aa (Cont�nued).
Date(Yr-Mo)
Monthly Values 12-mma Values Ratio
CommentsR aa aaI R aa aaI aaI /aa
1912-010203040506070809101112
0.30.04.94.54.44.13.00.39.54.61.16.4
10.510.910.612.312.511.310.713.412.712.412.312.3
4.24.64.15.86.04.84.37.16.05.95.95.7
3.23.03.13.43.43.43.73.93.83.53.22.8
12.912.612.412.212.011.911.912.112.312.412.412.3
6.56.16.05.75.65.45.55.65.85.95.95.9
0.500.480.480.470.470.450.460.460.470.480.480.48
1913-010203040506070809101112
2.32.90.50.90.00.01.70.21.23.10.73.8
13.212.412.812.811.99.99.99.6
12.913.610.5
9.6
6.86.06.56.55.63.63.53.36.57.24.23.1
2.62.52.21.81.71.61.51.51.62.43.34.0
12.212.011.911.911.911.711.511.211.211.311.411.5
5.85.65.55.55.55.35.14.94.84.95.05.1
0.480.470.460.460.460.450.440.440.430.430.440.44
Rm(15)aam(15), aaIM(15)
1914-010203040506070809101112
2.82.63.1
17.35.2
11.45.47.7
12.78.2
16.422.3
10.110.213.016.411.013.215.817.814.716.216.312.2
3.73.86.69.34.56.49.3
11.17.89.59.24.9
4.65.15.86.57.48.8
10.412.916.118.620.724.3
11.912.512.913.113.513.814.114.514.915.215.516.1
5.46.06.46.56.87.17.37.67.98.18.38.7
0.450.480.500.500.500.510.520.520.530.530.540.54
1915-010203040506070809101112
23.042.338.841.333.068.871.669.649.553.542.534.5
13.916.417.918.216.820.814.117.619.924.227.815.3
6.58.19.8
10.09.0
11.34.58.1
11.315.419.5
7.4
29.434.838.942.345.346.948.349.851.553.956.958.6
16.316.316.517.017.818.418.818.919.319.820.320.4
8.78.48.48.89.4
10.010.210.310.611.011.311.4
0.530.520.510.520.530.540.540.540.550.560.560.56

53
Table 5. Monthly and 12-mo mov�ng averages (mma) of R, aa, and aaI for July 1868–present and the rat�o aaI/aa (Cont�nued).
Date(Yr-Mo)
Monthly Values 12-mma Values Ratio
CommentsR aa aaI R aa aaI aaI /aa
1916-010203040506070809101112
45.355.467.071.874.567.753.535.245.150.765.653.0
18.914.527.922.123.118.722.624.325.327.426.921.8
10.55.6
18.512.513.4
9.313.816.416.918.817.613.1
57.855.654.053.754.656.358.360.262.163.365.168.7
20.721.321.822.222.322.523.223.923.823.323.122.7
11.712.513.013.413.513.614.214.814.714.113.813.3
0.570.590.600.600.610.600.610.620.620.610.600.59
1917-010203040506070809101112
74.771.994.874.7
114.1114.9119.8154.5129.4
72.296.4
129.3
28.022.019.119.618.815.617.531.119.023.117.722.7
18.212.4
8.49.87.24.05.7
17.76.7
13.56.9
10.4
73.481.289.794.196.3
100.7104.8105.4104.2103.5102.2
98.3
22.422.522.522.121.521.120.920.720.921.221.521.7
12.712.412.111.410.710.2
9.79.59.8
10.110.510.9
0.570.550.540.520.500.480.460.460.470.480.490.50
RM(15)
1918-010203040506070809101112
96.065.372.280.576.759.4
107.6101.7
79.985.083.459.2
20.724.322.623.521.718.520.325.131.329.326.031.0
10.015.013.013.511.99.59.0
14.121.319.115.822.0
95.592.888.587.087.083.578.677.277.576.175.478.0
22.021.922.122.923.524.224.925.626.226.727.127.4
11.311.311.712.613.214.015.015.716.416.917.317.5
0.510.520.530.550.560.580.600.610.630.630.640.64
aam(15), aaIM(15)
1919-010203040506070809101112
48.179.566.551.888.1
111.264.769.054.752.842.034.9
30.729.433.624.230.416.817.825.628.229.817.221.3
22.219.424.215.520.0
5.48.5
16.119.421.1
9.013.4
78.475.272.870.467.464.663.762.861.960.556.751.4
27.227.227.026.926.625.825.024.023.423.122.622.1
17.317.417.417.417.216.515.714.814.214.013.713.4
0.640.640.640.650.650.640.630.620.610.610.610.61

54
Table 5. Monthly and 12-mo mov�ng averages (mma) of R, aa, and aaI for July 1868–present and the rat�o aaI/aa (Cont�nued).
Date(Yr-Mo)
Monthly Values 12-mma Values Ratio
CommentsR aa aaI R aa aaI aaI /aa
1920-010203040506070809101112
51.153.970.214.833.338.727.519.236.349.627.229.9
19.617.031.420.720.615.316.917.728.620.218.019.9
10.98.2
21.913.712.8
7.29.3
10.520.611.610.412.2
46.843.240.339.438.737.936.834.932.131.031.330.6
22.021.621.320.920.620.620.319.919.218.719.620.6
13.613.413.212.812.512.512.312.011.310.711.612.6
0.620.620.620.610.610.610.610.600.590.570.590.61
1921-010203040506070809101112
31.528.326.732.422.233.741.922.817.818.217.820.3
14.613.518.520.143.515.316.217.515.319.219.120.7
6.85.97.5
12.336.2
7.48.0
10.18.2
12.112.013.5
31.031.731.129.027.326.525.324.425.525.824.322.5
20.520.519.919.319.319.419.720.321.021.621.020.3
12.512.411.911.411.511.612.012.613.414.113.513.0
0.610.600.600.590.600.600.610.620.640.650.640.64
1922-010203040506070809101112
11.826.454.711.08.05.8
10.96.54.76.27.4
17.5
20.921.527.026.421.221.523.023.622.623.016.013.3
14.114.018.219.614.514.916.217.016.116.4
9.46.2
20.118.116.915.814.914.413.912.6
9.47.16.76.6
20.821.421.922.422.422.021.320.820.119.018.117.5
13.614.214.915.415.415.014.413.913.412.411.510.9
0.650.660.680.690.690.680.680.670.670.650.640.62
1923-010203040506070809101112
4.51.53.36.13.29.13.50.5
13.211.610.0
2.8
13.116.615.012.913.014.011.310.213.715.510.812.5
6.610.2
8.56.36.67.34.83.96.88.74.06.1
6.45.96.06.66.96.45.65.65.75.86.88.1
16.715.614.714.013.513.313.413.413.313.213.113.2
10.19.18.17.46.96.76.86.86.86.76.56.5
0.600.580.550.530.510.500.510.510.510.510.500.49
Rm(16)

55
Table 5. Monthly and 12-mo mov�ng averages (mma) of R, aa, and aaI for July 1868–present and the rat�o aaI/aa (Cont�nued).
Date(Yr-Mo)
Monthly Values 12-mma Values Ratio
CommentsR aa aaI R aa aaI aaI /aa
1924-010203040506070809101112
0.55.11.8
11.320.824.028.119.325.125.622.516.5
16.513.915.810.213.115.312.6
9.815.511.712.310.8
10.27.49.43.45.87.95.02.68.04.25.03.7
9.811.612.914.015.116.116.917.919.320.922.624.5
13.313.313.413.313.213.213.012.712.412.412.512.8
6.56.56.56.46.26.25.95.55.25.15.25.4
0.490.490.490.480.470.470.450.430.420.410.420.42
aam(16), aaIM(16)
1925-010203040506070809101112
5.523.218.031.742.847.538.537.960.269.258.698.6
12.311.511.513.713.920.614.716.520.924.616.115.8
5.74.14.45.95.6
12.16.68.4
11.815.1
7.14.9
25.927.129.332.635.940.947.251.855.657.758.960.9
13.113.514.014.715.415.816.718.219.721.222.322.6
5.65.96.36.97.57.68.39.5
10.912.213.213.4
0.430.440.450.470.490.480.500.520.550.580.590.59
1926-010203040506070809101112
71.869.962.538.564.373.552.361.660.871.560.579.4
30.029.130.530.122.619.114.316.125.626.214.816.2
20.419.621.322.013.3
9.45.67.0
16.516.6
5.76.2
62.664.165.165.265.464.764.365.766.969.572.472.4
22.522.522.622.922.922.922.421.520.719.919.319.0
13.313.213.313.613.613.613.112.111.310.4
9.79.4
0.590.590.590.590.590.590.580.560.550.520.500.49
1927-010203040506070809101112
81.693.069.693.579.159.154.953.868.463.167.245.2
18.418.123.618.519.714.119.521.423.827.610.918.7
8.37.5
14.17.99.75.1
10.712.614.318.4
1.510.3
72.071.871.771.771.670.569.168.468.368.467.769.0
19.019.519.619.619.519.419.319.018.618.018.218.9
9.49.8
10.010.0
9.99.99.89.69.18.68.89.4
0.490.500.510.510.510.510.510.510.490.480.480.50

56
Table 5. Monthly and 12-mo mov�ng averages (mma) of R, aa, and aaI for July 1868–present and the rat�o aaI/aa (Cont�nued).
Date(Yr-Mo)
Monthly Values 12-mma Values Ratio
CommentsR aa aaI R aa aaI aaI /aa
1928-010203040506070809101112
83.573.585.480.677.091.498.083.889.761.450.359.0
13.116.414.215.826.523.230.718.822.526.321.118.5
2.96.74.05.8
16.612.719.9
8.612.117.212.5
9.5
72.175.177.378.177.377.277.176.174.271.669.267.7
19.720.119.919.820.220.620.721.322.323.022.722.2
10.110.310.1
9.910.310.710.911.512.613.413.212.8
0.510.510.510.500.510.520.530.540.570.580.580.58
RM(16)
1929-010203040506070809101112
68.962.850.252.858.271.970.265.834.454.081.1
108.0
15.926.929.116.819.217.721.518.824.428.425.623.9
6.417.720.5
8.110.2
8.112.0
9.516.519.615.612.6
66.264.361.358.659.663.064.864.062.861.160.657.5
21.621.221.321.421.722.122.723.223.524.726.628.2
12.211.912.212.512.712.913.413.914.315.617.519.3
0.560.560.570.580.590.580.590.600.610.630.660.68
1930-010203040506070809101112
65.349.935.038.236.828.821.924.932.134.435.625.8
23.830.833.841.139.336.231.236.231.732.221.720.1
14.522.225.933.031.328.623.928.723.924.313.812.6
53.649.848.047.144.239.033.531.230.730.229.428.3
29.430.531.532.032.031.731.230.329.127.124.923.2
20.621.923.023.523.623.623.322.621.319.417.315.5
0.700.720.730.730.740.740.750.750.730.720.690.67
aam(16)aaIM(16)
1931-010203040506070809101112
14.643.130.031.224.615.317.413.019.010.018.717.8
15.918.315.812.914.917.616.020.624.130.226.624.0
8.910.0
8.15.27.5
10.68.9
13.716.923.419.416.9
27.626.925.924.222.621.621.119.717.816.314.814.8
21.720.519.519.119.219.620.020.621.522.924.024.3
14.212.912.011.711.912.312.813.414.415.817.017.4
0.650.630.620.610.620.630.640.650.670.690.710.72

57
Table 5. Monthly and 12-mo mov�ng averages (mma) of R, aa, and aaI for July 1868–present and the rat�o aaI/aa (Cont�nued).
Date(Yr-Mo)
Monthly Values 12-mma Values Ratio
CommentsR aa aaI R aa aaI aaI /aa
1932-010203040506070809101112
12.110.611.211.217.922.2
9.66.84.08.98.2
11.0
23.124.330.831.125.114.715.422.022.020.116.718.2
16.217.524.024.318.0
7.48.7
15.415.513.410.011.4
14.814.213.312.612.211.411.211.712.011.710.7
9.4
24.224.224.223.722.922.221.821.521.020.319.819.7
17.217.317.316.816.015.415.014.614.113.513.113.0
0.710.710.710.710.700.690.690.680.670.670.660.66
1933-010203040506070809101112
12.322.210.1
2.93.25.22.80.25.13.00.60.3
18.821.322.124.020.416.515.217.121.319.718.915.9
11.914.015.317.614.010.0
8.810.814.813.312.6
9.6
8.47.97.77.56.96.25.44.33.43.64.65.4
19.819.619.319.319.419.419.118.818.618.317.617.2
13.112.912.712.712.812.812.612.312.211.811.110.7
0.660.660.660.660.660.660.660.650.660.640.630.62
Rm(17)
1934-010203040506070809101112
3.47.84.3
11.319.7
6.79.38.34.05.78.7
15.4
14.417.822.914.214.412.913.220.320.614.512.418.4
7.911.116.4
7.47.26.36.5
13.614.1
7.95.7
11.4
5.76.36.66.77.28.19.4
10.611.912.713.015.0
17.017.017.116.916.416.216.516.816.716.716.817.1
10.410.410.510.3
9.89.69.8
10.09.99.89.9
10.1
0.610.610.610.610.600.590.590.600.590.590.590.59
aam(17), aaIM’(17)
1935-010203040506070809101112
18.620.523.112.227.345.733.930.142.153.264.261.5
18.619.420.716.514.519.315.412.823.723.118.520.6
11.412.213.3
9.66.9
10.97.55.1
15.514.3
9.211.5
17.619.622.025.629.934.237.942.046.551.355.057.2
17.517.217.117.518.218.518.718.918.919.219.820.2
10.310.0
9.710.110.510.610.610.610.510.510.911.2
0.590.580.570.580.580.570.570.560.560.550.550.55

58
Table 5. Monthly and 12-mo mov�ng averages (mma) of R, aa, and aaI for July 1868–present and the rat�o aaI/aa (Cont�nued).
Date(Yr-Mo)
Monthly Values 12-mma Values Ratio
CommentsR aa aaI R aa aaI aaI /aa
1936-010203040506070809101112
62.874.377.174.954.670.052.387.076.089.0
115.4123.4
20.422.718.425.020.422.720.913.112.718.320.914.9
11.213.0
8.515.211.613.212.2
2.82.97.99.32.9
59.062.265.968.872.577.282.687.890.392.196.1
101.2
20.520.820.319.719.619.419.018.919.119.419.619.6
11.511.611.010.2
9.99.68.98.58.68.98.98.7
0.560.560.540.520.510.490.470.450.450.460.450.44
1937-010203040506070809101112
132.5128.5
83.9109.3116.7130.3145.1137.7100.7124.9
74.488.8
15.125.221.529.221.521.821.717.717.630.722.319.4
2.713.011.317.9
9.89.58.75.06.6
18.612.6
9.0
107.6113.5116.7119.2119.0115.8113.0111.2110.9110.6110.8109.8
19.619.920.221.021.521.823.425.025.225.325.525.6
8.48.38.69.29.7
10.111.913.613.813.914.114.2
0.430.420.430.440.450.460.510.540.550.550.550.55
aaIM(17) RM(17)
1938-010203040506070809101112
98.4119.286.5
101.0127.4
97.5165.3115.789.699.1
122.292.7
49.528.923.429.026.717.722.622.827.727.020.722.4
38.717.113.118.014.5
6.98.7
11.217.316.1
8.811.8
109.3109.2107.9106.3107.1109.4108.8106.3103.6103.0103.0102.8
25.425.726.326.626.426.425.223.623.724.425.025.5
14.114.315.015.415.115.113.812.412.613.313.914.4
0.560.560.570.580.570.570.550.530.530.550.560.56
1939-010203040506070809101112
80.377.464.6
109.1118.3101.0
97.6105.8112.688.168.142.1
16.424.629.939.030.725.729.125.922.131.317.521.5
6.414.720.627.718.914.723.614.710.620.9
8.113.3
101.196.997.497.995.290.987.685.585.584.379.676.3
26.126.526.426.326.426.226.627.027.727.826.926.6
15.416.116.015.916.116.116.717.217.918.017.417.2
0.590.610.610.600.610.610.630.640.650.650.650.65

59
Table 5. Monthly and 12-mo mov�ng averages (mma) of R, aa, and aaI for July 1868–present and the rat�o aaI/aa (Cont�nued).
Date(Yr-Mo)
Monthly Values 12-mma Values Ratio
CommentsR aa aaI R aa aaI aaI /aa
1940-010203040506070809101112
50.559.483.360.754.483.967.5
105.566.555.058.468.3
27.723.046.825.323.026.521.421.323.024.828.026.6
19.114.036.716.214.216.312.010.113.616.019.017.1
74.273.071.167.866.066.767.666.864.661.959.757.6
26.325.825.725.425.626.226.326.526.826.726.626.3
16.816.216.116.016.316.916.917.117.517.617.617.4
0.640.630.630.630.640.650.640.650.650.660.660.66
1941-010203040506070809101112
45.644.546.432.829.559.866.960.065.946.338.433.7
24.830.545.824.522.020.330.925.241.120.426.622.2
16.422.137.416.714.311.221.516.131.812.018.514.3
56.654.752.852.451.249.047.047.047.649.150.247.8
26.527.028.028.528.328.027.626.926.125.825.725.4
17.618.219.219.819.619.519.118.417.617.217.116.8
0.660.670.690.690.690.700.690.680.670.670.670.66
1942-010203040506070809101112
35.652.854.260.725.011.417.720.217.219.230.722.5
17.521.735.327.417.117.525.924.828.733.225.721.4
9.613.026.518.3
9.610.718.817.621.626.018.014.1
43.741.136.533.331.831.029.627.725.623.021.120.5
25.024.824.324.324.824.724.824.924.423.824.124.8
16.716.716.316.517.017.017.217.316.916.416.817.6
0.670.670.670.680.690.690.690.690.690.690.700.71
1943-010203040506070809101112
12.428.927.426.114.1
7.613.219.410.0
7.810.218.8
21.020.023.924.827.424.127.343.938.235.732.526.2
14.112.416.317.320.417.420.436.731.429.025.719.0
20.119.919.618.817.516.516.014.412.610.8
9.28.6
25.126.027.227.728.128.628.929.029.329.529.228.6
17.918.820.020.520.921.521.822.122.422.722.421.9
0.710.720.740.740.740.750.750.760.760.770.770.77
aam(17), aaIM(17)
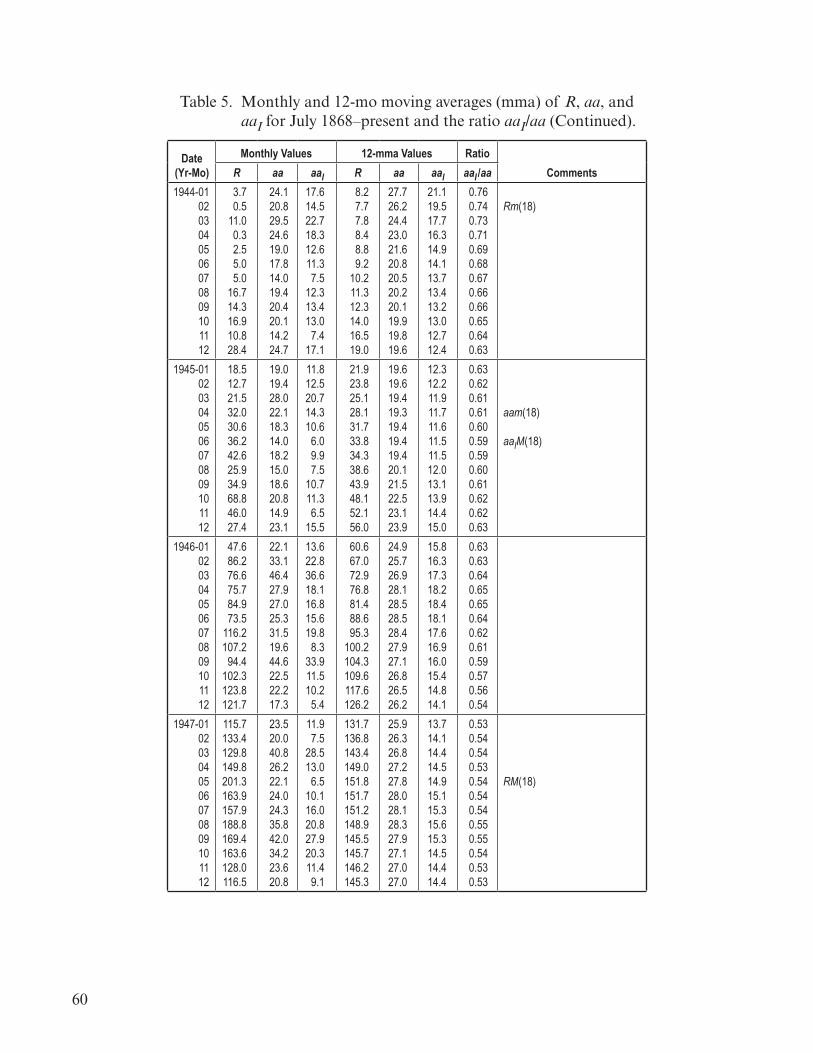
60
Table 5. Monthly and 12-mo mov�ng averages (mma) of R, aa, and aaI for July 1868–present and the rat�o aaI/aa (Cont�nued).
Date(Yr-Mo)
Monthly Values 12-mma Values Ratio
CommentsR aa aaI R aa aaI aaI /aa
1944-010203040506070809101112
3.70.5
11.00.32.55.05.0
16.714.316.910.828.4
24.120.829.524.619.017.814.019.420.420.114.224.7
17.614.522.718.312.611.37.5
12.313.413.0
7.417.1
8.27.77.88.48.89.2
10.211.312.314.016.519.0
27.726.224.423.021.620.820.520.220.119.919.819.6
21.119.517.716.314.914.113.713.413.213.012.712.4
0.760.740.730.710.690.680.670.660.660.650.640.63
Rm(18)
1945-010203040506070809101112
18.512.721.532.030.636.242.625.934.968.846.027.4
19.019.428.022.118.314.018.215.018.620.814.923.1
11.812.520.714.310.6
6.09.97.5
10.711.36.5
15.5
21.923.825.128.131.733.834.338.643.948.152.156.0
19.619.619.419.319.419.419.420.121.522.523.123.9
12.312.211.911.711.611.511.512.013.113.914.415.0
0.630.620.610.610.600.590.590.600.610.620.620.63
aam(18) aaIM(18)
1946-010203040506070809101112
47.686.276.675.784.973.5
116.2107.2
94.4102.3123.8121.7
22.133.146.427.927.025.331.519.644.622.522.217.3
13.622.836.618.116.815.619.8
8.333.911.510.2
5.4
60.667.072.976.881.488.695.3
100.2104.3109.6117.6126.2
24.925.726.928.128.528.528.427.927.126.826.526.2
15.816.317.318.218.418.117.616.916.015.414.814.1
0.630.630.640.650.650.640.620.610.590.570.560.54
1947-010203040506070809101112
115.7133.4129.8149.8201.3163.9157.9188.8169.4163.6128.0116.5
23.520.040.826.222.124.024.335.842.034.223.620.8
11.97.5
28.513.0
6.510.116.020.827.920.311.49.1
131.7136.8143.4149.0151.8151.7151.2148.9145.5145.7146.2145.3
25.926.326.827.227.828.028.128.327.927.127.027.0
13.714.114.414.514.915.115.315.615.314.514.414.4
0.530.540.540.530.540.540.540.550.550.540.530.53
RM(18)

61
Table 5. Monthly and 12-mo mov�ng averages (mma) of R, aa, and aaI for July 1868–present and the rat�o aaI/aa (Cont�nued).
Date(Yr-Mo)
Monthly Values 12-mma Values Ratio
CommentsR aa aaI R aa aaI aaI /aa
1948-010203040506070809101112
108.586.194.8
189.7174.0167.8142.2157.9143.3136.3
95.8138.0
23.724.027.120.726.617.919.131.224.939.026.025.9
12.413.716.4
5.612.3
3.86.2
17.612.026.415.313.2
144.8142.8140.5136.2135.8135.3136.6141.1147.7148.5143.9139.2
26.526.125.224.725.025.325.926.226.226.226.226.2
13.713.212.412.012.412.713.313.413.113.113.213.5
0.520.510.490.490.500.500.510.510.500.500.500.52
1949-010203040506070809101112
119.1182.3157.5147.0106.2121.7125.8123.8145.3131.6143.5117.6
32.723.327.620.525.320.914.722.120.735.727.618.0
20.98.6
14.07.4
14.19.02.6
10.17.7
23.314.7
6.3
136.6134.5133.2133.0134.8136.0134.4130.0124.4121.0119.6118.0
26.225.625.124.824.724.423.723.423.323.423.623.6
13.613.112.612.312.211.811.211.111.311.511.811.9
0.520.510.500.500.490.480.470.470.480.490.500.50
1950-010203040506070809101112
101.694.8
109.7113.4106.2
83.691.085.251.361.454.854.1
22.426.123.526.724.621.922.433.132.237.430.926.9
11.415.412.115.213.411.711.922.923.528.322.118.1
115.0111.9106.4
99.592.986.682.279.075.372.271.472.2
24.024.825.726.326.527.027.527.928.529.129.730.0
12.413.314.515.415.916.717.417.918.719.520.020.3
0.520.540.560.590.600.620.630.640.660.670.670.68
1951-010203040506070809101112
59.959.955.992.9
108.5100.6
61.561.083.151.652.445.8
26.032.131.435.028.426.128.132.647.333.228.631.1
16.923.022.524.417.115.219.023.537.224.519.922.7
71.769.569.870.770.269.868.666.363.359.253.046.8
30.430.631.231.731.431.531.932.333.033.834.334.7
20.821.121.722.121.922.022.423.023.824.725.626.2
0.680.690.700.700.700.700.700.710.720.730.750.76
aam(18)
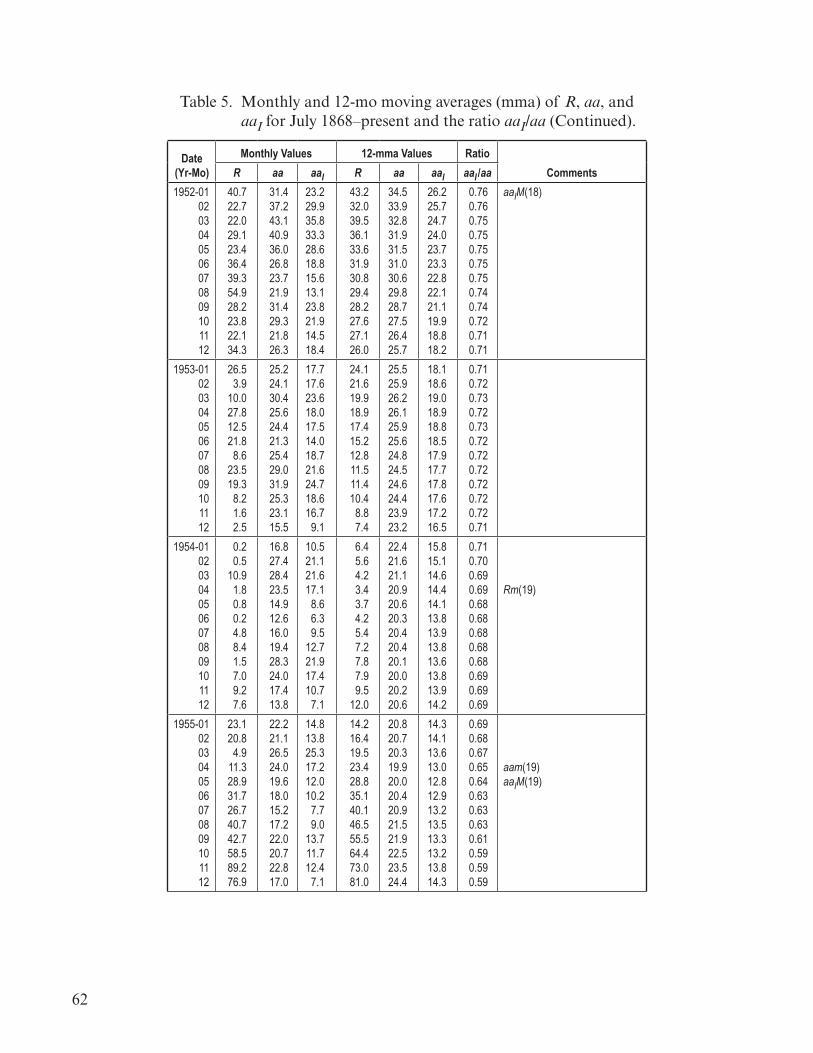
62
Table 5. Monthly and 12-mo mov�ng averages (mma) of R, aa, and aaI for July 1868–present and the rat�o aaI/aa (Cont�nued).
Date(Yr-Mo)
Monthly Values 12-mma Values Ratio
CommentsR aa aaI R aa aaI aaI /aa
1952-010203040506070809101112
40.722.722.029.123.436.439.354.928.223.822.134.3
31.437.243.140.936.026.823.721.931.429.321.826.3
23.229.935.833.328.618.815.613.123.821.914.518.4
43.232.039.536.133.631.930.829.428.227.627.126.0
34.533.932.831.931.531.030.629.828.727.526.425.7
26.225.724.724.023.723.322.822.121.119.918.818.2
0.760.760.750.750.750.750.750.740.740.720.710.71
aaIM(18)
1953-010203040506070809101112
26.53.9
10.027.812.521.8
8.623.519.3
8.21.62.5
25.224.130.425.624.421.325.429.031.925.323.115.5
17.717.623.618.017.514.018.721.624.718.616.7
9.1
24.121.619.918.917.415.212.811.511.410.4
8.87.4
25.525.926.226.125.925.624.824.524.624.423.923.2
18.118.619.018.918.818.517.917.717.817.617.216.5
0.710.720.730.720.730.720.720.720.720.720.720.71
1954-010203040506070809101112
0.20.5
10.91.80.80.24.88.41.57.09.27.6
16.827.428.423.514.912.616.019.428.324.017.413.8
10.521.121.617.1
8.66.39.5
12.721.917.410.7
7.1
6.45.64.23.43.74.25.47.27.87.99.5
12.0
22.421.621.120.920.620.320.420.420.120.020.220.6
15.815.114.614.414.113.813.913.813.613.813.914.2
0.710.700.690.690.680.680.680.680.680.690.690.69
Rm(19)
1955-010203040506070809101112
23.120.8
4.911.328.931.726.740.742.758.589.276.9
22.221.126.524.019.618.015.217.222.020.722.817.0
14.813.825.317.212.010.2
7.79.0
13.711.712.4
7.1
14.216.419.523.428.835.140.146.555.564.473.081.0
20.820.720.319.920.020.420.921.521.922.523.524.4
14.314.113.613.012.812.913.213.513.313.213.814.3
0.690.680.670.650.640.630.630.630.610.590.590.59
aam(19)aaIM(19)

63
Table 5. Monthly and 12-mo mov�ng averages (mma) of R, aa, and aaI for July 1868–present and the rat�o aaI/aa (Cont�nued).
Date(Yr-Mo)
Monthly Values 12-mma Values Ratio
CommentsR aa aaI R aa aaI aaI /aa
1956-010203040506070809101112
73.6124.0118.4110.7136.6116.6129.1169.6173.2155.3201.3192.1
31.626.230.534.632.226.422.723.625.322.235.221.1
21.914.218.723.219.614.710.4
9.511.08.7
19.65.9
88.898.5
109.3118.7127.4136.9145.5149.6151.5155.8159.6164.3
25.025.626.026.226.827.527.527.427.727.726.926.4
14.614.714.614.414.614.814.514.214.414.213.212.5
0.580.570.560.550.540.540.530.520.520.510.490.47
1957-010203040506070809101112
165.0130.2157.4175.2164.6200.7187.2158.0235.8253.8210.9239.4
28.626.736.628.718.029.021.620.756.924.029.431.6
14.714.423.014.3
4.113.4
6.77.1
39.76.0
13.414.2
170.2172.2174.3181.0185.5187.9191.4194.4197.3199.5200.8200.0
26.426.327.528.928.728.929.229.730.430.330.630.9
12.312.013.114.213.813.914.014.515.014.815.015.3
0.470.460.480.490.480.480.480.490.490.490.490.50
1958-010203040506070809101112
202.5164.9190.7196.0175.3171.5191.4200.2201.2181.5152.3187.6
25.443.136.027.525.129.635.925.026.424.714.927.2
9.729.220.912.110.715.426.1
9.510.815.3
6.912.2
199.0200.9201.3196.8191.4186.8185.2184.9183.8182.2180.7180.5
31.532.331.229.929.428.628.428.027.427.026.926.6
16.217.116.015.215.315.014.814.514.214.114.113.8
0.510.530.510.510.520.520.520.520.520.520.520.52
RM(19)
1959-010203040506070809101112
217.4143.1185.7163.3172.0168.7149.6199.6145.2111.4124.0125.0
24.235.829.824.225.621.642.431.136.028.132.030.7
7.922.920.210.411.47.5
29.220.923.016.720.018.6
178.6176.9174.5169.2165.1161.4155.8151.3146.3141.1137.2132.5
26.527.127.728.329.130.030.229.729.130.131.532.0
13.614.215.115.716.317.117.617.316.717.819.320.0
0.510.520.550.550.560.570.580.580.570.590.610.63
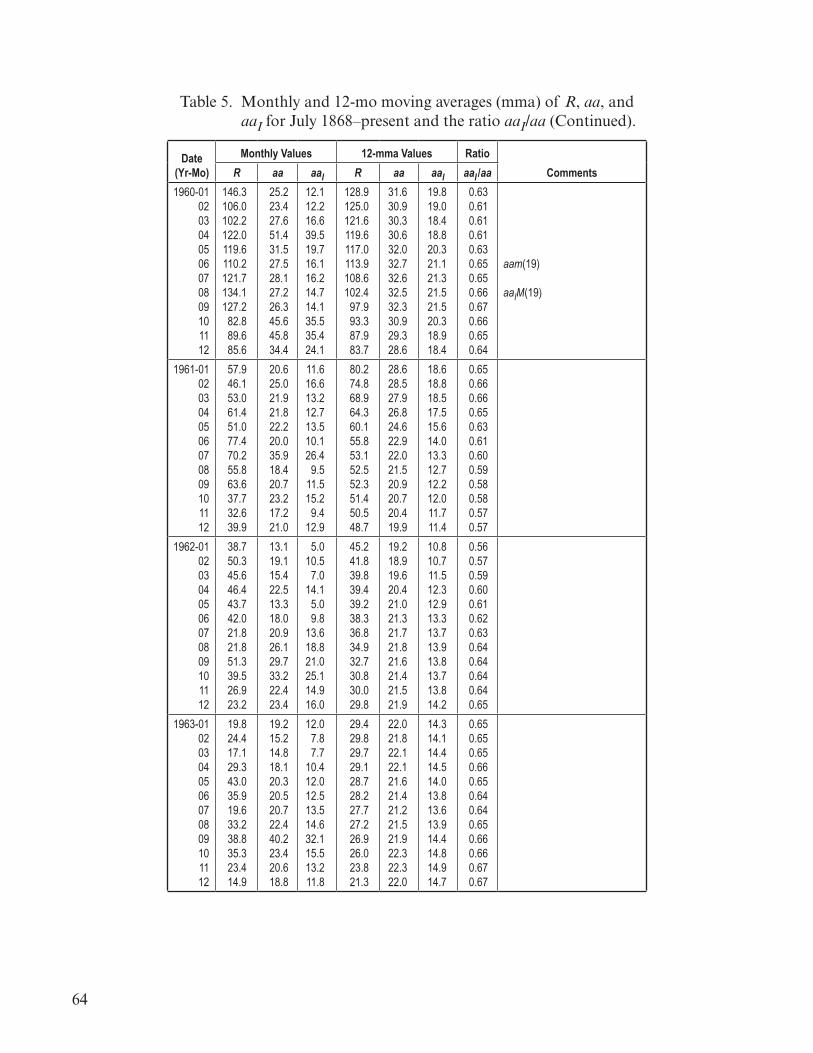
64
Table 5. Monthly and 12-mo mov�ng averages (mma) of R, aa, and aaI for July 1868–present and the rat�o aaI/aa (Cont�nued).
Date(Yr-Mo)
Monthly Values 12-mma Values Ratio
CommentsR aa aaI R aa aaI aaI /aa
1960-010203040506070809101112
146.3106.0102.2122.0119.6110.2121.7134.1127.2
82.889.685.6
25.223.427.651.431.527.528.127.226.345.645.834.4
12.112.216.639.519.716.116.214.714.135.535.424.1
128.9125.0121.6119.6117.0113.9108.6102.4
97.993.387.983.7
31.630.930.330.632.032.732.632.532.330.929.328.6
19.819.018.418.820.321.121.321.521.520.318.918.4
0.630.610.610.610.630.650.650.660.670.660.650.64
aam(19) aaIM(19)
1961-010203040506070809101112
57.946.153.061.451.077.470.255.863.637.732.639.9
20.625.021.921.822.220.035.918.420.723.217.221.0
11.616.613.212.713.510.126.4
9.511.515.2
9.412.9
80.274.868.964.360.155.853.152.552.351.450.548.7
28.628.527.926.824.622.922.021.520.920.720.419.9
18.618.818.517.515.614.013.312.712.212.011.711.4
0.650.660.660.650.630.610.600.590.580.580.570.57
1962-010203040506070809101112
38.750.345.646.443.742.021.821.851.339.526.923.2
13.119.115.422.513.318.020.926.129.733.222.423.4
5.010.5
7.014.1
5.09.8
13.618.821.025.114.916.0
45.241.839.839.439.238.336.834.932.730.830.029.8
19.218.919.620.421.021.321.721.821.621.421.521.9
10.810.711.512.312.913.313.713.913.813.713.814.2
0.560.570.590.600.610.620.630.640.640.640.640.65
1963-010203040506070809101112
19.824.417.129.343.035.919.633.238.835.323.414.9
19.215.214.818.120.320.520.722.440.223.420.618.8
12.07.87.7
10.412.012.513.514.632.115.513.211.8
29.429.829.729.128.728.227.727.226.926.023.821.3
22.021.822.122.121.621.421.221.521.922.322.322.0
14.314.114.414.514.013.813.613.914.414.814.914.7
0.650.650.650.660.650.640.640.650.660.660.670.67

65
Table 5. Monthly and 12-mo mov�ng averages (mma) of R, aa, and aaI for July 1868–present and the rat�o aaI/aa (Cont�nued).
Date(Yr-Mo)
Monthly Values 12-mma Values Ratio
CommentsR aa aaI R aa aaI aaI /aa
1964-010203040506070809101112
15.317.716.5
8.69.59.13.19.34.76.17.4
15.1
20.020.020.921.617.415.116.814.718.116.813.710.3
13.012.913.814.910.7
8.410.4
8.011.610.2
7.13.3
19.517.815.412.710.810.210.310.2
9.99.6
10.211.0
21.621.119.918.718.117.516.816.315.815.214.514.2
14.414.012.911.811.310.710.0
9.59.18.47.77.4
0.670.660.650.630.620.610.600.580.580.550.530.52
Rm(20)
1965-010203040506070809101112
17.514.211.76.8
24.115.911.98.9
16.820.115.817.0
11.716.214.212.510.415.714.716.717.413.011.613.7
4.69.27.45.93.08.77.9
10.010.3
5.84.66.6
11.712.012.513.614.615.215.516.417.419.722.324.5
14.214.214.214.013.813.814.114.114.214.414.614.6
7.37.37.47.16.86.97.17.17.27.27.27.2
0.510.510.520.510.490.500.500.500.510.500.490.49
aaIM’(20)aam(20)
1966-010203040506070809101112
28.224.425.348.745.347.756.751.250.257.257.270.4
14.114.818.511.914.712.417.019.929.317.416.820.4
6.57.4
11.03.46.33.98.1
11.220.7
8.57.9
10.8
27.731.334.537.440.744.750.356.763.167.670.272.7
14.614.815.416.116.517.017.517.917.917.818.719.7
7.07.07.58.18.38.68.89.08.78.49.2
10.1
0.480.470.490.500.500.510.500.500.490.470.490.51
1967-010203040506070809101112
110.993.6
111.869.586.567.591.5
107.276.888.294.3
126.4
18.819.713.715.433.018.514.317.524.617.718.824.4
7.49.12.25.9
22.79.13.86.2
14.87.38.1
12.3
75.078.882.284.687.591.394.195.395.395.097.1
100.6
19.919.719.419.219.319.519.820.220.921.521.321.1
10.19.79.39.08.99.09.19.5
10.110.810.510.1
0.510.490.480.470.460.460.460.470.480.500.490.48

66
Table 5. Monthly and 12-mo mov�ng averages (mma) of R, aa, and aaI for July 1868–present and the rat�o aaI/aa (Cont�nued).
Date(Yr-Mo)
Monthly Values 12-mma Values Ratio
CommentsR aa aaI R aa aaI aaI /aa
1968-010203040506070809101112
121.8111.992.281.2
127.2110.396.1
109.3117.2107.7
86.0109.8
21.026.523.322.221.324.817.920.021.924.726.120.2
9.115.012.712.1
9.113.4
7.28.7
10.213.415.8
8.8
102.6102.9104.7107.2107.6106.6105.2104.8107.0109.9110.6110.1
21.521.821.822.022.522.722.422.222.322.522.722.6
10.510.710.610.711.311.411.211.011.111.211.311.2
0.490.490.490.490.500.500.500.500.500.500.500.50
RM(20)
1969-010203040506070809101112
104.4120.5135.8106.8120.0106.0
96.898.091.395.793.597.9
17.725.727.223.525.116.614.915.323.817.118.613.7
6.613.814.612.313.3
5.44.14.5
13.36.48.02.9
110.0109.6108.0106.4106.2106.1105.9106.5105.4104.1104.6104.9
22.121.821.721.420.820.219.819.118.518.518.117.8
10.710.410.410.2
9.69.08.67.97.47.47.06.7
0.480.480.480.480.460.450.430.410.400.400.390.38
aaIM(20)
1970-010203040506070809101112
111.5127.8102.9109.5127.5106.8112.593.099.586.695.283.5
14.312.626.323.116.518.328.320.919.620.521.616.5
2.80.4
15.211.74.37.1
16.810.3
8.710.210.9
6.3
105.6106.0106.2106.1105.8105.3103.9101.0
97.293.989.484.1
18.419.219.319.319.519.820.321.021.120.921.121.3
7.38.08.18.08.38.69.1
10.010.310.310.711.3
0.400.420.420.410.430.430.450.480.490.490.510.53
1971-010203040506070809101112
91.379.060.771.857.549.881.061.450.251.753.282.2
23.421.121.023.821.016.915.117.121.322.118.718.5
12.911.211.914.212.013.6
5.18.0
12.713.4
9.98.4
80.477.874.470.968.166.765.464.665.866.266.869.4
20.720.019.920.020.019.919.919.719.619.419.019.0
11.110.510.610.911.011.011.111.010.810.510.1
9.8
0.540.530.530.550.550.550.560.560.550.540.530.52

67
Table 5. Monthly and 12-mo mov�ng averages (mma) of R, aa, and aaI for July 1868–present and the rat�o aaI/aa (Cont�nued).
Date(Yr-Mo)
Monthly Values 12-mma Values Ratio
CommentsR aa aaI R aa aaI aaI /aa
1972-010203040506070809101112
61.588.480.163.280.588.076.576.864.061.341.645.3
21.818.221.418.016.521.413.934.120.320.321.718.8
12.77.8
11.48.86.5
11.04.1
24.311.011.213.510.4
70.871.272.473.472.970.568.265.562.260.658.755.1
19.119.820.520.320.420.520.721.522.724.325.626.2
9.610.210.810.710.711.011.312.213.615.216.517.3
0.500.520.530.530.520.540.550.570.600.630.640.66
1973-010203040506070809101112
43.442.946.057.742.439.523.125.659.330.723.923.3
26.032.636.839.526.027.220.820.522.728.120.719.8
17.724.328.430.517.719.113.413.013.720.713.312.4
50.746.444.042.640.638.937.336.034.232.531.631.4
26.726.426.026.426.726.726.726.426.025.625.525.7
18.118.017.618.118.518.618.718.518.217.817.718.0
0.680.680.680.690.690.700.700.700.700.700.690.70
1974-010203040506070809101112
27.626.021.340.339.536.055.833.640.247.125.020.5
25.726.333.632.829.129.131.930.133.637.226.727.4
18.118.826.324.621.021.123.022.225.428.719.220.2
32.734.434.033.934.634.534.033.132.130.227.525.2
26.227.127.928.829.430.030.430.630.830.329.729.1
18.419.220.120.921.522.122.522.823.022.622.121.6
0.700.710.720.730.730.740.740.750.750.750.740.74
aam(20), aaIM(20)
1975-010203040506070809101112
18.911.511.55.19.0
11.428.239.713.9
9.119.4
7.8
27.531.031.924.322.620.621.618.016.820.129.221.0
20.324.225.117.815.913.814.0
9.99.9
13.422.014.3
23.022.121.218.616.816.015.014.314.415.416.116.3
28.327.426.224.824.124.023.523.323.223.323.423.3
20.920.118.917.617.117.016.616.316.215.316.316.2
0.740.730.720.710.710.710.710.700.700.660.700.70
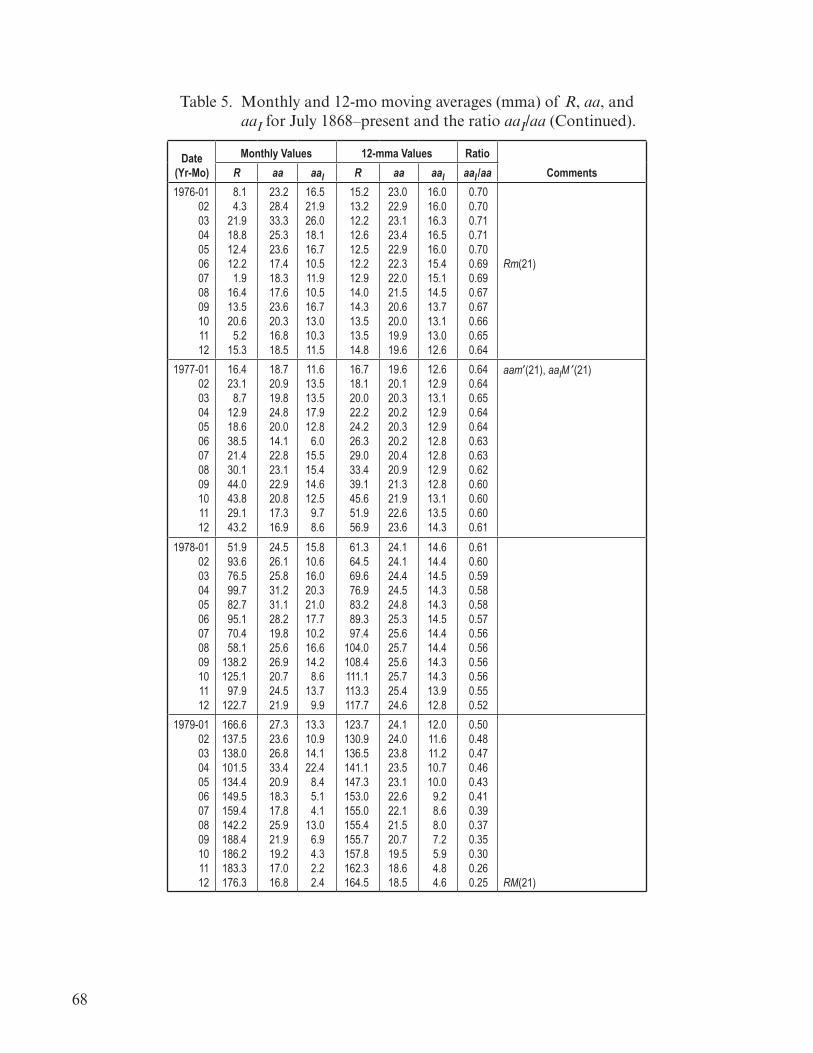
68
Table 5. Monthly and 12-mo mov�ng averages (mma) of R, aa, and aaI for July 1868–present and the rat�o aaI/aa (Cont�nued).
Date(Yr-Mo)
Monthly Values 12-mma Values Ratio
CommentsR aa aaI R aa aaI aaI /aa
1976-010203040506070809101112
8.14.3
21.918.812.412.2
1.916.413.520.6
5.215.3
23.228.433.325.323.617.418.317.623.620.316.818.5
16.521.926.018.116.710.511.910.516.713.010.311.5
15.213.212.212.612.512.212.914.014.313.513.514.8
23.022.923.123.422.922.322.021.520.620.019.919.6
16.016.016.316.516.015.415.114.513.713.113.012.6
0.700.700.710.710.700.690.690.670.670.660.650.64
Rm(21)
1977-010203040506070809101112
16.423.1
8.712.918.638.521.430.144.043.829.143.2
18.720.919.824.820.014.122.823.122.920.817.316.9
11.613.513.517.912.8
6.015.515.414.612.5
9.78.6
16.718.120.022.224.226.329.033.439.145.651.956.9
19.620.120.320.220.320.220.420.921.321.922.623.6
12.612.913.112.912.912.812.812.912.813.113.514.3
0.640.640.650.640.640.630.630.620.600.600.600.61
aam′(21), aaIM ′(21)
1978-010203040506070809101112
51.993.676.599.782.795.170.458.1
138.2125.1
97.9122.7
24.526.125.831.231.128.219.825.626.920.724.521.9
15.810.616.020.321.017.710.216.614.2
8.613.7
9.9
61.364.569.676.983.289.397.4
104.0108.4111.1113.3117.7
24.124.124.424.524.825.325.625.725.625.725.424.6
14.614.414.514.314.314.514.414.414.314.313.912.8
0.610.600.590.580.580.570.560.560.560.560.550.52
1979-010203040506070809101112
166.6137.5138.0101.5134.4149.5159.4142.2188.4186.2183.3176.3
27.323.626.833.420.918.317.825.921.919.217.016.8
13.310.914.122.4
8.45.14.1
13.06.94.32.22.4
123.7130.9136.5141.1147.3153.0155.0155.4155.7157.8162.3164.5
24.124.023.823.523.122.622.121.520.719.518.618.5
12.011.611.210.710.0
9.28.68.07.25.94.84.6
0.500.480.470.460.430.410.390.370.350.300.260.25
RM(21)

69
Table 5. Monthly and 12-mo mov�ng averages (mma) of R, aa, and aaI for July 1868–present and the rat�o aaI/aa (Cont�nued).
Date(Yr-Mo)
Monthly Values 12-mma Values Ratio
CommentsR aa aaI R aa aaI aaI /aa
1980-010203040506070809101112
159.6155.0126.2164.1179.9157.3136.3135.4155.0164.7147.9174.4
19.717.812.318.315.820.416.916.414.322.923.523.7
6.04.30.24.41.26.84.33.80.89.0
10.49.3
163.9162.6160.9158.7156.3154.7152.8150.3150.1150.2147.7142.7
18.518.117.417.217.718.218.418.519.320.521.622.0
4.74.33.63.64.14.85.05.26.07.38.59.1
0.250.240.210.210.230.260.270.280.310.360.390.41
aam(21), aaIM(21)
1981-010203040506070809101112
114.0141.3135.5156.4127.5
90.9143.8158.7167.3162.4137.5150.1
16.722.827.033.327.218.127.524.220.734.324.419.6
5.110.014.419.815.0
7.614.610.6
6.720.511.76.4
140.3141.5143.0143.4142.9141.5140.3141.0142.8142.2138.8137.8
22.323.123.724.425.024.824.926.327.427.427.327.8
9.610.310.811.512.112.012.213.514.514.614.615.2
0.430.450.460.470.480.480.490.510.530.530.530.55
1982-010203040506070809101112
111.2163.6153.8122.0
82.2110.4106.1107.6118.894.798.1
127.0
23.449.327.532.126.131.442.332.045.828.933.634.4
12.035.414.120.216.020.031.120.734.018.228.122.2
137.0133.3129.2124.3119.9117.3115.2109.4101.0
95.794.794.6
29.029.931.332.132.333.334.033.833.734.234.634.6
16.417.519.020.120.722.023.123.323.624.324.824.8
0.570.590.610.630.640.660.680.690.700.710.720.72
aam(21), aaIM(21)
1983-010203040506070809101112
84.351.066.580.799.291.182.271.850.355.833.333.4
26.640.734.136.332.025.021.325.124.028.734.026.3
21.732.024.726.321.114.511.215.515.419.826.218.5
92.890.385.981.577.170.565.565.867.968.266.864.0
33.432.331.130.230.229.829.428.728.027.727.427.1
23.722.721.721.021.020.720.319.619.018.919.119.2
0.710.700.700.700.700.690.690.680.680.680.700.71
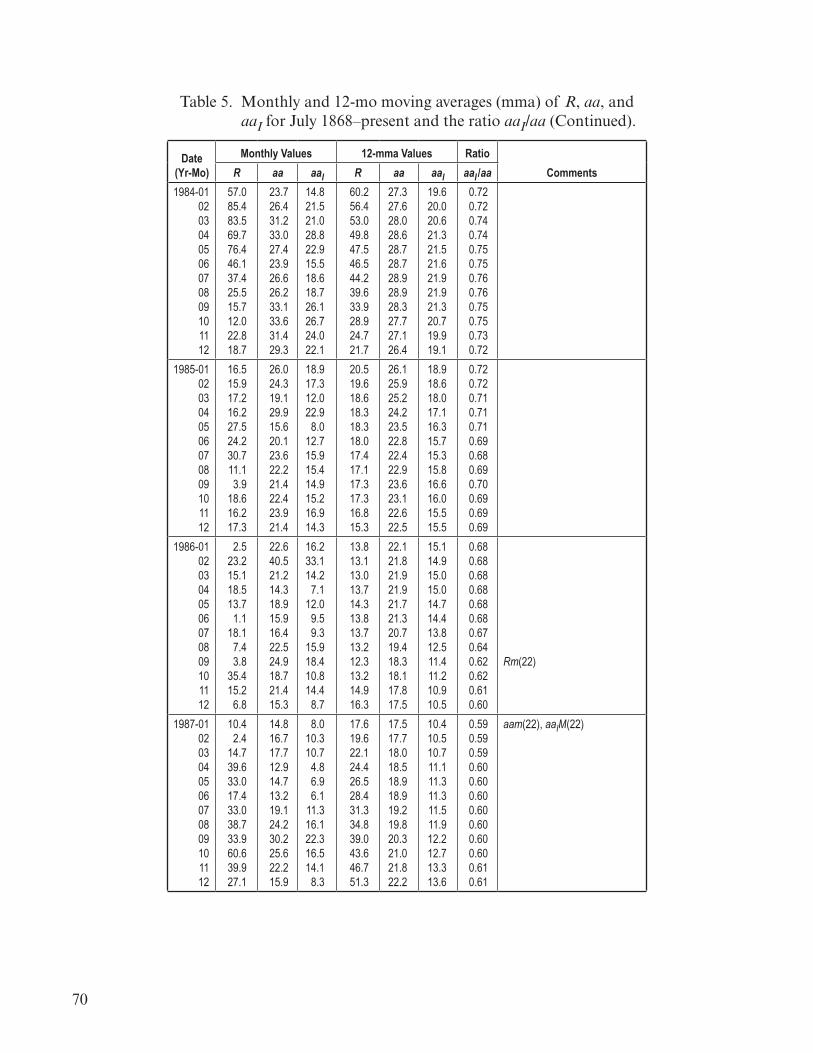
70
Table 5. Monthly and 12-mo mov�ng averages (mma) of R, aa, and aaI for July 1868–present and the rat�o aaI/aa (Cont�nued).
Date(Yr-Mo)
Monthly Values 12-mma Values Ratio
CommentsR aa aaI R aa aaI aaI /aa
1984-010203040506070809101112
57.085.483.569.776.446.137.425.515.712.022.818.7
23.726.431.233.027.423.926.626.233.133.631.429.3
14.821.521.028.822.915.518.618.726.126.724.022.1
60.256.453.049.847.546.544.239.633.928.924.721.7
27.327.628.028.628.728.728.928.928.327.727.126.4
19.620.020.621.321.521.621.921.921.320.719.919.1
0.720.720.740.740.750.750.760.760.750.750.730.72
1985-010203040506070809101112
16.515.917.216.227.524.230.711.13.9
18.616.217.3
26.024.319.129.915.620.123.622.221.422.423.921.4
18.917.312.022.9
8.012.715.915.414.915.216.914.3
20.519.618.618.318.318.017.417.117.317.316.815.3
26.125.925.224.223.522.822.422.923.623.122.622.5
18.918.618.017.116.315.715.315.816.616.015.515.5
0.720.720.710.710.710.690.680.690.700.690.690.69
1986-010203040506070809101112
2.523.215.118.513.7
1.118.1
7.43.8
35.415.2
6.8
22.640.521.214.318.915.916.422.524.918.721.415.3
16.233.114.2
7.112.0
9.59.3
15.918.410.814.4
8.7
13.813.113.013.714.313.813.713.212.313.214.916.3
22.121.821.921.921.721.320.719.418.318.117.817.5
15.114.915.015.014.714.413.812.511.411.210.910.5
0.680.680.680.680.680.680.670.640.620.620.610.60
Rm(22)
1987-010203040506070809101112
10.42.4
14.739.633.017.433.038.733.960.639.927.1
14.816.717.712.914.713.219.124.230.225.622.215.9
8.010.310.7
4.86.96.1
11.316.122.316.514.1
8.3
17.619.622.124.426.528.431.334.839.043.646.751.3
17.517.718.018.518.918.919.219.820.321.021.822.2
10.410.510.711.111.311.311.511.912.212.713.313.6
0.590.590.590.600.600.600.600.600.600.600.610.61
aam(22), aaIM(22)

71
Table 5. Monthly and 12-mo mov�ng averages (mma) of R, aa, and aaI for July 1868–present and the rat�o aaI/aa (Cont�nued).
Date(Yr-Mo)
Monthly Values 12-mma Values Ratio
CommentsR aa aaI R aa aaI aaI /aa
1988-010203040506070809101112
59.040.076.288.060.1
101.8113.8111.6120.1125.1125.1179.2
22.321.824.724.320.319.220.220.521.723.022.425.4
13.313.714.913.911.28.28.69.09.9
10.910.310.8
58.264.671.377.583.893.7
104.3113.7121.2125.3130.4137.6
22.522.421.921.521.421.822.623.224.826.627.127.5
13.513.112.311.611.211.111.511.913.314.915.215.3
0.600.580.560.540.520.510.510.510.540.560.560.56
1989-010203040506070809101112
161.3165.1131.4130.6138.5196.2126.9168.9176.7159.4173.0165.5
33.824.759.931.625.624.014.328.225.731.233.431.2
20.016.147.519.312.9
8.62.1
19.411.217.519.117.3
142.0145.0149.7153.5156.9158.4158.5157.7156.6157.4157.5153.5
27.527.628.128.629.430.130.030.329.828.929.229.2
15.115.215.716.016.717.317.417.516.815.916.116.3
0.550.550.560.560.570.570.580.580.560.550.550.56
RM(22)
1990-010203040506070809101112
177.3130.5140.3140.3132.2105.4149.4200.3125.2145.5131.4129.7
27.437.833.937.425.124.621.628.225.125.117.415.2
14.525.521.124.612.713.4
8.412.613.012.1
5.08.2
150.6152.9152.0149.3147.0143.8140.6140.5142.1142.1141.7143.9
29.529.829.829.528.627.226.125.024.424.023.524.9
16.816.816.616.415.614.614.113.112.412.011.612.9
0.570.560.560.560.550.540.540.520.510.500.490.52
1991-010203040506070809101112
136.9167.5141.9140.0121.3169.7173.7176.3125.3144.1108.2144.4
17.220.137.324.327.356.235.240.830.744.149.728.0
9.96.1
24.411.515.442.120.926.418.631.138.415.0
147.6147.6146.6146.5145.5145.2146.3146.6144.9141.7138.1131.7
26.827.928.729.731.833.734.636.136.736.035.934.7
14.615.716.517.519.721.421.823.023.723.223.222.3
0.540.560.570.590.620.640.630.640.650.640.650.64
aam(22), aaIM(22)
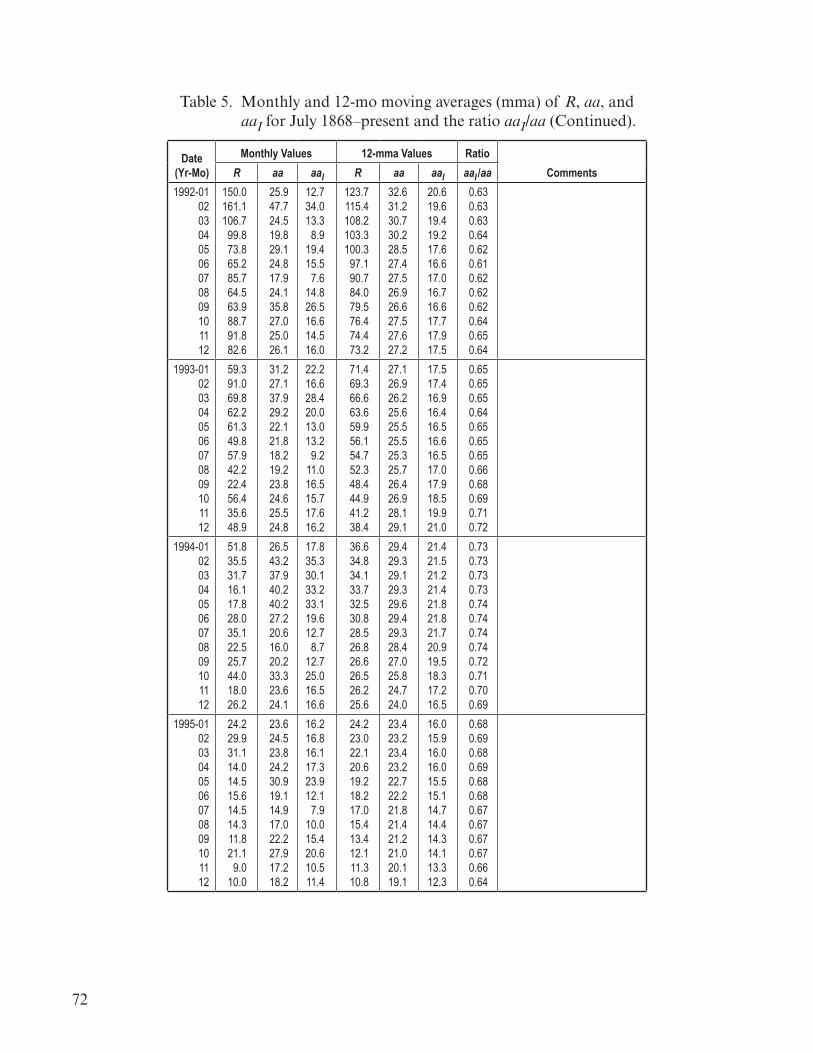
72
Table 5. Monthly and 12-mo mov�ng averages (mma) of R, aa, and aaI for July 1868–present and the rat�o aaI/aa (Cont�nued).
Date(Yr-Mo)
Monthly Values 12-mma Values Ratio
CommentsR aa aaI R aa aaI aaI /aa
1992-010203040506070809101112
150.0161.1106.7
99.873.865.285.764.563.988.791.882.6
25.947.724.519.829.124.817.924.135.827.025.026.1
12.734.013.3
8.919.415.5
7.614.826.516.614.516.0
123.7115.4108.2103.3100.3
97.190.784.079.576.474.473.2
32.631.230.730.228.527.427.526.926.627.527.627.2
20.619.619.419.217.616.617.016.716.617.717.917.5
0.630.630.630.640.620.610.620.620.620.640.650.64
1993-010203040506070809101112
59.391.069.862.261.349.857.942.222.456.435.648.9
31.227.137.929.222.121.818.219.223.824.625.524.8
22.216.628.420.013.013.2
9.211.016.515.717.616.2
71.469.366.663.659.956.154.752.348.444.941.238.4
27.126.926.225.625.525.525.325.726.426.928.129.1
17.517.416.916.416.516.616.517.017.918.519.921.0
0.650.650.650.640.650.650.650.660.680.690.710.72
1994-010203040506070809101112
51.835.531.716.117.828.035.122.525.744.018.026.2
26.543.237.940.240.227.220.616.020.233.323.624.1
17.835.330.133.233.119.612.7
8.712.725.016.516.6
36.634.834.133.732.530.828.526.826.626.526.225.6
29.429.329.129.329.629.429.328.427.025.824.724.0
21.421.521.221.421.821.821.720.919.518.317.216.5
0.730.730.730.730.740.740.740.740.720.710.700.69
1995-010203040506070809101112
24.229.931.114.014.515.614.514.311.821.1
9.010.0
23.624.523.824.230.919.114.917.022.227.917.218.2
16.216.816.117.323.912.1
7.910.015.420.610.511.4
24.223.022.120.619.218.217.015.413.412.111.310.8
23.423.223.423.222.722.221.821.421.221.020.119.1
16.015.916.016.015.515.114.714.414.314.113.312.3
0.680.690.680.690.680.680.670.670.670.670.660.64

73
Table 5. Monthly and 12-mo mov�ng averages (mma) of R, aa, and aaI for July 1868–present and the rat�o aaI/aa (Cont�nued).
Date(Yr-Mo)
Monthly Values 12-mma Values Ratio
CommentsR aa aaI R aa aaI aaI /aa
1996-010203040506070809101112
11.54.49.24.85.5
11.88.2
14.41.60.9
17.913.3
18.820.822.320.514.011.114.718.826.223.516.315.9
12.014.315.614.0
7.44.38.0
11.819.817.2
9.29.0
10.410.1
9.78.58.08.58.48.38.48.89.8
10.4
18.718.819.019.018.818.718.518.518.217.917.818.0
12.012.012.312.312.112.011.811.811.511.211.111.2
0.640.640.650.650.640.640.640.640.630.630.620.62
Rm(23)
1997-010203040506070809101112
5.77.68.7
15.318.512.710.424.451.322.839.041.2
17.421.016.318.415.113.712.113.718.418.718.010.8
10.814.3
9.611.47.96.85.36.39.7
11.39.92.6
10.511.013.516.518.320.322.625.028.331.835.039.0
18.117.917.617.116.516.416.316.015.815.816.016.5
11.210.910.2
9.59.39.18.88.48.38.38.79.3
0.620.610.580.560.560.550.540.530.530.530.540.56
aaIM(23)aam(23)
1998-010203040506070809101112
31.940.354.853.456.370.766.692.292.955.574.081.9
16.816.421.218.028.118.819.327.021.122.426.515.9
9.08.2
12.49.2
19.29.29.9
16.410.513.516.8
5.8
43.748.953.456.559.462.565.467.869.570.573.077.9
17.918.719.419.720.220.721.121.521.822.021.720.9
9.610.210.610.711.111.511.812.012.312.512.011.0
0.540.550.550.540.550.560.560.560.560.570.550.53
1999-010203040506070809101112
62.066.368.863.7
106.4137.7113.593.771.5
116.7133.2
84.6
20.821.323.521.315.812.716.926.231.231.325.120.1
11.611.914.012.1
4.60.05.4
15.621.619.612.6
9.9
82.684.683.885.590.593.194.397.5
102.3107.8111.0111.1
20.520.420.821.621.922.022.322.822.922.823.324.2
10.410.210.611.311.411.411.712.011.911.511.912.8
0.510.500.510.520.520.520.520.530.520.500.510.53

74
Table 5. Monthly and 12-mo mov�ng averages (mma) of R, aa, and aaI for July 1868–present and the rat�o aaI/aa (Cont�nued).
Date(Yr-Mo)
Monthly Values 12-mma Values Ratio
CommentsR aa aaI R aa aaI aaI /aa
2000-010203040506070809101112
90.1112.9138.5125.5121.6124.9170.1130.5109.7
99.4106.8104.4
24.229.417.125.125.024.931.124.330.228.129.116.1
13.717.9
4.413.013.112.816.912.018.817.217.9
5.0
112.9116.8119.9120.8119.0118.7119.8118.6116.3114.6112.7112.0
25.325.825.725.525.625.625.124.324.225.125.124.5
13.814.113.813.613.713.813.312.512.513.513.613.0
0.550.550.540.530.540.540.530.510.520.540.540.53
RM(23)
2001-010203040506070809101112
95.680.6
113.5107.7
96.6134.0
81.8106.4150.7125.5106.5132.2
18.014.730.233.017.818.218.719.922.731.424.419.5
7.34.7
18.721.7
7.05.78.68.79.4
19.313.2
7.1
108.7104.0104.8107.5108.6109.8111.7113.6114.1114.0115.5114.6
23.723.022.522.322.322.222.322.522.321.621.421.3
12.411.911.411.111.010.910.910.910.710.0
9.79.7
0.520.520.510.500.490.490.490.480.480.460.450.46
2002-010203040506070809101112
114.1107.4
98.4120.7120.8
88.399.6
116.4109.6
97.595.081.6
16.820.020.226.019.914.219.922.521.438.129.324.4
5.28.79.4
14.18.03.89.0
10.810.027.318.614.3
113.5114.6113.3110.5108.8106.2102.7
98.794.690.585.282.0
21.221.421.421.622.122.523.023.824.925.927.630.1
9.69.79.9
10.210.811.312.012.914.215.417.420.0
0.450.450.460.470.490.500.520.540.570.590.630.66
2003-010203040506070809101112
79.746.061.160.054.677.483.372.748.765.567.346.5
24.231.335.234.952.740.232.436.430.752.244.730.4
14.222.926.125.843.930.322.326.722.242.935.322.0
80.878.374.070.167.665.061.860.159.658.256.754.8
31.732.833.834.736.036.937.738.037.236.234.131.6
21.722.924.025.226.527.628.528.928.227.225.222.7
0.680.700.710.730.740.750.760.760.760.750.740.72
aam(23), aaIM(23)

75
Table 5. Monthly and 12-mo mov�ng averages (mma) of R, aa, and aaI for July 1868–present and the rat�o aaI/aa (Cont�nued).
Date(Yr-Mo)
Monthly Values 12-mma Values Ratio
CommentsR aa aaI R aa aaI aaI /aa
2004-010203040506070809101112
37.345.849.139.341.543.251.140.927.748.043.517.9
38.123.925.220.116.615.929.916.315.616.336.422.6
30.115.516.612.0
8.47.6
21.28.18.07.8
28.115.5
52.049.347.145.543.841.640.239.237.535.935.335.2
30.429.528.025.924.123.423.123.122.822.623.023.7
21.820.919.617.515.815.215.014.914.814.615.115.8
0.720.710.700.680.660.650.650.650.650.650.660.67
2005-010203040506070809101112
31.329.224.524.242.739.340.136.421.9
8.718.041.1
39.021.621.418.828.419.724.024.031.815.517.117.1
31.314.014.011.420.111.615.816.024.5
8.810.0
8.9
34.633.933.531.628.928.829.127.425.825.524.923.0
23.623.724.725.324.523.422.120.820.220.019.318.5
15.715.816.817.616.815.814.513.212.712.511.911.2
0.670.670.680.700.690.680.660.630.630.630.620.61
2006-010203040506070809101112
15.34.9
10.630.222.313.912.212.914.410.521.413.6
13.613.615.818.813.715.212.417.415.516.616.824.7
6.67.19.0
11.16.48.35.5
10.58.59.89.5
17.8
20.818.617.417.117.316.315.315.615.614.212.712.1
17.917.116.215.515.615.916.416.716.716.716.716.7
10.610.0
9.18.48.58.89.49.79.79.89.99.8
0.590.580.560.540.540.550.570.580.580.590.590.59
2007-010203040506070809101112
16.910.6
4.83.7
11.712.010.0
6.22.40.91.7
10.1
19.214.416.318.015.012.713.513.217.113.814.012.7
12.17.69.8
11.58.25.86.76.6
10.77.57.65.9
12.011.610.8
9.98.77.77.06.15.9
16.616.516.416.316.115.514.9
9.89.79.69.69.48.88.2
0.590.590.590.590.580.570.55

76
Table 5. Monthly and 12-mo mov�ng averages (mma) of R, aa, and aaI for July 1868–present and the rat�o aaI/aa (Cont�nued).
Date(Yr-Mo)
Monthly Values 12-mma Values Ratio
CommentsR aa aaI R aa aaI aaI /aa
2008-010203
3.42.19.3
16.3
9.8
Note: Monthly values of aa are the adjusted values; i.e., prior to 1957, all monthly values are equal to the original aa value + 3. Monthly values of aaI are the residual values, computed as aaI = aa – aaR, where aaR = 6.3 + 0.0462R, from the straight-line fit of aa versus R, established by the R and aa points for February 1880 (27.2, 7.6) and June 1999 (137.7, 12.7). All aa values lie on or above this line and all aaI values are greater than or equal to zero. Values marked with an apostrophe denote alternate minimum values in the vicinity of E(Rm), as in cycles 17, 20, and 21, and alternate maximum values post-E(RM), as in cycles 12 and 13.

77
REFERENCES
1. Ch�rkov, N.P.: “Correlat�on of Geomagnet�c Act�v�ty and Solar W�nd Veloc�ty w�th Solar Act�v�ty,” Geomag. and Aeron., Vol. 19, pp. 143–145, 1979.
2. Hundhausen, A.J.: “An Interplanetary V�ew of Coronal Holes,” �n Coronal Holes and High-Speed Wind Streams, ed�ted by J.B. Z�rker, Colorado Assoc�ated Un�vers�ty Press, pp. 225–329, 1977.
3. Z�rker, J.B.: “Coronal Holes and H�gh-Speed Streams,” Rev. Geophys. and Space Phys., Vol. 15, pp. 257–269, 1977.
4. Suess, S.T.: “Models of Coronal Hole Flows,” Space Sci. Rev., Vol. 23, 159–200, 1979.
5. Feynman, J.: “Geomagnet�c and Solar W�nd Cycles, 1900–1975,” J. Geophys. Res., Vol. 87, pp. 6153–6162, 1982.
6. Sargent, H.H. III: “Recurrent Geomagnet�c Act�v�ty: Ev�dence for Long-L�ved Stab�l�ty �n Solar W�nd Structure,” J. Geophys. Res., Vol. 90, pp. 1425–1428, 1985.
7. Russell, C.T.; and Mull�gan, T.: “The 22-Year Var�at�on of Geomagnet�c Act�v�ty: Impl�cat�ons for the Polar Magnet�c F�eld of the Sun,” Geophys. Res. Letts., Vol. 22, pp. 3287–3288, 1995.
8. Gaz�s, P.R.; Ahluwal�a, H.S.; F�kan�, M.M.; and xue, S.S.: “Long Term Var�ab�l�ty of the Solar W�nd Speed,” Solar Wind 8, NASA Ames Research Center, p. 89, 1995.
9. Crooker, N.U.; and McAll�ster, A.H.: “Trans�ents Assoc�ated w�th Recurrent Storms,” J. Geophys. Res., Vol. 102, pp. 14041–14047, 1997.
10. Watar�, S.; and Watanabe, T.: “The Solar Dr�vers of Geomagnet�c D�sturbances dur�ng Solar M�n�mum,” Geophys. Res. Letts., Vol. 25, pp. 2489–2492, 1998.
11. R�chardson, I.G.; Cl�ver, E.W.; and Cane, H.V.: “Sources of Geomagnet�c Act�v�ty over the Solar Cycle: Relat�ve Importance of Coronal Mass Eject�ons, H�gh-Speed Streams, and Slow Solar W�nd,” J. Geophys. Res., Vol. 105, pp. 18203–18214, 2000.
12. Rangarajan, G.K.; and Barreto, L.M.: “Long Term Var�ab�l�ty �n Solar W�nd Veloc�ty and IMF Intens�ty and the Relat�onsh�p between Solar W�nd Parameters & Geomagnet�c Act�v�ty,” Earth Planets Space, Vol. 52, pp. 121–132, 2000.

78
13. R�chardson, I.G.; Cane, H.V.; and Cl�ver, E.W.: “Sources of Geomagnet�c Act�v�ty dur�ng Nearly Three Solar Cycles (1972-2000),” J. Geophys. Res., Vol 107, pp. 1187–1199,
do�:10.1029/2001JA000504, 2002.
14. W�lson, R.M.; and Hathaway, D.H.: “On the Relat�onsh�p between Solar W�nd Speed, Geomagnet�c Act�v�ty and the Solar Cycle Us�ng Annual Values,” NASA/TP—2008–215249, Marshall Space Fl�ght Center, AL, February 2008.
15. Svalgaard, L.; Cl�ver, E.W.; and Le Sager, P.: “IHV: A New Long-Term Geomagnet�c Index,” Adv. Space Res., Vol. 34, pp. 436–441, 2004.
16. W�lson, R.M.; and Hathaway, D.H.: “An Exam�nat�on of Selected Geomagnet�c Ind�ces �n Relat�on to the Sunspot Cycle,” NASA/TP—2006–214711, Marshall Space Fl�ght Center, AL, ava�lable at <http://trs.n�s.nasa.gov/arch�ve/00000741/>, December 2006.
17. Hathaway, D.H.; W�lson, R.M.; and Re�chmann, E.J.: “A Survey and Synthes�s of Solar Cycle Pred�ct�on Techn�ques,” J. Geophys. Res., Vol. 104, pp. 22,375–22,388, 1999.
18. W�lson, R.M.; and Hathaway, D.H.: “Ant�c�pat�ng Cycle 24 M�n�mum and Its Consequences,” NASA/TP—2007–215134, Marshall Space Fl�ght Center, AL, ava�lable at <http://trs.n�s.nasa.gov/arch�ve/00000768>, November 2007.
19. Waldme�er, M.: Ergebnisse und Probleme der Sonnenforschung, 2d Ed., Le�pz�g, p. 154, 1955.
20. Hathaway, D.H.; W�lson, R.M.; and Re�chmann, E.J.: “The Shape of the Sunspot Cycle,” Solar Phys., Vol. 151, pp. 177–190, 1994.
21. W�lson, R.M.; Hathaway, D.H.; and Re�chmann, E.J.: “On the Importance of Cycle M�n�mum �n Sunspot Cycle Pred�ct�on,” NASA/TP-3648, Marshall Space Fl�ght Center, AL, ava�lable at <http://trs.n�s.nasa.gov/arch�ve/00000335/>, August 1996.
22. Hathaway, D.H.; W�lson, R.M.; and Re�chmann, E.J.: “Group Sunspot Numbers: Sunspot Cycle Character�st�cs,” Solar Phys., Vol. 211, pp. 357–370, 2002.
23. Hathaway, D.H.; and W�lson, R.M.: “What the Sunspot Record Tells Us About Space Cl�mate,” Solar Phys., Vol. 224, pp. 5–19, 2004.
24. Lap�n, L.L.: Statistics for Modern Business Decisions, 2d Ed., Harcourt Brace Jovanov�ch, Inc., New York, p. 486, 1978.
25. Langley, R.: Practical Statistics Simply Explained, Rev�sed Ed., Dover Publ., Inc., New York, p. 322, 1970.
26. W�lson, R.M.; and Hathaway, D.H.: “On the Relat�on between Spotless Days and the Sunspot Cycle,” NASA/TP—2005–213608, Marshall Space Fl�ght Center, AL, ava�lable at <http://trs.n�s.nasa.gov/arch�ve/00000695/ >, January 2005.

79
27. W�lson, R.M.; and Hathaway, D.H.: “On the Relat�onsh�p between Spotless Days and the Sunspot Cycle: A Supplement,” NASA/TP—2006–214601, Marshall Space Fl�ght Center, AL, ava�lable at <http://trs.n�s.nasa.gov/arch�ve/00000735/>, August 2006.
28. Ever�tt, B.S.: The Analysis of Contingency Tables, John W�ley & Sons, Inc., New York, p. 15, 1977.
29. Ehrenberg, A.S.C.: A Primer in Data Reduction, John W�ley & Sons, Inc., New York, p. 200, 1982.
30. Ohl, A.I.: “Forecast of Sunspot Max�mum Number of Cycle 20,” Solice Danie, Vol. 9, p. 84, 1966.
31. D�kpat�, M.; de Toma, G.; and G�lman, P.A.: “Pred�ct�ng the Strength of Solar Cycle 24 Us�ng
a Flux-Transport Dynamo-Based Tool,” Geophys. Res. Letts., Vol. 33, p. L05102, do�:10.1029/2005GL025221, 2006.
32. Hathaway, D.H.; and W�lson, R.M.: “Geomagnet�c Act�v�ty Ind�cates Large Ampl�tude for Sun-spot Cycle 24,” Geophys. Res. Letts., Vol. 33, p. L18101, do�:10.1029/2006GL027053, 2006.

80
REPORT DOCUMENTATION PAGE Form Approved
OMB No. 0704-0188
Public reporting burden for this collection of information is estimated to average 1 hour per response, including the time for reviewing instructions, searching existing data sources, gathering and maintain-ing the data needed, and completing and reviewing the collection of information. Send comments regarding this burden estimate or any other aspect of this collection of information, including suggestions for reducing this burden, to Washington Headquarters Services, Directorate for Information Operation and Reports, 1215 Jefferson Davis Highway, Suite 1204, Arlington, VA 22202-4302, and to the Office of Management and Budget, Paperwork Reduction Project (0704-0188), Washington, DC 20503
1. AGENCY USE ONLY (Leave Blank) 2. REPORT DATE 3. REPORT TYPE AND DATES COVERED
4. TITLE AND SUBTITLE 5. FUNDING NUMBERS
6. AUTHORS
7. PERFORMING ORGANIZATION NAME(S) AND ADDRESS(ES) 8. PERFORMING ORGANIZATION REPORT NUMBER
9. SPONSORING/MONITORING AGENCY NAME(S) AND ADDRESS(ES) 10. SPONSORING/MONITORING AGENCY REPORT NUMBER
11. SUPPLEMENTARY NOTES
12a. DISTRIBUTION/AVAILABILITY STATEMENT 12b. DISTRIBUTION CODE
13. ABSTRACT (Maximum 200 words)
14. SUBJECT TERMS 15. NUMBER OF PAGES
16. PRICE CODE
17. SECURITY CLASSIFICATION OF REPORT
18. SECURITY CLASSIFICATION OF THIS PAGE
19. SECURITY CLASSIFICATION OF ABSTRACT
20. LIMITATION OF ABSTRACT
NSN 7540-01-280-5500 Standard Form 298 (Rev. 2-89)Prescribed by ANSI Std. 239-18298-102
Unclassified Unclassified Unclassified Unlimited
On the Relationship between Solar Wind Speed, Earthward-Directed Coronal Mass Ejections, Geomagnetic Activity, and the Sunspot Cycle Using 12-Month Moving Averages
Robert M. Wilson and David H. Hathaway
George C. Marshall Space Flight CenterMarshall Space Flight Center, AL 35812
National Aeronautics and Space AdministrationWashington, DC 20546–0001
Prepared for the Science and Exploration Vehicle Office, Science and Mission Systems Office
Unclassified-UnlimitedSubject Category 92Availability: NASA CASI 301–621–0390
90
M–1233
Technical PublicationJune 2008
NASA/TP—2008–215413
Sun, sunspot/geomagnetic cycle, coronal mass ejections, solar wind speed, solar cycle prediction
For 1996 –2006 (cycle 23), 12-month moving averages of the aa geomagnetic index strongly correlate (r = 0.92) with 12-month moving averages of solar wind speed, and 12-month moving averages of the number of coro-nal mass ejections (CMEs) (halo and partial halo events) strongly correlate (r = 0.87) with 12-month moving averages of sunspot number. In particular, the minimum (15.8, September/October 1997) and maximum (38.0, August 2003) values of the aa geomagnetic index occur simultaneously with the minimum (376 km s–1) and maximum (547 km s–1) solar wind speeds, both being strongly correlated with the following recurrent compo-nent (due to high-speed streams). The large peak of aa geomagnetic activity in cycle 23, the largest on record, spans the interval late 2002 to mid 2004 and is associated with a decreased number of halo and partial halo CMEs, whereas the smaller secondary peak of early 2005 seems to be associated with a slight rebound in the number of halo and partial halo CMEs. Based on the observed aaM during the declining portion of cycle 23, RM for cycle 24 is predicted to be larger than average, being about 168 ± 60 (the 90% prediction interval), whereas based on the expected aam for cycle 24 (≥14.6), RM for cycle 24 should measure ≥118 ± 30, yielding an overlap of about 128 ± 20.

The NASA STI Program…in Profile
Since its founding, NASA has been dedicated to the advancement of aeronautics and space science. The NASA Scientific and Technical Information (STI) Program Office plays a key part in helping NASA maintain this important role.
The NASA STI program operates under the auspices of the Agency Chief Information Officer. It collects, organizes, provides for archiving, and disseminates NASA’s STI. The NASA STI program provides access to the NASA Aeronautics and Space Database and its public interface, the NASA Technical Report Server, thus providing one of the largest collections of aeronautical and space science STI in the world. Results are published in both non-NASA channels and by NASA in the NASA STI Report Series, which includes the following report types:
• TECHNICAL PUBLICATION. Reports of completed research or a major significant phase of research that present the results of NASA programs and include extensive data or theoretical analysis. Includes compilations of significant scientific and technical data and information deemed to be of continuing reference value. NASA’s counterpart of peer-reviewed formal professional papers but has less stringent limitations on manuscript length and extent of graphic presentations.
• TECHNICAL MEMORANDUM. Scientific and technical findings that are preliminary or of specialized interest, e.g., quick release reports, working papers, and bibliographies that contain minimal annotation. Does not contain extensive analysis.
• CONTRACTOR REPORT. Scientific and technical findings by NASA-sponsored contractors and grantees.
• CONFERENCE PUBLICATION. Collected papers from scientific and technical conferences, symposia, seminars, or other meetings sponsored or cosponsored by NASA.
• SPECIAL PUBLICATION. Scientific, technical, or historical information from NASA programs, projects, and missions, often concerned with subjects having substantial public interest.
• TECHNICAL TRANSLATION. English-language translations of foreign scientific and technical material pertinent to NASA’s mission.
Specialized services also include creating custom thesauri, building customized databases, and organizing and publishing research results.
For more information about the NASA STI program, see the following:
• Access the NASA STI program home page at <http://www.sti.nasa.gov>
• E-mail your question via the Internet to <[email protected]>
• Fax your question to the NASA STI Help Desk at 301– 621–0134
• Phone the NASA STI Help Desk at 301– 621–0390
• Write to: NASA STI Help Desk NASA Center for AeroSpace Information 7115 Standard Drive Hanover, MD 21076–1320

National Aeronautics andSpace AdministrationIS20George C. Marshall Space Flight CenterMarshall Space Flight Center, Alabama35812
Robert M. Wilson and David H. HathawayMarshall Space Flight Center, Marshall Space Flight Center, Alabama
NASA/TP—2008–215413
On the Relationship Between Solar Wind Speed, Earthward-Directed Coronal Mass Ejections, Geomagnetic Activity, and the Sunspot Cycle Using 12-Month Moving Averages
June 2008