Embed Size (px)
DESCRIPTION
What is the ‘new oil’? Is it solar energy, wind power, hydrogen? How might it change the way we live in the future?
Citation preview

On The New Oil Gerry Reimer, [email protected]; 2016
Table of Contents 1 ...... Summary .................................................................................................................................. 1 2 ...... The industrial revolution gave us so much, ............................................................................. 2 3 ...... …including carbon dioxide. ...................................................................................................... 2 4 ...... Did we really make enough to alter the atmosphere? ............................................................ 3 5 ...... The supporting evidence ......................................................................................................... 6 6 ...... More evidence specifically pointing at human activity ........................................................... 9 7 ...... The word is out ...................................................................................................................... 10 8 ...... What energy source will replace fossil fuels? ........................................................................ 11 9 ...... The Bornholm green energy project ...................................................................................... 11 10 .... The problem with solar and wind power ............................................................................... 12 11 .... Cottagers have figured this out ............................................................................................. 14 12 .... Storing energy by storing hydrogen ...................................................................................... 16 13 .... How can we use hydrogen efficiently: The fuel cell .............................................................. 18 14 .... Reviewing the big picture ...................................................................................................... 20 15 .... How far have we come? ........................................................................................................ 20 16 .... Enter solar water splitting ..................................................................................................... 22 17 .... A day in a life in 2116 ............................................................................................................. 23 18 .... Conclusion: Different energy, different economy, different society ..................................... 25 19 .... References ............................................................................................................................. 25
1 Summary The industrial age is powered by the burning of fossil fuels, which has increased the level of carbon dioxide in the air enough to cause the earth to warm and the ocean level to rise. Many governments have headed the call to stop burning fossil fuels and move to sustainable energy such as solar and wind power. Hand-in-hand with this shift is the need to store energy, for use when it’s dark and calm, respectively. Making and storing hydrogen appears to be a good way to store energy. Hydrogen can be used not only to heat and electrify our houses and industries, but also for transportation. Solar and wind power are taking hold. This thin edge of the wedge awaits the fruits of extensive global research into new ways to use the sun’s energy. Enough is now known to paint a new picture of the energy landscape that, a hundred years from now may reveal much more than just ‘the new oil’.

On The New Oil Gerry Reimer, [email protected]; 2016
Page 2 of 27
2 The industrial revolution gave us so much, As a boy in the late 1800’s, my grandfather enjoyed summer buggy rides from his farm town to the big city to buy supplies. But in winter it was a different story. With temperatures plunging to where centigrade and ferinheight scales meet (-40 °), the return trip became a two-day journey of survival under buffalo-skin blankets while on the lookout for approaching winter storms.
Many years later, in the 1950’s, the same trip in our family car took less than an hour – one of the benefits of the industrial age.
Back in the 1950’s we had a coal-burning furnace to keep the house warm in winter. As a young boy, I liked to watch the coal tumble down the shoot into the basement. I helped my dad shovel it into the large cast iron furnace. A big fan blew the hot air around the furnace and through metal ducts to all corners of the house.
We didn’t think too much about what was going up the chimney from that furnace into the air outside. In fact the smoke from our furnace and that from all the other furnaces in the neighbourhood quickly disappeared into the cold prairie wind.
Not so in other parts of the world. In congested cities like London England, for example, millions of coal fires burned throughout the winter to keep people warm. With little wind to blow the smoke away, it hung in the air, and a new word – smog, came into existence as early as 1905.
The smog was caused by the minor byproducts of coal combustion including soot, oxides of nitrogen (NO and NO2), and oxides of sulfur (SO2 and SO3).
3 …including carbon dioxide. The major byproduct of coal combustion, carbon dioxide (CO2), did not contribute to the smog problem. But CO2 did not hide under the radar for long.
Carbon dioxide is a colourless, odourless gas that comprises less than 0.1 percent of the earth’s atmosphere. Just like cooling water below 0 °C gives ice, cooling carbon dioxide below -60 °C gives dry ice. I remember one of my teachers putting some in a glass of water. We watched as it bubbled away, producing a spooky white water vapour fog that overflowed down the sides of the glass.
Scientists wondered whether the vast quantities of carbon dioxide released during the combustion of coal and other fossil fuels might have an effect on the environment. They realized decades ago that carbon dioxide is a greenhouse gas, capable of acting like a blanket to keep the sun’s heat in (Brown 1954). This raised the possibility that the large amounts of CO2 released into the air by burning fossil fuels might cause the earth to warm up.
To investigate this, scientists began monitoring the concentration of CO2 in the air in the late 1950’s (Keeling 1998). They found that it did increase, year by year, and is still on the rise today. At the time, this begged some big questions including:
1) Is this increase in CO2 concentration caused by humans burning fossil fuels?

On The New Oil Gerry Reimer, [email protected]; 2016
Page 3 of 27
2) Or are we looking at natural variability, like tidal ebb and flow?
4 Did we really make enough to alter the atmosphere? To answer these questions, scientists needed to find air samples that were thousands of years old. Fortunately they were available in ice cores extracted from arctic icecaps. One of the deepest cores was obtained from Vostok Antarctica (see red arrow in Figure 1). A metre-long section of an ice core is shown in Figure 2. The black band at the near end of this ice core is a layer of volcanic ash that blew across the arctic ice cap possibly thousands of years ago, illustrating that these ice cores present historical records of events past. Another interesting feature of these ice cores is that they contain tiny air bubbles as shown in Figure 3, which are as old as the ice itself. The Vostok ice core was obtained by drilling 3,623 metres into the icecap, stopping a few metres above the bedrock. The ice at the bottom end of the core is over 400,000 years old1, as is the air trapped in it’s bubbles.
Figure 1 Location of the Vostoc ice core (Petit 1999).
1 http://cdiac.ornl.gov/trends/co2/vostok.html

On The New Oil Gerry Reimer, [email protected]; 2016
Page 4 of 27
Figure 2 Arctic ice core; 1 m long 2
Figure 3. Photo of a small piece of ice from an ice core showing trapped ancient air bubbles (Lowe 2001).
2https://www.google.ca/search?q=West+Antarctic+Ice+Sheet+Divide&biw=1474&bih=780&source=lnms&tbm=isch&sa=X&ei=Yo6dVZetD8Th-QGw56aQBQ&ved=0CAcQ_AUoAg#imgrc=z34Hlslov9a_VM%3A
On The New Oil Gerry Reimer, [email protected]; 2016
Page 5 of 27
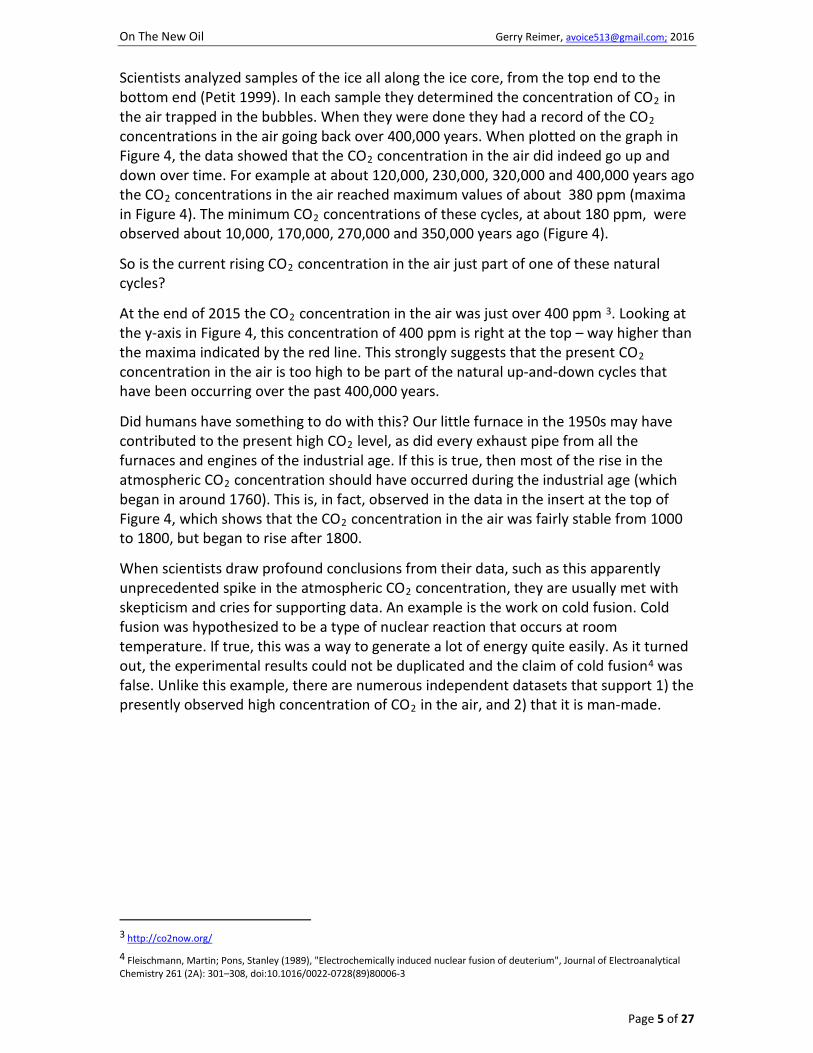
Scientists analyzed samples of the ice all along the ice core, from the top end to the bottom end (Petit 1999). In each sample they determined the concentration of CO2 in the air trapped in the bubbles. When they were done they had a record of the CO2 concentrations in the air going back over 400,000 years. When plotted on the graph in Figure 4, the data showed that the CO2 concentration in the air did indeed go up and down over time. For example at about 120,000, 230,000, 320,000 and 400,000 years ago the CO2 concentrations in the air reached maximum values of about 380 ppm (maxima in Figure 4). The minimum CO2 concentrations of these cycles, at about 180 ppm, were observed about 10,000, 170,000, 270,000 and 350,000 years ago (Figure 4).
So is the current rising CO2 concentration in the air just part of one of these natural cycles?
At the end of 2015 the CO2 concentration in the air was just over 400 ppm 3. Looking at the y-axis in Figure 4, this concentration of 400 ppm is right at the top – way higher than the maxima indicated by the red line. This strongly suggests that the present CO2 concentration in the air is too high to be part of the natural up-and-down cycles that have been occurring over the past 400,000 years.
Did humans have something to do with this? Our little furnace in the 1950s may have contributed to the present high CO2 level, as did every exhaust pipe from all the furnaces and engines of the industrial age. If this is true, then most of the rise in the atmospheric CO2 concentration should have occurred during the industrial age (which began in around 1760). This is, in fact, observed in the data in the insert at the top of Figure 4, which shows that the CO2 concentration in the air was fairly stable from 1000 to 1800, but began to rise after 1800.
When scientists draw profound conclusions from their data, such as this apparently unprecedented spike in the atmospheric CO2 concentration, they are usually met with skepticism and cries for supporting data. An example is the work on cold fusion. Cold fusion was hypothesized to be a type of nuclear reaction that occurs at room temperature. If true, this was a way to generate a lot of energy quite easily. As it turned out, the experimental results could not be duplicated and the claim of cold fusion4 was false. Unlike this example, there are numerous independent datasets that support 1) the presently observed high concentration of CO2 in the air, and 2) that it is man-made.
3 http://co2now.org/
4 Fleischmann, Martin; Pons, Stanley (1989), "Electrochemically induced nuclear fusion of deuterium", Journal of Electroanalytical Chemistry 261 (2A): 301–308, doi:10.1016/0022-0728(89)80006-3

On The New Oil Gerry Reimer, [email protected]; 2016
Page 6 of 27
Figure 4 CO2 concentration in the air mainly from ice core data 5.
5 The supporting evidence Firstly, given that CO2 is a greenhouse gas, we would expect that the average temperature of the earth would increase if the CO2 concentration in the air increases. This has been observed as shown in Figure 5. This chart shows that the air temperature near the earth’s surface has been slowly increasing since about 1980. The y-axis in this graph is the difference between a reference temperature and the annual average air temperature over a large area such as North America or the Pacific Ocean (Brohan 2006).
Figure 5. Published records of surface air temperature change over large regions (IPCC 2007 pg 101)
5 https://www.google.ca/search?q=West+Antarctic+Ice+Sheet+Divide&biw=1474&bih=780&source=lnms&tbm=isch&sa=X&ei=Yo6dVZetD8Th-QGw56aQBQ&ved=0CAcQ_AUoAg#tbm=isch&q=carbon+dioxide+variations&imgrc=Tk9fj0v49sWt_M%3A
Maxima
Minima

On The New Oil Gerry Reimer, [email protected]; 2016
Page 7 of 27
Secondly, if the air above the oceans is warming up, this heat should be transferred to the oceans, causing the surface water temperatures to increase. This has been observed since about 1980 as shown by the heat content data in Figure 6.
Figure 6. Estimates of annual global mean upper (0 to 700 m) ocean heat content based on observed ocean temperatures (1 ZJ = 1021 Joules). Uncertainties are shaded. Ocean temperature is closely related to ocean heat content. Data before 1950 is not sufficiently accurate to be of use (IPCC 2013 pg 262).
Thirdly, as the temperature of water increases, so does it’s volume due to thermal expansion6 (IPCC 2007 pg 7). This has also been observed as shown by the rising sea level data in Figure 7.
6 Melting of glaciers and icecaps also contributes to rising sealevels

On The New Oil Gerry Reimer, [email protected]; 2016
Page 8 of 27
Figure 7 Compilation of sealevel data (purple), tide gauge data (blue, red and green), altimeter data (light blue) and central estimates and likely ranges for projections of global mean sea level rise from mathematical models (blue and red at right), all relative to pre-industrial values (IPCC 2013 pg 65)
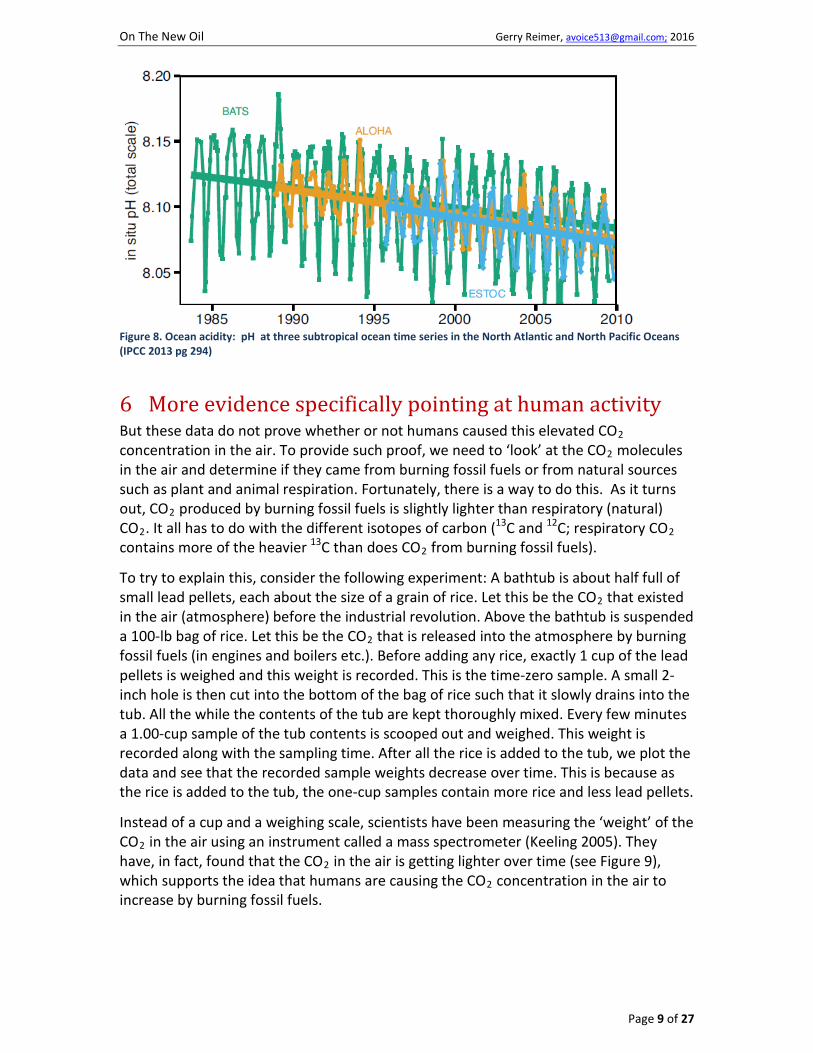
Fourthly, yet another expectation that comes with an increase in atmospheric CO2 concentration is an increase in the acidity (decrease in pH) of the oceans due to the reaction of CO2 with water to form carbonic acid:
CO2 + H2O ↔ H2CO3
The available data shows that the oceans are becoming more acidic (pH is decreasing as shown in Figure 8).
All of these data provide further independent evidence that the increase in atmospheric CO2 concentration occurring during the past 200 years is real and not due to some measurement error.
On The New Oil Gerry Reimer, [email protected]; 2016
Page 9 of 27
Figure 8. Ocean acidity: pH at three subtropical ocean time series in the North Atlantic and North Pacific Oceans (IPCC 2013 pg 294)
6 More evidence specifically pointing at human activity But these data do not prove whether or not humans caused this elevated CO2 concentration in the air. To provide such proof, we need to ‘look’ at the CO2 molecules in the air and determine if they came from burning fossil fuels or from natural sources such as plant and animal respiration. Fortunately, there is a way to do this. As it turns out, CO2 produced by burning fossil fuels is slightly lighter than respiratory (natural) CO2. It all has to do with the different isotopes of carbon (13C and 12C; respiratory CO2 contains more of the heavier 13C than does CO2 from burning fossil fuels).
To try to explain this, consider the following experiment: A bathtub is about half full of small lead pellets, each about the size of a grain of rice. Let this be the CO2 that existed in the air (atmosphere) before the industrial revolution. Above the bathtub is suspended a 100-lb bag of rice. Let this be the CO2 that is released into the atmosphere by burning fossil fuels (in engines and boilers etc.). Before adding any rice, exactly 1 cup of the lead pellets is weighed and this weight is recorded. This is the time-zero sample. A small 2-inch hole is then cut into the bottom of the bag of rice such that it slowly drains into the tub. All the while the contents of the tub are kept thoroughly mixed. Every few minutes a 1.00-cup sample of the tub contents is scooped out and weighed. This weight is recorded along with the sampling time. After all the rice is added to the tub, we plot the data and see that the recorded sample weights decrease over time. This is because as the rice is added to the tub, the one-cup samples contain more rice and less lead pellets.
Instead of a cup and a weighing scale, scientists have been measuring the ‘weight’ of the CO2 in the air using an instrument called a mass spectrometer (Keeling 2005). They have, in fact, found that the CO2 in the air is getting lighter over time (see Figure 9), which supports the idea that humans are causing the CO2 concentration in the air to increase by burning fossil fuels.

On The New Oil Gerry Reimer, [email protected]; 2016
Page 10 of 27
Figure 9. The decreasing δ13C over time indicates that the 13C/12C stable isotope ratio of CO2 is decreasing and that CO2 in the air is getting lighter with time. Data from IPCC 2013 pg 476.
7 The word is out Based on the weight of evidence touched upon in the previous pages, the Intergovernmental Panel on Climate Change7 has stated:
“Human influence on the climate system is clear, and recent anthropogenic (man-made) emissions of greenhouse gases are the highest in history. Recent climate changes have had widespread impacts on human and natural systems.”
And
“Warming of the climate system is unequivocal, and since the 1950s, many of the observed changes are unprecedented over decades to millennia. The atmosphere and ocean have warmed, the amounts of snow and ice have diminished, and sea level has risen.” (IPCC 2014, pg 2).
World leaders have listened:
1) “The G7 leading industrial nations have agreed to cut greenhouse gases by phasing out the use of fossil fuels by the end of the century, the German chancellor, Angela Merkel, has announced” (2015)8.
2) “We know that technology based on the use of highly polluting fossil fuels – especially coal, but also oil and, to a lesser degree, gas – needs to be progressively replaced without delay. Until greater progress is made in developing widely accessible sources of renewable energy, it is legitimate to choose the lesser of two evils or to find short-term solutions” (Pope Francis9 2015).
3) Denmark is committed to becoming fossil fuel free by 2050 (Sovacool 2015).
7 http://www.ipcc.ch/organization/organization.shtml
8 http://www.theguardian.com/world/2015/jun/08/g7-leaders-agree-phase-out-fossil-fuel-use-end-of-century
9 http://www.theguardian.com/environment/2015/jun/18/eight-things-we-learned-from-the-popes-climate-change-encyclical

On The New Oil Gerry Reimer, [email protected]; 2016
Page 11 of 27
8 What energy source will replace fossil fuels? We don’t have to look far to see either wind turbines or solar panels dotting the landscape. The sun’s energy that lands on the earth in one hour is enough to power the entire planet for more than a year (Lewis 2008). Put another way, covering only 0.1% of a sunny, i.e. desert, region of the earth’s surface with 10 percent-efficient solar cells would provide enough energy to satisfy the current global energy demand (Modestino 2015).
Wind energy is also important, especially at higher latitudes where the sun isn’t so bright.
So it would appear that we can shift from fossil fuels to solar and wind power. The community on Bornholm Island has come a long way in adopting these new forms of energy.
9 The Bornholm green energy project The Danish island of Bornholm is 40 km off the coast of Sweden. It is about the size of Greater Vancouver Canada, Baltimore USA or the Isle of Man UK. It’s latitude is similar to that of Moscow, Belfast, and the south end of the Alaska pan handle, so lots of energy is needed to keep the houses warm in winter. In the past, Bornholm has received it’s electricity via a cable running under the sea from Sweden. Occasionally a ship’s anchor would snag and break the cable, causing a weeks-long power outage while it was being repaired (Kumagai 2013). So the people of Bornholm were fairly receptive to the idea of generating their own energy. Almost a decade ago they began install wind turbines, solar panels and ‘bio’ generating plants10, as shown in Figure 10. But despite all this effort, wind and solar power account for only up to 30 % of the electricity consumed on the island (Wu 2014), with the majority of the power being generated by the thermal power plants burning biofuels and fossil fuels. While installing more wind turbines and solar panels would help, the main problem in relying solely on solar and wind energy is the simple fact that they don’t produce power at night or when calm, respectively.
10 burning bio gas (methane) and straw

On The New Oil Gerry Reimer, [email protected]; 2016
Page 12 of 27
Figure 10. Electricity generation on Bornholm Island (Kumagai 2013). Illustration: Bryan Christie Design
10 The problem with solar and wind power Hydro and fossil fuel power plants produce electricity 24/7, and the electricity output can be varied to match the hourly ups and downs in the demand. Not so with solar and wind energy. Figure 11 illustrates the problem for wind power. The x-axis is time – about 20 days along it’s length. The y-axis is power, e.g. megawatts (MW). The red line tracks power consumption of a city or town; it rises and falls in 24-hour cycles – the high points are during the days when people are cooking and heating their homes, and the low points are at night. The blue area represents the available wind power. The large blue hump on the left going up to 4,000 energy units resulted from a few windy days. On those days, the amount of power generated by the wind turbines was more than enough to meet the electricity demand (because the blue area is higher than the red line). But on either side of this blue hump the wind was calm, and the turbines spun slowly and produced very little electricity.

On The New Oil Gerry Reimer, [email protected]; 2016
Page 13 of 27
Figure 11. Sporadic availability of wind power compared to daily actual power demand. Data from Denmark. X-axis is time (~ 20 days). Y-axis is power. (EcoGrid 2008)
A similar situation of extreme variability exists for solar power. Figure 12 shows solar power generated in Germany over a year (blue line), and the household and industrial power consumed (red line). Each blue dot is the average solar power generated in one day. Zero on the x-axis corresponds to January 1, and day 365 at the right end of the x-axis corresponds to the last day in December. Just looking at this graph, it’s easy to see the bell-shaped curve of the blue data, with the top of the bell at the height of summer, and the bottom of the bell in the winter months. This is because in summer, the northern hemisphere gets a little closer to the sun, and in the winter months it moves back a little. This seasonal variability of solar power is not a good thing given that our energy needs are relatively constant throughout the year, as indicated by the red band that runs across the graph in Figure 12.

On The New Oil Gerry Reimer, [email protected]; 2016
Page 14 of 27
Figure 12. Solar power and power consumption in Germany11. The dips in the red lines correspond to weekends.
Another problem with the sun is that it is shaded by every cloud that passes in front of it. My Grandfather knew this only too well when they plodded into a summer thunderstorm that scared the horses and blackened the sky. This is why the blue line in Figure 12 goes up and down like someone on a trampoline. For example, at about day 150, the blue dot is at 25,000 MW, whereas a day or two later, when the sky was clear, it’s up to over 75,000 MW.
The bottom line here is that solar and wind power are like the weather – fickle. Whereas fossil fuel-fired power plants can meet our power demands by matching the ups and downs of the red lines in Figure 11 and Figure 12, solar and wind power cannot do this consistently on their own. This is a huge obstacle in replacing fossil fuel-burning power plants with green energy sources.
11 Cottagers have figured this out To solve this problem, we need to be able to store energy on a massive scale (Wirth 2015). Many cottagers have been doing this for years on a very small scale: their solar panels make electricity when the sun shines, which charges batteries, providing power for lights and small gadgets when the sun goes down. They are storing energy so that it
11 https://carboncounter.wordpress.com/2015/08/11/germany-will-never-run-on-solar-power-here-is-why/

On The New Oil Gerry Reimer, [email protected]; 2016
Page 15 of 27
is available when they need it. How do we scale this up to Bornham Island and beyond? Several large-scale energy storage methods exist:
1) Charge batteries: Huge flow batteries the size of storage tanks have been developed (Cook 2010). However in general, batteries are not very efficient given the large amount of energy needed to make them, and given that they need to be replaced after a relatively short lifetime (Ronge 2015).
2) Pump water uphill and use that water to generate hydro electricity: This would likely not work on Bornholm and other geographically unendowed regions where it is not possible to create an elevated lake. Nonetheless this is currently the most widely used method for large-scale energy storage (Zhao 2014).
3) Compress air into a big tank and use it to drive an electricity-generating turbine: There are only a handful of such plants in operation (Zhao 2014). Use of huge underground caverns to store compressed air has been proposed.
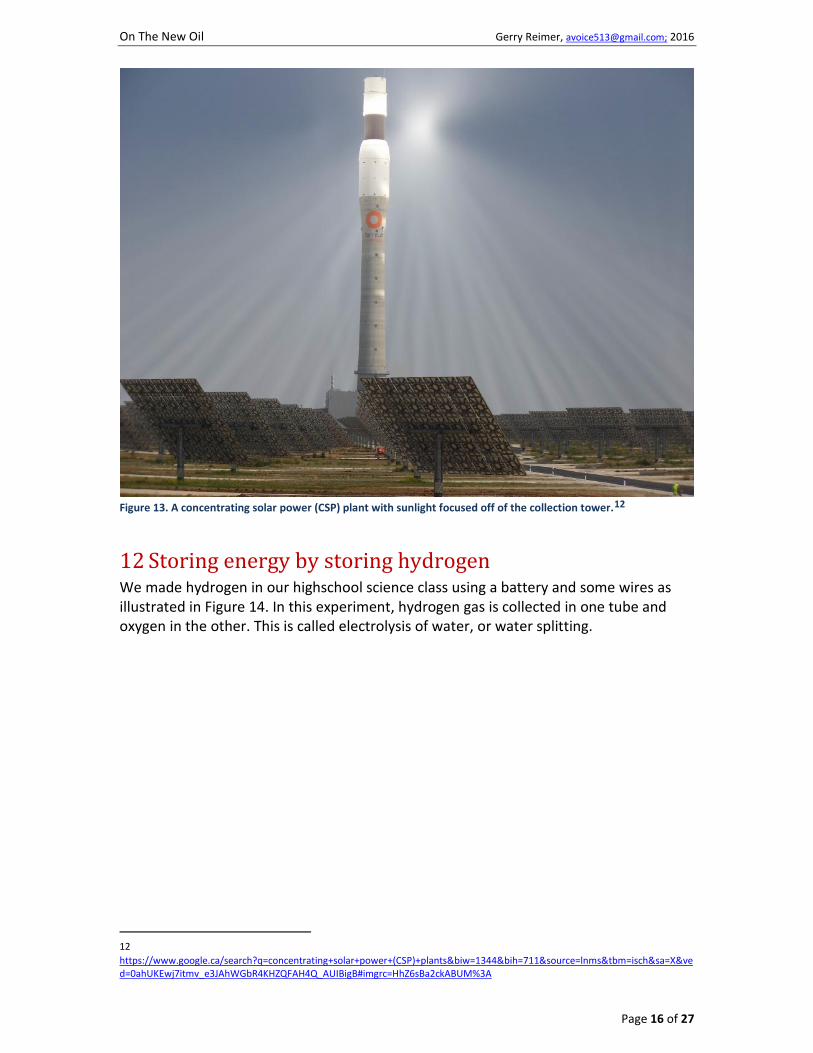
4) Heat something up and use that heat to generate electricity: Thermal energy storage is easily designed into concentrating solar power (CSP) plants (Plebmann 2014). Think of burning a small spot of paper with a magnifying glass on a sunny day. CSP plants use arrays of mirrors to focus sunlight as shown in Figure 13. Part of this concentrated sunlight can be used to heat a large mass of, for example, sodium or cement (Trieb 2012). This stored heat can be used to generate power after the sun sets.
5) Make hydrogen by splitting water: This method is of special interest as discussed below.
On The New Oil Gerry Reimer, [email protected]; 2016
Page 16 of 27
Figure 13. A concentrating solar power (CSP) plant with sunlight focused off of the collection tower.12
12 Storing energy by storing hydrogen We made hydrogen in our highschool science class using a battery and some wires as illustrated in Figure 14. In this experiment, hydrogen gas is collected in one tube and oxygen in the other. This is called electrolysis of water, or water splitting.
12 https://www.google.ca/search?q=concentrating+solar+power+(CSP)+plants&biw=1344&bih=711&source=lnms&tbm=isch&sa=X&ved=0ahUKEwj7itmv_e3JAhWGbR4KHZQFAH4Q_AUIBigB#imgrc=HhZ6sBa2ckABUM%3A

On The New Oil Gerry Reimer, [email protected]; 2016
Page 17 of 27
Figure 14. Electrolysis of water to generate hydrogen and oxygen13.
Hydrogen burns in air. Perhaps the most infamous example of this occurred in 1937 when the hydrogen-filled LZ-129 Hindenburg burned to the ground after a voyage across the Atlantic (Figure 15). It’s not surprizing, therefore, that hydrogen can replace gasoline as fuel in an internal combustion engine or even in a jet engine14, with suitable modifications.
13 https://www.google.ca/search?q=electrolysis+of+water&biw=1680&bih=889&source=lnms&tbm=isch&sa=X&sqi=2&ved=0CAYQ_AUoAWoVChMI7vzpmc6SyAIVyqSICh1PegUd#tbm=isch&tbs=rimg%3ACWJ7gLIHTN3nIjgZQbF32Yj3eib2iBk7bL7P41_19mXdIqwwJ70XR5Ex8gHNLpo18DRd_19KDISZCDD2y-f_1RgdY0DzSoSCRlBsXfZiPd6ESuHAfq14Ya6KhIJJvaIGTtsvs8RmjaMrK8fgToqEgnjX_12Zd0irDBHl0CtIbWtWLCoSCQnvRdHkTHyAEeJgITJVAZK5KhIJc0umjXwNF38REeQJMblTWRgqEgn0oMhJkIMPbBEpgds8FaJJ6yoSCb5_19GB1jQPNEcfJVdb3F73U&q=electrolysis%20of%20water&imgrc=YnuAsgdM3ec5YM%3A
14 http://en.wikipedia.org/wiki/Tupolev_Tu-155

On The New Oil Gerry Reimer, [email protected]; 2016
Page 18 of 27
Figure 15. Hydrogen burning in the LZ-129 Hindenburg.
13 How can we use hydrogen efficiently: The fuel cell You just have to put your hand near the exhaust pipe of a running internal combustion engine to know that a lot of heat is being wasted. A more efficient ‘engine’ with less heat loss is the fuel cell (Rajeshwar 2008, pg 15; Ball 2015 chapter 11). A fuel cell-powered car is shown in Figure 16. In this car, hydrogen is delivered from a tank in the rear to the fuel cell where it combines with oxygen in the air to give electricity that charges batteries and powers an electric motor that makes the car go. The beauty of this system is that essentially only water comes out of the exhaust pipe.

On The New Oil Gerry Reimer, [email protected]; 2016
Page 19 of 27
Figure 16. Hydrogen fuel cell powering a car.15
To explain how this fuel cell works, imagine twin girls holding hands as they walk toward a swimming pool. They give their towels to a friend and jump into the pool. They swim to the other side of the pool where the towels have been delivered and their father waits to dry them off. With one girl on either hand of their father they all leave the pool. In this example the set of twins is a hydrogen molecule (H2) entering the fuel cell at the left in Figure 17. The hydrogen molecule finds a cozy spot on the anode where it is persuaded to give up two electrons (e- in the figure) – these are the towels that the twins give to a friend. Just as the towels are delivered to the other side of the pool, so do the electrons find their way to the cathode of the fuel cell (right side of Figure 17), but not before passing through the electrical circuit in the car which may take them through the electric motor that drives the wheels. Meanwhile, just as the girls swam across the pool, so do the hydrogen atoms (H+ in Figure 17) move through the electrolyte, which may be a salty solution or a polymer membrane, toward the cathode. The father that picks up the girls represents an oxygen atom at the cathode that has come in from the outside (as O2). Just as the father joins hands with the girls, so do the delivered electrons (e- ) and hydrogen atoms (H+) combine with an oxygen atom to form a water molecule that proceeds down the exhaust pipe to the outside. This cycle is repeated over and over as hydrogen molecules enter the fuel cell and bump into the anode, resulting in a continuous supply of electrons to power the car.
Fuel cells come in various sizes to power cars and trucks as well as houses and buildings.
15 http://cset.mnsu.edu/engagethermo/components_fuelcell.html

On The New Oil Gerry Reimer, [email protected]; 2016
Page 20 of 27
Figure 17. Hydrogen fuel cell16
14 Reviewing the big picture To review, we need to stop burning fossil fuels so that the CO2 concentration in the air is held at bay, which will keep the earth from getting any hotter than it has already become due to the greenhouse effect of carbon dioxide. But in order to replace fossil fuels with wind and solar power, we need to store energy on a massive scale to cover the periods when it is calm and dark. An attractive way to achieve this is to generate and store hydrogen by electrically splitting water, using solar and wind power. This form of energy storage has an advantage over other energy storage methods in that hydrogen is portable and can power much of the transportation sector.
15 How far have we come? The so-called hydrogen economy has begun (Reynolds 2007; Niaz 2015): hydrogen-powered transit busses running on fuel cells have been operating in various parts of the world since about 2004. In 2010, there were about 200 roadside hydrogen fueling stations on the planet. This is predicted to increase to 5,200 by 202017, when there will be an estimated one million hydrogen-powered cars on the roads (Pagliaro 2012).
Houses powered by solar hydrogen, like the one in Figure 18, have been on the drawing board for many years (Kazmerski 2004; Ronge 2015). This house has solar panels on the roof, which make electricity that flows to an electrolyzer to produce hydrogen, which is
16 https://en.wikipedia.org/wiki/Fuel_cell#/media/File:Solid_oxide_fuel_cell_protonic.svg
17 See the current number of hydrogen fuel stations at http://www.netinform.net/h2/H2Stations/Default.aspx

On The New Oil Gerry Reimer, [email protected]; 2016
Page 21 of 27
stored in the underground tanks. This hydrogen powers the family car and is consumed in a fuel cell to provide household electricity. Something that is not shown in Figure 18 is a pipe leading away from the house that is used for selling excess hydrogen to the grid.
Figure 18. Solar hydrogen house (Kazmerski 2004)
The surface area of the solar panels on the roof of such a house, at a latitude of Germany or southern Argentina, was determined in one design to be about 520 square feet (48 m2; Gerasimov 2013), which will easily fit on the roof of a bungalow. The catch is that the house must by highly energy efficient, like the dark row house in Figure 19, which uses better insulation than it’s surrounding neighbours, such as triple-glazed windows, and exterior walls with no thermal bridging18. Other measures in this design to improve energy efficiency include capturing the heat produced by the electrolyzer and fuel cells to help with heating the house and hot water (Gerasimov 2013). However, the cost of such a house, including solar panels and equipment for hydrogen production and storage, is prohibitively expensive.
But what if it wasn’t.
Let’s assume for the moment that the cost of ‘hydrofying’ a house is cheap and that everyone on the planet that owns a roof can afford to upgrade. This upgrade would apparently be short-lived, because as manufacturers scale-up the production of solar panels, electrolyzers, and other equipment, we would apparently run out of key raw 18 Thermal bridging occures when heat is transferred from inside a house to the outside via the 2” x 6” wall studs. http://www.greenbuildingadvisor.com/blogs/dept/guest-blogs/what-thermal-bridging

On The New Oil Gerry Reimer, [email protected]; 2016
Page 22 of 27
materials, such as precious metals, to manufacture these items (Lewis 2008; Rhodes 2012).
Some good news here is that the efficiency of producing hydrogen in this way19 is only 1 % (Christopher 2012). This is good news, because if we can improve the efficiency to, say, 10 %, then we should be able to achieve this global ‘hydrofying’ upgrade using one tenth of the materials. There is lots of research currently underway to improve this efficiency, a key focus being the production of hydrogen directly from sunlight and water, which eliminates the need for an electrolyzer.
Figure 19. Infra-red camera image. The energy-efficient row-house is darker than it’s neighbours (Gerasimov 2013).
16 Enter solar water splitting In 1972, Japanese scientists were the first to split water using light directly (without the use of electricity). They did this by shining light on a titanium dioxide (TiO2) electrode that was submerged in water (Fujishima 1972). The idea is illustrated in Figure 20, which shows light illuminating a submerged white disc of titanium dioxide, causing water to split into hydrogen and oxygen, which rise from the surface as small bubbles. The efficiency of this process, however, was less than 1 %.
19 (using solar panels to generate electricity, which in turn is used to power an electrolyzer which produces hydrogen)

On The New Oil Gerry Reimer, [email protected]; 2016
Page 23 of 27
Figure 20. Splitting water into hydrogen and oxygen using light20
Since this discovery, scientists have been working hard to improve the efficiency of direct solar water splitting, while at the same time trying to employ cheap and abundant raw materials so that the devices could be mass-produced for global energy production. Although this remains a ‘holy grail’ in the switch from fossil fuels to solar power (Meyer 2015; Li 2013), there is hope that the technical barriers are surmountable (Yang 2015).
Let’s fast-forward.
17 A day in a life in 2116 Jane sips coffee in the early morning sun that is poking through the windows of their suburban home. Her husband John has just left for work and the kids are mulling around getting ready for school. Once they are out the door, she heads into her home office where she manages a company called J & J Energy Production, one of millions of such small companies in homes all across the country. Before the sun gets too hot she heads up to the roof to check the angle of their solar water splitting panels. The angle of these panels needs to be adjusted at least four times a year so that it is near the optimum position to capture the sun’s rays. Her retired neighbours recently installed hardware that automatically does this job of tracking their panels to the sun, improving their hydrogen yield slightly and making retirement a little easier. Jane and John are still saving up for this hardware – when the time comes she will call on another friend in the neighbourhood who installs and services it.
After adjusting the panel angle, Jane gives them a quick wash. She briefly chats with a neighbour on the next roof. They are a young couple that just moved in. Jane and other neighbours have been helping them setup their new ‘starter-package’ that everyone receives from the government when purchasing a new home. This equipment puts them on the road to establishing their own energy production and export business.
20 https://www.google.ca/search?q=FUJISHIMA+HONDA+1972&biw=1680&bih=889&source=lnms&tbm=isch&sa=X&ved=0CAYQ_AUoAWoVChMI8svqjsuSyAIVwSmICh08AAPx#imgdii=Kg2xA4P1OZYgbM%3A%3BKg2xA4P1OZYgbM%3A%3BdMa7JzR6vAVGnM%3A&imgrc=Kg2xA4P1OZYgbM%3A

On The New Oil Gerry Reimer, [email protected]; 2016
Page 24 of 27
Jane reminds her neighbour about the meeting this afternoon and heads down to the storage room in the basement. Like all of her neighbours, Jane and John have two hydrogen tanks, one for their own use and a ‘grid tank’ which is filled with hydrogen that will be exported to the grid. Decades ago this grid was the city-wide piping system that brought natural gas to every house. It was repurposed to transport hydrogen from each house to central energy hubs (Gondal 2012). These hubs use the hydrogen to generate electricity for the high-density inner city population and small industries in the area. The hubs are run by companies that evolved from the large energy utilities that ran the giant fossil fuel-burning power plants long ago dismantled (Amoretti 2011).
Jane checks that the grid tank pressure is ok and opens the valve to export their hydrogen. This operation will also be automated one day when they can afford to buy the hardware and software.
The doorbell rings and a neighbour pops by to chat about a problem they are having with one of their hydrogen pumps. The two of them decide on a procedure to fix the pump, relying heavily on their Energy Production Diploma training that just about everyone signs up for after highschool.
The neighbour leaves. Perfect timing. The hydrogen export in the basement is complete and Jane opens her computer and surfs to their bank account to find out how much they have earned from that export. She portions the money into a personal account, a business account, and a retirement account. Jane notes that the business account now has sufficient funds to purchase an additional solar panel that they have been saving for. She heads out to the garage and tops up their car’s hydrogen tank using what looks like a garden hose that is connected to their domestic hydrogen tank in the basement. She makes the short trip to a local store and brings home the panel that John will install later.
But now it’s time to prepare for the monthly meeting of neighbours up and down the street. It’s her turn to host the meeting to discuss energy production issues over wine and cheese. One of her neighbours received a grant to install an improved solar water-splitting panel and everyone is eager to hear how it’s performing. Someone from outside the group will talk about changes to government aid programs that help them buy energy-producing hardware and software. The technology and economics of solar water splitting is always changing and there is never a shortage of things to gab about at these meetings.
When the meeting ends and everyone heads out the door, Jane has a few minutes to herself before the kids arrive home from school, followed by John. They are soon all jabbering around the dinner table. After supper John checks the status of their energy system on the computer. There’s plenty of hydrogen in their domestic tank to take them through the predicted cloudy weather coming up. Before turning out the lights John comments that their retirement account is looking pretty nice. Jane agrees, and asks John to install the new solar panel when he has time on the weekend.

On The New Oil Gerry Reimer, [email protected]; 2016
Page 25 of 27
18 Conclusion: Different energy, different economy, different society
Is the above scenario a fairytale?
Perhaps not. In this scenario there has been a shift away from our present consumer society toward a producer society, in which anyone with a rooftop can produce energy and make money doing it. The term ‘prosumer’ has been defined as a final energy user who can also produce energy (Sanz-Bobi 2014, pg 355; Schleiche 2012; IEA 2014). It is envisaged that prosumers will supply energy to a smart grid in cities (Karnouskos 2011), where prosumers are networked in real time to ensure that there is a balance between energy supply and demand. Such a balance will no longer be managed as it is now, by the big energy utilities (Schleiche 2012).
Making this still less of a fairytale is that the Japanese have committed to a ‘hydrogen society’ involving rooftop energy production. While being a costly venture initially, they see the expertise gained along the way paying off, as the global demand for solar-hydrogen technology ramps up (Behling 2015). The Japanese commitment to the hydrogen economy is demonstrated by the fact that they apparently hold the most patents in hydrogen fuel cell technology (Andreasen 2015), and are well ahead in installing roadside hydrogen fueling stations (Alazemi 2015).
Perhaps the most important thing about the above future scenario is that it has witnessed the combustion of the last barrel of oil and rail car of coal, and an end to the global warming caused by the resulting carbon dioxide.
Whatever energy scenario unfolds in the next one hundred years, the words of a popular song seem appropriate: “nothing’s ever gonna be the same”21.
19 References Ball Michael, Angelo Basile and T. Nejat Veziroglu (Eds) ‘The hydrogen economy: vision or reality?’ in Compendium of Hydrogen Energy Volume 4: Hydrogen Use, Safety and the Hydrogen Economy, published by Elsevier in 2015
Brohan, P., J. J. Kennedy, I. Harris, S. F. B. Tett, and P. D. Jones (2006), Uncertainty estimates in regional and global observed temperature changes: A new data set from 1850, J. Geophys. Res., 111, D12106, doi:10.1029/2005JD006548
Brown H. THE CHALLENGE OF MAN'S FUTURE. ENGINEERING AND SCIENCE . Feb 1954 pg 17.
Cook Timothy R., Dilek K. Dogutan, Steven Y. Reece, Yogesh Surendranath, Thomas S. Teets, and Daniel G. Nocera. Solar Energy Supply and Storage for the Legacy and Nonlegacy Worlds. Chem. Rev. 2010, 110, 6474–6502
DOE: "Fuel Economy: Where The Energy Goes". U.S. Department of Energy, Energy Effciency and Renewable Energy. http://www.hydrogen.energy.gov/pdfs/doe_fuelcell_factsheet.pdf
EcoGrid EU - Guide to the large-scale project.pdf 2008. http://www.eu-ecogrid.net/
21 Rickie Lee Jones - Chuck E's In Love (1979)
On The New Oil Gerry Reimer, [email protected]; 2016
Page 26 of 27
Fthenakis V, James E. Mason, Ken Zweibel, The technical, geographical, and economic feasibility for solar energy to supply the energy needs of the US, Energy Policy, Volume 37, Issue 2, February 2009, Pages 387-399, ISSN 0301-4215,
IEA 2014: Energy Technology Perspectives 2014: Harnessing Electricity’s Potential. International Energy Agency. http://www.iea.org/etp/
IPCC 2007: Climate Change 2007 - The Physical Science Basis Contribution of Working Group I to the Fourth Assessment Report of the IPCC (ISBN 978 0521 88009-1 Hardback; 978 0521 70596-7
IPCC 2013: Climate Change 2013: The Physical Science Basis. Contribution of Working Group I to the Fifth Assessment Report of the Intergovernmental Panel on Climate Change [Stocker, T.F., D. Qin, G.-K. Plattner, M. Tignor, S.K. Allen, J. Boschung, A. Nauels, Y. Xia, V. Bex and P.M. Midgley (eds.)]. Cambridge University Press, Cambridge, United Kingdom and New York, NY, USA, 1535 pp.
IPCC 2014: Climate Change 2014: Synthesis Report. Contribution of Working Groups I, II and III to the Fifth Assessment Report of the Intergovernmental Panel on Climate Change [Core Writing Team, R.K. Pachauri and L.A. Meyer (eds.)]. IPCC, Geneva, Switzerland, 151 pp.
Kazmerski L.L., K. Broussard. Solar Photovoltaic Hydrogen: The Technologies and Their Place in Our Roadmaps and Energy Economics. August 2004 • NREL/CP-520-36401
Keeling Charles D. REWARDS AND PENALTIES OF MONITORING THE EARTH. Annu. Rev. Energy Environ. 1998. 23:25–82
Keeling, C. D., S. C. Piper, R. B. Bacastow, M. Wahlen, T. P. Whorf, M. Heimann, and H. A. Meijer, 2005: Atmospheric CO2 and 13CO2 exchange with the terrestrial biosphere and oceans from 1978 to 2000: Observations and carbon cycle implications. In: A History of Atmospheric CO2 and It’s Effects on Plants, Animals, and Ecosystems [J. R. Ehleringer, T. E. Cerling and M. D. Dearing (eds.)]. Springer Science+Business Media, New York, NY, USA, and Heidelberg, Germany, pp. 83–113.
Kumagai J. The Smartest, Greenest Grid. Institute of Electrical and Electronics Engineers (IEEE) 2013 http://spectrum.ieee.org/energy/the-smarter-grid/the-smartest-greenest-grid
Lewis Nathan S. Powering the Planet MRS BULLETIN • VOLUME 32 • OCTOBER 2007 808 • www/mrs.org/bulletin
Lowe D, D Etheridge. Antarctic ice: the world’s air museum. NIWA WATER & ATMOSPHERE9 (1) 2001 22.
MA Sanz-Bobi. Use, Operation and Maintenance of Renewable Energy Systems Experiences and Future Approaches. Springer 2014
Modestino Miguel A. and Sophia Haussener. An Integrated Device View on Photo-Electrochemical Solar-Hydrogen Generation. Annu. Rev. Chem. Biomol. Eng. 2015. 6:13–34
Niaz Saba, Taniya Manzoor, Altaf Hussain Pandith. Hydrogen storage: Materials, methods and perspectives. Renewable and Sustainable Energy Reviews 50 (2015) 457–469
Pagliaro, Mario, Konstandopoulos, Athanasios G. Solar Hydrogen : Fuel of the Future. Royal Society of Chemistry, May 2012
Petit J. R., J. Jouzel†, D. Raynaud*, N. I. Barkov‡, J.-M. Barnola*, I. Basile*,M. Bender§, J. Chappellaz*,M. Davisk, G. Delaygue†, M. Delmotte*, V. M. Kotlyakov, M. Legrand*, V. Y. Lipenkov‡, C. Lorius*, L. Pe´ pin*, C. Ritz*, E. Saltzmank & M. Stievenard† Climate and
On The New Oil Gerry Reimer, [email protected]; 2016
Page 27 of 27
atmospheric history of the past 420,000 years from the Vostok ice core, Antarctica. NATURE |VOL 399 | 3 JUNE 1999, 435.
Plebmann Guido, Matthias Erdmann, Markus Hlusiak, Christian Breyer. Global energy storage demand for a 100% renewable electricity supply. Energy Procedia 46 ( 2014 ) 22 – 31
Rajeshwar Krishnan, Robert McConnell, Stuart Licht (Eds). Solar Hydrogen Generation. Springer 2008
Reynolds Warren D. The Solar-Hydrogen Economy - An Analysis. Solar Hydrogen and Nanotechnology II, edited by Jinghua Guo, Proc. of SPIE Vol. 6650, 665002, (2007)
Ronge Jan, Tom Bosserez, Louis Huguenin, Mikaël Dumortier, Sophia Haussener and Johan A. Martens. Solar Hydrogen Reaching Maturity. Oil & Gas Science and Technology – Rev. IFP Energies nouvelles, Vol. 70 (2015), No. 5, pp. 863-876
Sovacool Benjamin K, Pascale L. Blyth. Energy and environmental attitudes in the green state of Denmark: Implications for energy democracy, low carbon transitions, and energy literacy. Environmental Science & Policy 54 (2015) 304–315
Trieb Franz, Christoph Schillings, Thomas Pregger, Marlene O’Sullivan. Solar electricity imports from the Middle East and North Africa to Europe. Energy Policy 42 (2012) 341–353
Vob, Jan-Peter, Corinna Fischer.Chapter 2 Dynamics of Socio-Technical Change: Micro Cogeneration in Energy System Transformation Scenarios. In: Pehnt M, Cames M, Fischer C, Praetorius B, Schneider L, Schumacher K, et al. Micro cogeneration: towards decentralized energy systems. Nederland: Springer, 2006
Wirth Harry. Recent Facts about Photovoltaics in Germany. 2015. Contact: Karin Schneider Press and Public Relations Phone +49 761 4588-5147 Fax +49 761 4588-9147 Fraunhofer Institute for Solar Energy Systems ISE Heidenhofstrasse 2 79110 Freiburg Germany [email protected]. https://www.ise.fraunhofer.de/en/publications/veroeffentlichungen-pdf-dateien-en/studien-und-konzeptpapiere/recent-facts-about-photovoltaics-in-germany.pdf
Wu Qiuwei, Seung Tae Cha, Haoran Zhao, and Chengshan Wang. Frequency Control for Island Operation of Bornholm Power System. Energy Procedia 61 ( 2014 ) 1389 – 1393
Zhao H et al. Review of energy storage system for wind power integration support. Appl Energy (2014), http://dx.doi.org/ 10.1016/j.apenergy.2014.04.103