Embed Size (px)
Citation preview

ORIGINAL PAPER
On the Friction of Carbon Black- and Silica-Reinforced BRand S-SBR Elastomers
Milad Mokhtari • Dirk J. Schipper •
Tetyana V. Tolpekina
Received: 24 December 2013 / Accepted: 8 April 2014 / Published online: 23 April 2014
� Springer Science+Business Media New York 2014
Abstract Friction of carbon black- and silica-reinforced
elastomers is studied experimentally and theoretically,
using Persson’s model. The effect of reinforcement fillers
on elasticity was determined by dynamical mechanical
analysis. Carbon black-filled samples have a higher
Young’s modulus than the silica-filled compounds. Silica-
filled rubbers have a higher tan (d) at lower temperatures
and a lower loss tangent at higher temperatures, which is a
rough indication for higher wet grip and lower rolling
resistance, respectively. Friction tests on a ball-on-disk test
rig were performed to study the effect of the reinforcement
fillers and their amount on the friction between rubber
samples (disks) and relatively smooth or rough granite
surfaces (balls). The results were discussed and compared
with the friction model presented by Persson. It was shown
theoretically and experimentally that hysteresis does not
play a significant role in the friction of rubber samples in
contact with smooth granite and that it plays a minor role in
contact with a rough granite sphere. Therefore, the hys-
teresis contribution of friction can be neglected in the
contact of rubbers with just smooth spheres. Moreover, a
higher friction coefficient is seen in samples with a higher
content of fillers. Silica-filled compounds show a slightly
higher coefficient of friction compared with the carbon
black-filled compounds. The effect of attached wear debris
to the granite surfaces on the friction level has been
studied. The results are supported by SEM and confocal
microscopic images of the wear debris itself and wear
debris attached to the granite spheres, respectively.
Keywords Friction � Elastomer � Hysteresis � Real area of
contact � Interfacial layer
List of symbols
Ff Total friction force (N)
Fvis Hysteresis contribution of friction force induced by
viscoelastic losses (N)
sf(v) Frictional shear stress as a function of velocity (Pa)
A(v) Real area of contact as a function of velocity (m2)
lf Total coefficient of friction
FN Nominal normal load (N)
r0 Nominal contact pressure (Pa)
A0 Nominal area of contact (m2)
lvis Viscoelastic or hysteresis coefficient of friction
P(q) Real to the nominal area of contact ratio as a
function of wave vector
x Frequency of the applied load to the rubber (rad/s)
k Length scale of the roughness under study (m)
q~ Roughness wave vector (1/m)
q Amplitude of the roughness wave vector (1/m)
q0 Lower wave vector cutoff corresponding to the
longest wave length of roughness (1/m)
q1 Higher wave vector cutoff corresponding to the
shortest wave length of roughness (1/m)
C(q) Power spectral density of the roughness (m4)
A(q) Apparent contact area when the surface is smooth
on all wave vectors [q (m2)
/ Angle between the velocity vector and the wave
vector q~ (rad)
E Modulus of elasticity (Pa)
G(x) The shear modulus (Pa)
M. Mokhtari (&) � D. J. Schipper
Surface Technology and Tribology, Faculty of Engineering
Technology, University of Twente, P.O. Box 217,
7500 AE Enschede, The Netherlands
e-mail: [email protected]; [email protected]
T. V. Tolpekina
Apollo Tyres Global R&D B.V., Colosseum 2,
7521 PT Enschede, The Netherlands
123
Tribol Lett (2014) 54:297–308
DOI 10.1007/s11249-014-0334-z

m Poisson’s ratio
sc Effective frictional stresses with regard to energy
dissipation at a crack opening (Pa)
ss Effective frictional stresses with regard to shearing
a thin confined film (Pa)
G(v) Energy/area to break the interfacial rubber–
substrate bond as a function of velocity (w/m2)
a Crack-tip radius (m)
aT The temperature–frequency viscoelastic horizontal
shift factor
Tg Glass transition temperature (�C)
n Magnification factor
1 Introduction
The interaction between tire and road determines whether
sufficient traction is present under wet and dry conditions
[1–3] as well as the amount of noise radiation [4], energy
losses [5], vibration [6] and rubber particles production [7].
Providing adequate grip between tire and road while
simultaneously minimizing the undesirable effects of the
tire–road interaction has been the subject of several
researches in the past decades [8–10]. Solving the afore-
mentioned problem seems impossible unless the main
mechanisms responsible for the tire–road interaction are
well understood. Friction of polymers against solid sur-
faces is one of the most important mechanisms engaged in
the tire–road interaction. Rubber seals, wiper blades, con-
veyor belts and syringes are some practical applications
that require sufficient knowledge on rubber friction.
Although great interest has been kindled by studying the
tribological behavior of rubber sliding contacts in the past
50 years [11–13], the friction problem is not yet fully
understood.
Several parameters such as contact pressure, (sliding)
velocity, temperature and surface roughness, as well as
morphology of the rubber compounds, play a role in the
friction of polymers in contact with solid surfaces and, as
a consequence, modeling rubber friction is not a simple
task. The friction of polymers in contact with a solid
surface differs from friction of other solids and simple
friction models, such as the Coulomb’s friction law, are
not adequate to describe friction under different condi-
tions. Historically, the friction force between rubber and a
rough surface was considered as a summing up of two
main contributions, commonly described as the adhesion
and hysteresis components [14]. The intermolecular
attractive forces between the contacting bodies are con-
sidered as the mechanism responsible for the adhesion
[15]. On the other hand, cyclic deformation of the rubber,
caused by exerted oscillating forces of asperities of a
rough surface, dissipates energy and generates the hys-
teresis component of friction [16]. There has been an
ongoing debate among researchers on the question of
which component plays the major role in the overall
friction. In the early works of Persson [17], the hysteresis
was assumed to be the main contributor of rubber friction,
while Le Gal and others [1] found that adhesion plays a
dominant role. In a recent paper of Lorenz et al. [18],
some other contributors to rubber friction are considered:
energy dissipation due to crack opening and energy dis-
sipation in shearing a thin viscous film [3]. Pan empha-
sizes the significance of interfacial interactions in
determining the wet sliding friction of elastomer com-
pounds in his research [19]. Moreover, a contribution to
rubber friction as a result of wear processes is also men-
tioned and not well studied yet [3, 18].
The problem gets even more complicated by adding
different fillers to the rubber compound. The effect of
different fillers in rubber friction is of interest from a sci-
entific point of view as well as for industrial applications,
especially the tire industry. Silica and carbon black have
been used as the main reinforcing agents in rubber com-
pounds. It has been reported that substitution and/or addi-
tion of silica to carbon black-filled rubbers may modify the
wet grip behavior as well as the rolling resistance of tires
[19, 20]; however, much less is known about the mecha-
nism responsible for this.
This paper studies the effect on friction of carbon black
and silica, as reinforcement fillers, using a mixture of
butadiene rubber (BR) and solution styrene-butadiene
rubber (S-SBR) against rock (granite) based on a combined
experimental–theoretical approach and tries to find the
main contributor in friction.
The outline of this paper is as follows: In Sect. 2, the
basic equations developed by Persson are presented, which
are used to calculate the friction of rubber in contact with a
solid rough surface. Section 3 starts with the materials used
in the experiments and discusses DMA measurements
performed to determine the mechanical characteristics of
the rubber samples. Then, the results of the friction tests are
discussed. Section 4 contains the numerical results based
on the equations presented in Sect. 2. In Sect. 5, the results
of Sect. 4 are used to explain the results of Sect. 3 and
different aspects of the results are discussed. Finally, in
Sect. 6, the main conclusions are given.
2 Rubber Friction
The model developed by Persson is used to calculate the
friction. Friction is modeled by incorporating the contri-
butions of the roughness-induced viscoelastic deformation
298 Tribol Lett (2014) 54:297–308
123
of the rubber as well as the contribution from the area of
contact [3, 18]:
Ff ¼ Fvisc þ sf vð ÞA vð Þ or
lf ¼Ff
FN
¼ Fvisc
r0A 0ð Þ þsf vð ÞA vð Þr0A 0ð Þ
ð1Þ
where r0 and A0 are the nominal contact pressure and
contact area, respectively. Fvisc is the friction force related
to the hysteresis losses in the bulk of the material that
originates from the viscoelastic nature of the rubbers,
A(v) is the real area of contact as a function of velocity,
sf(v) is the frictional stress due to the contribution from the
area of contact and Ff is the total friction force in contact
between the rubber and a rigid surface. Rubber friction
contributors are shown schematically in Fig. 1.
2.1 Hysteresis Component of Friction
The hysteresis component of the friction is originated from
the oscillating forces that the surface asperities exert onto the
rubber surface. These forces lead to cyclic deformations and
energy dissipation due to internal frictional damping. The
asperities of a rigid solid, with a sinusoidal rough surface
with period l, exert a fluctuating force with a characteristic
frequency x = v/l to a rubber solid if the relative velocity
between the rubber block and the rigid surface is equal to
v. Surfaces are rough with roughness on many different
length scales k [21]; therefore, the contribution to rubber
friction from the viscoelastic deformation (and consequently
hysteresis losses) of the rubber surface exerted by the sub-
strate asperities depends on the frequency-dependent vis-
coelastic modulus E(x) (see Sect. 3.2, which deals with
characterizing and determining the elasticity modulus over a
range of frequencies). The asperities and the distribution of
length scales k in the roughness of the counter surface
determine the distribution of frequency components in the
Fourier decomposition of the surface stresses acting on the
sliding rubber. In the model of Persson, the power spectral
density of the roughness, C(q), is considered as a function
which contains all the necessary information regarding
oscillating exerted forces from asperities. The definition and
calculation method of the power spectral density of a rough
surface can be found in [21] where q is the amplitude of the
wave vector related to the wavelength k by q = 2p/k. Fric-
tion is also a function of (flash) temperature as a consequence
of heat generated as a result of loss of energy in the contact. In
this research, low velocity in the contact of rubber with the
rigid surface is considered, so the influence of flash tem-
perature on friction is neglected.
The real area of contact is much smaller than the apparent
area of contact A0. As an example, the real area of contact
between the tire and the road is typically only *1 % of the
nominal footprint contact area [16]. The real area of contact
is important because it plays a role in determining the fric-
tion. Persson defines the real area of contact as a function of
length scale k, where the surface would be smooth on all
length scales shorter than k. The basic equations of the
hysteresis coefficient of friction as well as the real area of
contact are summarized below [16, 18]:
lvis �1
2
Zq1
q0
dq q3C qð ÞP qð ÞZ2P
0
d/ cos / ImE qv cos /ð Þ
1� m2ð Þr0
� �;
ð2Þ
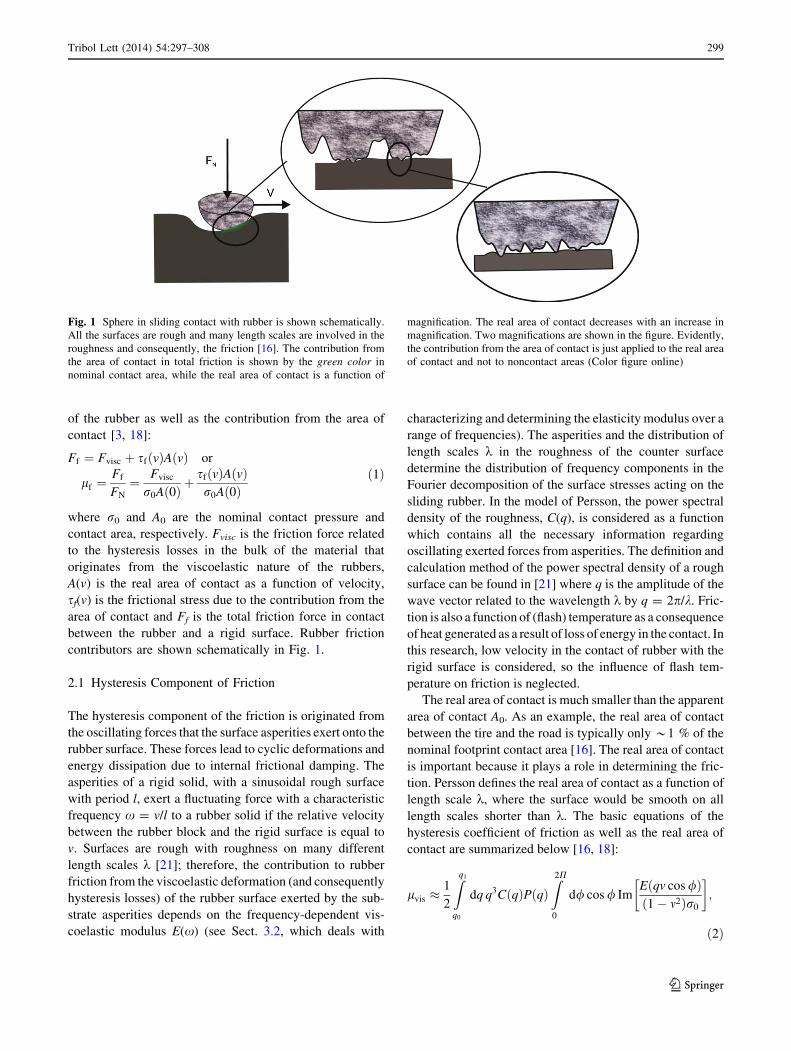
Fig. 1 Sphere in sliding contact with rubber is shown schematically.
All the surfaces are rough and many length scales are involved in the
roughness and consequently, the friction [16]. The contribution from
the area of contact in total friction is shown by the green color in
nominal contact area, while the real area of contact is a function of
magnification. The real area of contact decreases with an increase in
magnification. Two magnifications are shown in the figure. Evidently,
the contribution from the area of contact is just applied to the real area
of contact and not to noncontact areas (Color figure online)
Tribol Lett (2014) 54:297–308 299
123

where the function P qð Þ ¼ AðqÞ=A0is given by
P qð Þ ¼ 2
P
Z1
0
dxsin x
xexp �x2G qð Þ� �
; ð3Þ
where
G qð Þ ¼ 1
8
Zq
q0
dq q3C qð ÞZ2P
0
d/E qv cos /ð Þ
1� m2ð Þr0
��������2
: ð4Þ
A(q) is the apparent area of contact if the surface were
smooth for all wave vectors larger than q, A0 is the nominal
contact area at the shortest wave vector q0 and x is an
integration variable. It should be noted that it is assumed
that rough surfaces are isotropic, so just the amplitude of
the wave vector jq~j ¼ q ¼ 2p=k is important and not its
direction where k is the considered wavelength of the
roughness. The theory is presented in the general form and
is valid for all surfaces; however, the formulations can
become simpler if the surface is self-fractal for q0 \ q \ q1
where the limitations are defined by the shortest and lon-
gest wavelengths of the roughness studied. / is the angle
between the velocity vector and the wave vector q~; r0 the
nominal contact pressure and m the Poisson’s ratio. For an
extended definition of the parameters, see [16, 17].
2.2 Real Area of Contact Contribution
Two different physical phenomena are responsible for the
contribution of the real area of contact to the overall fric-
tion, sf(v) = sc(v) ? ss(v) where sc and ss are the effective
frictional stresses with regard to energy dissipation at a
crack opening and shearing a thin confined film,
respectively.
Dissipation of energy at the crack openings results in the
effective frictional stress sc acting at the real area of contact.
The energy per unit area required to break the interfacial
rubber–substrate bonds is called G v; Tð Þ ¼ G0½1þ f v; Tð Þ�which is a function of crack-tip velocity v and the tempera-
ture T. G0 is the energy to break the interfacial rubber–sub-
strate bonds at extremely low crack velocities. If one
assumes that the contact area consists of N regions of average
size l (i.e., A = Nl2), then the following balance of energy is
satisfied during a sliding distance of dx:
scAdx ¼ G vð ÞNl dx or sc ¼G vð Þ
l¼ G vð Þ
G0
G0
l: ð5Þ
The dissipated energy as a result of crack propagation in
high velocities for a viscoelastic solid is caused by hys-
teresis losses. The perturbing frequency is related to the
distance r from the crack tip. The crack-tip radius a is
recognized as the smallest possible r. Hence, the highest
possible frequency will be v=a (see [22] for more details). It
is shown in [22] that,
G vð Þ=G0¼ 1� 2=pE0
Z2Pv=a
0
dxFðxÞ
xIm
1
E xð Þ
� �264
375�1
;
ð6Þ
where E0 = E(x = 0), a is the crack-tip radius and
F xð Þ ¼ 1� xa2pv
� �2h i1=2
: The crack-tip radius cannot be
smaller than an atomic diameter; therefore, in references
[18, 22], a0 = 1 nm is proposed and used. Because of
difficulties in calculating the integral in Eq. 6 (originated
from broad frequency range that extends over many dec-
ades), a simpler method is proposed [18, 22].
The second physical phenomenon dealing with the real
area of contact contribution in the overall friction is due to
the force of shearing a thin fluid-like film formed by seg-
ments of rubber molecules [3, 18]. Persson has suggested
using,
ss ¼ s0ðaT vÞa; ð7Þ
where aT is the temperature–frequency viscoelastic shift
factors and s0 is basically a fitting parameter. One can find
more about the origin of the formulas in [18].
It is mentioned in [3, 18] that wear can also play a role
in the friction of rubbers against solid surfaces; however, it
was not further developed. Some simple models do exist
that have considered the contribution and the effect of wear
in the total friction [23] and, specifically, the friction of
polymers [24]. In this research, in Sect. 5, the role of wear
on the total friction is studied based on an experimental
approach.
3 Experimental
3.1 Materials
The rubber samples employed in this study include 30 parts
per hundred rubber (phr) butadiene rubber (BR) and 70 phr
solution styrene-butadiene rubber (S-SBR). The samples
are mixed with two different filler systems, carbon black
(N375) and silica. The compounds are prepared by varying
the amount of fillers, namely 100, 85 and 70 phr of carbon
black or silica. For silica-filled compounds, depending on
the amount of silica, the amount of processing oil needed to
functionalize and disperse the silica particles was varied.
Bifunctional organosilanes, such as bis(triethoxysilylpro-
pyl)-tetrasulphide (TESPT), are used (depending on the
silica content) to chemically modify the silica surfaces to
enhance the compatibility of hydrocarbon rubbers and
300 Tribol Lett (2014) 54:297–308
123

precipitated silica by modifying the surface of the silica.
An overview of the different rubber compounds prepared
with the corresponding amounts (phr) of the components is
given in Table 1.
In this paper, we refer to the samples as HC, MC, LC,
HS, MS, LS which correspond to high, medium and low
contents of carbon black (C) and silica (S), respectively.
3.2 Viscoelasticity of Compounds
The glass transition temperature of the samples is deter-
mined using dynamical mechanical analysis (DMA) in
temperature sweep mode at a fixed frequency of 10 Hz
under dynamic and static strains of 0.1 and 1 %, respec-
tively. Then, the shear modulus G(x) is measured in
oscillatory shear mode at a constant strain amplitude of
0.1 % where the sample is fixed at both interfaces and
sheared at different frequencies between 1 and 200 Hz. The
whole procedure is repeated then for different temperatures
(the temperature is varied between -20 and 85 �C). The
measured glass transition temperature and the selected
reference temperature Tref = 27 �C are used to shift the
measured shear modulus G(x) against frequency x both
horizontally and vertically; Based on the time–temperature
superposition principle, the effect of changing the tem-
perature and applying a multiplication factor aT to the time
scale is similar; therefore, the measured shear modulus in a
limited frequency range (1 \ f \ 200 Hz) can be used to
estimate the modulus at high frequencies [25]. Williams–
Landel–Ferry (WLF) equation presented below is applied
for the horizontal shifting: log fh ¼ �C1ðT�TrefÞC2þT�Tref
; where C1
and C2 are two constants that depend on the elastomer as
well as the selected reference temperature. Construction of
broad frequency scale master curves from the limited
measured modulus is only feasible for amorphous, unfilled
rubbers [26] where the rubber behaves linearly. A neces-
sary condition for using the shift factors of the unfilled
systems for a filled compound is that the filler does not
influence the location of the glass transition [27, 28]. This
is the case for all six studied samples (see Figs. 2, 3).
Considering the fact that all the samples are filled with
different fillers and filled rubbers show nonlinear visco-
elastic behavior, only horizontal shifting cannot provide a
continuous broad master curve; therefore, a vertical shift-
ing should be also employed to shift the measured data
along the vertical axis. The reasons of failure of the WLF
equation for filled samples are mentioned in Ref. [27].
Vertical shifting is performed in some other researches [1,
28].
In tire application, deformations can be of the order of
100 %; therefore, the measurements should be performed
at high strains; however, the rubber has a nonlinear
behavior at high strains where the WLF relation is not
valid; therefore, our measurements were performed at
lower strains. The authors are aware of the effect of the
strain softening in rubbers where the elasticity modulus
might decrease at higher strains. A new procedure for
shifting is proposed by Lorenz et al. [29]. However, it is not
possible at this moment to conduct direct measurements for
high strains that correspond to the tire application and high
frequencies at the same time. Therefore, there is no direct
validation which method is the best for making master
curves.
The measured loss tangent, which is the ratio between
the loss and storage modulus of the samples as a function
Table 1 Different rubber compounds prepared with the amounts of
components indicated in phr where HC: high carbon black content,
MC: medium carbon black content, LC: low carbon black content,
HS: high silica content, MS: medium silica content and LS: low silica
content
Compound HC MC LC HS MS LS
Description phr phr phr phr phr phr
BR, high cis 30 30 30 30 30 30
SSBR 70 70 70 70 70 70
N375 100 85 70 – – –
Silica – – – 100 85 70
TESPT – – – 7.8 6.63 5.5
Processing oil 31 17 4 31 21 17
Sulfur 1.3 1.3 1.3 1.3 1.3 1.3
TBBS 1.3 1.3 1.3 1.3 1.3 1.3
DPG 2 2 2 2 2 2
ZnO 3 3 3 3 3 3
Stearic acid 2 2 2 2 2 2
PVI 0.2 0.2 0.2 – – –
Anti-aging chemicals 6 6 6 6 6 6
Zinc salt of fatty acids 3 3 3 3 3 3
Fig. 2 Loss tangent as a function of temperature for six different
filled compounds
Tribol Lett (2014) 54:297–308 301
123

of temperature, is plotted in Fig. 2 as shown; the peak of
loss tangent is higher for silica-filled compounds compared
with the carbon black-filled samples. The phase angle is
inversely dependent on the filler content. This trend is
discussed in [22].
Moreover, the peak occurs at slightly higher tempera-
tures for silica-filled compounds. Also, the temperature at
which the peak value of the tan (d) occurs decreases with
increasing filler content. On the other hand, at higher
temperatures (T [ 30 �C), silica-filled compounds show
lower tan (d).
This result is consistent with the results of other
researchers where it has been generally accepted that
replacement of carbon black by silica results in a decline of
the rolling resistance due to a decrease of tan d at higher
temperatures, while it simultaneously leads to a compara-
ble tan d at lower temperatures, providing a comparable
wet grip [30].
The effect of the filler and its content on the Young’s
modulus of elasticity is shown in Fig. 3. It can be con-
cluded that the carbon black-filled samples generally pos-
sess a higher elasticity than the silica-filled compounds. In
addition, the modulus of elasticity is dependent on the filler
content.
The calculated master curve for the modulus of elas-
ticity as a function of frequency is shown in Fig. 4 (just for
one sample) for the MS rubber.
3.3 Friction Tests
The friction tests are performed by a ball-on-disk setup
schematically shown in Fig. 5 and under controlled envi-
ronmental conditions. The temperature was kept constant at
27 �C and the relative humidity at 50 %. The counter
surfaces against the rubber samples are granite balls with a
diameter of 30 mm. The sliding velocity was kept constant
at 5 mm/s as well as the contact pressure, i.e., 0.4 MPa. A
sample of the measured signal is shown in Fig. 5. The
coefficient of friction is considered as the mean value when
the signal is stabilized; in other words, the running-in
friction is neglected.
The granite spheres are prepared with two different
roughnesses, namely smooth and rough, i.e., with arith-
metic average roughness of 0.52 and 2.28 lm, respectively.
The power spectral densities of the spheres are shown in
Fig. 6. As is shown in the figure, the granite surfaces are
self-fractal and the polished surface is much smoother than
the rough one. The granite surfaces used in the present
study are smoother than the road roughness but they are
comparable with the stones present in the asphalt (that are
even polished after some time of usage). Therefore, this
study can provide information about the contribution of
hysteresis and area of real contact on that roughness level.
The friction measurement results are shown in Fig. 7. In
the figure, the average and the standard deviation of the
Fig. 3 Young’s storage (left) and loss (right) modulus of elasticity as a function of temperature for different samples
Fig. 4 Shifted loss and storage shear modulus of elasticity as a
function of frequency for 85 phr silica-filled rubber
302 Tribol Lett (2014) 54:297–308
123
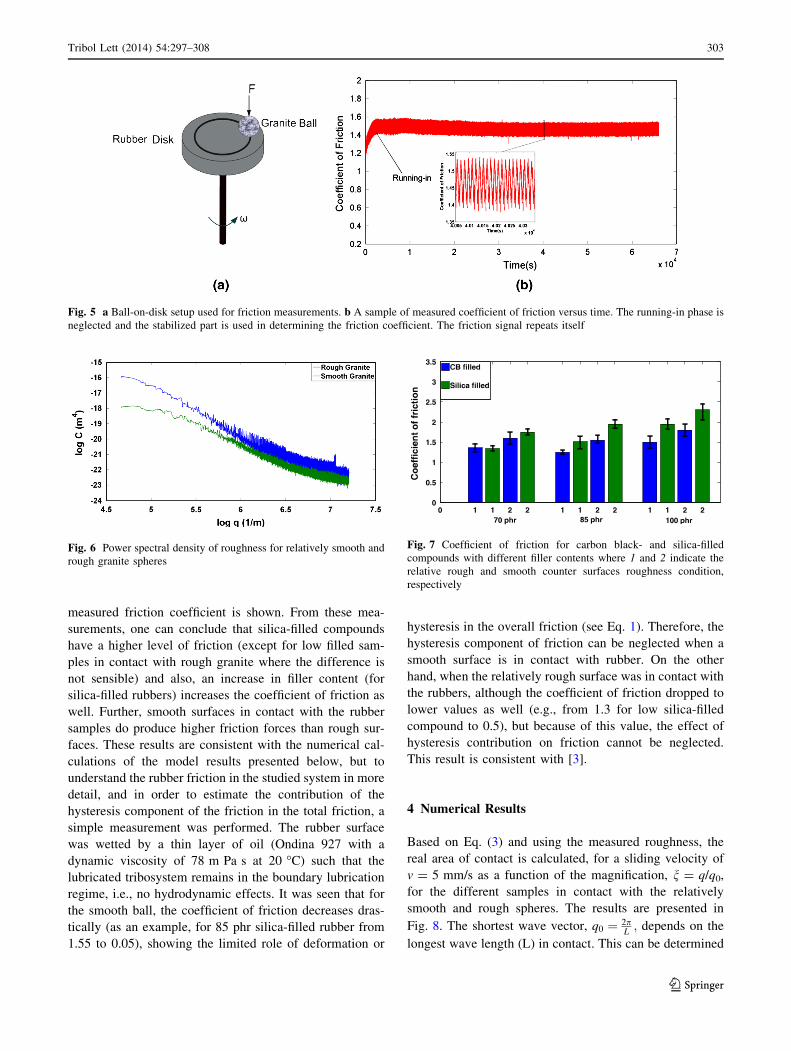
measured friction coefficient is shown. From these mea-
surements, one can conclude that silica-filled compounds
have a higher level of friction (except for low filled sam-
ples in contact with rough granite where the difference is
not sensible) and also, an increase in filler content (for
silica-filled rubbers) increases the coefficient of friction as
well. Further, smooth surfaces in contact with the rubber
samples do produce higher friction forces than rough sur-
faces. These results are consistent with the numerical cal-
culations of the model results presented below, but to
understand the rubber friction in the studied system in more
detail, and in order to estimate the contribution of the
hysteresis component of the friction in the total friction, a
simple measurement was performed. The rubber surface
was wetted by a thin layer of oil (Ondina 927 with a
dynamic viscosity of 78 m Pa s at 20 �C) such that the
lubricated tribosystem remains in the boundary lubrication
regime, i.e., no hydrodynamic effects. It was seen that for
the smooth ball, the coefficient of friction decreases dras-
tically (as an example, for 85 phr silica-filled rubber from
1.55 to 0.05), showing the limited role of deformation or
hysteresis in the overall friction (see Eq. 1). Therefore, the
hysteresis component of friction can be neglected when a
smooth surface is in contact with rubber. On the other
hand, when the relatively rough surface was in contact with
the rubbers, although the coefficient of friction dropped to
lower values as well (e.g., from 1.3 for low silica-filled
compound to 0.5), but because of this value, the effect of
hysteresis contribution on friction cannot be neglected.
This result is consistent with [3].
4 Numerical Results
Based on Eq. (3) and using the measured roughness, the
real area of contact is calculated, for a sliding velocity of
v = 5 mm/s as a function of the magnification, n = q/q0,
for the different samples in contact with the relatively
smooth and rough spheres. The results are presented in
Fig. 8. The shortest wave vector, q0 ¼ 2pL; depends on the
longest wave length (L) in contact. This can be determined
Fig. 5 a Ball-on-disk setup used for friction measurements. b A sample of measured coefficient of friction versus time. The running-in phase is
neglected and the stabilized part is used in determining the friction coefficient. The friction signal repeats itself
Fig. 6 Power spectral density of roughness for relatively smooth and
rough granite spheres
Fig. 7 Coefficient of friction for carbon black- and silica-filled
compounds with different filler contents where 1 and 2 indicate the
relative rough and smooth counter surfaces roughness condition,
respectively
Tribol Lett (2014) 54:297–308 303
123

by the apparent area of contact. For this purpose, the Hertz
contact model is used to calculate the diameter of the
contact area for the different samples. The linear size of the
contact regions, l, plays a crucial role in calculating the
shear stress corresponding to the energy dissipation in
crack openings (see Eq. (5)). This value was found to be in
relation to the large wave vector cutoff q1 [18]. As shown
in Fig. 8 and Eqs. (2) and (3), the large cutoff wave vector
is the determining factor as well in calculating the real area
of contact and the hysteresis component of the overall
friction. Therefore, the large cutoff wave vector has an
effect on the whole analysis. It has been suggested that the
size of the road contamination particles (dust or sand par-
ticles) could be one of the determining factors in relation to
the large cutoff wave vector q1 [21]. However, for clean
surfaces, Persson introduced a yield condition, which is
related to an intrinsic property of the rubber, to determine
the cutoff wave vector q1. It is assumed that the local stress
and temperature in the asperity contact regions for a length
scale k1 ¼ 2pq1
are sufficiently high to break the rubber
bonds, so a thin confined layer of rubber with thickness
&1/q1 is formed at the rubber surface that is in contact
with the counter surface asperities. This process to deter-
mine q1 is closely related to the wear of the rubber samples.
However, to determine the optimum cutoff, values of other
parameters have to be known in advance, and these values
are found in such a way that the numerical results fit
properly with the experiments [31]. On the other hand, one
can initially fit the experiments with the numerical results
to find the optimum value for q1. The latter procedure is
also used to validate Persson’s theory [3]. Different values
for q1 are used for different rubber–granite tribosystems to
fit with the experiments. The short wavelengths are of the
order of k1 & 0.5 lm for rough granite spheres in contact
with HC sample (k1 increases with a decrease in filler
content, it is lower for contact of a rough sphere in com-
parison with contact of a smooth granite sphere with the
same rubber and is higher for contact between a silica-filled
than carbon black-filled rubber and similar sphere) and of
the order of k1 & 8 lm for smooth granite spheres in
contact with LS rubber (see also Fig. 11 and the difference
in the size of the carbon black- and silica-reinforced rubber
debris). The short wavelengths selected for all other
tribosystems vary between these two values and increases
as explained above. These values are of the order of the
short wavelengths used or measured in the different rubber
systems with rough and smooth surfaces such as concrete,
sandpaper or asphalt roads [1, 18, 22, 32].
Figure 8 shows that, as expected, the area of real contact
decreases with an increase in the Young’s modulus of
elasticity (as a result of an increase in the filler content).
Another interesting result illustrated by Fig. 8 is that the
real area of contact for all rubber samples increases
approximately 3–5 times when a smooth ball is in contact
with rubber compared to the rough one.
The calculated viscous coefficient of friction, based on
Eq. (2) for both surfaces in contact with the rubber sam-
ples, is shown in Fig. 9 as a function of the sliding velocity.
(a) (b)
Fig. 8 Variation of real area of contact over nominal contact area as a function of magnification for sliding velocity of v = 5 mm/s for rubbers
in contact with a smooth and b rough granite surfaces
Fig. 9 Hysteresis coefficient of friction as a function of sliding
velocity for carbon black- and silica-filled samples in contact with
relatively smooth and rough spheres
304 Tribol Lett (2014) 54:297–308
123

The ratio G vð Þ=G0(see Eq. 5) is calculated and plotted
against velocity v in Fig. 10. In the calculations, the value
suggested in [18, 22] for the crack-tip radius for low
velocities a0 = 1 nm is used. It has been reported that the
measured value for G at extremely low crack velocities is
of the order &0.1 J/m2 [18]. G0 values are selected in the
same order for the samples used in this research. For
‘‘high’’ crack velocities, G vð Þ � G0E1E0
[1, 22, 33]. The
ratio of the dynamic modulus in the glassy state to that in
the rubbery state, E1E0; is higher for silica-filled compounds
and is related inversely to the filler content (for both silica
and carbon black-filled samples). Figure 10 shows that
G(v) increases with an increase in E1E0: In short, for
v = 5 mm/s, the carbon black-filled samples show lower
energy dissipation (at crack openings) than silica-filled
samples and the dissipated energy increases with a
decrease in filler content. As a conclusion, the dissipated
energy in the crack openings is inversely related to the
modulus of elasticity.
The contribution of energy dissipation at crack openings
to the overall friction coefficient issc vð ÞA vð Þr0A 0ð Þ (see Eq. 1). The
effective frictional stress with regard to energy dissipation
at a crack opening, sc, is governed by Eq. (5). As it is
shown in Fig. 10, 1:1\ log10GG0
\1:2 (which does not
differ severely for different samples), it was mentioned
earlier that 0.5 \ l \ 8 lm. However, the real area of
contact changes drastically for different tribosystems.
Substituting the given numbers for each system reveals that
dissipation of energy at crack openings for contact of
rubbers with rough spheres (and especially carbon black-
filled rubbers whereA vð ÞA 0ð Þ is much smaller) is negligible
while this phenomenon plays a minor role in total friction
for contact of smooth balls with rubbers (especially silica-
filled samples which have much higher real contact areas).
Moreover, for systems which hysteresis is negligible, dis-
sipation of energy in crack openings plays a minor role in
total friction and vice versa. None of these two phenomena
can describe the measured friction coefficients. Therefore,
shearing of a thin interfacial layer is the main contributor in
friction of studied rubber disks and granite balls.
The frictional shear stress s0 in Eq. (7) is selected such
that the numerical results are in agreement with the mea-
surements. These values are of the order of a few MPa to
22 MPa and with a power a = 0.05 in Eq. (7) which are in
the range of values found elsewhere [1, 3, 18].
5 Discussion
It is seen that for the samples with a higher modulus of
elasticity (higher filler content), the viscous coefficient of
friction is just slightly higher. This can be explained by
Eq. (2), where the competition between P(q) and the
imaginary part of the elastic modulus determines the vis-
cous friction. Although a higher filler content decreases the
real area of contact, as is illustrated in Fig. 8, the loss
modulus also increases (Fig. 3). It can be observed from
Fig. 7 that an increase in the filler content (or modulus of
Fig. 10 Crack propagation energy enhancement factor G(v)/G0 as a
function of the crack-tip velocity for different samples
Fig. 11 Scanning electron microscopic pictures of rubber wear particles: a wear particle from 85 phr carbon black-filled rubber and b wear
particle from 85 phr silica-filled rubber
Tribol Lett (2014) 54:297–308 305
123

elasticity) results in an increase in the total measured
coefficient of friction and stays approximately in the same
range for silica and carbon black-filled samples. This
increase is the superposition of a slight increase in the
viscous coefficient of friction and a decrease in the real
area of contact (the contact area decreases 3 to 5 times).
This can only be valid if sf, presented in Eq. (1), also
increases as the filler content increases.
Although dissipation of energy at the crack openings
plays a role in the overall friction, it is not the main con-
tributor. When rubbers are in contact with rough surfaces,
the real area of contact is much smaller; however, it plays a
minor role in contact with smooth counter surfaces.
Moreover, for smooth surfaces and when no debris is
attached to the counter surface, adhesional interaction
might also increase the area of real contact contribution.
For rough surfaces, the hysteresis component of friction
together with friction induced by shearing a thin interfacial
layer explains the levels of the measured friction, while for
the smooth surfaces, shearing of a thin interfacial layer
plays the dominant role and the energy dissipation at crack
openings just slightly contributes to the overall friction.
The strain softening effect might result in higher areas of
real contact which brings about lower values for s0 than the
calculated shear stresses. This shows the importance of
studying the origin of s0 and not considering it just as a
fitting parameter which has not been performed yet.
Therefore, a more detailed theoretical–experimental approach
is required to acquire sufficient knowledge on the proper-
ties of the interfacial rubber surface layer.
Studying the wear debris of the different rubber samples
shows that the wear debris of carbon black-filled rubbers
was more sticky and could easily attach to the granite ball,
while the wear debris of the silica-reinforced samples was
more ‘‘dusty-like.’’ Scanning electron microscopic pictures
of the debris are shown in Fig. 11 where the carbon black-
reinforced debris has the tendency to attach together and
form a smear film, while the silica-filled debris stays apart
from each other.
It was observed that when the experiment runs for a long
period of time, rubber wear particles stick to the granite
surface and the tribosystem under study changes. The
Fig. 12 Coefficient of friction for carbon black- and silica-filled
compounds with different filler contents in contact with contaminated
granite surfaces where 1 and 2 indicate the relative rough and smooth
counter surfaces roughness condition, respectively
Fig. 13 Confocal microscopic
pictures of cleaned rough (a),
smooth (b) and debris attached
to the rough (c) and smooth
(d) granite spheres in contact
with MC
306 Tribol Lett (2014) 54:297–308
123

stabilized measured coefficient of friction when the spheres
are contaminated with debris is shown in Fig. 12.
Fresh smooth and rough spheres cleaned by isopropanol
as well as wear debris attached spheres (wear debris
resulting from the contact of MC sample and spheres) are
shown in Fig. 13. The images are made by the laser
scanning microscope VK 9700 Keyence on an area of
200 9 286 lm. The debris attached to the rough sphere of
MS is shown in Fig. 14. The difference between Figs. 13c
and 14 can be explained by Fig. 11. As discussed before,
the silica-filled compound’s debris shows a tendency to
leave the contact area, while carbon black-filled com-
pound’s debris mainly sticks to the sphere.
It can be illustrated from Fig. 13 that the wear debris
fills the valleys of the sphere, so the contact is between a
combination of rubber–rubber as well as rubber–granite at
the asperities (depending on the initial roughness and the
compound used, the contact is divided in different ratios of
rubber–rubber to rubber–granite contact).
A simple comparison between Figs. 7 and 12 shows an
increase in the coefficient of friction when the contact
region is partially influenced (by the attached wear debris)
in all studied tribosystems. The increment in the friction
coefficient is dependent on the filler content and filler itself;
therefore, the increase in friction for high filler contents is
more recognized than for low filled samples. The highest
increase in friction level is seen for the HC sample. This is
because the carbon black-reinforced rubber debris has a
greater tendency to stick to the granite and changes the
tribosystem than the silica-filled rubbers. Similar observa-
tions have been made in [24, 34, 35]. This situation also
occurs in the contact between tire and road. The increase in
the friction coefficient can be explained by the modified
roughness of the contact as well as modified shearing
layers where shearing occurs between a combination of
rubber–rubber and rubber–granite in comparison with shear
between rubber and granite. In all contacts, the roughness
of the granite sphere becomes less because wear debris fills
the valleys between the asperities, thus the real area of
contact increases; this is seen in Fig. 12. This is more proof
of the importance of the real area of contact.
6 Conclusion
A theoretical–experimental approach is used to study the
effect of carbon black and silica as reinforcement fillers on
friction. DMA measurements showed that carbon black-
filled samples have a higher Young’s modulus than the
silica-filled compounds, and the filler content and the
modulus of elasticity are related. Silica-filled rubbers have
a higher tan (d) at lower temperatures and a lower loss
tangent at higher temperatures than carbon black-filled
compounds, which is a rough indication of higher wet grip
and lower rolling resistance for the tire–road contact,
respectively.
A ball-on-disk setup was used to conduct friction mea-
surements of six different rubber samples in contact with
smooth and rough granite spheres. It was shown theoreti-
cally and experimentally that hysteresis has a negligible
effect on the coefficient of friction for the smooth counter
surface and does play a minor role in the rough surface for
the systems studied.
The real area of contact decreases with an increase in
elastic modulus as a result of an increase in filler content.
On the other hand, the hysteresis increases just slightly
with an increase in filler content. Therefore, the real area of
contact plays a major role on friction of the studied systems
as well as on the interfacial surface layer. In conclusion,
because the real area of contact is higher when a smooth
sphere is in contact with rubber, and based on the fact that
the real area of contact plays the major role in the total
friction of granite spheres and rubbers, the coefficient of
friction is higher when a smooth sphere is in contact with
the rubber samples compared to a rough ball.
Silica-filled samples generally show a higher coefficient
of friction than carbon black-filled ones. The coefficient of
friction increases with increased filler content for silica-
filled rubbers.
The role of wear debris on friction was studied experi-
mentally. It was shown that wear debris attached to the
spheres in contact with the rubber samples shows higher
friction coefficients. This difference is because of the
modified roughness of the balls, as shown in Figs. 13 and
14, and shear stress when rubber is rubbed against rubber
or when rubber is rubbed against granite. This research
shows the necessity of studying in more detail the nature of
shearing a thin surface layer (with modified properties) as
the main contributor to the total friction.
Fig. 14 Confocal microscopic picture of a polluted rough granite
sphere in contact with MS
Tribol Lett (2014) 54:297–308 307
123
Acknowledgments This project is carried out in the framework of
the innovation program ‘‘GO Gebundelde Innovatiekracht,’’ and
funded by the ‘‘European Regional Development Fund,’’ ‘‘Regio
Twente’’ and ‘‘Provincie Overijssel.’’ The project partners Apollo
Tyres Global R&D B.V., University of Twente (Tire–Road Consor-
tium), Reef Infra, Stemmer Imaging B.V. and the Provincie Gelder-
land are gratefully acknowledged.
References
1. Le Gal, A., Yang, X., Kluppel, M.: Evaluation of sliding friction
and contact mechanics of elastomers based on dynamic-
mechanical analysis. J. Chem. Phys. 123(1), 014704 (2005)
2. Claeys, X., Jingang, Y., Alvarez, L., Horowitz, R., Canudas de
Wit, C., Richard, L.: Tire friction modeling under wet road
conditions. In: American Control Conference, vol. 1793,
pp. 1794–1799 (2001)
3. Lorenz, B., Persson, B.N.J., Fortunato, G., Giustiniano, M.,
Baldoni, F.: Rubber friction for tire tread compound on road
surfaces. J. Phys. Condens. Matter 25(9), 095007 (2013)
4. O’Boy, D.J., Dowling, A.P.: Tyre/road interaction noise-numer-
ical noise prediction of a patterned tyre on a rough road surface.
J. Sound Vib. 323(1–2), 270–291 (2009)
5. Brancati, R., Strano, S., Timpone, F.: An analytical model of
dissipated viscous and hysteretic energy due to interaction forces
in a pneumatic tire: theory and experiments. Mech. Syst. Signal
Process. 25(7), 2785–2795 (2011)
6. Rustighi, E., Elliott, S.J., Finnveden, S., Gulyas, K., Mocsai, T.,
Danti, M.: Linear stochastic evaluation of tyre vibration due to
tyre/road excitation. J. Sound Vib. 310(4–5), 1112–1127 (2008)
7. Susumu, A., Yukio, T., Toshio, M., Akira, A., Kohki, T., Toshio,
K., Mamoru, M., Toshiro, Y.: Investigation of environmental
problems caused by studded tires of automobiles using PIXE.
Nucl. Inst. Methods Phys. Res. B 3(1–3), 516–521 (1984)
8. Bond, R., Morton, G.F., Krol, L.H.: A tailor-made polymer for
tyre applications. Polymer 25(1), 132–140 (1984)
9. Grosch, K.A.: The rolling resistance, wear and traction properties
of tread compounds. Rubber Chem. Technol. 69(3), 495–568
(1996)
10. Williams, A.R.: Tyre to road interaction: a case for application of
research. Tribol. Int. 17(5), 235–241 (1984)
11. Golden, J.M.: A molecular theory of adhesive rubber friction.
J. Phys. A Math. Gen. 8(6), 966–979 (1975)
12. Rand, C.J., Crosby, A.J.: Insight into the periodicity of Schalla-
mach waves in soft material friction. Appl. Phys. Lett. 89(26),
261907 (2006)
13. Tabor, D.: The mechanism of rolling friction. II. The elastic
range. Proc. R. Soc. Sci. Lond. Ser. A Math. Phys. Sci. 229(1),
198–220 (1955). doi:10.2307/99713
14. Moore, D.F.: The Friction and Lubrication of Elastomers. Perg-
amon Press Oxford, New York (1972)
15. Wriggers, P., Reinelt, J.: Multi-scale approach for frictional
contact of elastomers on rough rigid surfaces. Comput. Methods
Appl. Mech. Eng. 198(21–26), 1996–2008 (2009)
16. Persson, B.N.J.: Theory of rubber friction and contact mechanics.
J. Chem. Phys. 115(8), 3840–3861 (2001)
17. Persson, B.N.J.: On the theory of rubber friction. Surf. Sci.
401(3), 445–454 (1998)
18. Lorenz, B., Persson, B.N.J., Dieluweit, S., Tada, T.: Rubber
friction: comparison of theory with experiment. Eur. Phys. J. E
34(12), 1–11 (2011)
19. Pan, X.D.: Wet sliding friction of elastomer compounds on a
rough surface under varied lubrication conditions. Wear
262(5–6), 707–717 (2007)
20. Patent Application (Michelin). US patent 5,227,425
21. Persson, B.N.J., Albohr, O., Tartaglino, U., Volokitin, A.I.,
Tosatti, E.: On the nature of surface roughness with application to
contact mechanics, sealing, rubber friction and adhesion. J. Phys.
Condens. Matter 17(1), R1–R62 (2005)
22. Persson, B.N.J., Albohr, O., Heinrich, G., Ueba, H.: Crack
propagation in rubber-like materials. J. Phys. Condens. Matter
17(44), R1071–R1142 (2005)
23. Blau, P.J.: Embedding wear models into friction models. Tribol.
Lett. 34(1 SPEC. ISS.), 75–79 (2009)
24. Boissonnet, L., Duffau, B., Montmitonnet, P.: A wear particle-
based model of friction in a polymer-metal high pressure contact.
Wear 286–287, 55–65 (2012)
25. Williams, M.L., Landel, R.F., Ferry, J.D.: The temperature depen-
dence of relaxation mechanisms in amorphous polymers and other
glass-forming liquids. J. Am. Chem. Soc. 77(14), 3701–3707 (1955)
26. Ferry, J.D.: Viscoelastic Properties of Polymers. Wiley, New
York (1980)
27. Fritzsche, J., Kluppel, M.: Structural dynamics and interfacial
properties of filler-reinforced elastomers. J. Phys. Conden. Matter
23(3), 035104 (2011)
28. Kluppel, M.: Evaluation of viscoelastic master curves of filled
elastomers and applications to fracture mechanics. J. Phys.
Conden. Matter 21(3), 035104 (2009)
29. Lorenz, B., Pyckhout-Hintzen, W., Persson, B.N.J.: Master curve
of viscoelastic solid: using causality to determine the optimal
shifting procedure, and to test the accuracy of measured data.
Polymer 55(2), 565–571 (2014). doi:10.1016/j.polymer.2013.12.
033
30. Cochet, P., Barriquand, L., Bomal, Y., Touzet, S.: Precipitated
Silica in Tire Tread. Paper presented at the ACS, Rubber Divi-
sion, Cleveland, OH, Oct. 17–20 (1995)
31. Persson, B.N.J.: Rubber friction: role of the flash temperature.
J. Phys. Condens. Matter 18(32), 7789–7823 (2006)
32. Rodriguez, N.V., Masen, M.A., Schipper, D.J.: Tribologically
modified surfaces on elastomeric materials. Proc. Inst. Mech.
Eng. Part J J. Eng. Tribol. 227(5), 398–405 (2013)
33. Momozono, S., Nakamura, K., Kyogoku, K.: Theoretical model
for adhesive friction between elastomers and rough solid sur-
faces. J. Chem. Phys. 132(11), 114105 (2010)
34. Bahadur, S.: The development of transfer layers and their role in
polymer tribology. Wear 245(1–2), 92–99 (2000)
35. Mergler, Y.J., Schaake, R.P., Huis in’t Veld, A.J.: Material
transfer of POM in sliding contact. Wear 256(3–4), 294–301
(2004)
308 Tribol Lett (2014) 54:297–308
123