Embed Size (px)
Citation preview

On the Determinants of Corporate Social
Responsibility: International Evidence
on the Financial Industry
Hsiang-Lin ChihHsiang-Hsuan Chih
Tzu-Yin Chen
ABSTRACT. This article sets out to undertake a thor-
ough, point-by-point examination of the theory postu-
lated by Campbell (2007), in which an attempt is made to
specify the conditions under which corporations may or
may not act in socially responsible ways. In order to ensure
the overall reliability of our study, and to attempt to pro-
vide a new understanding of, and greater insights into,
whether corporate social responsibility (CSR) is affected
by financial and institutional variables, we empirically
investigate a total of 520 financial firms in 34 countries,
between the years 2003 and 2005. Our empirical findings
are: (i) firms with larger size are more CSR minded, and
the financial performance and CSR are not related; (ii)
firms would actually act in more socially responsible ways
to enhance their competitive advantages when the market
competitiveness is more intense; (iii) financial firms in
countries with stronger levels of legal enforcement tend to
engage in more CSR activities; however, interestingly and
rather strikingly, those firms in countries with stronger
shareholder rights tend to engage in less CSR activities; and
(iv) self-regulation within the financial industry has a sig-
nificantly positive effect on CSR, with firms being found
to act in more socially responsible ways in those countries
which have more cooperative employer–employee rela-
tions, higher quality management schools, and a better
macroeconomic environment.
KEY WORDS: corporate social responsibility (CSR),
Dow Jones Sustainability Index, institutional theory,
investor protection, legal enforcement
Introduction
In light of the accounting scandal at Enron, the recent
Wall Street’s crisis and the Madoff scandal, consid-
erable commentary has begun to attribute such fraud
to what is now being referred to as ‘‘a decay in
business morality’’ (New York Times, 2002) and to
interpret ‘‘we don’t just need a financial bailout; we
need an ethical bailout. We need to re-establish the
core balance between our markets, ethics, and reg-
ulations’’ (New York Times, 2008).1 Such criticism
goes some way explaining why leading speakers on
public opinion, among consumers, investors, and
commerce, in general, have begun to advocate a duty
of enterprise leaders not to gear their businesses to-
ward the pursuit of pure profit at the expense of
fulfilling their obligations to their employees, to the
environment, and to society as a whole.2
Hsiang-Lin Chih is the Chairperson and Professor of Depart-
ment of Banking and Cooperative Management at National
Taipei University, Taiwan. His current research focuses on
corporate social responsibility, corporate governance, and
financial institutions management. His writings have
appeared in Journal of Quantitative and Financial
Analysis, Journal of Banking and Finance, Corporate
Governance: An International Review, Journal of
Business Ethics, Academia Economic Papers and in
other journals. He received his Ph.D. from the National
Taiwan University in 1998.
Hsiang-Hsuan Chih is currently the Associate Professor of
Department of Finance in National Dong Hwa University in
Taiwan. Her current research focuses on corporate finance,
behavioral finance and corporate governance. Her recent
publications include Journal of Management, Review of
Securities and Futures Markets, and Review of
Financial Risk Management. She received her Ph.D.
degree from National Central University in 2003.
Tzu-Yin Chen is a research assistant for the Department of
Banking and Cooperative Management at National Taipei
University, Taiwan. Her research focuses on corporate social
responsibility and financial institutions management. She
received her master degree from the Department of
Cooperative Economics, College of Business, National
Taipei University, Taiwan.
Journal of Business Ethics (2010) 93:115–135 � Springer 2009DOI 10.1007/s10551-009-0186-x

Although extensive research has already been
undertaken in this particular area, the related studies
have typically tended to focus on the relationship
existing between corporate social responsibility
(CSR) and financial performance (Coombs and
Gilley, 2005; Griffin and Mahon, 1997; Hillman and
Keim, 2001; McWilliams and Siegel, 2000, 2001;
Pava and Krausz, 1996; Roberts and Dowling, 2002;
Rowley and Berman, 2000; Simpson and Kohers,
2002; Waddock and Graves, 1997; Walsh et al.,
2003). As such, little theoretical attention has thus far
been placed on trying to gain a better understanding
of whether or not, and if so why, corporations act in
socially responsible ways (Campbell, 2007).3
Margolis and Walsh (2003) have shown them-
selves to be highly critical of the extant literature for
its tendency to ignore several factors, other than
corporate financial performance, which may well
affect CSR; and indeed, there are now growing calls
among other researchers (for example, Walsh et al.,
2003) for much more serious theoretical inquiry into
this issue. A prime example of such calls is provided
by the study of Campbell (2007), which offers an
institutional theory on CSR comprising a series of
propositions specifying the conditions under which
corporations are more (or less) likely to behave in
socially responsible ways.
The conditions proposed by Campbell include
the general financial condition of the firm, the health
of the economy, the level of competition faced by a
corporation (see also Shleifer, 2004), and certain
institutional factors, including public and/or private
regulations, the presence of non-governmental and
other independent organizations, institutionalized
norms, associative behavior among corporations, and
organized dialog between corporations and their
stakeholders.
The primary aim of this article is to empirically
investigate whether or not, and if so why, corpora-
tions will tend to act in socially responsible ways. In an
attempt to ensure the overall reliability of our study,
we employ cross-country data so as to provide a firm
understanding of, and greater insights into, whether
CSR is affected by firm- and country-level variables.
Furthermore, our study also attempts to investigate
the determinants of socially responsible corporate
behavior from various global dimensions, including
firm-specific financial characteristics, regulations,
institutions, and macroeconomic conditions.
In order to effectively measure the degree of CSR
across firms and countries, we take as our CSR
firms, constituent companies of the Dow Jones
Sustainability World Index (DJSI World), an index
which is compiled as a result of cooperation between
the Dow Jones Indexes, STOXX Limited, and the
SAM.4 In order to qualify for inclusion in the DJSI
World Index, companies must be in the top 10% of
the largest 2,500 companies in the Dow Jones World
Index, in terms of three socially responsible dimen-
sions: economic, environmental, and social.
The economic dimension comprises four criteria:
corporate governance, risk and crisis management,
codes of conduct/compliance/corruption and bribery,
and industry-specific criteria. The environmental
dimension comprises three criteria: environmental
performance (eco-efficiency), environmental report-
ing, and industry-specific criteria. The social dimen-
sion comprises six criteria: human capital development,
talent attraction and retention, labor practice indicators,
corporate citizenship/philanthropy, social reporting,
and industry-specific criteria.5
The financial firms extracted from these 2,500
companies listed on the Dow Jones World Index are
classified into two groups: the CSR Group, which
includes the financial firms that are listed in the DJSI
World, and the non-CSR Group, which includes
those firms that are not listed in the DJSI World.6
The remainder of this article is organized as
follows. An explanation of the Campbell (2007)
propositions specifying the determinants of CSR is
provided in ‘‘Determinants of CSR section,’’ along
with the selection of the appropriate measures to
proxy for these determinants. An explanation on the
empirical models used in this study is provided in
‘‘Econometric model’’ section, followed in ‘‘Data and
descriptive statistics’’ section, by a summary of the
data and the descriptive statistics. A discussion of the
empirical results is undertaken in ‘‘Empirical results’’
section, with ‘‘Conclusions’’ section presenting the
conclusions drawn from this study.
Determinants of CSR
Campbell (2007) offers a comprehensive institutional
theory on CSR comprising a series of propositions
specifying the conditions under which corporations
are likely to behave in socially responsible ways. The
116 Hsiang-Lin Chih et al.

focus of this section, based on Campbell (2007), is
placed on providing an explanation of the determi-
nants of CSR and proposing appropriate measures to
proxy for these determinants in our empirical study.
Financial performance and economic environment
Campbell (2007) proposes that since firms that are less
profitable have fewer resources to spare for socially
responsible activities than those firms that are more
profitable, ‘‘Corporations will be less likely to act in
socially responsible ways where they are currently
experiencing relatively weak financial performance’’
(Waddock and Graves, 1997). It therefore follows
that firm’s profitability is expected to be positively
related to their level of CSR; thus, we use return on
assets (ROA), obtained from the Compustat Global
Vantage database, to measure the profitability among
our cross-country sample of firms. Firm size is also
used as a control variable, since larger firms are subject
to closer scrutiny by the public, thereby raising the
likelihood of such firms acting in more socially
responsible ways (Dierkes and Coppock, 1978;
Fombrun and Shanley, 1990; Trotman and Bradley,
1981).
As to the economic environment, Campbell
(2007) argues that ‘‘Corporations will be less likely
to act in socially responsible ways where they are
operating in a relatively unhealthy economic envi-
ronment where the possibility for near-term profit-
ability is limited.’’ An example of this would be
circumstances of high inflation, low productivity
growth, and weak consumer confidence, a situation
in which it would seem relatively difficult for firms
to achieve healthy near-term profits; under such
circumstances, firms would arguably be less likely to
behave in socially responsible ways (Campbell,
2007). We therefore adopt the Inflation Rate (INF),
the Industrial Production Index (IPI), and the
Consumer Confidence Index (CCI) as the economic
environment variables for our sample countries.
The INF is taken from the World Development
Index; the IPI, which is obtained from the International
Financial Statistics, represents the state of production
within the industrial sector at a given period of time,
as compared to a reference point in time, with a
higher score indicating greater production within the
industrial sector; the CCI is taken from ACNielsen,
which undertakes regular surveys on consumer
confidence for local markets, with a higher score
indicating stronger consumer confidence.
Competition
‘‘Corporations will be less likely to act in socially
responsible ways if there is either too much, or
too little competition; that is, the relationship
between competition and socially responsible cor-
porate behavior will be curvilinear’’ (Campbell,
2007). Campbell’s proposition here is that in cir-
cumstances where there is extremely intensive competi-
tion, corporations are likely to act in socially irresponsible
ways to save money, since their profit margins will already
be sufficiently narrow as to put shareholder value at risk
(Campbell, 2007; Shleifer, 2004).
However, at the other extreme, in situations
where competition is virtually non-existent, a cor-
poration may also have little interest in using
philanthropic measures to enhance its ‘‘competitive
advantage’’ (Porter and Kramer, 2002) or to improve
its long-term financial performance, since its stake-
holders (for example, its customers and suppliers)
have very few alternatives (Campbell, 2007).
In order to estimate the extent of competitiveness
and to indicate the structure of the banking systems
across our sample countries, we obtain the com-
petitiveness measure, H-statistics – taken directly
from Chih and Cheng (2008) in which the Panzar
and Rosse (1987) and Claessens and Laeven (2004)
methodologies are applied – to estimate the degree
of competitiveness across the banking systems of 61
countries, with a higher value indicating greater
competitiveness.
Legal environment
Campbell (2007) suggests that ‘‘Corporations will be
more likely to act in socially responsible ways if there
are strong and well-enforced state regulations in
place to ensure such behavior, particularly if the
process by which these regulations and enforcement
capacities were developed was based upon negotia-
tion and consensus building among corporations,
government and the other relevant stakeholders.’’
According to Leuz et al. (2003), legal systems can
117On the Determinants of Corporate Social Responsibility

protect outside investors by conferring on them the
right to discipline insiders (for example, to replace
managers), and also through the enforcement of
contracts designed to limit the private control ben-
efits of insiders.
As a result, legal systems, which effectively protect
outside investors, reduce the incentives for insiders
to act in irresponsible ways, such as engaging in the
manipulation or obfuscation of a firm’s earnings to
conceal their own rent-seeking behavior. We
therefore use the Shareholder Rights and Legal
Enforcement indices as proxies for the legal envi-
ronment across our sample countries. The former
index, which is based on La Porta et al. (1998), is an
aggregate measure of (minority) Shareholder Rights,
comprising (i) the country allows shareholders to
mail their proxy vote to the firm, (ii) shareholders
are not required to deposit their shares prior to the
general shareholders’ meeting, (iii) cumulative vot-
ing or proportional representation of minorities in
the board of directors is allowed, (iv) an oppressed
minorities mechanism is in place, (v) the minimum
percentage of share capital that entitles a shareholder
to call for an extraordinary shareholders’ meeting is
less than or equal to 10%, or (vi) shareholders have
preemptive rights that can be waived only by a
shareholders’ vote. The index ranges from 0 to 6,
with a higher score indicating higher Shareholder
Rights. The latter index, also adopted by La Porta
et al. (1998), measures the mean score across three
legal variables for each country, comprising: (i) the
efficiency of the judicial system; (ii) an assessment of
the rule of law; and (iii) the corruption index. All
three variables range from 0 to 10, with a higher
score indicating a better legal enforcement.
We also consider the origin of the legal system of
each country, comprising English, French, German,
or Scandinavian legal origins, essentially because our
results may suffer from endogeneity bias if CSR,
Shareholder Rights and Legal Enforcement are
simultaneously determined. We address this concern
by regarding the legal origins of the countries as legal
environment variables, since a country’s legal origin
can be considered as predetermined and exogenous
(Leuz et al., 2003). La Porta et al. (1998) reported
that the strongest measures for the legal protection of
investors were generally found in English common
law countries, while German and Scandinavian civil
law countries provided medium-level protection,
and French civil law countries demonstrated the
weakest levels of protection.
Private regulation and the presence of independent
organizations
Campbell (2007) further proposes that ‘‘Corpora-
tions will be more likely to act in socially responsible
ways if there is a system of well organized and
effective industrial self-regulation in place to ensure
such behavior, particularly if it is based upon the
perceived threat of state intervention or broader
industrial crisis, and if the state provides support for
this form of industrial governance’’ and also, that
‘‘Corporations will be more likely to act in socially
responsible ways if there are private, independent
organizations, including NGOs, social movement
organizations, institutional investors, and the press,
in their environment, who monitor their behavior
and, when necessary, mobilize to change it.’’
In order to identify appropriate measures to proxy
for industrial self-regulation or the presence of
independent organizations, we consider two kinds of
principles, the Equator and Wolfsberg’s principles.
The Equator Principles were developed as a result of
cooperation between 59 financial institutions and
the International Finance Corporation (IFC) of the
World Bank Group, while the Wolfsberg Principles
were developed by the Wolfsberg Group, an asso-
ciation of 12 global banks, in conjunction with
Transparency International. An important criterion
in the adoption of these principles is that if a financial
firm adopts either the Equator or the Wolfsberg
Principles, it will be required to act in socially
responsible ways and to engage in sound environ-
mental management practices.7,8
Business education environment
Campbell (2007) notes that ‘‘Corporations will be
more likely to act in socially responsible ways if they
operate in an environment where normative calls for
such behavior are institutionalized, for example, in
important business publications, business school
curricula, and other educational venues in which
corporate managers participate.’’ In order to measure
the soundness of the business educational environ-
118 Hsiang-Lin Chih et al.
ment across countries, we use the Quality of Man-
agement Schools Index, taken from the Global
Competitiveness Report of the World Economic For-
um, with a higher score indicating a higher quality
management school.
Employer–employee relations
Campbell (2007) also suggests that ‘‘Corporations will
be more likely to act in socially responsible ways if
they belong to trade or employers associations, but
only if these associations are organized in ways that
promote socially responsible behavior’’ and that
‘‘Corporations will be more likely to act in socially
responsible ways if they are engaged in institutional-
ized dialog with unions, employees, community
groups, investors and other stakeholders.’’ In order
to test these propositions, we use the Cooperation
in Labor–Employer Relations Index, which is also
taken from the Global Competitiveness Report, as an
explanatory variable in our regression models. The
scores range from 1 to 7, with a higher score
indicating higher cooperative employer–employee
relations.
Econometric model
In this section, we test the extent to which financial
characteristics and institutional variables have an
impact on the likelihood of firms engaging in CSR.
We first of all classify the financial firms from the
largest 2,500 companies included in the Dow Jones
World Index into two groups, the CSR Group,
which includes the financial firms listed on the DJSI
World, and the non-CSR Group, which includes
those firms that are not listed on the DJSI World.
Equation 1 then tests the relationship between CSR
and its determinants, as follows:
CSRi;j;t ¼ a0 þ a1ROAi;j;t þ a2TAi;j;t þ a3Hj
þ a4H2j þ a5LAWj þ a6QMSj;t
þ a7CLERj;t þ a8REGj;t þ a9INFj;t
þ a10IPIj;t þ a11CCIj þ ei;j;t; ð1Þ
where CSRi,j,t is a dummy variable for sample firm
i of country j at year t, which takes the value of 1
if the firm belongs to the CSR Group and 0 if the
firm belongs to the non-CSR Group9; ROAi,j,t
the return on assets for sample firm i of country j
at year t; TAi,j,t the total assets for sample firm i of
country j at year t; and Hj the H-statistics (obtained
from Chih and Cheng, 2008), which measure the
degree of competitiveness in the financial industry
of country j, with a higher value indicating greater
competitiveness.10 LAWj comprises three kinds of
law variables for country j, the legal origin, the
Shareholder Rights index and the Legal Enforcement
index. The legal origin for country j, which is
taken from La Porta et al. (1998), is a set of dum-
mies (French, German, and Scandinavian, with
English as the omitted dummy). The Shareholder
Rights index for country j, which is also taken
from La Porta et al. (1998), ranges from 0 to 6,
with a higher score indicating enhanced share-
holder rights. The Legal Enforcement index for
country j, which was again used by La Porta et al.
(1998), ranges from 0 to 10, with a higher score
indicating better legal enforcement.
QMSj,t, the Quality Of Management Schools for
country j at year t, which ranges from 1 to 7, is taken
from the Global Competitiveness Report of the World
Economic Forum, with a higher score indicating a
higher quality management school; ‘‘cooperative
employer–employee relations’’ for country j at year t
(CLERj,t), ranging from 1 to 7, is the Cooperation in
Labor–Employer Relations Index taken from the
Global Competitiveness Report, with a higher score
indicating better cooperative employer–employee
relations.11 REGi comprises two types of industry
self-regulatory measures for firm i, ‘‘Equator Princi-
ples’’ and ‘‘Wolfsberg Principles,’’ which are dummy
valuables taking the value of 1 if the firm adopts either
Equator or Wolfsberg Principles, and 0 if the firm
does not adopt either of these principles; the INF for
country j at year t (INFj,t) is taken from the World
Development Index of the World Bank.
IPIj,t, the Industrial Production Index for country
j at year t, is taken from the International Financial
Statistics of the International Monetary Fund, with a
higher score indicating greater production within the
industrial sector. CCIj, the Consumer Confidence
Index for country j, is taken from ACNielsen, with a
higher score indicating stronger consumerconfidence.
ei,j,t is the error term at year t.
119On the Determinants of Corporate Social Responsibility

Data and descriptive statistics
Data sources
We begin by searching through the sample countries
for the names of the financial firms included in the
largest 2,500 companies listed on the Dow Jones
World Index and on the DJSI World. The former is
provided by the Dow Jones Company, while the
latter is provided by the Dow Jones Indices,
STOXX Limited and the SAM Group.12
The constituents that appear in the DJSI World
index are classified as ‘‘CSR firms,’’ while those
appearing in the Dow Jones World, but not in the DJSI
World index, are referred to as ‘‘non-CSR’’ firms. We
screen the Compustat Global Vantage database for
these firms to obtain the required financial data cov-
ering the years 2003–2005. Our search, based upon
these criteria, provided a final sample of 520 financial
firms in 34 countries for the period under examination,
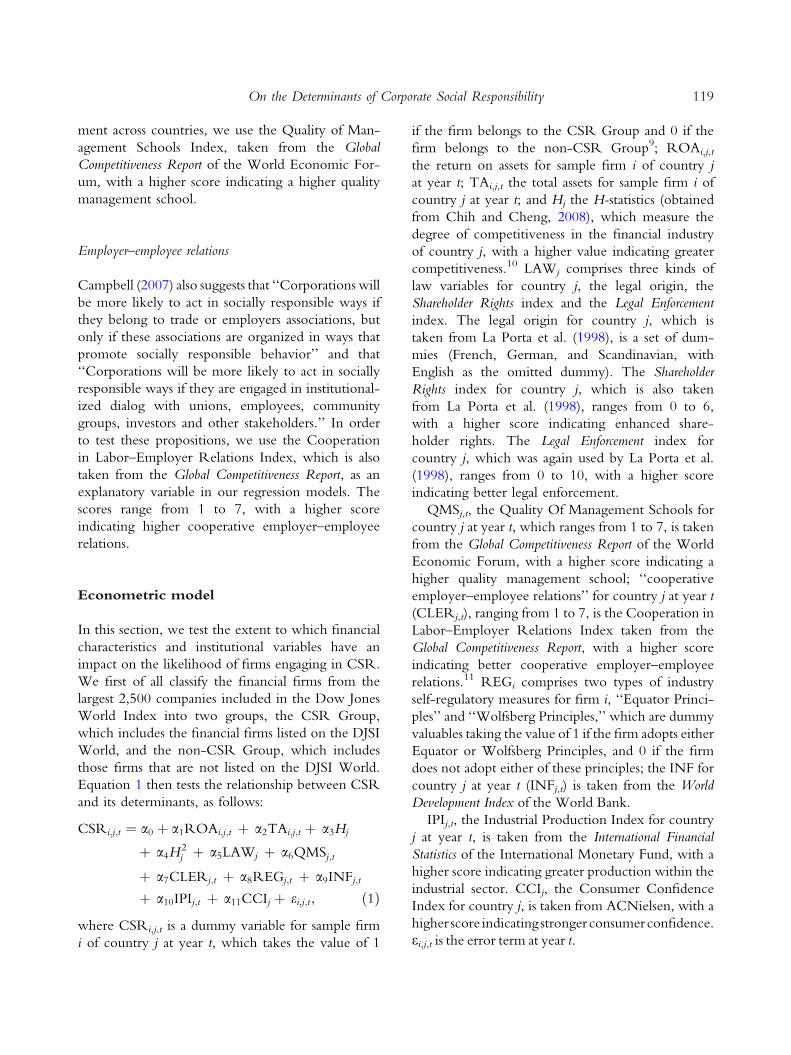
giving a total of 1,323 firm years (Table I).
Descriptive statistics
As shown in Table I, the respective numbers of CSR
and non-CSR financial firms in our sample are 176
(54 + 57 + 65) and 1,141 (361 + 389 + 397). The
first column shows the names of the 34 sample
countries, while the third to fifth columns report the
number of sample firms included in the DJSI World
index for each country and for each of the sample
years. In 2005, for example, the countries with the
highest number of financial firms in the DJSI World
index were the UK (16), the US (8), and Australia (7),
while 19 sample countries had no financial firms in the
index.13 The last two columns in Table I present the
average profitability (ROA) and asset size of the CSR
and non-CSR financial firms for each country; based
upon the test of the means, before taking other insti-
tutional factors into account, CSR-minded financial
firms are found to be larger in size (t = 8.088) and
have poorer financial performance (t = -2.051).
Details on the basic H-statistics, Quality of Man-
agement Schools, and cooperation in employer–em-
ployee relations are presented in Table II. The highest
H-statistics are found in Taiwan (0.961), Hong Kong
(0.938), and the Netherlands (0.880); conversely, the
three countries with the lowest H-statistics are Spain
TA
BLE
I
Des
crip
tive
stat
istics
of
CSR
and
firm
-spec
ific
var
iable
sof
finan
cial
firm
sac
ross
34
countr
ies
Countr
yG
roup
No.
of
firm
s
in2003
No.
of
firm
s
in2004
No.
of
firm
s
in2005
No.
of
firm
s
inE
quat
or
Pri
nci
ple
s
No.
of
firm
s
inW
olfsb
erg
Pri
nci
ple
s
RO
A
(%)
Tota
las
sets
(US$
Million)
1A
ust
ralia
CSR
67
71
–4.5
414,1
62.3
69
Non-C
SR
12
14
14
––
3.3
09,1
01.4
24
2A
ust
ria
CSR
––
––
––
–
Non-C
SR
22
3–
–0.5
4136,6
42.3
17
3B
elgiu
mC
SR
11
11
–4.9
924,7
06.9
73
Non-C
SR
–2
2–
–6.7
77,5
83.6
25
4B
razi
lC
SR
21
11
–2.1
852,2
42.2
4
Non-C
SR
–1
21
–2.1
65,0
804.3
07
5C
anad
aC
SR
22
21
–0.5
5295,5
43.2
79
Non-C
SR
15
16
17
3–
1.1
080,8
96.6
08
120 Hsiang-Lin Chih et al.

TA
BLE
I
continued
Countr
yG
roup
No.
of
firm
s
in2003
No.
of
firm
s
in2004
No.
of
firm
s
in2005
No.
of
firm
s
inE
quat
or
Pri
nci
ple
s
No.
of
firm
s
inW
olfsb
erg
Pri
nci
ple
s
RO
A
(%)
Tota
las
sets
(US$
Million)
6C
hile
CSR
––
––
––
–
Non-C
SR
31
1–
–3.8
611,2
81.0
22
7C
ypru
sC
SR
––
––
––
–
Non-C
SR
1–
–0.5
926,2
63.7
53
8C
zech
Rep
ublic
CSR
––
––
––
–
Non-C
SR
1–
–1.7
920,9
10.4
00
9D
emar
kC
SR
––
––
––
–
Non-C
SR
33
4–
–1.0
620,5
18.1
44
10
Fin
land
CSR
––
––
––
–
Non-C
SR
11
2–
–1.6
640,1
92.0
83
11
Fra
nce
CSR
23
4–
–1.1
2253,9
68.3
32
Non-C
SR
97
7–
–0.5
6135,0
57.9
57
12
Ger
man
yC
SR
44
5–
10.3
3651,7
31.8
29
Non-C
SR
55
5–
–0.6
0108623.2
76
13
Gre
ece
CSR
––
––
––
–
Non-C
SR
44
5–
–0.8
444,5
14.1
90
14
Hong
Kong
CSR
––
––
––
–
Non-C
SR
10
11
11
––
4.5
014,5
32.7
55
15
Hungar
yC
SR
––
––
––
–
Non-C
SR
1–
–
16
Indones
iaC
SR
––
––
––
–
Non-C
SR
21
1–
–2.1
518,0
37.3
17
17
Irel
and
CSR
––
––
––
–
Non-C
SR
33
3–
–0.9
162,7
40.0
18
18
Ital
yC
SR
23
3–
–0.6
0194,9
78.7
29
Non-C
SR
13
12
12
1–
0.6
156,7
79.0
36
19
Japan
CSR
55
5–
–0.5
755,2
11.5
40
Non-C
SR
60
66
66
1–
0.4
036,2
13.4
18
20
Mal
aysia
CSR
––
––
––
–
Non-C
SR
44
3–
–1.2
222,0
37.4
09
21
Mex
ico
CSR
––
––
––
–
Non-C
SR
22
3–
–2.7
512,5
78.0
68
121On the Determinants of Corporate Social Responsibility
TA
BLE
I
continued
Countr
yG
roup
No.
of
firm
s
in2003
No.
of
firm
s
in2004
No.
of
firm
s
in2005
No.
of
firm
s
inE
quat
or
Pri
nci
ple
s
No.
of
firm
s
inW
olfsb
erg
Pri
nci
ple
s
RO
A
(%)
Tota
las
sets
(US$
Million)
22
Net
her
lands
CSR
55
53
10.6
8328,7
57.5
48
Non-C
SR
22
21
–7.8
47,7
65.5
69
23
Norw
ayC
SR
11
1–
–0.8
127,3
10.6
45
Non-C
SR
11
1–
–0.7
7127,9
97.8
9
24
Pola
nd
CSR
––
––
––
–
Non-C
SR
––
2–
–1.8
522,9
48.9
79
25
Port
ugal
CSR
––
––
––
–
Non-C
SR
33
31
–0.7
058,7
33.1
74
26
Sin
gap
ore
CSR
––
––
––
–
Non-C
SR
54
5–
–1.0
968,8
65.1
62
27
South
Afr
ica
CSR
11
21
–1.0
892,4
69.8
44
Non-C
SR
46
6–
–5.3
316,4
28.7
17
28
South
Kore
aC
SR
––
––
––
–
Non-C
SR
45
10
––
0.8
844,7
81.8
83
29
Spai
nC
SR
11
1–
–0.6
6726,6
67.2
06
Non-C
SR
56
10
1–
0.8
627,9
30.8
71
30
Sw
eden
CSR
11
––
–0.6
6146,4
31.6
17
Non-C
SR
47
7–
–1.2
264,7
24.6
23
31
Sw
itze
rlan
dC
SR
44
41
10.5
0484,0
90.3
25
Non-C
SR
55
5–
–0.8
015,1
76.1
47
32
Tai
wan
CSR
––
––
––
–
Non-C
SR
12
13
13
––
0.8
941,4
61.3
92
33
UK
CSR
13
14
16
42
0.8
814,1
43.4
42
Non-C
SR
23
21
17
1–
1.3
619,0
28.4
17
34
USA
CSR
44
83
10.8
6564,2
45.8
96
Non-C
SR
145
161
154
–1
1.5
312,7
52.2
99
Tota
lsC
SR
54
57
65
16
7–
–
Non-C
SR
361
389
397
10
1–
–
Aver
age
CSR
––
––
–1.8
5356,2
99.3
57
Non-C
SR
––
––
–2.4
673,7
46.6
44
Tes
tof
mea
ns:
CSR
ver
sus
non-C
SR
–2.0
5**
8.0
88***
Not
es:
**In
dic
ates
signifi
cance
atth
e5%
level
;***in
dic
ates
signifi
cance
atth
e1%
level
.
122 Hsiang-Lin Chih et al.

TABLE II
Descriptive statistics of the institutional variables across 34 countries
Country H-statisticsa Quality of management
schoolsb (average, 2003–2005)
Cooperation in labor–employer
relationsc (average, 2003–2005)
1 Australia 0.60 6.22 3.27
2 Austria 0.52 5.42 5.77
3 Belgium 0.54 5.98 2.79
4 Brazil 0.68 4.06 3.33
5 Canada 0.39 8.52 3.34
6 Chile 0.32 6.58 4.42
7 Cyprus – 2.86 3.69
8 Czech Republic 0.54 4.46 4.00
9 Demark 0.30 6.29 7.49
10 Finland 0.41 6.59 4.78
11 France 0.42 7.03 2.41
12 Germany 0.67 6.29 3.79
13 Greece 0.41 3.19 3.18
14 Hong Kong 0.94 4.17 6.80
15 Hungary 0.36 4.27 3.85
16 Indonesia 0.59 3.41 3.08
17 Ireland 0.28 4.85 3.57
18 Italy 0.62 3.77 2.74
19 Japan 0.24 3.28 6.35
20 Malaysia 0.86 3.98 6.15
21 Mexico 0.61 4.09 3.82
22 Netherlands 0.88 6.59 6.16
23 Norway 0.34 6.06 5.66
24 Poland 0.71 4.00 3.46
25 Portugal 0.78 4.95 3.57
26 Singapore 0.49 6.28 8.63
27 South Africa 0.48 5.99 2.76
28 South Korea 0.61 3.45 2.56
29 Spain 0.02 6.82 3.79
30 Sweden 0.21 7.72 6.11
31 Switzerland 0.59 7.36 7.02
32 Taiwan 0.96 4.94 5.79
33 UK 0.54 7.81 5.42
34 USA 0.57 8.34 4.39
Average 0.53 5.46 4.53
SD 0.22 1.60 1.61
Notes: aThe H-statistics are taken from Chih and Cheng (2008), with a higher value indicating a more competitive
financial environment.b‘‘Quality of Management Schools’’ scores, ranging from 1 to 7, are taken from the Global Competitiveness Report of the
World Economic Forum, with a higher score indicating a higher quality of management school; we normalize the scores
across management schools, per country per year, using the mean divided by the standard deviation, and thus the
normalized scores range from 2.86 to 8.52.c‘‘Cooperation in Labor Employer Relations’’ scores, ranging from 1 to 7, are also taken from the Global Competitiveness
Report, with a higher score indicating better cooperative relations; we normalize the scores across firms, per country per
year, using the mean divided by the standard deviation, and thus the normalized scores range from 2.41 to 8.63.
123On the Determinants of Corporate Social Responsibility

(0.019), Sweden (0.211), and Japan (0.240), suggesting
lower competitiveness levels in the financial industries
of these countries. The top three countries with the
highest quality of management schools are Canada
(8.524), the US (8.342), and the UK (7.810), while
those countries which demonstrate the most cooper-
ative employer–employee relations are Singapore
(8.625), Denmark (7.494), and Switzerland (7.023).
As shown in Table III, along with Switzerland, the
two Scandinavian countries of Norway and Denmark
clearly have the highest scores on investor protection
among all countries, followed by other European
countries, including the UK, Germany, France, and
the Netherlands, as well as the US and Canada.
Norway and Denmark also have the highest con-
sumer confidence levels. In contrast, Latin American
and some Asian countries have weaker scores for
investor protection and higher INFs.
Empirical results
The results of the estimations on the determinants of
CSR are provided in Table IV, which presents eight
model specifications each with a different combi-
nation of explanatory variables. The first four model
specifications consider the Equator Principles, while
the subsequent four specifications take into account
the Wolfsberg Principles. We add the square terms
of the H-statistics into specification (B), (D), (F), and
(H) to investigate whether the relationship between
competition and socially responsible corporate
behavior is curvilinear.
As shown in Table IV, the coefficients of ROA
are overwhelmingly positive and significant, indi-
cating that financial firms achieving better financial
performance will act in more socially responsible
ways, consistent with Campbell (2007); total assets
are also found to have a positive correlation with
CSR, indicating that larger firms, which are natu-
rally subject to closer scrutiny by the public, will act
in more socially responsible ways.
The results for the remaining explanatory variables
are also interesting. First, the H-statistic coefficients
are significantly positive, while the H-statistics2 coef-
ficients are significantly negative, which, consistent
with Campbell (2007), implies that firms will be less
likely to act in socially responsible ways if there is
either too much, or too little, competition.
Second, financial firms in countries with French
and German legal origins are more CSR minded,
while those firms in countries with stronger legal
enforcement levels engage in more CSR activities.
However, interestingly, and rather strikingly, the
coefficients of Shareholder Rights are overwhelm-
ingly negative and significant, which suggests that
financial firms in countries with stronger Share-
holder Rights will tend to be geared toward share-
holders’ welfare at the expense of fulfilling their
obligations to other stakeholders.
Third, significantly positive coefficients are found
for the Quality of Management Schools Index (QMS)
and the Cooperation in Labor–Employer Relations
Index (CLER) in some of the specifications, which
suggests that financial firms will act in more socially
responsible ways in countries with better quality
management schools and where there are more
cooperative employer–employee relations; this is again
consistent with the findings of Campbell (2007). Those
firms in countries with well-organized and effective
private regulations, as well as the presence of inde-
pendent organizations, will tend to be more CSR-
minded, consistent with Campbell (2007), since the
coefficients of both the Equator and Wolfsberg Prin-
ciples are significantly positive across all specifications.
Finally, the coefficients of the INF are signifi-
cantly negative in specification (A), while the coef-
ficients of the CCI are all significantly positive –
with the exception of specification (H) – which
implies that financial firms in countries with higher
consumer confidence levels and lower INFs will act
in more socially responsible ways, again providing
support for the Campbell (2007) propositions.
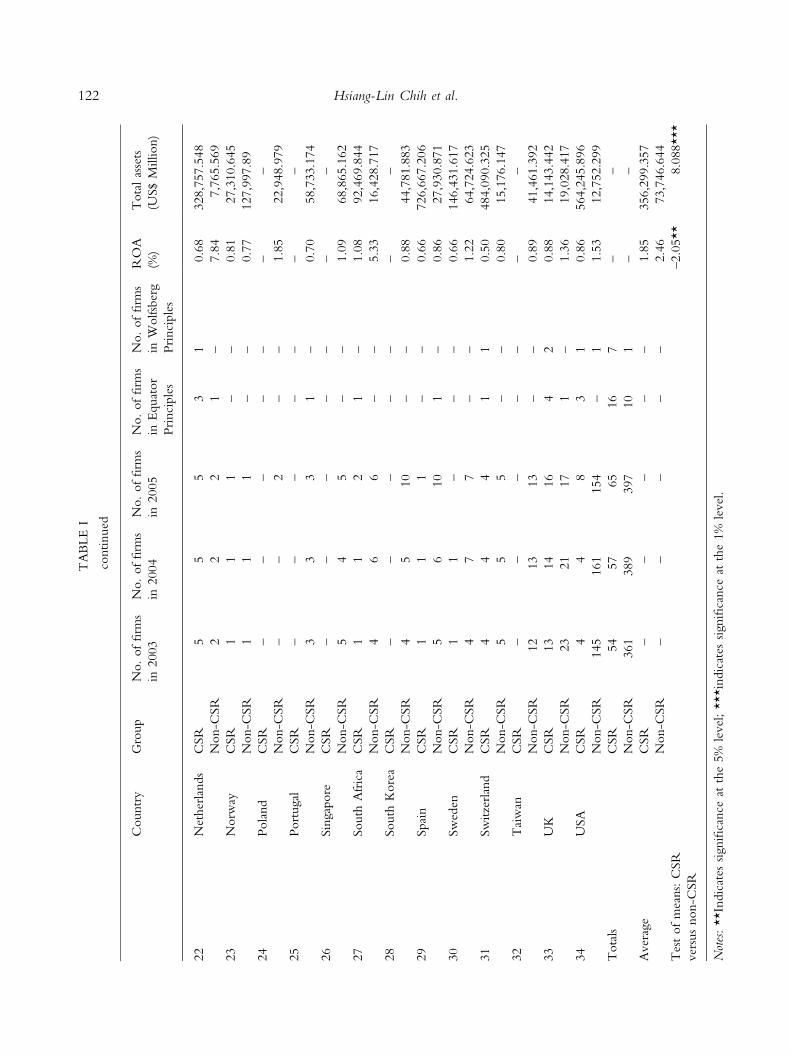
However, in order for the robustness check, two
additional settings are taken into account. First, since
most of the competitive markets are in the devel-
oping countries, such as Malaysia, Mexico, South
Korea, and Taiwan (as shown in Table II), and none
of them have CSR companies (as shown in Table I),
which is the possible shortcomings of the DJSI-
biased selection procedure as shown in ‘‘Notes’’ no.
13, it is worthwhile to focus on those countries with
the co-existence of CSR and non-CSR firms, and
check if the results are consistent with those in
Table IV. We exclude developing countries without
CSR firms, including Malaysia, Mexico, South
Korea, and Taiwan, and we find, as shown in
Table V, most of the empirical results are the same as
124 Hsiang-Lin Chih et al.

TABLE III
Descriptive statistics of the legal and macroeconomic variables across 34 Countries
Country Legal
origina
Legal
enforcementbShareholder
rightscInflationd (%) IPIe
(2000 = 100)
CCIf
1 Australia Eng 9.51 4 3.34 – 117
2 Austria Ger 9.36 2 1.84 111.74 –
3 Belgium Fr 9.44 – 2.12 102.80 100
4 Brazil Fr 6.13 3 2.50 – 93
5 Canada Eng 9.75 5 3.14 99.87 110
6 Chile Fr 6.52 5 5.89 – 102
7 Cyprus – – – – 110.70 –
8 Czech Republic – – – 0.05 134.04 97
9 Demark Sc 10.00 2 2.04 102.69 119
10 Finland Sc 10.00 3 0.86 106.78 99
11 France Fr 8.68 3 1.53 101.29 77
12 Germany Ger 9.05 1 0.52 102.74 89
13 Greece Fr 6.82 2 2.39 99.66 87
14 Hong Kong Eng 8.91 5 3.40 – 106
15 Hungary – – – 2.47 129.95 90
16 Indonesia Fr 2.87 2 8.18 – 104
17 Ireland Eng 8.36 4 2.73 124.95 112
18 Italy Fr 5.74 1 2.70 96.23 89
19 Japan Ger 9.17 4 2.26 99.18 76
20 Malaysia Eng 7.72 4 4.75 120.17 114
21 Mexico Fr 5.37 1 7.13 99.53 98
22 Netherlands Fr 10.00 2 1.86 101.38 96
23 Norway Sc 10.00 4 4.46 96.45 120
24 Poland – – – 1.64 129.94 103
25 Portugal Fr 7.19 3 2.67 100.97 60
26 Singapore Eng 8.93 4 1.83 – 103
27 South Africa Eng 6.45 5 5.01 – 102
28 South Korea Ger 5.55 2 5.63 124.97 62
29 Spain Fr 7.14 4 4.15 101.31 101
30 Sweden Sc 10.00 3 1.38 106.03 93
31 Switzerland Ger 10.00 2 0.65 97.94 98
32 Taiwan Ger 7.37 2 1.40 115.34 80
33 UK Eng 9.22 5 2.48 96.21 99
34 USA Eng 9.54 5 2.41 100.25 103
Average 8.16 3.07 2.89 107.86 96.84
SD 1.83 1.44 1.86 11.72 14.43
Notes: aDetails on the legal origins, indicated by English (Eng), French (Fr), German (Ger) or Scandinavian (Sc), are taken from La Porta
et al. (1998).bThe Legal Enforcement Index, as used in La Porta et al. (1998), ranges from 0 to 10, with a higher score indicating a better legal
enforcement.cThe Shareholder Rights Index, ranging from 0 to 6, is also taken from La Porta et al. (1998), with a higher score indicating enhanced
shareholder rights.dInflation Rates are taken from the World Development Index of the World Bank.eThe Industry Product Index (IPI) is taken from the International Financial Statistics, with a higher score indicating greater production
levels within the industrial sector.fThe Consumer Confidence Index (CCI) is obtained from ACNielsen, with a higher score indicating stronger consumer confidence.
125On the Determinants of Corporate Social Responsibility

TABLE IV
Determinants of corporate social responsibility
Variables Model specifications
(A) (B) (C) (D)
Coeff.f t-Stat. Coeff.f t-Stat. Coeff.f t-Stat. Coeff.f t-Stat.
Financial performance
ROA 0.03** 2.40 0.04*** 2.82 0.03** 2.18 0.04** 2.48
Total assets 0.26*** 6.53 0.27*** 6.54 0.25*** 6.37 0.26*** 6.47
Competitiona
H-statistics 0.13 0.59 5.03*** 4.50 -0.03 -0.13 3.09** 2.19
H-statistics2 – – -4.75*** -4.84 – – -3.04** -2.49
Legal environmentb
French 0.82*** 4.45 1.16*** 5.90 – – – –
German 0.66*** 2.91 0.93*** 4.10 – – – –
Scandinavian -0.06 -0.18 0.10 0.30 – – – –
Legal enforcement – – – – 0.12 1.57 0.11 1.37
Shareholder rights – – – – -0.22*** -4.24 -0.24*** -4.53
Quality of management school (QMS) and cooperation in labor–employer relations (CLER)c
QMS 0.07** 1.97 0.06* 1.67 0.05 1.32 0.03 0.83
CLER 0.04 0.78 0.10** 2.03 0.00 0.03 0.04 0.84
Private regulation and the presence of independent organizationsd
Equator Principles 0.57*** 3.20 0.56*** 3.11 0.62*** 3.45 0.62*** 3.40
Wolfsberg Principles – – – – – – – –
Economic environmente: INF (Inflation Rate), IPI (Industrial Production Index), and CCI (Consumer Confidence
Index)
INF -0.08* -1.78 -0.04 -0.80 0.01 0.12 0.02 0.41
IPI 0.00 0.18 -0.00 -0.11 -0.00 -0.35 -0.00 -0.35
CCI 0.03*** 3.81 0.03*** 4.13 0.01** 2.09 0.01* 1.75
Constant -7.49*** -5.67 -9.11*** -6.89 -5.18*** -4.73 -5.74*** -5.01
Log likelihood -380.23 -372.00 -380.19 -376.63
q2 0.27 0.28 0.27 0.27
Total no. of obs. 1,149 1,149 1,149 1,149
Variables Model specifications
(E) (F) (G) (H)
Coeff.f t-Stat. Coeff.f t-Stat. Coeff.f t-Stat. Coeff.f t-Stat.
Financial performance
ROA 0.03** 2.28 0.04*** 2.72 0.03** 2.05 0.03** 2.36
Total assets 0.26*** 6.49 0.26*** 6.54 0.25*** 6.39 0.25*** 6.52
Competitiona
H-statistics 0.17 0.78 5.65*** 5.63 0.08 0.36 4.12*** 3.39
H-statistics2 – – -5.24*** -5.77 – – -3.84*** -3.58
Legal environmentb
French 0.80*** 4.22 1.13*** 5.63 – – – –
German 0.58** 2.49 0.87*** 3.71 – – – –
Scandinavian -0.05 -0.18 0.13 0.42 – – – –
126 Hsiang-Lin Chih et al.

TABLE IV
continued
Variables Model specifications
(E) (F) (G) (H)
Coeff.f t-Stat. Coeff.f t-Stat. Coeff.f t-Stat. Coeff.f t-Stat.
Legal enforcement – – – – 0.14* 1.77 0.14* 1.71
Shareholder rights – – – – -0.22*** -4.08 -0.24*** –4.39
Quality of management school (QMS) and cooperation in labor–employer relations (CLER)c
QMS 0.06* 1.82 0.05 1.47 0.04 1.18 0.02 0.51
CLER 0.02 0.36 0.08* 1.69 -0.03 -0.60 0.02 0.38
Private regulation and the presence of independent organizationsd
Equator Principles – – – – – – – –
Wolfsberg Principles 1.18*** 3.96 1.25*** 3.96 1.28*** 4.25 1.39*** 4.11
Economic environmente: INF (Inflation Rate), IPI (Industrial Production Index), and CCI (Consumer Confidence
Index)
INF -0.08* -1.82 -0.04 -0.84 0.01 0.23 0.03 0.57
IPI 0.01 0.70 0.00 0.46 0.00 0.16 0.00 0.25
CCI 0.03*** 3.56 0.03*** 3.91 0.01** 1.97 0.01 1.51
Constant -7.54*** -5.72 -9.33** -7.00 -5.50*** -5.16 -6.35*** -5.68
Log likelihood -377.86 -368.71 -376.96 -372.09
q2 0.27 0.29 0.27 0.28
Total no. of obs. 1,149 1,149 1,149 1,149
The independent variables of Models (A) and (B) include ROA, total assets, H-statistics, legal origins (French, German,
and Scandinavian), Quality of Management Schools Index, Cooperation in Labor–Employer Relations Index, Equator
Principles, Inflation Rate, Consumer Confidence Index, and Industrial Production Index; in Model (B), we add the
square terms of the H-statistics to investigate whether the curvilinear relationship between competition and socially
responsible corporate behavior exist. Models (C) and (D) use legal enforcement and shareholder rights as legal variables.
The last four specifications, (E), (F), (G), and (H), take into account the Wolfsberg Principles.
*Indicates significance at the 10% level; **indicates significance at the 5% level; ***indicates significance at the 1% level.
q2 Measures the explanatory power of the newly added variables in the regression models (McFadden, 1974), with a
higher q2 indicating a better model fit.
Notes: aThe table presents the results of the regressions on the determining variables of the CSR measures. Companies
included in the Dow Jones World Index are classified into two groups: (i) the CSR Group, i.e., companies included in the
Dow Jones Sustainability World Index (DJSI World) and (ii) the non-CSR Group, i.e., companies not included in the
DJSI World. CSR is a dummy valuable which takes the value of 1 if the company belongs to the CSR Group and 0 if
the company belongs to the non-CSR Group.bH-Statistics measure the competitiveness of the financial industry, with a higher value indicating more intensive com-
petition.cLegal environment variables are taken from La Porta et al. (1998).dQMS measures the quality of management schools, with a higher value indicating a higher quality management school;
CLER measures the employer–employee relationship, with a higher value indicating a better working relationship (both
QMS and CLER are taken from the Global Competitiveness Report).eEquator Principles (Wolfsberg Principles) are dummy valuables which take the value of 1 if a firm adopts the principles
and 0 if the firm does not adopt the principles.fThe Inflation Rate (INF) is taken from the World Development Index; the Industrial Production Index (IPI) is taken from
the International Financial Statistics; and the Consumer Confidence Index (CCI) is taken from ACNielsen, with a higher
score indicating stronger consumer confidence.
127On the Determinants of Corporate Social Responsibility

TABLE V
Determinants of corporate social responsibility: controlling the possible shortcomings of the DJSI-biased selection pro-
cedure
Variables Model specifications
(A) (B) (C) (D)
Coeff.f t-Stat. Coeff.f t-Stat. Coeff.f t-Stat. Coeff.f t-Stat.
Financial performance
ROA 0.02 1.26 0.02 1.09 0.01 0.81 0.02 1.06
Total assets 0.25*** 6.10 0.26*** 6.13 0.24*** 5.98 0.26*** 6.30
Competitiona
H-statistics 1.13*** 3.90 1.19*** 3.83 0.68** 2.21 0.74** 2.24
H-statistics2 – – 0.40*** 3.26 – – 0.50*** 3.82
Legal environmentb
French 0.63*** 3.06 0.39* 1.81 – – – –
German 1.03*** 4.59 0.67*** 2.69 – – – –
Scandinavian 0.19 0.60 0.34 0.67 – – – –
Legal enforcement – – – – 0.19** 2.28 0.27*** 2.78
Shareholder rights – – – – -0.20*** -4.38 -0.18*** -3.80
Quality of management school (QMS) and cooperation in labor–employer relations (CLER)c
QMS 0.04 0.96 0.01 0.35 -0.04 -0.75 -0.07 -1.30
CLER 0.09 1.62 0.09 1.40 0.09* 1.77 0.09 1.50
Private regulation and the presence of independent organizationsd
Equator Principles 0.56*** 3.09 0.51*** 2.80 0.58*** 3.13 0.46** 2.50
Wolfsberg Principles – – – – – – – –
Economic environmente: INF (Inflation Rate), IPI (Industrial Production Index), and CCI (Consumer Confidence
Index)
INF 0.13** 2.48 0.10** 2.11 0.16*** 2.68 0.17*** 2.61
IPI 0.00 0.41 0.01 0.74 0.00 0.33 0.01 0.57
CCI 0.01 1.56 0.00 0.76 -0.01 -0.71 -0.01 -0.90
Constant -7.11*** -4.72 -7.06*** -4.66 -5.12*** -3.66 -6.44*** -4.48
Log likelihood -372.78 -359.19 -372.25 -351.48
q2 0.27 0.29 0.27 0.31
Total no. of obs. 1,078 1,031 1,078 1,031
Variables Model specifications
(E) (F) (G) (H)
Coeff.f t-Stat. Coeff.f t-Stat. Coeff.f t-Stat. Coeff.f t-Stat.
Financial performance
ROA 0.02 1.74 0.02 1.00 0.01 0.68 0.02 0.90
Total assets 0.24*** 6.06 0.25*** 6.05 0.23*** 5.92 0.25*** 6.22
Competitiona
H-statistics 1.23*** 4.46 1.27*** 4.25 0.84*** 2.94 0.88*** 2.84
H-statistics2 – – 0.42*** 3.38 – – 0.51*** 3.81
Legal environmentb
French 0.61*** 2.88 0.36 1.63 – – – –
German 0.96*** 4.12 0.60** 2.34 – – – –
Scandinavian 0.24 0.75 0.44 0.88 – – – –
128 Hsiang-Lin Chih et al.
TABLE V
continued
Variables Model specifications
(E) (F) (G) (H)
Coeff.f t-Stat. Coeff.f t-Stat. Coeff.f t-Stat. Coeff.f t-Stat.
Legal enforcement – – – – 0.22** 2.44 0.29*** 2.87
Shareholder rights – – – – -0.20*** -4.11 -0.17*** -3.60
Quality of management school (QMS) and cooperation in labor–employer relations (CLER)c
QMS 0.03 0.88 0.01 0.32 -0.04 -0.89 -0.08 -1.42
CLER 0.07 1.17 0.07 0.97 0.06 1.19 0.06 0.99
Private regulation and the presence of independent organizationsd
Equator Principles – – – – – – – –
Wolfsberg Principles 1.27*** 3.94 1.23*** 3.79 1.40*** 4.23 1.26*** 3.71
Economic environmente: INF (Inflation Rate), IPI (Industrial Production Index), and CCI (Consumer Confidence
Index)
INF -0.08** -1.82 0.09* 1.83 0.16** 0.23 0.17** 2.40
IPI 0.01 0.70 0.01 0.97 0.01 0.16 0.01 0.77
CCI 0.01 1.37 0.00 0.55 -0.01 -0.91 -0.01 -1.07
Constant -6.97*** -4.55 -6.91*** -4.50 -5.12*** -3.63 -6.46*** -4.52
Log likelihood -369.88 -356.06 -367.57 -347.40
q2 0.27 0.30 0.28 0.32
Total no. of obs. 1,078 1,031 1,078 1,031
The independent variables of Models (A) and (B) include ROA, total assets, H-statistics, legal origins (French, German,
and Scandinavian), Quality of Management Schools Index, Cooperation in Labor–Employer Relations Index, Equator
Principles, Inflation Rate, Consumer Confidence Index, and Industrial Production Index; in Model (B), we add the
square terms of the H-statistics to investigate whether the curvilinear relationship between competition and socially
responsible corporate behavior exist. Models (C) and (D) use legal enforcement and shareholder rights as legal variables.
The last four specifications, (E), (F), (G), and (H), take into account the Wolfsberg Principles. More importantly, we
exclude some developing countries without CSR firms, including Malaysia, Mexico, South Korea, and Taiwan, to focus
on those countries with the co-existence of CSR and non-CSR firms.
*Indicates significance at the 10% level; **indicates significance at the 5% level; ***indicates significance at the 1% level.
q2 Measures the explanatory power of the newly added variables in the regression models (McFadden, 1974), with a
higher q2 indicating a better model fit.
Notes: aThe table presents the results of the regressions on the determining variables of the CSR measures. Companies
included in the Dow Jones World Index are classifies into two groups: (i) the CSR Group, i.e., companies included in the
Dow Jones Sustainability World Index (DJSI World) and (ii) the non-CSR Group, i.e., companies not included in the
DJSI World. CSR is a dummy valuable which takes the value of 1 if the company belongs to the CSR Group and 0 if
the company belongs to the non-CSR Group.bH-Statistics measure the competitiveness of the financial industry, with a higher value indicating more intensive competition.cLegal environment variables are taken from La Porta et al. (1998).dQMS measures the quality of management schools, with a higher value indicating a higher quality management school;
CLER measures the employer–employee relationship, with a higher value indicating a better working relationship (both
QMS and CLER are taken from the Global Competitiveness Report).eEquator Principles (Wolfsberg Principles) are dummy valuables which take the value of 1 if a firm adopts the principles
and 0 if the firm does not adopt the principles.fThe Inflation Rate (INF) is taken from the World Development Index; the Industrial Production Index (IPI) is taken from
the International Financial Statistics; and the Consumer Confidence Index (CCI) is taken from ACNielsen, with a higher
score indicating stronger consumer confidence.
129On the Determinants of Corporate Social Responsibility
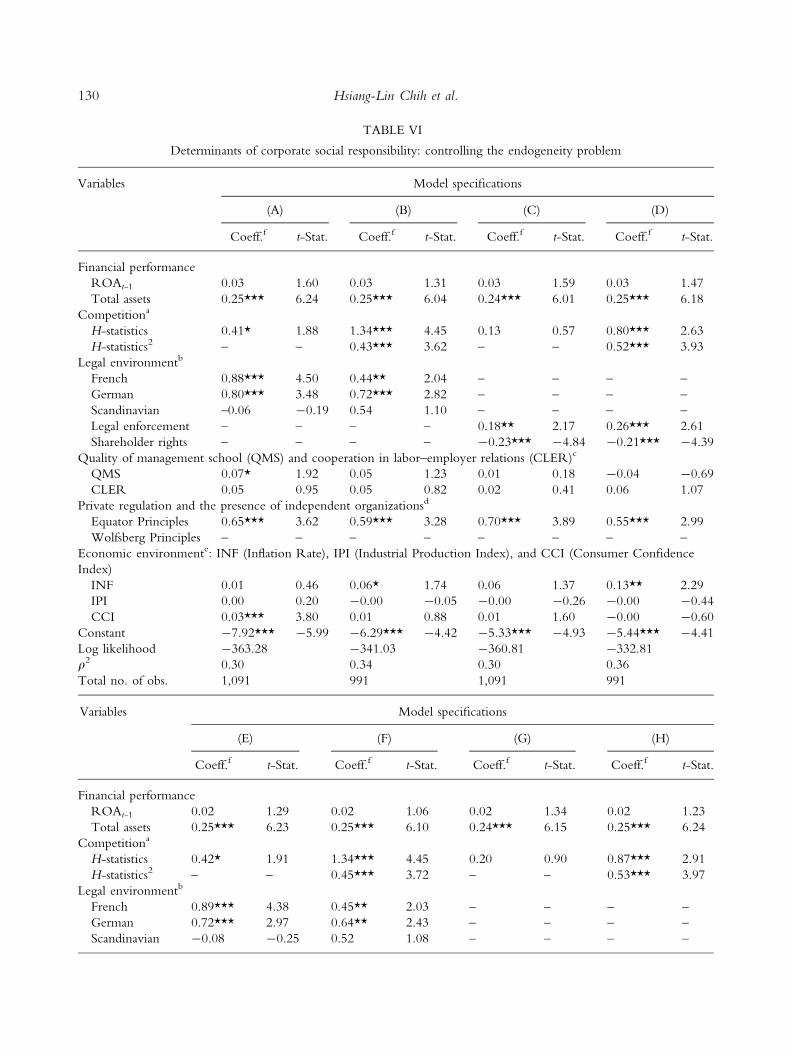
TABLE VI
Determinants of corporate social responsibility: controlling the endogeneity problem
Variables Model specifications
(A) (B) (C) (D)
Coeff.f t-Stat. Coeff.f t-Stat. Coeff.f t-Stat. Coeff.f t-Stat.
Financial performance
ROAt-1 0.03 1.60 0.03 1.31 0.03 1.59 0.03 1.47
Total assets 0.25*** 6.24 0.25*** 6.04 0.24*** 6.01 0.25*** 6.18
Competitiona
H-statistics 0.41* 1.88 1.34*** 4.45 0.13 0.57 0.80*** 2.63
H-statistics2 – – 0.43*** 3.62 – – 0.52*** 3.93
Legal environmentb
French 0.88*** 4.50 0.44** 2.04 – – – –
German 0.80*** 3.48 0.72*** 2.82 – – – –
Scandinavian –0.06 -0.19 0.54 1.10 – – – –
Legal enforcement – – – – 0.18** 2.17 0.26*** 2.61
Shareholder rights – – – – -0.23*** -4.84 -0.21*** -4.39
Quality of management school (QMS) and cooperation in labor–employer relations (CLER)c
QMS 0.07* 1.92 0.05 1.23 0.01 0.18 -0.04 -0.69
CLER 0.05 0.95 0.05 0.82 0.02 0.41 0.06 1.07
Private regulation and the presence of independent organizationsd
Equator Principles 0.65*** 3.62 0.59*** 3.28 0.70*** 3.89 0.55*** 2.99
Wolfsberg Principles – – – – – – – –
Economic environmente: INF (Inflation Rate), IPI (Industrial Production Index), and CCI (Consumer Confidence
Index)
INF 0.01 0.46 0.06* 1.74 0.06 1.37 0.13** 2.29
IPI 0.00 0.20 -0.00 -0.05 -0.00 -0.26 -0.00 -0.44
CCI 0.03*** 3.80 0.01 0.88 0.01 1.60 -0.00 -0.60
Constant -7.92*** -5.99 -6.29*** -4.42 -5.33*** -4.93 -5.44*** -4.41
Log likelihood -363.28 -341.03 -360.81 -332.81
q2 0.30 0.34 0.30 0.36
Total no. of obs. 1,091 991 1,091 991
Variables Model specifications
(E) (F) (G) (H)
Coeff.f t-Stat. Coeff.f t-Stat. Coeff.f t-Stat. Coeff.f t-Stat.
Financial performance
ROAt-1 0.02 1.29 0.02 1.06 0.02 1.34 0.02 1.23
Total assets 0.25*** 6.23 0.25*** 6.10 0.24*** 6.15 0.25*** 6.24
Competitiona
H-statistics 0.42* 1.91 1.34*** 4.45 0.20 0.90 0.87*** 2.91
H-statistics2 – – 0.45*** 3.72 – – 0.53*** 3.97
Legal environmentb
French 0.89*** 4.38 0.45** 2.03 – – – –
German 0.72*** 2.97 0.64** 2.43 – – – –
Scandinavian -0.08 -0.25 0.52 1.08 – – – –
130 Hsiang-Lin Chih et al.
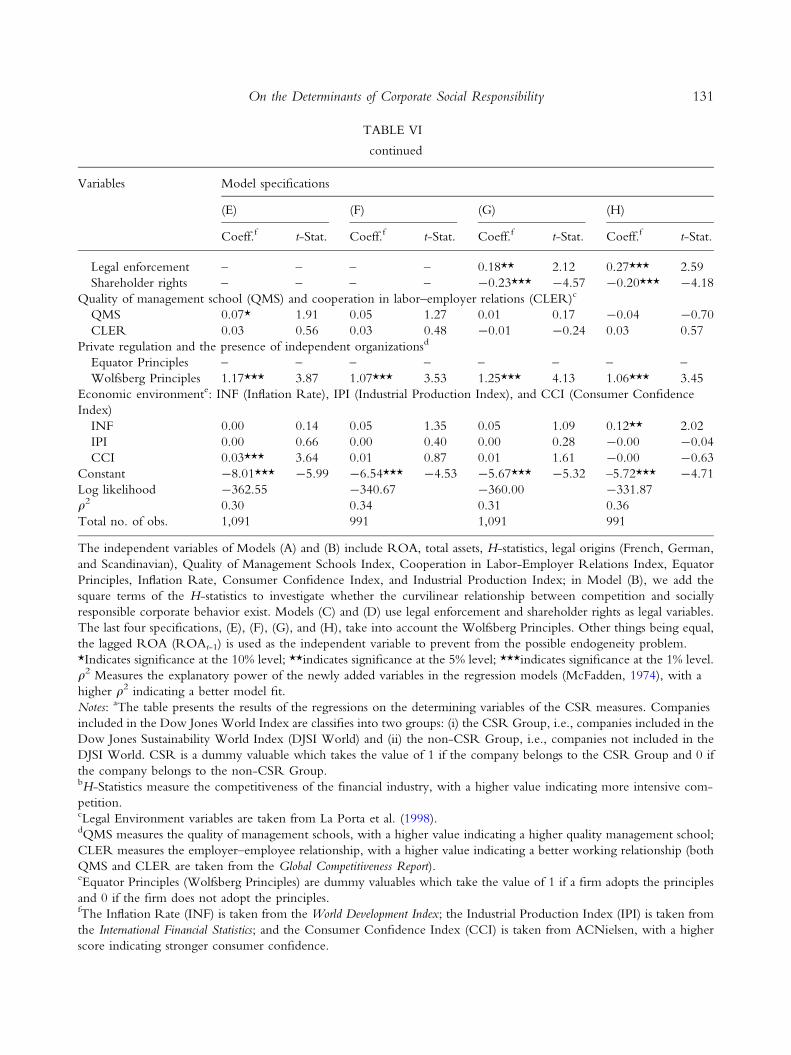
TABLE VI
continued
Variables Model specifications
(E) (F) (G) (H)
Coeff.f t-Stat. Coeff.f t-Stat. Coeff.f t-Stat. Coeff.f t-Stat.
Legal enforcement – – – – 0.18** 2.12 0.27*** 2.59
Shareholder rights – – – – -0.23*** -4.57 -0.20*** -4.18
Quality of management school (QMS) and cooperation in labor–employer relations (CLER)c
QMS 0.07* 1.91 0.05 1.27 0.01 0.17 -0.04 -0.70
CLER 0.03 0.56 0.03 0.48 -0.01 -0.24 0.03 0.57
Private regulation and the presence of independent organizationsd
Equator Principles – – – – – – – –
Wolfsberg Principles 1.17*** 3.87 1.07*** 3.53 1.25*** 4.13 1.06*** 3.45
Economic environmente: INF (Inflation Rate), IPI (Industrial Production Index), and CCI (Consumer Confidence
Index)
INF 0.00 0.14 0.05 1.35 0.05 1.09 0.12** 2.02
IPI 0.00 0.66 0.00 0.40 0.00 0.28 -0.00 -0.04
CCI 0.03*** 3.64 0.01 0.87 0.01 1.61 -0.00 -0.63
Constant -8.01*** -5.99 -6.54*** -4.53 -5.67*** -5.32 –5.72*** -4.71
Log likelihood -362.55 -340.67 -360.00 -331.87
q2 0.30 0.34 0.31 0.36
Total no. of obs. 1,091 991 1,091 991
The independent variables of Models (A) and (B) include ROA, total assets, H-statistics, legal origins (French, German,
and Scandinavian), Quality of Management Schools Index, Cooperation in Labor-Employer Relations Index, Equator
Principles, Inflation Rate, Consumer Confidence Index, and Industrial Production Index; in Model (B), we add the
square terms of the H-statistics to investigate whether the curvilinear relationship between competition and socially
responsible corporate behavior exist. Models (C) and (D) use legal enforcement and shareholder rights as legal variables.
The last four specifications, (E), (F), (G), and (H), take into account the Wolfsberg Principles. Other things being equal,
the lagged ROA (ROAt-1) is used as the independent variable to prevent from the possible endogeneity problem.
*Indicates significance at the 10% level; **indicates significance at the 5% level; ***indicates significance at the 1% level.
q2 Measures the explanatory power of the newly added variables in the regression models (McFadden, 1974), with a
higher q2 indicating a better model fit.
Notes: aThe table presents the results of the regressions on the determining variables of the CSR measures. Companies
included in the Dow Jones World Index are classifies into two groups: (i) the CSR Group, i.e., companies included in the
Dow Jones Sustainability World Index (DJSI World) and (ii) the non-CSR Group, i.e., companies not included in the
DJSI World. CSR is a dummy valuable which takes the value of 1 if the company belongs to the CSR Group and 0 if
the company belongs to the non-CSR Group.bH-Statistics measure the competitiveness of the financial industry, with a higher value indicating more intensive com-
petition.cLegal Environment variables are taken from La Porta et al. (1998).dQMS measures the quality of management schools, with a higher value indicating a higher quality management school;
CLER measures the employer–employee relationship, with a higher value indicating a better working relationship (both
QMS and CLER are taken from the Global Competitiveness Report).eEquator Principles (Wolfsberg Principles) are dummy valuables which take the value of 1 if a firm adopts the principles
and 0 if the firm does not adopt the principles.fThe Inflation Rate (INF) is taken from the World Development Index; the Industrial Production Index (IPI) is taken from
the International Financial Statistics; and the Consumer Confidence Index (CCI) is taken from ACNielsen, with a higher
score indicating stronger consumer confidence.
131On the Determinants of Corporate Social Responsibility

those in Table IV, but the coefficients of H-statistic2
turn out to be significantly positive. It indicates that
the financial firms would actually act in more socially
responsible ways to enhance their competitive advan-
tages when the market competitiveness is extremely
intense, after we control the possible shortcomings of
the DJSI-biased selection procedure. Therefore, the
curvilinear relationship between competition and
socially responsible corporate behavior, proposed by
Campbell (2007), is actually not supported.14
Second, we use the lagged ROA (ROAt–1) as the
independent variable in the probit regression, to
prevent from the endogeneity problem. As shown in
Table VI, most of the empirical results are found the
same as those in Table IV, except that the coefficients
of the lagged ROA turn out to be insignificant
and those of H-statistics2 are significantly positive.
The former result implies that the link between
the corporate financial performance and CSR is
insignificant; the latter result implies that the financial
firms would actually act in more socially responsible
ways to enhance their competitive advantages when
the market competitiveness is extremely intense, and
the curvilinear relationship between competition and
socially responsible corporate behavior, proposed by
Campbell (2007), is again not supported.
Conclusions
Our empirical findings are as follows. First, financial
firms with larger size will be more CSR-minded,
and the link between the corporate financial per-
formance and CSR is insignificant. Second, financial
firms would actually act in more socially responsible
ways to enhance their competitive advantages when
the market competitiveness is more intense. There-
fore, the curvilinear relationship between competi-
tion and socially responsible corporate behavior,
proposed by Campbell (2007), is actually not sup-
ported.
Third, financial firms in countries with stronger
legal enforcement measures engage in more CSR
activities, but interestingly and rather strikingly,
those firms in countries with stronger investor rights
engage in less CSR activities. These findings, in fact,
may induce a more complete understanding of the
impact of shareholders rights. Since La Porta et al.
(1997) find that countries with poor investor
protections have smaller and narrower capital mar-
kets, many related studies have typically tended to
focus on the positive impact of the shareholder
rights. La Porta et al. (2002), for example, find that
stronger minority shareholder rights should be
associated with lower dividend payouts. Leuz et al.
(2003) find that the legal protection of outside
investors is a key determinant of the quality of
financial information communicated by insiders to
outsiders and find that earnings management decreases
in stronger legal protection countries. Shen and
Chih (2005) also find that stronger shareholder rights
and greater transparency in accounting disclosure
can reduce banks’ incentives to manage earnings. In
our article, however, stronger shareholder rights are
found to have the negative impact on the incentives
of firms to engage in CSR activities, since financial
firms in countries with stronger shareholder rights
may tend to be geared toward shareholders’ welfare
at the expense of fulfilling their obligations to other
stakeholders.
Fourth, self-regulation in the financial industry
has a significantly positive effect on CSR. Therefore,
a financial firm, which adopts either the Equator or
Wolfsberg Principles, will be an attractive invest-
ment for socially responsible investors, since it will
be effectively required to act in socially responsible
ways and to engage in sound environmental man-
agement practices, according to our findings. This is
of vital importance in driving interest and invest-
ments in CSR to the mutual benefit of financial
firms and investors. Finally, we also conclude that
financial firms in countries with more cooperative
employer–employee relations, higher quality man-
agement schools and a better macroeconomic envi-
ronment will be more CSR minded.
Acknowledgments
The authors gratefully acknowledge the financial support
granted from the project NSC-96-2416-H-305-005-
MY3 by the National Science Foundation in Taiwan.
Notes
1 See Norris (2002) and Friedman (2008).2 A formal definition of ‘‘CSR’’ emerged from an
international meeting of the World Business Council
132 Hsiang-Lin Chih et al.

for Sustainable Development (WBCSD) which was
organized and attended by 60 leading speakers on pub-
lic opinion from inside and outside of the business
world. This formal definition states that: ‘‘CSR is the
continuing commitment by business to behave ethically
and to contribute to economic development while
improving the quality of life of the workforce and their
families as well as of the local community and society at
large’’ (WBCSD Stakeholder Dialog on CSR, Nether-
lands, 6–8 September 1998).3 McWilliams et al. (2006) develop an excellent
framework for consideration of the strategic implica-
tions of CSR, and then go on to propose an agenda for
additional theoretical and empirical research into CSR.4 The DJSI Series, which was first published in Sep-
tember 1999, comprises five general benchmark indexes:
the DJSI World Index, the Dow Jones STOXX Sustain-
ability Index, the Dow Jones Euro STOXX Sustainabil-
ity Index, the Dow Jones Sustainability North America
Index, and the Dow Jones Sustainability United States
Index, each of which, respectively, represents the overall
indices of CSR companies in the global, European, Eu-
rozone, North American and United States markets.
According to the DJSI website, these indices provide as-
set managers with reliable and objective benchmarks for
the management of their sustainability portfolios. A total
of 60 DJSI licenses are currently held by asset managers
in 15 countries around the world for the management of
a variety of financial products, including active and pas-
sive funds, certificates and segregated accounts; these
licensees currently manage a total of over US$5 billion
based in the DJSI. Since the aim of this article is to
investigate the determinants of CSR on a global scale,
we therefore select the DJSI World as our benchmark,
as opposed to the remaining four DJSI Indexes.5 See the Dow Jones Sustainability World Indices
Guide, version 9.1, January 2008.6 McWilliams and Siegel (2000) and Chih et al.
(2008) use a similar approach to classify firms into
socially responsible and socially irresponsible groups.
We choose the financial industry mainly because, as a
result of its large market capitalization, it represents one
of the major industries, and also because firms of the
same industry share more common features, thus help-
ing to avoid confounding effects in the investigation of
the CSR determinants. Furthermore, Griffin and Ma-
hon (1997) also noted in their investigation of the
CSR/CFP relationship that: ‘‘…the internal and exter-
nal pressures in a given industry…are expected to be
the same within the industry’’ and ‘‘multi-industry stud-
ies serve to confound this particular relationship.’’
7 For a number of years, banks working in the pro-
ject financing sector had been seeking ways to develop
a common and coherent set of environmental and social
policies/guidelines that could be applied globally and
across all industry sectors. In October 2002, a small
number of banks convened in London, together with
the World Bank Group’s IFC, to discuss these issues.
The banks in attendance jointly decided to try to devel-
op a banking industry framework for addressing the
environmental and social risks involved in project
financing. This led to the drafting of the first set of
Equator Principles by these banks, which were then
launched in Washington, DC on 4 June 2003. As of
March 2008, a total of 59 institutions had adopted these
principles. The Equator Principles Financial Institutions
(EPFIs) have consequently adopted these principles to
ensure that the financed projects are developed in a
manner which is socially responsible and which reflects
sound environmental management practices. By doing
so, negative impacts on project-affected ecosystems and
communities should be avoided where possible, and if
these impacts are unavoidable, they should be reduced,
mitigated and/or appropriately compensated for (Equa-
tor Principles, July 2006). Refer also to: www.equator-
principles.com.8 The Wolfsberg Group is an association comprising
of twelve global banks which aims to develop financial
services industry standards, and related products, for
Know Your Customer, Anti-Money Laundering and
Counter Terrorist Financing policies. The group came
together in 2000, at Chateau Wolfsberg in Switzerland,
in the company of Transparency International, to pub-
lish the Wolfsberg Anti-Money Laundering Principles
for Private Banking (revised in May 2002). The group
then published a Statement on the Financing of Terror-
ism in January 2002, and also released the Wolfsberg
Anti-Money Laundering Principles for Correspondent
Banking in November 2002 and the Wolfsberg State-
ment on Monitoring Screening and Searching in Sep-
tember 2003. In 2004, the group focused on the
development of a due diligence model for financial
institutions. In June 2006, the group published two sets
of guidelines: Guidance on a Risk-based Approach for
Managing Money Laundering Risks and AML Guid-
ance for Mutual Funds and Other Pooled Investment
Vehicles. In early 2007, the group issued its Statement
against Corruption, in close association with Transpar-
ency International and the Basle Institute on Gover-
nance. Refer also to: www.wolfsberg-principles.com.9 Since CSRi,j,t is a discrete dependent variable, we
estimate the probit model in this article.
133On the Determinants of Corporate Social Responsibility

10 Following Panzar and Rosse (1987) and Claessens and
Laeven (2004), we estimate the following reduced-form
revenue equation on pooled samples for each country:
lnðPitÞ ¼ a þ b1 lnðW1;itÞ þ b2 lnðW2;itÞþ b3 lnðW3;itÞ þ c1 lnðY1;itÞþ c2 lnðY2;itÞ þ c3 lnðY3;itÞ þ dD þ eit;
where Pit is the ratio of gross interest revenue to
total assets (proxy for output price of loans), W1,it is
the ratio of interest expenses to total deposits and
money market funding (proxy for input price of
deposits), W2,it is the ratio of personnel expense to
total assets (proxy for input price of labor), and W3,it
is the ratio of other operating and administrative
expense to total assets (proxy for input price of
equipment/fixed capital). The subscript i denotes
bank i, and the subscript t denotes year t. We
include several control variables at the individual
bank level. Specifically, Y1,it is the ratio of equity to
total assets, Y2,it is the ratio of net loans to total
assets, and Y3,it is the logarithm of total assets (to
control for potential size effects). We also use dum-
my variables (D) for the years 1994 through 2003
(we drop the year dummy for the year 1993) to
control for the fixed effects of calendar years; for
simplicity, these results are not reported in the
tables. The H-statistic equals b1 + b2 + b3.11 We normalize QMS by dividing its mean by its
standard deviation across management schools per coun-
try per year, and also normalize CLER by dividing its
mean by its standard deviation across firms per country
per year.12 Refer to the two websites: www.djindexes.com and
www.sustainability-indexes.com.13 It should be noted that in most of the emerging finan-
cial markets, there are no CSR firms whatsoever, which
implies that CSR firms are highly concentrated within the
developed countries. For example, although Taiwan has as
many as 13 financial firms listed on the Dow Jones World
Index, none of these is included in the DJSI World. Al-
though this may well reflect the fact that developed coun-
tries have much greater concern for CSR, it may also be
simply due to the fact that companies in the developed
countries are better known to DJSI analysts.14 In fact, in Table IV, we have excluded some coun-
tries without CSR firms, including Chile, Cyprus,
Czech Republic, Indonesia, Poland, Singapore, and
South Africa, since some legal or macroeconomic vari-
ables of these countries are not available. For example,
there are no IPI data for Chile, Indonesia, Singapore,
and South Africa, and no legal variables for Cyprus,
Czech Republic, and Poland.
References
Campbell, J. L.: 2007, ‘Why Would Corporations Behave
in Socially Responsible Ways? An Institutional Theory
of Corporate Social Responsibility’, Academy of
Management Review 32(3), 946–967.
Chih, H.-L. and R.-K. Cheng: 2008, ‘Banking
Competition, Profitability Persistence and Access to
Finance: Some International Evidence’, Working
Paper, College of Business, National Taipei University.
Chih, H.-L., C.-H. Shen and F.-C. Kang: 2008, ‘Corpo-
rate Social Responsibility, Investor Protection, and
Earnings Management: Some International Evidence’,
Journal of Business Ethics 79(1–2), 179–198. doi:10.1007/
s10551-007-9383-7.
Claessens, S. and L. Laeven: 2004, ‘What Drives Bank
Competition? Some International Evidence’, Journal of
Money, Credit, and Banking 36, 563–583. doi:10.1353/
mcb.2004.0044.
Coombs, J. E. and K. M. Gilley: 2005, ‘Stakeholder
Management as a Predictor of CEO Compensation:
Main Effects and Interactions with Financial Perfor-
mance’, Strategic Management Journal 26(9), 827–841.
doi:10.1002/smj.476.
Dierkes, M. and R. Coppock: 1978, ‘Europe Tries the
Corporate Social Report’, Business and Society Review
Spring, 25, 21–24.
Fombrun, C. and M. Shanley: 1990, ‘What’s in a Name?
Reputation Building and Corporate Strategy’, Academy
of Management Journal 33, 233–258. doi:10.2307/
256324.
Friedman, T. L.: 2008, ‘The Great Unraveling’, New York
Times, OP-ED Columnist, 16 Dec 2008.
Griffin, J. J. and J. F. Mahon: 1997, ‘The Corporate
Social Performance and Corporate Financial Perfor-
mance Debate: Twenty-Five Years of Incomparable
Research’, Business & Society 36, 5–31. doi:10.1177/
000765039703600102.
Hillman, A. J. and G. D. Keim: 2001, ‘Shareholder Value,
Stakeholder Management, and Social Issues: What’s
the Bottom Line?’, Strategic Management Journal 22(2),
125–139. doi:10.1002/1097-0266(200101)22:2<125::
AID-SMJ150>3.0.CO;2-H.
La Porta, R., F. Lopez-de-Silanes, A. Shleifer and R. W.
Vishny: 1997, ‘Legal Determinants of External
Finance’, The Journal of Finance 52(3), 1131–1150.
doi:10.2307/2329518.
134 Hsiang-Lin Chih et al.

La Porta, R., F. Lopez-de-Silanes, A. Shleifer and R. W.
Vishny: 1998, ‘Law and Finance’, The Journal of Political
Economy 106(6), 1113–1155. doi:10.1086/250042.
La Porta, R., F. Lopez-de-Silanes, A. Shleifer and R. W.
Vishny: 2002, ‘Agency Problems and Dividend
Policies Around the World’, The Journal of Finance
55(1), 1–33. doi:10.1111/0022-1082.00199.
Leuz, C., D. Nanda and P. D. Wysocki: 2003, ‘Investor
Protection and Earnings Management: An Interna-
tional Comparison’, Journal of Financial Economics 69(3),
505–527. doi:10.1016/S0304-405X(03)00121-1.
Margolis, J. D. and J. P. Walsh: 2003, ‘Misery Loves
Companies: Rethinking Social Initiatives by Business’,
Academy of Management Review 48, 268–305.
McFadden, D.: 1974, ‘Conditional Logit Analysis
of Qualitative Choice Behavior’, in P. Zarembka.
(ed.), Frontiers in Econometrics (Academic Press,
New York).
McWilliams, A. and D. Siegel: 2000, ‘Corporate Social
Responsibility and Financial Performance: Correlation
or Misspecification?’, Strategic Management Journal 21,
603–609. doi:10.1002/(SICI)1097-0266(200005)21:5
<603::AID-SMJ101>3.0.CO;2-3.
McWilliams, A. and D. Siegel: 2001, ‘Corporate Social
Responsibility: A Theory of the Firm Perspective’,
Academy of Management Review 26(1), 117–127.
doi:10.2307/259398.
McWilliams, A., D. Siegel and P. Wright: 2006, ‘Cor-
porate Social Responsibility: Strategic Implications’,
Journal of Management Studies 43(1), 1–18. doi:10.1111/
j.1467-6486.2006.00580.x.
Norris, F.: 2002, ‘The Market: Market Place: Yes, He
Can Top That’, New York Times, 17 Jul 2002, p. A-1.
Panzar, J. C. and J. N. Rosse: 1987, ‘Testing for
‘Monopoly’ Equilibrium’, The Journal of Industrial
Economics 35, 443–456. doi:10.2307/2098582.
Pava, M. L. and J. Krausz: 1996, ‘The Association
Between Corporate Social-Responsibility and Finan-
cial Performance: The Paradox of Social Cost’, Journal
of Business Ethics 15, 321–357. doi:10.1007/BF003829
58.
Porter, M. and M. Kramer: 2002, ‘The Competitive
Advantage of Corporate Philanthropy’, Harvard Busi-
ness Review 80(12), 57–68.
Roberts, P. W. and G. R. Dowling: 2002, ‘Corporate
Reputation and Sustained Superior Financial Perfor-
mance’, Strategic Management Journal 23, 1077–1093.
doi:10.1002/smj.274.
Rowley, T. and S. Berman: 2000, ‘A Brand New Brand
of Corporate Social Performance’, Business & Society
39(4), 397–418. doi:10.1177/000765030003900404.
Shen, C.-H. and H.-L. Chih: 2005, ‘Investor Protection,
Prospect Theory, and Earnings Management: An
International Comparison of the Banking Industry’,
Journal of Banking & Finance 29, 2675–2697.
doi:10.1016/j.jbankfin.2004.10.004.
Shleifer, A.: 2004, ‘Does Competition Destroy Ethical
Behavior?’, American Economic Review 94(2), 414–418.
Simpson, W. and T. Kohers: 2002, ‘The Link Between
Social and Financial Performance: Evidence from the
Banking Industry’, Journal of Business Ethics 35, 97–109.
doi:10.1023/A:1013082525900.
Trotman, K. and G. Bradley: 1981, ‘Associations Between
Social Responsibility Disclosure and Characteristics of
Companies’, Accounting, Organizations and Society 6,
355–362. doi:10.1016/0361-3682(81)90014-3.
Waddock, S. A. and S. B. Graves: 1997, ‘The Corporate
Social Performance–Financial Performance Link’, Stra-
tegic Management Journal 18(4), 303–319. doi:10.1002/
(SICI)1097-0266(199704)18:4<303::AID-SMJ869>
3.0.CO;2-G.
Walsh, J. P., K. Weber and J. D. Margolis: 2003, ‘Social
Issues and Management: Our Lost Cause Found’,
Journal of Management 29(6), 859–881.
Hsiang-Lin Chih and Tzu-Yin Chen
Department of Banking and Cooperative Management,
National Taipei University,
151, University Rd., San Shia, 23741,
Taiwan, ROC
E-mail: [email protected];
Hsiang-Hsuan Chih
Department of Finance, National Dong Hwa University,
No. 1, Sec. 2, Da Hsueh Rd., Shoufeng,
Hualien, 97401, Taiwan, ROC
E-mail: [email protected]
135On the Determinants of Corporate Social Responsibility

Copyright of Journal of Business Ethics is the property of Springer Science & Business Media B.V. and its
content may not be copied or emailed to multiple sites or posted to a listserv without the copyright holder's
express written permission. However, users may print, download, or email articles for individual use.