Embed Size (px)
Citation preview

Journal of Science and Technology © KNUST August 2012
ON-SITE EFFECTS AND COST OF FERTILITY EROSION FROM FIVE SMALL RESERVOIR CATCHMENTS IN THE
UPPER EAST REGION OF GHANA
B. K. Amegashie1 , C. Quansah1, A. W. Agyare 2, M. Bonsu1 and S. N. Odai 3
1Department of Crop Science, KNUST, Kumasi, Ghana 2Department of Agricultural Engineering, KNUST, Kumasi, Ghana
3Department of Civil Engineering, KNUST, Kumasi, Ghana
ABSTRACT A study was carried out in the Upper East Region of Ghana to assess the on-site effects and the cost of fertility erosion from five small reservoir catchments (Dua, Doba, Zebilla, Kumpalgogo and Bugri). The catchment soils and reservoir sediments were sampled and analyzed for their bulk density and nutrient content. The mean reduction in soil depth in the various catchments was 3.996±3.806 mm y-1 in the order of Kumpalgogo>Dua>Bugri>Zebilla>Doba. The corre-sponding decrease in the water holding capacity of the top 20 cm depth of the catchment soils ranged from 0.563 to 4.698 % per year. The percentage loss in the total nutrient stocks in the top 20 cm of the catchments as eroded sediment-bound nutrients ranged from 9.63 to 64.71, 7.87 to 56.83, 6.12 to 54.82, 1.26 to 40.14, 49.86 to 12.65, 16.84 to 72.07 for OC, N, P, K, Ca and Mg, respectively. The total amount of nutrient loss in kg ha-1 among the reservoirs ranged from 2383 to 19672 for OC, 153 to 3048 for N, 3.15 to 42.59 for P, 41 to 290 for K, 432 to 2158 for Ca, and 63 to 483 for Mg. The cost of N, P and K removed by erosion was calculated by the Replacement Cost Method. The total cost per year (GH¢ ha-1 y-1) of fertilizers (sulphate of ammonia, single superphosphate and muriate of potash) was 286.15 for Dua, 74.289 for Doba, 225.061 for Ze-billa, 1119.997 for Kumpalgogo and 96.376 for Bugri. The study has amply shown that soil loss through erosion reduces top soil depth, nutrient stocks and the water holding capacity of catch-ment soils. This will adversely affect crop productivity if no control measures are implemented. This can also lead to land degradation.
INTRODUCTION Soil erosion is a major threat to continued and sustained agricultural production in Ghana par-ticularly in the Sudan Savanna zone (Folly, 1997). The effect of erosion may be on-site and/or off-site. The latter consequences, shown by this study and detailed out by Adwubi et al. (2009), resulted from downstream siltation,
which has reduced reservoir capacity, enhanced the risk of flooding and shortened the design life of the reservoirs studied. The on-site damage, which affects the catch-ments where the erosion originates, includes soil structure degradation, increased erodibility, surface crusting and compaction. The loss of
© 2012 Kwame Nkrumah University of Science and Technology (KNUST)
Journal of Science and Technology, Vol. 32, No. 2 (2012), pp 78-93 78
RESEARCH PAPER
Keywords: Deposited sediment, nutrient depletion, small reservoirs, fertility erosion, fertilizer
http://dx.doi.org/10.4314/just.v32i2.10

Journal of Science and Technology © KNUST August 2012
to be US$161.4 million which was about 5% of the AGDP. Drechsel and Gyiele (1999) re-ported US$ 115.4 million (about 4 – 5% of AGDP) as the cost of productivity loss in Ghana. Quansah et al. (2000) assessed the sea-sonal cost of N, P and K lost through erosion under a maize monocrop grown under exces-sively tilled land (double ploughing + 3 times harrowing + 3 times spike tooth harrowing) to be US$ 7.1 per hectare. In the context of the national economy, the World Bank et al. (2006) estimated the cost of land degradation (mainly soil erosion) to range from 1.1 to 2.4 percent of the GDP, corresponding to 2.9 to 6.3 percent of AGDP. For countries such as Ghana whose economies depend heavily on the agricultural sector, the loss of agricultural productivity particularly through erosion, implies loss of revenue for the socio-economic development of the country (Bonsu and Quansah, 1992).
In order to contribute the requisite information for filling the above identified gaps in erosion research, this study aimed at assessing (i) the on-site effects of catchment erosion and (ii) the magnitude and cost of fertility erosion. MATERIALS AND METHODS Study site The study was carried out on five representa-tive small reservoirs in the Upper East Region of Ghana. Their characteristics are given in Table 1. The Upper East Region is the north-easternmost part of Ghana’s 10 regions. It is located between latitudes 10o 15’ and 11o 10’ north and longitudes 0o and 1o west. It covers an area of 8,842km2 with eight administrative districts (Bolga, Bongo, Builsa, Kasena-Nankana, Talensi Nabdam, Bawku West, Bawku East and Garu Tempani; Fig. 1). Ac-cording to the 2000 population and housing census (GSS, 2005), the region has a popula-tion of 920,089 made up of 442,492 males and 477,597 females with a population growth rate of 3% per annum. The region has a high popu-lation density of 104.1 persons km-2 compared
Amegashie et al. 79
soil reduces depth, water and nutrient storage capacities of the soil (NSE-SPRPC, 1981). The reduction in moisture reduces the soil’s poten-tial to sustain plant growth, exposes the plants to frequent and severe water stress which ulti-mately results in reduced crop yields. Whilst soil loss measurement is a characteristic of most erosion research in Ghana (Asiamah and Antwi, 1988), the above implications of erosion-induced loss in soil depth for on-site damage have received very little research atten-tion. Yet such studies are very pertinent for designing sustainable land management strate-gies in areas such as the Sudan Savanna zone of Ghana. In this zone, many of the soils have predomi-nantly light-textured surface horizons and ex-tensive areas of shallow concretionary and rocky soils with low water and nutrient holding capacities and limited capacity for agriculture (Quansah, 1990). The latter attributes are exac-erbated by the on-going water erosion in the zone. Soil loss and runoff are almost always accom-panied by losses of plant nutrients. The process, termed fertility erosion (Ellison, 1950), is selec-tive, in that finer particles relatively high in plant nutrients and organic matter are the most susceptible to erosion. Consequently the eroded sediments contain higher concentrations of or-ganic matter and plant nutrients in available form than the in-situ soil (Quansah and Baffoe-Bonnie, 1981). Whilst it is useful to know the magnitude of soil nutrient losses to aid replen-ishment strategies, their on-site costs are equally important. Unfortunately, these aspects are scarcely studied because nutrient depletion is insidious (FAO, 1990; Gachene et al., 1997). In Ghana, Bøjö (1996) estimated the gross an-nual economic loss due to erosion which ranges from 2 to 5% of the Agricultural Gross Domes-tic Product (AGDP). Using the replacement cost approach (RCA), Convery and Tutu (1990) assessed the cost of annual production loss through erosion and nutrient depletion in Ghana

Journal of Science and Technology © KNUST August 2012
to a national average of 79.3 persons km-2. Over 80% of the population live in the rural areas with agriculture as their major economic activity (Birner et al., 2005). The climate is semi-arid with an aridity index of 0.54 and a unimodal rainfall pattern of about 1000 mm per annum lasting 5 to 6 months.
Rainfall is often erratic with considerable varia-tions between successive rainy seasons, with regard to the time of onset, duration and amount of rainfall. Rainfall intensities are high, often exceeding soil infiltrability with a conse-quent generation of large volumes of runoff with high potential erosion rates (Liebe et al., 2005). Temperatures are consistently high, with
On-site effects and cost of fertility erosion... 80
Table 1. Characteristics of studied reservoirs in Upper East Region of Ghana
Reservoir YR A SC LS DS HD SE CE
Doba 1998 70 185 180.0 5 4.6 177 178
Dua 1997 35 99.6 98.6 1 4.2 228 229
Zebilla 1998 105 460.0 452.0 8 7 225.8 227.25
Kumpalgogo 1998 40 120.0 N/A N/A 3.8 193 193
Bugri 1994 216 510.0 508.9 1.1 7.5 499.25 500.75
Fig.1: Location of study reservoirs and administrative districts in Upper East Region, Ghana
YR, year of rehabilitation; A, catchment area (ha); SC, design storage capacity (103 m3); LS, live storage (103 m3); DS, dead storage (103 m3); HD, height of dam wall (m); SE, spillway elevation (m.s.l); CE, dam crest elevation (m)

Journal of Science and Technology © KNUST August 2012
81
an average of 28.6°C. The mean annual relative humidity is 55%. There is a high variability in temperature and relative humidity thereby re-sulting in high evapotranspiration levels (1652 mm/y) and drying of reservoirs.
The agroecology is Sudan savanna, consisting of short drought - and fire-resistant deciduous trees interspersed with open savanna grassland. Grass is very sparse with most areas exhibiting severely eroded soils. The soils in the area are generally developed from granites, Birimian rocks and alluvia of mixed origin (Asiamah, 1992). The major soils comprise Acrisols, Lix-isols, Nitisols, Vertisols, Plinthosols, Cambi-sols, Gleysols (Asiamah, 1992; MoFA, 1998). A large part of the area (82%) is underlain by metamorphic and igneous complexes with gneiss and granodiorite predominating (Fig. 2). Most of the soils are low in organic matter, buffering and cation exchange capacities and inherent fertility. The predominant clay mineral is kaolinite with nitrogen and phosphorus being mostly deficient. Site selection Due to time and limited financial resources, it was not possible to carry out this study on all reservoirs in the region. Five reservoirs repre-sentative of the catchments in the region were therefore selected for the study (Fig. 1). This was done through desk study and recon-naissance survey with details presented by Ad-wubi et al. (2009). Catchment characteristics A large proportion of the catchments studied had gentle slopes less than 5 per cent. However in the upper slope reaches of the catchment, where homesteads and compound farms were located, the slopes could reach 10 per cent. All the reservoirs had patches of marshy land of varying sizes around them. These marshy sites served as sinks for sediment transported from the source areas thereby reducing the amount of sediment reaching the reservoirs. Some of the marshy sites were planted to rice. Land use in the catchments comprised compound farms
cultivated to a variety of crops including millet (Panicum milliaceum), sorghum (Sorghum bi-color) and okra (Abelmoschus esculentus). The cultivation practices, including bullock plough-ing, loosen the soil and make it more erodible. In some cases, vegetables are cultivated very close to the periphery of the reservoirs, as ob-served at Zebilla. Nutrient management mainly involved the use of farmyard manure and com-post which are often inadequate. Mineral fertil-izers are scarcely used. Crop production in the catchments therefore depended mainly on the low natural inherent fertility of the soils. Most of the reservoirs studied (Doba, Dua, Bugri and Kumpalgogo) had strips or patches of vetiver along their periphery, dam wall and spillway. Field Survey Bathymetric survey Bathymetric survey is one of the methods used in quantifying sediment deposition in reservoirs that are filled with water and allow boat-based survey. Bathymetric surveys were conducted from 20th September to 2nd October 2007 to derive the current water storage capacity of the five reservoirs. The details of the reservoir sedi-ment studies can be found in Adwubi et al., (2009). Reservoir sediment and catchment soil sam-pling Reservoir sediments Undisturbed wet sediment samples of known volume were taken using a beeker sampler from each reservoir. The beeker sampler is a piston corer with clear perspex tubes (Ø=57 mm) of different lengths (600, 1000 and 1500 mm). At the bottom of the piston, an inflatable valve assures no sediment losses when raising the piston corer to the surface. Soil samples were taken from each reservoir 10 m away from the upstream end of the reservoir, 5-10 m away from the dam wall, in the middle of the reservoir and the remaining from other loca-tions in the reservoir. In all, ten samples were collected from each reservoir with two samples per sampling point. One sample per sampling point was used for the determination of bulk
Amegashie et al.

Journal of Science and Technology © KNUST August 2012
82
density and the other for the particle size and soil chemical properties determination. Catchment soils In each catchment, soil samples were taken to a depth of 0-20 cm from the upper, middle and lower toposites along the soil catena. At each toposite, a composite sample made up of 10 bulked representative samples was taken for soil physical and chemical analyses. Chemical and physical analyses The following chemical and physical parame-ters were determined: pH using the Suntex pH (mv) Sp meter (701) for soil: water ratio of 1:2.5 (McLean, 1982), organic carbon (OC) by a modified Walkley-Black wet oxidation method (Nelson and Sommers, 1982), total N by Kjeldahl digestion and distillation procedure (Bremner and Mulvaney, 1982), available P by Bray P1 method (Olsen and Sommers, 1982), exchangeable bases (Ca, Mg, K and Na) were determined in 1.0 M ammonium acetate
(NH4OAc) extract (Black, 1965) and the ex- changeable acidity (H and Al) in 1.0 M KCl extract (McLean, 1965). Particle size distribu-tion was by the hydrometer method (Bouyoucos, 1963) and bulk density of the catchment soils was by the metal core sampler method (Blake and Harte, 1986). Sediment volume determination The data collected from the bathymetric survey was analyzed using Golden Software Surfer 8 (Golden Software Inc., 2003). The elevation of the current reservoir bed (top of sediment) at each measurement point was defined by sub-tracting the recorded depth from the water sur-face level, measured with Automatic levelling instrument. Storage capacity and water surface area of the reservoirs at 1m interval was calcu-lated using Surfer’s “Volume” function, based on which the current capacity curves of the reservoirs were constructed. The total volume of sediment deposition was then calculated by subtracting current water storage capacity from
On-site effects and cost of fertility erosion...
Fig. 2: Geology map of Upper East Region, Ghana, showing study sites (Kesse 1985)

Journal of Science and Technology © KNUST August 2012
83
the initial water storage capacity. Sediment mass Sediment mass (SM) was calculated as: SM = SV × ρb
Where SV is sediment volume and ρb is sedi-ment bulk density Soil depth reduction due to soil loss The physical loss of soil through erosion re-duces the depth of soil needed for water and nutrient storage and increased root room. It was expressed as:
=
Where h is depth reduction due to soil loss (m), Ms is weight of dry soil loss (kg), Vt is total volume of soil loss (m3), A is area from which soil is lost (m2) and ρb is bulk density of in-situ soil from which eroded sediment originated (kg m-3). Reduction in water holding capacity due to loss in soil depth In this study, it is assumed that the water hold-ing capacity of the surface (20 cm) sandy loam for Dua, loamy sand for Doba, Zebilla, Kum-palgogo, Bugri reservoirs, respectively, was 100 mm per metre soil depth (Hudson, 1995). Assuming even distribution of water along the metre depth, the top 20 cm depth will hold 20 mm of water (i.e. 0.1 mm)/mm depth). Using the depth loss values (Equation 2) the percent-age reduction in the water holding capacity of the top 20 cm was calculated as: % Reduction in water holding capacity (WHC)
Total Nutrient Stocks The implication of nutrient loss for on-site pro-ductivity is the loss of the nutrient stocks in the catchment soils. Nutrient stocks of the top 20 cm depth of soil were calculated as the sum of remaining nutrients in the soil and that in the eroded sediments. Total amount of nutrients and organic mat-ter in the reservoir sediments The total amount of nutrients and organic mat-ter in the reservoir sediments were determined by multiplying the total weight of the reservoir sediments by the concentration of their nutrient constituents. Percentage (%) reduction in total nutrient stocks Percentage (%) reduction in the total nutrient stocks in the catchment soils was calculated as the ratio of the total of each nutrient in the eroded sediment and the total stock of each nutrient in the parent soil. Estimation of Cost of Nutrients in the Eroded Sediments Using the Replacement Cost Method The N, P and K content of the eroded sediments was converted to the forms in which they exist in straight fertilizers, i.e. N, P2O5 and K2O (kg), respectively by multiplying by the following constants (Quansah et al., 2000) kg N = kg N kg P × 2.29 = kg P2O5 kg K × 1.2 = kg K2O The current cost of fertilizers per bag used in this study for estimating the cost of fertilizer lost was: Sulphate of ammonia (50kg) cost = GH¢ 30.00 Single Superphosphate (50 kg) cost = GH¢ 45.00 and Muriate of Potash (50 kg) cost = GH¢ 80.00
Amegashie et al.
[1]
[2] ρb =
t
s
V
MAxh
M s
[3]
[4]
[5]
[6]

Journal of Science and Technology © KNUST August 2012
Calculation of the number and cost of bags of fertilizer lost Example: The Dua catchment The losses of N, P and K from the catchment into the reservoir were: Nitrogen = 536 kg N/ha Phosphorus = 35.14 kg P/ha = 80.47 kg P2O5/ha Potassium = 290 kg K /ha = 348 kg K2O/ha 1 bag of each straight fertilizer = 50 kg (i) 100 kg of Sulphate of Ammonia contains 21
kg N Therefore 536 kg N = 100kg ×
(ii)100kg of Single Superphosphate contains 18 kg P2O5
Therefore 80.47 kg P2O5 = 100 kg ×
(iii)100 kg of Muriate of Potash contains 60 kg
of K2O
348kg K2O = 100 kg ×
The total cost of fertilizers lost was calculated by multiplying the number of bags of each straight fertilizer lost by the respective cost/50kg of each fertilizer. Statistical analysis The data obtained were analysed by Analysis of Variance (ANOVA) using GENSTAT Statisti-cal Package (GENSTAT, 2007). Standard error difference (s.e.d) at 5% was used to compare treatment means.
RESULTS AND DISCUSSION On-site effects of catchment erosion In order to assess the on-site effects of catch-ment erosion, soil-loss induced reduction in soil depth, water holding capacity and soil nutrient stocks in the various catchments were deter-mined. The results are discussed in the follow-ing sections. Reduction in soil depth and water holding capacity The reduction in soil depth in the various catch-ments ranged from 0.1126 to 0.9396 cm y-1. (Table 2) The loss in soil depth does not only reduce rooting depth but the storage capacity of the soil for water and nutrients. The results of the study showed the reduction in the water holding capacity of the top 20 cm of the catch-ments to range from 5.44 to 42.28 mm y-1 for Doba and Kumpalgogo, respectively (Table 2). In a predominantly rainfed-agricultural zone, such as the study area, where shallow soils are common and smallholder farmers depend on the relatively nutrient rich 20 cm top soil with its in-situ moisture storage for growing their crops, the reduced soil depth and water holding capacity will have significant adverse impacts on crop growth, yield and agricultural produc-tivity. Thames and Cassel (1979) demonstrated a close relationship between soil depth, avail-able water capacity and dry matter production on a sandy soil with a shallow fragipan horizon. For soil depths of 26, 29 and 45 cm, the respec-tive available water capacities (mm) were 32, 52, 64 and dry matter (t ha-1) was 5.9, 7.4 and 9.1. According to Lal (1984) the majority of tropi-cal soils have edaphically inferior subsoil and shallow rooting depth as observed in most soils in the Sudan savanna zone underlain by petrop-linthite. Consequently, crop yield declines dras-tically as topsoil thickness is reduced. A major concern is that, the loss of the surface layer cannot be fully compensated for by additional inputs of nutrients as demonstrated by Mbagwu et al. (1983). Research information on the ef-
84 On-site effects and cost of fertility erosion...
=2552
.38kg ÷ 50 = 51.05 bags of Sulphate of Am-monia
kg
kg
18
47.80
= 447.06 kg ÷ 50 = 8.94 bags of Single Superphosphate
= 11.60 bags of Muriate of Potash
kg
kg
60
348 × 580 ÷ 50
kg
kg
21
536

Journal of Science and Technology © KNUST August 2012
85
fect of soil depth reduction due to natural ero-sion is scanty. Most of the evidence is from artificially desurfaced experiments. Lal (1976) reported a maize yield reduction of 23% after removing 2.5 cm of topsoil of an Alfisol in Ibadan, Nigeria. In Cameroon the removal of 2.5 cm topsoil caused a 50% drop in maize yield (Rehm, 1978). A major factor of significance in the loss of soil depth due to erosion is the length of time it takes to replace the lost soil. Hudson (1995) estimated that, under ideal soil conditions in the tropics the rate of new soil formation was about 2.5 cm in 30 years (i.e. 0.83 mm/y). From other sources (Lal, 1987), new soil is formed at the rate of about 2.5 cm in 300 to 1000 years (i.e. 0.083 to 0.025 mm y -1 ) under normal condi-tions. Available information suggests that it takes hardly one year to lose 1 cm of topsoil but 1000 years to replace it (Lal, 1984). In this study it has taken 9 to 13 years to lose 1.1 to 8.4 cm of topsoil which, by the above calcula-tions by Lal (1984), will take between 1000 to 8000 years to replace. The mismanagement of the reservoir catchments can therefore readily lead to irreversible soil degradation.
Reduction in soil nutrient stocks Apart from the physical loss of soil depth and water holding capacity, the soil lost through erosion is usually the most fertile part contain-ing the plant nutrients, humus and any fertiliz-ers that the farmer has applied. The implication of nutrient loss for on-site soil fertility and pro-ductivity is the loss of the nutrient stocks in the catchment soils. In order to assess this loss, the nutrient stocks of the top 20 cm depth of each catchment were calculated. The results (Table 3) showed the total nutrient stocks (kg ha-1) in the top 20 cm to range from 19084 to 30399, 1884 to 5363, 39.79 to 80.34, 147 to 3253, 2040 to 4328, 358 to 784 for OC, N, P, K, Ca and Mg, respectively. For a period of 9 to 13 years, representing the ages of the reservoirs, the percentage loss in the total nutrient stocks in the catchments (Table 4) as eroded sediment-bound nutrients ranged from 9.63 to 64.71, 7.87 to 56.83, 6.12 to 54.82, 1.26 to 40.14, 49.86 to 12.65, 16.84 to 72.07 for OC, N, P, K, Ca and Mg, respectively. These losses are indicative of the magnitude of soil productivity loss in the catchments. Crops grown on such soils will, implicitly, produce low yields with potential adverse effects on
Amegashie et al.
Table 2. Loss of depth and reduction in water holding capacity (WHC) due to cumulative soil loss
Reservoir
Age
Bulk Den-sity
(kg m-3)
Sediment Mass (t)
Depth Loss (mm)
Depth loss per year (mm y-1)
Reduction in WHC per year (mm y-1)
Dua 10 1511.96 35,183 66.49 6.649 33.25
Doba 9 1508.10 11,480 10.87 1.208 5.44
Zebilla 9 1640.31 24,849 14.43 1.603 7.22
Kumpalgogo 9 1638.35 55,413 84.56 9.396 42.28
Bugri Average
13 1589.93 1577.73
50,310 3516.37
14.64 38.20
1.126 3.996
7.32 19.10

Journal of Science and Technology © KNUST August 2012
household food availability and security. In such a situation, more fertilizer amendments are needed to maintain crop yield. This in-creases production cost which many small- holder farmers cannot afford. Farmers are therefore compelled to grow their crops with little or no soil amendments leading to soil nu-trient mining; yet the addition of mineral fertil-izers alone cannot compensate for the produc-tivity loss. The loss of agricultural production in the af-fected districts and communities, as shown by crop production figures of the Upper East Re-gion of Ghana (MoFA, 2009), means a loss of household incomes, agricultural revenue and delayed district plans for development. The
rural population finds life increasingly hard and seeks a better life in the towns and cities. In the study area, this is exemplified by the seasonal migration of the youth to the south of the coun-try during the long dry season to search for jobs and better living standards. These impacts un-derscore the urgent need to promote sustainable land management interventions in the catch-ments of reservoirs and other water bodies in the Sudan savanna zone as enshrined in Ghana’s Agricultural Sustainable Land Man-agement Strategy and Action Plan (2009-2015) (MoFA, 2008). In these developments, it is recommended that the watershed is taken as the planning unit and integrated watershed man-agement effected by involving the active par-ticipation of the affected communities.
86 On-site effects and cost of fertility erosion.
Table 3. Total nutrient stock in the catchment soils
Reservoir OC N P K Ca Mg kg/ha
Dua 19084 2154 80.34 806 4328 776 Doba 24733 1945 39.79 968 2040 358 Zebilla 23656 1884 60.35 147 2561 483 Kumpalgogo 30399 5363 77.69 1707 3387 784 Bugri 21916 2371 51.45 3253 2991 374
Average 23957.6 2743.4 61.92 1376.2 3061.4 555
Table 4. Percentage reduction of total nutrient stock in the catchment soils Reservoir OC N P K Ca Mg
%
Dua 31.25 24.88 43.74 35.98 49.86 62.24
Doba 9.63 7.87 10.03 5.99 12.65 72.07
Zebilla 13.94 32.64 11.52 40.14 38.58 38.10
Kumpalgogo 64.71 56.83 54.82 16.17 44.73 55.10
Bugri 16.75 16.03 6.12 1.26 14.44 16.84
Average 27.26 27.65 25.25 19.91 32.05 48.87
Journal of Science and Technology © KNUST August 2012
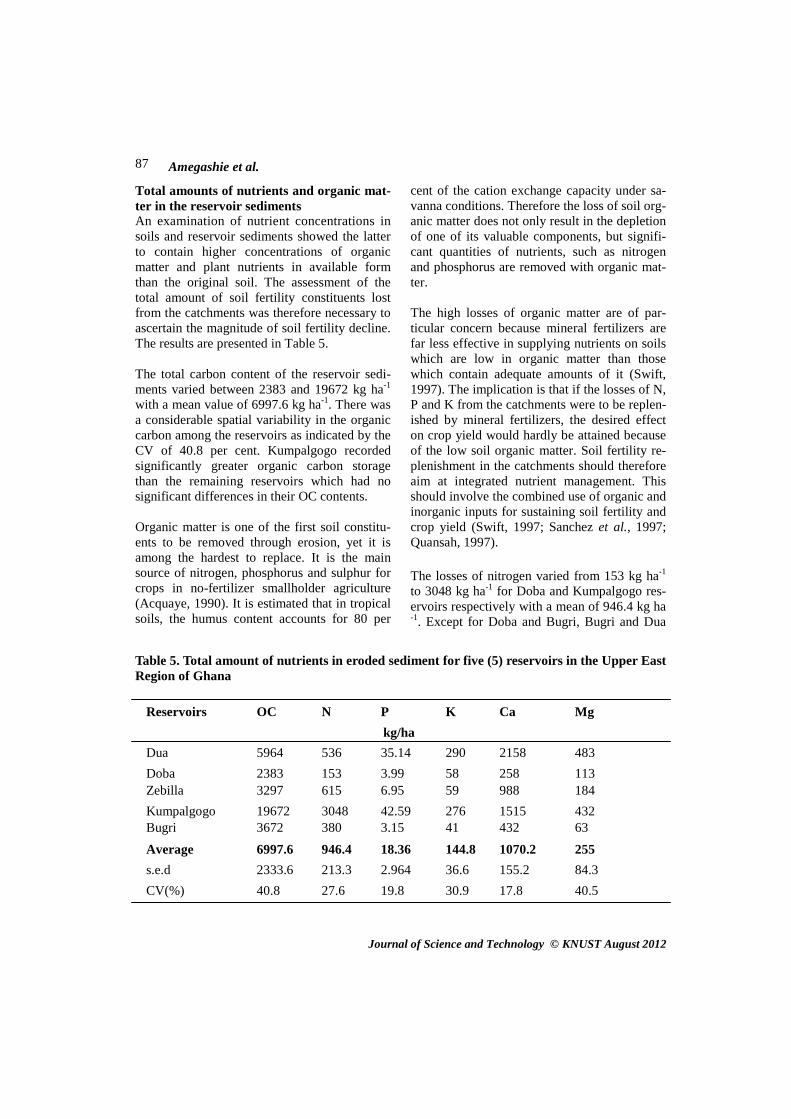
Total amounts of nutrients and organic mat-ter in the reservoir sediments An examination of nutrient concentrations in soils and reservoir sediments showed the latter to contain higher concentrations of organic matter and plant nutrients in available form than the original soil. The assessment of the total amount of soil fertility constituents lost from the catchments was therefore necessary to ascertain the magnitude of soil fertility decline. The results are presented in Table 5. The total carbon content of the reservoir sedi-ments varied between 2383 and 19672 kg ha-1 with a mean value of 6997.6 kg ha-1. There was a considerable spatial variability in the organic carbon among the reservoirs as indicated by the CV of 40.8 per cent. Kumpalgogo recorded significantly greater organic carbon storage than the remaining reservoirs which had no significant differences in their OC contents. Organic matter is one of the first soil constitu-ents to be removed through erosion, yet it is among the hardest to replace. It is the main source of nitrogen, phosphorus and sulphur for crops in no-fertilizer smallholder agriculture (Acquaye, 1990). It is estimated that in tropical soils, the humus content accounts for 80 per
cent of the cation exchange capacity under sa-vanna conditions. Therefore the loss of soil org- anic matter does not only result in the depletion of one of its valuable components, but signifi-cant quantities of nutrients, such as nitrogen and phosphorus are removed with organic mat-ter. The high losses of organic matter are of par-ticular concern because mineral fertilizers are far less effective in supplying nutrients on soils which are low in organic matter than those which contain adequate amounts of it (Swift, 1997). The implication is that if the losses of N, P and K from the catchments were to be replen-ished by mineral fertilizers, the desired effect on crop yield would hardly be attained because of the low soil organic matter. Soil fertility re-plenishment in the catchments should therefore aim at integrated nutrient management. This should involve the combined use of organic and inorganic inputs for sustaining soil fertility and crop yield (Swift, 1997; Sanchez et al., 1997; Quansah, 1997). The losses of nitrogen varied from 153 kg ha-1 to 3048 kg ha-1 for Doba and Kumpalgogo res-ervoirs respectively with a mean of 946.4 kg ha-1. Except for Doba and Bugri, Bugri and Dua
Amegashie et al. 87
Reservoirs OC N P K Ca Mg
kg/ha
Dua 5964 536 35.14 290 2158 483
Doba 2383 153 3.99 58 258 113 Zebilla 3297 615 6.95 59 988 184
Kumpalgogo 19672 3048 42.59 276 1515 432 Bugri 3672 380 3.15 41 432 63
Average 6997.6 946.4 18.36 144.8 1070.2 255
s.e.d 2333.6 213.3 2.964 36.6 155.2 84.3
CV(%) 40.8 27.6 19.8 30.9 17.8 40.5
Table 5. Total amount of nutrients in eroded sediment for five (5) reservoirs in the Upper East Region of Ghana

Journal of Science and Technology © KNUST August 2012
and Dua and Zebilla, all other differences in total nitrogen were significant. The variability in the total N content of the reservoirs was me-dium according to Warrick’s (1998) guidelines for variability of soil properties. The total available phosphorus in the reservoir sediments ranged from 3.15 to 42.59 kg ha-1 with a mean of 18.36 kg ha-1. The differences in the available P content among the reservoirs were significant. The magnitude of P content was smaller than all the other nutrients proba-bly due to its low mobility.
Nitrogen and phosphorus losses also present a major concern considering that they are the most deficient nutrients in savanna soils. On the other hand, soluble forms of nitrogen (nitrate and ammonium) constitute a major source of pollutants in rivers, lakes, reservoirs and groundwaters.
Total potassium losses showed medium varia-tion (CV=31%), according to Warrick’s (1998) guidelines for variability of soil properties, among the reservoirs and ranged between 41 and 290 kg ha-1 with a mean of 144.8 kg ha-1. The Dua and Kumpalgogo reservoirs recorded significantly greater K content in their sedi-ments than the three other reservoirs which did not differ significantly in their K content. The results showed that the catchments have lost tremendous amounts of Ca in the range of
432 to 2158 kg ha-1 with a mean of 1070.2 kgha-1. The Dua reservoir recorded the highest Ca content, followed by Kumpalgogo, Zebilla, Bugri and Doba. The differences in the Ca con-tent were significant. The total magnesium losses varied from 63 kg ha-1 to 483 kg ha-1 with a mean of 255 kg ha-1. The Dua and Kumpalgogo reservoirs had sig-nificantly higher values than the remaining reservoirs. The variability in Mg content among the reservoirs was rated medium (CV=40.5%). The contribution of the other nutrients, such as potassium, magnesium and calcium in sustain-ing crop growth and yield is no less important. The huge amounts of nutrient losses from the catchments, stored in the reservoir sediments, have cost implications for nutrient replenish-ment in the catchments for sustainable agricul-tural production. The significant amount of nutrients and organic matter in the reservoir sediments as shown by the loss in soil nutrient stocks, is indicative of the magnitude of soil fertility and productivity decline in the contributing catchments as well as pollution of the reservoir waters. The practice of integrated soil, water and nutri-ent management and conservation would be required to sustain the fertility and productivity of the catchments and avert the pollution of the reservoirs by nutrients and sediments exported from the catchments through erosion.
Reservoir Total N P2O5 K2O
kg/ha Dua 536 80.47 348 Doba 153 9.14 69.60 Zebilla 615 15.92 70.80 Kumpalgogo 3048 97.53 331.20 Bugri 380 7.21 49.20
Table 6. Equivalent forms in fertilizers of total nutrients in deposited sediments
On-site effects and cost of fertility erosion... 88

Journal of Science and Technology © KNUST August 2012
Estimating Cost of Nutrients in the Eroded Sediments In estimating the cost of fertility erosion, the eroded sediment-bound nutrients were con-verted to existing fertilizers in the form of sul-phate of ammonia, single superphosphate and muriate of potash. The results showed the nutri-ent losses to range from 153 to 3048, 7.21 to 97.53 and 49.20 to 331.20 for nitrogen, phos-phorus (P2O5) and potassium (K2O), respec-tively (Tables 6). The conversion of the nutrient loss to bags of fertilizer per hectare gave values in the range of 14.57 to 290.29, 0.80 to 10.84 and 1.64 to 11.60 bags per hectare for sulphate of ammonia, single superphosphate and muriate of potash respectively (Table 7). On the other hand, the cost of fertilizers lost ranged from 437.10 to 8708.70, 36.00 to 487.80 and 131.20 to 928.00 GH¢/hectare for sulphate of ammonia, single superphosphate and muriate
of potash respectively (Table 8). The total cost (GH¢ ha-1 y-1) of these fertilizers was 286.15 for Dua, 74.289 for Doba, 225.061 for Zebilla, 1119.997 for Kumpalgogo and 96.376 for Bugri. The values represent a hidden cost to agricultural production in the respective reser-voir catchment areas. This implies that if straight fertilizers were to be bought to com-pensate for the losses of N, P and K from the respective catchment areas of the reservoirs, the above costs will be incurred. These cost figures, at best, represent only the cost of the mineral fertilizers required to re-place the lost N, P and K and do not account for the losses of other nutrient elements including micronutrients nor the cost of transporting the fertilizers to the catchment areas as well as their application. Therefore the interpretation of the results of the replacement cost approach for assessing the cost of erosion as it affects prod-
Reservoir
Sulphate of ammonia Single superphosphate
Bags/ha/y
Muriate of potash
Dua 5.104 0.894 1.160 Doba 1.619 0.113 0.258 Zebilla 6.508 0.197 0.262
Table 7. Bags of fertilizer lost per hectare per year
Reservoir Total N P2O5 K2O
kg/ha Dua 536 80.47 348 Doba 153 9.14 69.60 Zebilla 615 15.92 70.80 Kumpalgogo 3048 97.53 331.20 Bugri 380 7.21 49.20
Table 6. Equivalent forms in fertilizers of total nutrients in deposited sediments
Amegashie et al. 89

Journal of Science and Technology © KNUST August 2012
uctivity should, recognize the following limita-tions (Enters, 1998): a. Soil erosion does not only affect the nutrient
status of the soil, but also its organic matter content and physical structure.
b. Soil nutrients may not be the most limiting factor in crop production.
c. Fertilizer applications are not necessarily the most cost effective options available to farmers for maintaining yields; in extreme cases, e.g. on deep and fertile soils, farmers may not even experience any yield decline with nutrient losses (Stocking, 1996).
d. It is only a proxy for actual productivity loss.
e. Mineral fertilizers supply nutrients in plant available forms, whereas erosion also re-moves fixed elements.
CONCLUSION The study has amply shown that soil loss through erosion reduces top soil depth, nutrient stocks and the water holding capacity of catch-ment soils. This will adversely affect crop pro-ductivity, if no control measures are imple-mented. The total cost per year (GH¢ ha-1 y-1) of fertilizers (sulphate of ammonia, single su-perphosphate and muriate of potash) needed to compensate for the lost nutrients (N, P and K)
in the catchment areas is more than what the resource poor farmer can afford. The cost in-curred as a result of fertility erosion represents a hidden cost to agricultural production. Catch-ment area protection, is therefore needed to control erosion from the catchments and reduce both on-site (fertility and productivity loss) and off-site (sedimentation, pollution) impacts of erosion. These should include afforestation, improved cover using recommended cover and forage species, sustainable land management practices and vegetative barriers (vetiver) around reservoirs. Desilted nutrient-rich sedi-ments could be used as a soil amendment to improve the productivity of catchment soils. This will require field experimentation to ascer-tain the benefits of these sediments in enhanc-ing crop yields and biomass production. How-ever, the heavy metals, pollutants/pathogens content of the desilted sediments must be ascer-tained through further research studies before they are used as soil amendments. ACKNOWLEDGEMENTS This study was made possible through financial and logistic support from the Federal Ministry of Education and Research, (BMBE) of Germany through the GLOWA-Volta Project of the Centre for Development Research (ZEF), University of Bonn, Bonn, Germany.
90 On-site effects and cost of fertility erosion...
Table 8. Cost of fertilizers lost per hectare
Reservoir Sulphate of ammonia
Single super-phosphate
Muriate of potash
Total cost
Total cost per year
*GH¢/ha GH¢/ha/y Dua 1531.20 402.30 928.00 2861.50 286.15
Doba 437.10 45.90 185.60
668.60 74.289
Zebilla 1757.10 79.65 188.80 2025.55 225.061
Kumpalgogo 8708.70 487.80 883.20 10079.70 1119.997
Bugri 1085.70 36.00 131.20
1252.90 96.376
*GH¢ 1.42 = USD $1

Journal of Science and Technology © KNUST August 2012
REFERENCES Acquaye, D. K. (1990). Towards Development
of Sustainable Agriculture in Africa: Reflec-tions of a Soil Scientists. In Zobisch, M. A. (ed). Proceedings of the 11th Annual General Meeting of the Soil Society of Ghana, 19 – 28.
Adwubi, A., Amegashie, B. K., Agyare, W. A., Tamene, L., Odai, S. N., Quansah, C. and Vlek, P. (2009). Assessing sediment inputs to small reservoirs in Upper East Region, Ghana. Lakes & Reservoirs: Research and Management, 14:279-287.
Asiamah, R. D. (1992). Soils and soil degrada-
tion of the Upper East Region of Ghana. Soil Research Institute, Kwadaso-Kumasi, Ghana.
Asiamah, R. D. and Antwi, B. O. (1988). Soil
and water conservation in Ghana- past, pre-sent and future activities. Report sur les re-sources en sols du Monde, 63 FAO, Rome, pp 126-138.
Birner, R., Schiffer, E., Asante, F., Gyasi, O.
and McCarthy, N. (2005). Analysis of Gov-ernance Structures for Water Resources Man-agement in the White Volta Basin Ghana. Final Report. IFPRI, Washington DC, USA.
Black, C. A. (1965). Methods of soil analysis.
Part 2. Chemical and microbiological proper-ties. First edition. American Society of Agronomy and Soil Science Society of America. Madison, Wisconsin, USA.
Blake, G. R. and Harte, K. H. (1986). Bulk
density. In: Klute, A. (ed.). Methods of soil analysis. Part 1. Physical and mineralogical methods. Second edition. American Society of Agronomy and Soil Science Society of America. Madison, Wisconsin USA. pp. 363 – 375.
Bøjö, J. (1996). The costs of land degradation
in sub-Saharan Africa. Ecological Economics 16:161-173.
Bonsu, M. and Quansah, C. (1992). The impor-tance of soil conservation for agricultural and economic development of Ghana. In Pro-ceedings of the 12th and 13th Annual General Meetings of the Soil Science Society of Ghana, Accra, Ghana. pp. 77-80.
Bouyoucos, G. J. (1963). Hydrometer method
improved for making particle size analyses of soils. Agronomy Journal 53:464 – 465.
Bremner, J. M. and Mulvaney, C. S. (1982).
Total nitrogen. In: Page, A.L., Miller, R.H. and Keeney, D.R. (eds.). Methods of soil analysis. Part 2. Chemical and microbiologi-cal properties. American Society of Agron-omy and Soil Science Society of America, Madison Wisconsin Inc. pp. 593 – 624.
Convery, F. and Tutu, K. (1990). Evaluating
the Costs of Environmental Degradation: Ghana Applications of Economics in the En-vironmental Planning Process in Africa. Uni-versity College of Dublin, Environmental Institute, Dublin.
Drechsel, P. and Gyiele, L. A. (1999). The eco-
nomic assessment of soil nutrient depletion. Analytical issues for framework develop-ment. IBSRAM/SWNM. Issues in Sustain-able Land Management 7, IBSRAM: Bang-kok, 80p.
Ellison, W. D. (1950). Fertility Erosion. The
Land, 9: 487. Enters, T. (1998). A Framework for Economic
Assessment of Soil Erosion and Soil Conser-vation. In: Penning de Vries, F.W.T., Agus, F. and Kerr, J. (Eds.) Soil Erosion at multiple scales. Principles and Methods for Assessing Causes and Impacts. CAB Publishing,
FAO, (1990). The conservation and rehabili-
Amegashie et al. 91

Journal of Science and Technology © KNUST August 2012
tation of African lands. ARC/90/4. Rome: FAO
Folly, A. (1997). Land Use Planning to Mini-mize Soil Erosion – A Case Study from the Upper East Region in Ghana. Ph.D thesis, Institute of Geography, University of Copen-hagen.
Gachene, C. K. K., Jarvis, N. J. and Mbuvi, J.
P. (1997). Soil effects on soil properties in a highland area of Central Kenya. Soil Sci. Soc. Am. J., 61, 559-564.
GENSTAT (2007). GENSTAT Discovery Edi-
tion 3. VSN International, U.K. GSS (2005). 2000 Population and housing cen-
sus of Ghana. Ghana Statistical Service, Ac-cra
Hudson, N. W. (1995). Soil Conservation.
Third Edition, BT Batsford Ltd., London. Kesse, G. O. (1985). The Mineral and Rock Resources of Ghana. Balkema, Rotterdam. Lal, R. (1976). Soil Erosion Problems on an
Alfisol in Western Nigeria and Their Control. IITA Monograph No. 1, 208 pp.
Lal, R. (1984). Soil Erosion From Tropical
Arable Lands and Its Control. Advances in Agronomy, 37: 183 – 248.
Lal, R. (1987). Research Achievements to-
wards Soil and Water Conservation in the Tropics: Potential and Prioritization. In: Pla Sentis, I. (ed.). Soil Conservation and Pro-ductivity. Maracay, Sociedal Venezolana de la Ciencia del Svelo: 755 – 87.
Liebe, J., Van de Giesen, N. and Andreini, M.
(2005). Estimation of small reservoir storage capacities in a semi-arid environment: A case study in the Upper East Region of Ghana. Phys. Chem. Earth, 30: 448–54.
Mbagwu, J. S. C., Lal, R. and Scott, T. W. (1983). Physical Properties of Three South-ern Nigeria. Soil Science, 136: 48 – 55.
McLean, E. O. (1965). Aluminum. In: Black,
C.A. (ed.). Methods of soil analysis. Part 2. Chemical and microbiological properties. First edition American Society of Agronomy and Soil Science Society of America, Madi-son, Wisconsin USA. pp. 978 – 998.
McLean, E. O. (1982). Soil pH and lime re-
quirement. In: Page, A. L., Miller, R. H. and Keeney, D. R. (eds.). Methods of soil analy-sis. Part 2. Chemical and microbiological properties. Second edition. American Society of Agronomy and Soil Science Society of America, Madison, Wisconsin USA. pp.199-223.
Ministry of Food and Agriculture (MoFA)
(1998). National Soil Fertility Management Action Plan. Directorate of Crop Services, Accra, Ghana.
Ministry of Food and Agriculture (MoFA)
(2008). Agriculture Sustainable Land Man-agement Strategy and Action Plan (2009-2015). Ministry of Food and Agriculture, Accra, Ghana.
Ministry of Food and Agriculture (MoFA)
(2009). Areas and Production of main rainfed crops in the Upper East Region of Ghana. MoFA, Bolgatanga, Ghana.
National Soil Erosion – Soil Productivity Re-
search Planning Committee (NSE-SPRPC) (1981). Soil Erosion Effects on Soil Produc-tivity. A Research Perspective. J. Soil, Wa-ter Conservation, 36(2): 82 – 90.
Nelson, D. W. and Sommers, L. W. (1982).
Total carbon, organic carbon and organic matter. In: Page, A.L., Miller, R.H. and Keeney, D.R. (eds.). Methods of soil analysis Part 2. Second edition. Chemical and micro-biological properties. American Society of
On-site effects and cost of fertility erosion. 92

Journal of Science and Technology © KNUST August 2012
Agronomy and Soil Science Society of Amer-ica. Madison, Wisconsin USA. pp.301-312.
Olsen, S. R. and Sommers, L. E. (1982). Phos-phorus. In: Page, A.L., Miller, R.H. and Keeney, D.R. (eds.). Methods of soil analysis. Part 2. Chemical and microbiological proper-ties. Second edition. American Society of Agronomy and Soil Science Society of America, Madison, Wisconsin USA. pp. 403-430.
Quansah, C. (1990). Soil erosion and Conserva-
tion in the Northern and Upper Regions of Ghana. Topics in Applied Resources Man-agement, 2:135 - 157.
Quansah, C. (1997). Approaches to Replenish-
ing Soil Fertility Depletion in Ghana. Poster Abstracts for the International Seminar on Approaches to Replenishing Soil Fertility in Africa: NGO Perspective, ICRAF, Nairobi, Kenya.
Quansah, C. and Baffoe-Bonnie, E. (1981). The
effects of soil management systems on soil loss, runoff and fertility erosion in Ghana. In: Tingsanchali, T. and Egger, H. (eds). South-East Asia Regional Symposium on problems of soil erosion and sedimentation. Asia Institute of Technology, Bangkok, Thai-land.
Quansah, C., Safo, E. Y., Ampontuah, E. O.
and Amankwaah, A. S. (2000). Soil Fertility erosion and the associated cost of NPK re-moval under different soil and residue man-agement in Ghana. Ghana Journal of Agri-culture Science, 33(1): 33-42.
Rehm, S. (1978) cited in Lal, R. (1984). Soil
Erosion from Tropical Arable Lands and Its Control. Advances in Agronomy, 37: 183 – 248.
Sanchez, P. A., Buresh, A. J., Kwesiga, F. R.,
Mokwunge, A. U., Ndiritu, C. G., Shepherd, K. D., Soule, M. J. and Woomer, P. L. (1997). Soil Fertility Replenishment in Af-rica: An Investment in Natural Resource Capital. Proceedings of International Semi-nar on Fertility in Africa – NGO Perspectives ICRAF, Nairobi, Kenya.
Stocking, M. (1996). Soil erosion: Breaking
new ground. In: Land degradation and socie-ties (ed. Blaikie, P. and Brookfield, H.), pp. 49-63. London: Viliers Publication.
Swift, M. (1997). Biological Management of
Soil Fertility: An Integrated Approach to Soil Nutrient Replenishment. Proceedings of International Seminar on Approaches to Re-plenishing Soil Fertility in Africa – NGO Perspectives. ICRAF, Nairobi, Kenya.
Thames, D. J. and Cassell, D. K. (1979). Land
Farming Atlantic Coastal Plains Soils: Crop yield Relationships to Soil Physical and Chemical Properties. J. Soil Wat. Conserv. 30(1): 20 – 24.
Warrick, A. W. (1998). Spatial Variability. In:
Hillel, D. (Ed.) Environmental Soil Physics. Academic Press, USA. pp 655-675.
World Bank, Agence Franςaise de Dévelop-
ment and Royal Netherlands Embassy (2006). Ghana Country Environmental Analysis. AFTSD, Africa Region, Report № 36985-GH.
Amegashie et al. 93