Embed Size (px)
Citation preview

1
On-road particle and gaseous emissions from a
PFI and GDI hybrid electric vehicle (in the winter)Jacob Swanson1, Chengguo Li2, Shaohua Hu3, Shishan Hu3,
Liem Pham2, Heejung Jung2
1Minnesota State University, Mankato2University of California, Riverside
3California Air Resources Board

In 2012, the ARB adopted the Advanced Clean Cars program, which
included an increased zero-emissions vehicles (electric vehicles and
hydrogen fuel cell vehicle), and hybrid electric vehicles for MY 2018
through 2025
Mobile sources strategy from ARB
2

Most previous HEV studies were
conducted at modest temperatures
Hu et al. 2016- Two PHEVs (PFI) vs 2015 GDI conventional vehicle on chassis dyno (~20°C)
- PFI has lower emissions of CO2, PM mass and particle compared to GDI
engine
- Cold start particle emissions still represent the majority of particle emissions
ARB report. 2017 - On-road test under the ambient temperature (~20°C)
- 2013 Toyota Prius PHEV(PFI) vs 2016 Hyundai Sonata PHEV (GDI
- The GDI engine has higher NOx + HC emissions than that of PFI engine
Holmen et al. 2014
- On-road test under the ambient temperature (summer and winter, 0~35oC)
- 2010 Toyota Camry vs 2010 Camry HEV (GDI)
- Re-ignition HEV of PN >> Stable HEV of PN, Re-ignition high 30-70 nm
emissions
3

4
Research objectives for tests conducted in cold
weather in MN winter (Feb, -3°C ± 3)
• Compare cold weather on-road emissions between PFI
engine and GDI engine
• Compare “Cold cold” starts with “re-ignition events” on city
and highway drive cycles
• Evaluate the impact of “re-ignition” events on maintaining
catalyst temperature

HEVs specifications and instruments
Vehicle specifications (HEVs)
Toyota Prius Hyundai Sonata
Year 2016 2015
Engine Type 1.8L, I4, 121 hp 2.4L, I4 199 hp
MPG 54 city, 50 highway 36 city, 40 highway
Electric motor 60 hp 47 hp
Battery output 45kW 47kW
Fuel injection PFI GDI
Gasoline engine 71 hp @4800 rpm 159 hp @ 5,500 rpm
5
Instruments
• EEPS: dilute particle number-total and size
• E-filter – charged particles
• Thermal dilutor: total and solid particles
• NGK/NTK tailpipe sensor
- NOx emissions, PN concentration, PM concentration

Dekati e-filter is a diffusion charger
combined with a gravimetric filter
6𝐌𝐚𝐬𝐬 scales with total 𝐜𝐮𝐫𝐫𝐞𝐧𝐭

NTK/NGK PM/PN raw tailpipe sensor
7

Particle and gas sampling apparatus
8
EEPS
e-Filter
Thermo-dilutor
control unit (350°C)
Dilutor
Heat
controller
NTK/
NGK
Tailpipe
Heating line
Sampling probe
NOx sensor
PN/PM
sensor
Outside car Inside

9

Example time series of driving data
10
0
5
10
15
20
EEPS
2000 2500 3000 3500 4000
RPM Speed
Multiple days of prescribed city and highway drive cycles
(2 hr / each)
About 1 “re-ignition” event per minute (Prius)

Frequency and duration of re-ignition events
for Prius and Sonata were very different
0
5
10
15
20
25
30
0 50 100 150 200 250 300 350 400
Prius HEV_CityPrius HEV_HighwaySonata HEV_CitySonata HEV_Highway
Fre
qu
en
cy
Re-ignition duration time (s) 11

Catalyst temperatures do not drop below the
expected light-off temperature
300
400
500
600
700
800
1000 2000 3000 4000 5000 6000
Sonata HEVPrius HEV
Ca
taly
sts
Te
mp
era
ture
(oC
)
Time (s)12

Particle number time series – Prius
0
5
10
15
20
25
0 1000 2000 3000 4000 5000 6000
Prius HEV (TPM)-City (Temp. 0oC~-2
oC)
Pa
rtic
le n
um
be
r ×
10
6 (
#/c
m3)
Time (s)
0
5
10
15
20
EEPS
2000 2500 3000 3500 4000
RPM Speed
0
0.5
1
1.5
2
150 200 250 300
Cold-cold start
Route-1 city 13

Particle number time series – Sonata
0
5
10
15
20
25
0 1000 2000 3000 4000 5000 6000
Sonata HEV (TPM)-City (Temp. -2oC~-6
oC)
Pa
rtic
le n
um
be
r ×
10
6 (
#/c
m3)
Time (s)
0
5
10
15
20
EEPS
2000 2500 3000 3500 4000
RPM
0
2
4
6
8
10
0 50 100 150 200 250 300
14
Cold-cold start

Particle mass time series
0
0.0001
0.0002
0.0003
0.0004
0.0005
0 1000 2000 3000 4000 5000 6000
Prius HEV (TPM)-City (Temp. 0oC~-2
oC)
Prius HEV (SPM)-City (Temp. 0oC~-2
oC)
PM
mass (
mg
/s)
Time (s)
0
0.0001
0.0002
0.0003
0.0004
0.0005
0 500 1000 1500 2000 2500 3000 3500 4000
Prius HEV (TPM)-Highway (Temp. -2oC~-7
oC)
Prius HEV (SPM)-Highway (Temp. -1oC~-3
oC)
PM
mass (
mg
/s)
Time (s)
0
0.0001
0.0002
0.0003
0.0004
0.0005
0 500 1000 1500 2000 2500 3000 3500 4000
Sonata HEV (TPM)-Highway (Temp. 0oC~-3
oC)
Sonata HEV (SPM)-Highway (Temp. 0oC~-4
oC)
PM
mass (
mg
/s)
Time (s)
0
0.0001
0.0002
0.0003
0.0004
0.0005
0 1000 2000 3000 4000 5000 6000
Sonata HEV (TPM)-City (Temp. -2oC~-6
oC)
Sonata HEV (SPM)-City (Temp. 0oC~-3
oC)
PM
mass (
mg
/s)
Time (s)
15

Summary of total particle number
emissions
0
1
2
3
4
5
Cold-cold start Re-ignition (City)
Re-ignition (Highway)
Prius HEV (PFI)
Sonata HEV (GDI)
Ave
rag
e p
art
icle
nu
mb
er
× 1
06 (
#/c
m3)
16

Summary of NOx emissions
0
20
40
60
80
100
120
140
Cold-cold start Re-ignition(City)
Re-ignition(Highway)
Prius HEV (PFI)
Sonata HEV (GDI)
Ave
rag
e N
Ox c
on
ce
ntr
atio
n (
pp
m)
17

Particle instrument correlations (r2)
Condition PN: EEPS vs NTK PM: EEPS vs NTK EEPS (PM) vs
E-current
City
Prius 0.80 0.46 0.40
Sonata 0.22 0.14 0.51
Highway
Prius 0.34 0.26 0.65
Sonata 0.08 0.01 0.31
Total particles (solid and semi-volatile)
18
Condition PN – EEPS vs NTK PM – EEPS vs NTK PM_EEPS vs E-
current
City
Prius 0.77 0.70 0.96
Sonata 0.38 0.27 0.85
Highway
Prius 0.22 0.22 0.95
Sonata 0.01 0.05 0.65
Only solid particles

Summary – re-ignition events and
catalyst temperature
• City
− Prius re-ignition events very short (10 s) and frequent
(every ~ 1 min)
− Sonata re-ignition events are ~ 75 s and less frequent
(every ~ 2 min)
• Highway
− Prius re-ignition events are ~ 45 s in duration
− Sonata re-ignition events are ~ 5 min in duration
For both vehicles, design and prevailing conditions result
in catalyst temperatures remaining well above light-off
temperatures always
→ re-ignition particle and NOx emissions are low
19

o Cold cold start emissions
• NOx: Sonata ~ Prius
• PM: Sonata ~ 5 x Prius
o City “re-ignition” emissions
• NOx: Sonata ~ 0.5 x Prius
• PM: Sonata ~ Prius
o Highway “re-ignition” emissions
• NOx: Sonata ~ Prius
• PM: Sonata ~ 2 x Prius
Summary – comparison of emissions
and instrument correlations
20
o EEPS number and mass did not correlate with
NGK/NTK number and mass, respectively
o EEPS mass correlated very well with E-filter – and I
expect even better correlation with Dp1.4
Re-ignition
emissions
generally higher
than cold start

Questions?
21

NOx emission from Prius HEV
Temp. 0 oC ~ -2 oC
Temp. 0 oC ~ -2 oC
Temp. -2 oC ~ -7 oC
Temp. -1 oC ~ -3 oC
22

NOx emission from Sonata HEV
Temp. -2 oC ~ -4 oC
Temp. -0 oC ~ -3 oC
Temp. 0 oC ~ -3 oC
Temp. 0 oC ~ -4 oC
23

PM cumulative mass
0
0.02
0.04
0.06
0.08
0.1
0.12
0 1000 2000 3000 4000 5000 6000
Prius HEV (TPM)Prius HEV (SPM)Sonata HEV (TPM)Sonata HEV (SPM)
Cu
mu
lative
Mass (
mg)
Time (s)
City
0
0.02
0.04
0.06
0.08
0.1
0.12
0 500 1000 1500 2000 2500 3000 3500 4000
Prius HEV (TPM)Prius HEV (SPM)Sonata HEV (TPM)Sonata HEV (SPM)
Cu
mu
lative
Mass (
mg)
Time (s)
Highway
24

➢ Prius HEV vs. Sonata HEV NOx emissions
-63% of NOx for Prius > Sonata when cold-cold start
-Re-ignition events during city and highway driving
:230 % of NOx emissions for Prius > Sonata (City)
:52 % of NOx emissions for Sonata>Prius (Highway)
➢ Prius HEV vs. Sonata HEV particle number (PN)
-300 % of PN for Sonata > Prius when cold-cold start
-Re-ignition events during city and highway driving
:53 % of PN emissions for Sonata > Prius (City)
:140 % of PN emissions for Sonata>Prius (Highway)
Summary – comparison of emissions
25

Specifications of the HEVs
Vehicle specifications (HEVs)
Toyota Prius Hyundai Sonata
Year 2016 2015
Engine Type 1.8L Hybrid I4 121hp 2.4L Hybrid I4 199hp 154ft. lbs.
MPG 54 city, 50 highway 36 city, 40 highway
Electric motor 60 hp 47 hp (35kW) @ 1,6303,000 rpm
Motor type/voltage Nickel-metal hydride
/123
Interior-Permanent Magnet
Synchronous Motor/270 V
Battery output 45kW 47kW
Battery type/voltage ZVW50 model (Nickel-Metal
hybride battery)/240 V
Lithium polymer battery/270 V
Fuel Injection PFI GDI
Gasoline engine 71 Ib-ft @4800 rpm 159 hp @ 5,500 rpm
Torque 120.2 Ib-ft @ 4000 rmp 154 Ib-ft @ 4,500 rpm
Transmission CVT 6-Speed Shiftable Automatic
Curb Weight 3075 Ibs 3,508 lbs
26

NTK/NGK_NOx sensor
27

Particle number-Contour
City-Prius HEV
(SPN)
City-Prius HEV
(TPN)
Highway-Prius HEV
(SPN)
Highway-Prius HEV
(TPN)
City-Sonata HEV
(SPN)
City-Sonata HEV
(TPN)
Highway-Sonata HEV
(SPN)
Highway-Sonata HEV
(TPN)
Temp. 0 oC ~ -2 oC
Temp. 0 oC ~ -2 oC
Temp. -2 oC ~ -4 oC
Temp. 0 oC ~ -3 oC
Temp. -2 oC ~ -7 oC
Temp. -1 oC ~ -3 oC
Temp. 0 oC ~ -3 oC
Temp. 0 oC ~ -4 oC
28

NOx vs RPM_Sonata HEV
0
50
100
150
200
250
300
2000 2200 2400 2600 2800 3000
NOx Concentration RPM
NO
x (
ppm
)
F
0
50
100
150
0
200
400
600
800
1000
0 200 400 600 800 1000 1200 1400
NOx concentrationSOC Catalysts temperature
NO
x (
ppm
) /
SO
C (
%)
Cata
lysts
tem
pe
ratu
re (o
C)
Time (s)
RPM
0
100
200
300
400
500
600
700
800
0
20
40
60
80
100
0 1000 2000 3000 4000 5000 6000
Catalysts TemperatureNOx ConcentrationSOC
NO
x (
pp
m)
/ C
ata
l.T
em
p. (o
C)
SO
C (%
)
Time (s)
Sonata HEV (City-1st)
Temp. -2 oC ~ -4 oC
29

On-road particle and gaseous
emissions from a PFI and GDI hybrid
electric vehicle (in the winter)
Jacob Swanson1, Chengguo Li2, Shaohua Hu3, Shishan Hu3,
Liem Pham2, Heejung Jung2
1Minnesota State University, Mankato2University of California, Riverside
3California Air Resources Board
2017 Cambridge Particle Meeting, 23 June 2017

Non-ignition events during RPM=0
400
450
500
550
600
650
700
750
800
Prius (City) Prius (Highway) Sonata (City) Sonata (Highway)
Ca
taly
sts
Te
mp
era
ture
(oC
)
31

Example linear correlations between EEPS and NTK
Total particle Solid particle
City
Hig
hw
ay
32

Linear correlation between EEPS and NTK for
Sonata
Total particle Solid particle
City
Hig
hw
ay
33
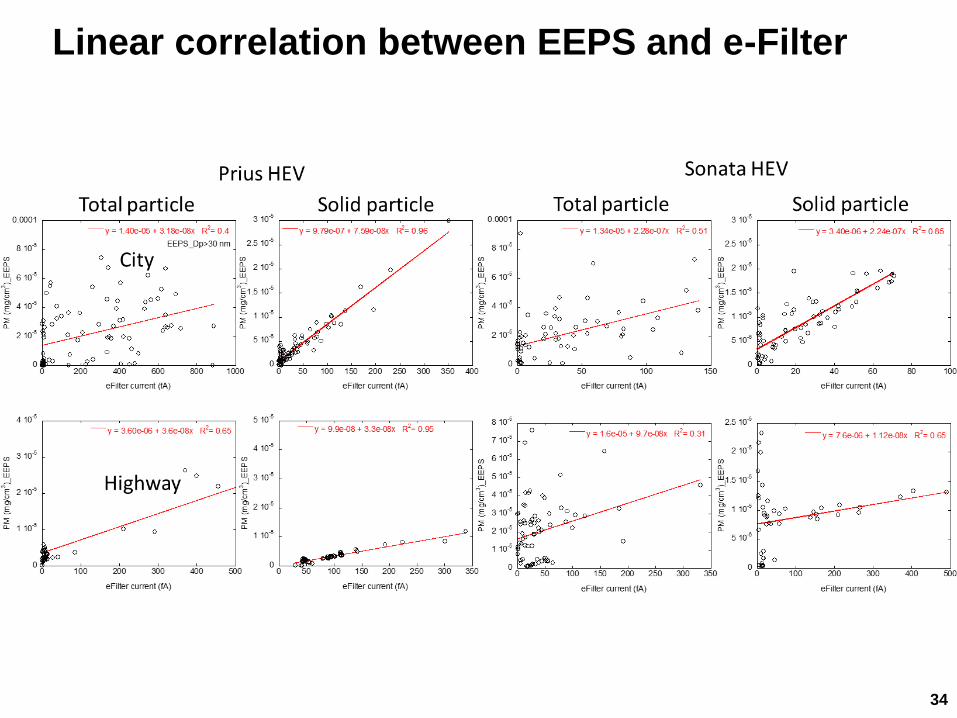
Linear correlation between EEPS and e-Filter
34

PM number (EEPS)
0
5
10
15
20
25
0 1000 2000 3000 4000 5000 6000
Prius HEV (TPM)-City (Temp. 0oC~-2
oC)
Prius HEV (SPM)-City (Temp. 0oC~-2
oC)
Pa
rtic
le n
um
be
r ×
10
6 (
#/c
m3)
Time (s)
0
5
10
15
20
25
0 500 1000 1500 2000 2500 3000 3500 4000
Prius HEV (TPM)-Highway (Temp. -2oC~-7
oC)
Prius HEV (SPM)-Highway (Temp. -1oC~-3
oC)
Pa
rtic
le n
um
be
r ×
10
6 (
#/c
m3)
Time (s)
0
5
10
15
20
25
0 1000 2000 3000 4000 5000 6000
Sonata HEV (TPM)-City (Temp. -2oC~-6
oC)
Sonata HEV (SPM)-City (Temp. 0oC~-3
oC)
Part
icle
num
be
r ×
10
6 (
#/c
m3)
Time (s)
0
5
10
15
20
25
0 500 1000 1500 2000 2500 3000 3500 4000
Sonata HEV (TPM)-Highway (Temp. 0oC~-3
oC)
Sonata HEV (SPM)-Highway (Temp. 0oC~-4
oC)
Part
icle
nu
mb
er
× 1
06 (
#/c
m3)
Time (s)
35

Particle size distribution
0
5 106
1 107
1.5 107
2 107
1 10 100 1000
Prius HEV (TPN)Prius HEV (SPN)Sonata HEV (TPN)Sonata HEV (SPN)
dN
/dL
ogd
p (
#/c
m3)
Size (nm)
City
0
5 106
1 107
1.5 107
2 107
1 10 100 1000
Prius HV (TPN)Prius HV (SPN)Sonata HV (TPN)Sonata HV (SPN)
dN
/dLogd
p (
#/c
m3)
Size (nm)
Highway
36

Time constant for cool down and warm-
up
37
0
20
40
60
80
100
120
Warm-up Cool-down
Tim
e c
on
sta
nt
(s)

38