Embed Size (px)
Citation preview

On Polarimetric Radar Signatures of Deep Convection for Model Evaluation:Columns of Specific Differential Phase Observed during MC3E*
MARCUS VAN LIER-WALQUI,1,# ANN M. FRIDLIND,# ANDREW S. ACKERMAN,# SCOTT COLLIS,@
JONATHAN HELMUS,@ DONALD R. MACGORMAN,&,** KIRK NORTH,11
PAVLOS KOLLIAS,11AND DEREK J. POSSELT
##
1CCSR, Columbia University, New York, New York#NASA Goddard Institute for Space Studies, New York, New York
@Environmental Sciences Division, Argonne National Laboratory, Argonne, Illinois&NOAA/National Severe Storms Laboratory, Norman, Oklahoma
**Cooperative Institute for Mesoscale Meteorological Studies, Norman, Oklahoma11McGill University, Montreal, Quebec, Canada##University of Michigan, Ann Arbor, Michigan
(Manuscript received 17 March 2015, in final form 9 October 2015)
ABSTRACT
The representation of deep convection in general circulation models is in part informed by cloud-resolving
models (CRMs) that function at higher spatial and temporal resolution; however, recent studies have shown
that CRMs often fail at capturing the details of deep convection updrafts. With the goal of providing
constraint on CRM simulation of deep convection updrafts, ground-based remote sensing observations are
analyzed and statistically correlated for four deep convection events observed during the Midlatitude Con-
tinental Convective Clouds Experiment (MC3E). Since positive values of specific differential phase KDP
observed above themelting level are associatedwith deep convection updraft cells, so-calledKDP columns are
analyzed using two scanning polarimetric radars in Oklahoma: the National Weather Service Vance WSR-
88D (KVNX) and the Department of Energy C-band Scanning Atmospheric Radiation Measurement
(ARM) Precipitation Radar (C-SAPR). KVNX and C-SAPRKDP volumes and columns are then statistically
correlated with vertical winds retrieved via multi-Doppler wind analysis, lightning flash activity derived from
the Oklahoma Lightning Mapping Array, and KVNX differential reflectivity ZDR. Results indicate strong
correlations ofKDP volume above the melting level with updraft mass flux, lightning flash activity, and intense
rainfall. Analysis of KDP columns reveals signatures of changing updraft properties from one storm event to
another as well as during event evolution. Comparison of ZDR to KDP shows commonalities in information
content of each, as well as potential problems with ZDR associated with observational artifacts.
1. Introduction
a. Motivation
This study lays the groundwork for observational
evaluation of cloud-resolving model simulations by
quantifying statistical properties of objectively identified
radar observables, namely specific differential phaseKDP,
and establishing their correlation with collocated re-
trieval of vertical winds, as well as precipitation rate, and
lightning flash activity, which are also closely related to
updraft properties. This will allow for future work to test
approaches for comparing high-resolution simulations
and observations that rely primarily on the strengths
identified in the analysis of KDP presented herein.
The microphysical properties of mature deep con-
vection updrafts remain poorly quantified, at least in
part because of sparse in situ measurements available
from aircraft campaigns, which provide the only direct
means of measuring hydrometeor mixing ratio, mor-
phology, size distribution, and phase within strong up-
drafts (Heymsfield et al. 2002; Stith et al. 2002, 2004;
* Supplemental information related to this paper is available at
the Journals Online website: http://dx.doi.org/10.1175/MWR-D-
15-0100.s1.
Corresponding author address: Marcus van Lier-Walqui, CCSR,
Columbia University, 2880 Broadway, New York, NY 10027.
E-mail: [email protected]
FEBRUARY 2016 VAN L I ER -WALQU I ET AL . 737
DOI: 10.1175/MWR-D-15-0100.1
� 2016 American Meteorological SocietyUnauthenticated | Downloaded 03/19/22 10:17 PM UTC

Anderson et al. 2005; Stith et al. 2006; Lawson et al.
2010). A glaring result is the lack of observational data
adequate to quantitatively constrain order-of-magnitude
differences in condensate mixing ratios commonly pre-
dicted by cloud-resolving simulations of deep convection
systems using differing microphysics schemes, where in-
teraction of dynamics and microphysics schemes likely
contribute to differences (Varble et al. 2011; Zhu et al.
2012; Collis et al. 2013; Varble et al. 2014a,b). This dearth
of in situ measurements is furthermore unlikely to be
quickly remedied owing to the difficulty of obtaining ro-
bust statistics by aircraft over sparsely distributed and
rapidly evolving features. With research-grade simula-
tions poorly constrained, it is extraordinarily difficult to
robustly establish higher-order differences in updraft
properties, such as those induced by changes in aerosol
fields [see reviews by Levin and Cotton (2008) and Tao
et al. (2012)], which have been hypothesized to influence
climate via their influence on deep convection.
Instead of directly constraining hydrometeor con-
centrations, observations can be used to inform the
microphysical processes present in deep convective up-
drafts. Perhaps the most promising sources of data now
available for that task are scanning polarimetric radars,
including those operated by the U.S. National Weather
Service and the Department of Energy’s Atmospheric
Radiation Measurement (ARM) program (Ackerman
and Stokes 2003; Mather and Voyles 2013). Such radars
offer wide-domain and continuous coverage in time, but
likely require an analysis approach that is suited to their
strengths, which do not currently include robust retrieval
of condensate mixing ratios within updrafts, for instance,
but may include signatures associated with the micro-
physical processes of deep convection.
Within the high-resolution and global modeling
community, radar reflectivity (typically horizontally
polarized radar reflectivity ZHH) has been effectively
used, for example, to define convective and stratiform
regions using the Steiner and Smith (1998) algorithm
(e.g., Caniaux et al. 1995; Gray 2000; Lang et al. 2003;
Mechem et al. 2006; Braun et al. 2010; Fridlind et al.
2012; Zeng et al. 2013; Mrowiec et al. 2015). Addition-
ally, contoured frequency with altitude (CFAD) plots of
reflectivity are used to evaluate differences in modeled
and observed storm microphysics and dynamics (Lang
et al. 2003; Blossey et al. 2007; Matsui et al. 2009; Shi
et al. 2010; Lang et al. 2011; Tao et al. 2014; Matsui et al.
2015). These methods have proven valuable in illus-
trating gross differences betweenmodeled and observed
storm characteristics; however, they do not provide
specific information on, for example, the prevalence,
spatial distribution, and strength of deep convective
updrafts. There would be much potential value in an
observational metric of deep convective storms that is
capable of providing these data, providing that it could
be effectively compared to analogous metrics calculated
from numerical model simulations. The current work
provides background for the use of columns ofKDP as an
observational constraint on modeled deep convective
updrafts.
This study focuses on polarimetric precipitation radar
observations owing to their ability to provide unique
information about hydrometeors involved in updraft
microphysical processes (Bringi et al. 1996; Hubbert
et al. 1998; Loney et al. 2002; Kumjian et al. 2014a). In
particular, it focuses on the presence of elevated positive
values of KDP above the environmental 08C isotherm,
which strongly suggests significant quantities of lofted
liquid rain and/or water-coated ice, and thus, the pres-
ence of deep convection updrafts (Bringi et al. 1996;
Hubbert et al. 1998; Loney et al. 2002). For a review of
KDP and other polarimetric variables, in the interest of
space we refer the reader elsewhere (Doviak and Zrnic
1993; Zrnic and Ryzhkov 1999; Bringi and Chandrasekar
2001; Kumjian 2013).
Because the ultimate goal is to use these radar ob-
servations to constrain model simulations, we require
that these observations be robust, both from the per-
spective of observational uncertainties, as well as from
the perspective of forward modeling these observations.
In both regards, the choice of KDP is attractive. With
regard to observational artifacts and uncertainty, KDP is
arguably more robust than ZDR as an observational in-
dicator of the presence of rain or liquid-coated ice par-
ticles above the melting level throughout the life cycle
of a convection cell. For example, results from Kumjian
et al. (2014a) suggest that as hail mass becomes signifi-
cant from the perspective of reflectivity, ZDR is de-
pressed despite the continued presence of both a
convective updraft and rain above the melting level. In
such cases,KDP above themelting level is likely to better
track the full life cycle of a convection updraft. Addi-
tionally,KDP-related rain rate statistics have been shown
to have good fidelity, even for radar frequencies sus-
ceptible to attenuation errors (Giangrande et al. 2014).
Differential reflectivity ZDR is possibly preferable to
KDP as a signal of the initial stages of a deep convective
updraft because it does not require significant concen-
trations of oblate hydrometeors and is, thus, better able
to characterize the initial evolution of an updraft where
liquid hydrometeors may be present above the 08C iso-
therm in low concentrations.
With regards to observational uncertainties, ZDR is
sensitive to both radar calibration errors, as well as dif-
ferential attenuation, which is caused by propagation of
the signal through oriented hydrometeors (Aydin et al.
738 MONTHLY WEATHER REV IEW VOLUME 144
Unauthenticated | Downloaded 03/19/22 10:17 PM UTC

1989; Bringi and Chandrasekar 2001). Whereas KDP is
insensitive to both calibration and attenuation effects,
although estimation of KDP becomes complicated when
backscatter differential phase is significant, as it is for
particles that are large with respect to the radar wave-
length (Aydin and Giridhar 1992; Carey et al. 2000;
Giangrande et al. 2013), and KDP may also be suscepti-
ble to cross-coupling effects (Hubbert et al. 2014).
For identification of deep updrafts,KDP is preferred to
radar reflectivity for a number of reasons. In deep con-
vection, high reflectivity may indicate high concentra-
tions of rain and ice-phase hydrometeors such as hail,
graupel, and mixed-phase hydrometeors. By compari-
son, elevated positive values of KDP are generally re-
lated to liquid rain or liquid-coated hydrometeors,
which produce positive KDP owing to their oblateness.
Considering only rain, radar reflectivity, under the
Rayleigh approximation, is proportional to the sixth
moment of a drop size distribution. For the purposes of
forward modeling observations, this results in strong
and nonlinear sensitivity to assumptions in the modeled
drop size distribution. By contrast, KDP is approxim-
ately related to the fourth–fifth moment of the raindrop
size distribution and is closely related to rain rate
(Sachidananda and Zrnic 1986; Ryzhkov and Zrnic
1996; Zrnic andRyzhkov 1999; Cifelli andChandrasekar
2010). This last point relates to the robustness of forward
simulation of KDP from model results. In the current
study, it is hypothesized that use of KDP instead of ZDR
will reduce forward modeling uncertainties related to
raindrop size distribution assumptions because KDP is
less sensitive to variations in assumptions of the rain
drop size distribution than either reflectivity or ZDR.
The purpose of this study is to investigate the char-
acteristics of KDP as an observational signal of deep
convective updrafts, in order to motivate its use as a
constraint on numerical simulations. The focus is not
on conclusively diagnosing the microphysical processes
that produce KDP columns, nor is it to use KDP to study
the dynamics of deep convection. Instead,KDP columns
observed in four midlatitude deep convection storm
systems are analyzed to answer the following questions:
1) How does the signal of deep convection observed in
the depth and volume of KDP columns correlate with
other metrics such as multi-Doppler wind retrievals
and electrical storm activity? 2) How do the relation-
ships between KDP columns and other metrics of deep
convection vary from storm to storm and within
evolving storms systems during their life cycles? Ad-
dressing these issues will improve understanding of
how KDP columns, and more generally, positive KDP
above the melting level, characterize deep convective
storm systems and their life cycles to aid forecasters
and provide information needed to useKDP to evaluate
numerical models.
b. Background
Two prominent examples of analysis and in-
terpretation of KDP columns can be found in Hubbert
et al. (1998) and Loney et al. (2002). Hubbert et al.
(1998) documented S-band observations of a supercell
observed by the CSU–CHILL radar in Colorado and
analyzed ZDR, linear depolarization ratio (LDR), co-
polar correlation ratio (rHV), and KDP signatures. The
authors interpret the KDP column as a signal of small
drops (1–2mm) shed by wet hailstones by virtue of its
location on the fringe of the identified updraft. Loney
et al. (2002) present S-band polarimetric radar obser-
vations of an Oklahoma supercell collocated with in situ
data collected from an aircraft. The aircraft sampled
particle sizes along a path above the melting level
through a region associated with roughly maximal KDP
values evident in CAPPI and vertical sections. Their
results indicated radar observed elevated positive KDP
roughly collocated with the storm updraft, compared
with KDP forward simulated from in situ data, which
showed peaks on either side of the updraft. Recently,
Homeyer and Kumjian (2015) performed a composite
analysis of polarimetric radar observations of organized,
cellular, and supercellular deep convection across the
Great Plains. This study showed the prevalence and
consistency of KDP and ZDR columns in regions associ-
ated with convection that overshoots the altitude of the
extratropical tropopause.
Electrical activity of storms has long been used as a
signal of continental deep convection, to the extent that
the word ‘‘thunderstorm’’ is used to describe such
weather. It has been long understood that a dominant
mechanism in separation of charge in thunderstorms is
rebounding ice–ice collisions occurring between parti-
cles such as graupel and pristine ice in the presence of
supercooled cloud water (Reynolds et al. 1957;
Takahashi 1978; Jayaratne et al. 1983; Pereyra et al.
2000). Graupel is produced in regions where riming
growth is dominant—in other words, regions of deep
convection updrafts. Studies—for example, Deierling
and Petersen (2008)—have confirmed a strong link be-
tween updraft volume and total flash rate in storm sys-
tems, with Wiens et al. (2005) stressing the importance
of using flash density, rather than raw VHF source
density, as a measure of lightning activity.
The role of mixed-phase microphysics in the separa-
tion of charge suggests that polarimetric variables such
as KDP and ZDR observed above the melting layer may
be linked to lightning activity. Multiple studies have
confirmed and elaborated on the relationship between
FEBRUARY 2016 VAN L I ER -WALQU I ET AL . 739
Unauthenticated | Downloaded 03/19/22 10:17 PM UTC

lightning activity and multi-Doppler radar-derived up-
drafts (Lang andRutledge 2002; Tessendorf et al. 2007b,a;
Deierling and Petersen 2008; Calhoun et al. 2013) and
several have investigated the relationships between po-
larimetric variables and electrical activity in deep con-
vection storms (Carey and Rutledge 1998; Tessendorf
et al. 2005; Wiens et al. 2005; Bruning et al. 2007; Lund
et al. 2009; Payne et al. 2010; Griffin et al. 2014).
2. Data and methodology
a. Data
1) KVNX S-BAND POLARIMETRIC RADAR
S-band polarimetric radar data was obtained from
the National Weather Service WSR-88D (NEXRAD)
Vance Oklahoma site (KVNX). This radar simulta-
neously transmits and receives electromagnetic waves
with horizontal and vertical polarizations (STAR),
meaning that measurements of cross-polarization var-
iables such as LDR and cross-polar correlation co-
efficient rxh are not possible using this radar. Level-II
data from the National Climatic Data Center provide
the variables horizontal reflectivity ZHH, differential
reflectivity ZDR, differential phase CDP, copolar cor-
relation coefficient rHV, and radial velocity. The radar
operated in volume coverage patterns (VCP) 11, 212,
12, and 212 for the 4 days, respectively; all modes fea-
tured 14 elevation scans performed in approximately
5min. At the time of the Midlatitude Continental
Convective Clouds Experiment (MC3E), KVNX had
an angular resolution of 18 for all elevations angles
(lower angles had improved 0.58 resolution) and 250-m-
range resolution.
Differential phase KDP is obtained from NEXRAD
Level-II differential phase dataCDP using the Giangrande
et al. (2013) algorithm as implemented in the Python
ARM Radar Toolkit (Py-ART) (Heistermann et al.
2015). This algorithm assumes a monotonic increase in
CDP and is, thus, inappropriate for regions where neg-
ative KDP is expected (such as in electrified ice fields or
in the presence of conical graupel). Conversely, this al-
gorithm iswell suited to usingKDP to identify the presence
of rain or liquid-coated hydrometeors lofted above the
melting layer by strong convection updrafts—conditions
where negativeKDP is not expected. Processing to retrieve
FDP and KDP requires filtering that reduces range reso-
lution to approximately 1km for KDP.
NEXRAD radar data, including the derived KDP
fields, are gridded using Py-ART gridding routines on a
Cartesian grid with 1-km horizontal and 500-m vertical
resolution. Care was taken in selecting the appropriate
gridding algorithm to capture relevant detail while
suppressing artifacts; we chose an inverse-distance
weighted algorithm using a Barnes (1964)–like weight-
ing function as in Collis et al. (2010) and Trapp and
Doswell (2000). It should be noted that, at the time of
MC3E, KVNX was the only operational NEXRAD
radar in the region that was polarimetric. Future studies
of large storm systems such as those observed during
MC3E will no doubt benefit from enhanced spatial
coverage of polarimetric NEXRAD radars.
2) C-SAPR C-BAND POLARIMETRIC RADAR
The Department of Energy (DOE) Atmospheric Ra-
diation Measurement C-band ARM Scanning Pre-
cipitation Radar (C-SAPR) is a polarimetric 5-cm
wavelength radar that was located near the ARM
Southern Great Plains (SGP) site at Lamont, Oklahoma,
during this study. LikeKVNX, it was run in STARmode.
The C-SAPR radar has approximately the same beam-
width as KVNX (approximately 18) but much improved
range resolution (90m versus 250m for KVNX); KDP
range resolution for C-SAPR is approximately 250m
owing to filtering in the phase processing algorithm.
Data were analyzed on a Cartesian grid with 1-km
horizontal and 500-m vertical resolution. Data were
processed to derive KDP from CDP, again using the
Giangrande et al. (2013) algorithm. Differential re-
flectivity ZDR suffered from problems associated with
differential attenuation from heavy precipitation
observed on all days, compounded by the sensitivity of
C-band radar measurements to such effects, and ZDR
from C-SAPR was therefore not used in this study.
Additionally, a polarimetric rainfall estimation based
on specific attenuationwas used to derive rain rates from
C-SAPR polarimetric radar variables (Ryzhkov et al.
2014; Giangrande et al. 2014). Giangrande et al. (2014)
analyzed these data and compared them with estimates
from X-band polarimetric radars as well as rain gauges;
C-SAPR rain rates were shown to be in good agreement
with rain gauges. Here we analyze rain rates above the
40 and 90mmh21 thresholds to illustrate convective and
particularly intense rain rates, respectively.
3) MULTI-DOPPLER WIND RETRIEVAL
The network of scanning precipitationDoppler radars
at the ARM SGP site provides the capability to view the
atmosphere from multiple different angles in under
approximately 7min. During MC3E, the coordination
of this network was of highest priority at times when
significant convection events were imminent or occur-
ring. We briefly describe the multi-Doppler wind re-
trieval method here. For a full description of the
method, see North (2016). Fundamentally, the radial
velocity observations from this network are ingested
740 MONTHLY WEATHER REV IEW VOLUME 144
Unauthenticated | Downloaded 03/19/22 10:17 PM UTC

into a three-dimensional variational (3D-VAR) algo-
rithm that minimizes a cost function defined as the sum
of multiple independent constraints: radar Doppler ra-
dial velocity, mass continuity, a background field, and
smoothness. Mass continuity in this case is the anelastic
approximation for moist convection and is a required
constraint owing to inadequate sampling of vertical air
motion by scanning Doppler radars. The background field
provides a physical solution in data-sparse regions, and the
smoothness constraint is designed to reduce retrieval ar-
tifacts and extend properly constrained regions into poorly
constrained regions. These four constraints are common in
multi-Doppler wind retrieval literature. The analysis do-
main for these wind retrievals covers 100 3 100km2
around the SGP Central Facility and extends up to 10-km
altitude, with a horizontal resolution of 500m and a ver-
tical resolution of 250m. The radars used included the
C-SAPR radar as well as two X-band (3-cm wavelength)
ARM Scanning Precipitation Radars (X-SAPR) located
near the central facility; the locations of these radars are
shown in Fig. 1.
4) OKLAHOMA LIGHTNING MAPPING ARRAY
The Oklahoma Lightning Mapping Array (LMA) is a
time-of-arrival-based lightning mapping system that
utilizes an array of very-high-frequency (VHF) antennas
to provide a four-dimensional map of lightning activity
in thunderstorms (MacGorman et al. 2008; Thomas et al.
2004). Vertical accuracy is limited at distances further
than 100km from the LMA and horizontal accuracy
becomes limited at distances beyond 200km from the
LMA. For a given lightning strike, the LMAmay detect
between tens and thousands of VHF sources. As stated
in section 1b, results from Wiens et al. (2005) suggest
that better correlation is found between convection
storm statistics (such as updrafts) and flashes rather than
VHF sources. Clustering of VHF source into flashes was
performed as suggested by MacGorman et al. (2008),
with thresholds of 3 km and 0.25 s set for inclusion of a
VHF source into a flash and a minimum of 10 VHF
sources required per flash. Data shown here represent
the time and location of the first VHF source within a
given flash. Collocated radar analysis is performed on
data gridded from the Vance Oklahoma WSR-88D.
5) KDP COLUMN ANALYSIS
Specific differential phase KDP columns were objec-
tively identified from gridded C-SAPR andKVNX data.
Gridded KDP fields were integrated vertically within a
2-km slab above the melting level and smoothed using a
FIG. 1. Map of KVNX radar location with 200-km-range ring (red square and ring), C-SAPR
radar location with 112-km-range ring (blue square and ring), LMA antennae locations and
200-km-range ring (green asterisks and ring), and domain of multi-Doppler wind retrieval
(black box) with location of X-SAPR radars (black squares).
FEBRUARY 2016 VAN L I ER -WALQU I ET AL . 741
Unauthenticated | Downloaded 03/19/22 10:17 PM UTC

Gaussian smoother in order to remove texture re-
sulting from ray-to-ray processing of the KDP field.
From this processed two-dimensional field, regional
maxima were identified and a watershed segmentation
algorithm (a class of feature or ‘‘blob’’ detection al-
gorithms) was used to identify the boundaries and
horizontal extent of each KDP column region [see
Roerdink and Meijster (2001) for a review of water-
shed algorithms]. This method allowed for the iden-
tification of KDP columns of irregular shape, which
may or may not share a boundary with other KDP
columns. Within the horizontal bound of each KDP
column, the maximum height of the KDP . 0:758km21
andZDR . 1:0-dB level was identified. These threshold
were chosen based on values reported for KDP and
ZDR columns in previous research (e.g., Loney et al.
2002). The corresponding C-SAPR KDP threshold of
1.58km21 was increased to account for the inverse
proportionality of phase shift to wavelength. Varia-
tions of 25% in each threshold were found to have
insignificant effects on the conclusions in the paper.
To identify the maximum height of the ZDR level
explicitly associated with liquid water, additional re-
quirements were made that this level occur where
there is a negative vertical gradient in ZDR (indicating
the top of a vertically extended column of positive
ZDR) and that this level occur below the homogeneous
freezing level (about 9.5 km above MSL on each day).
These requirements were imposed so as to avoid find-
ing levels associated with oblate ice hydrometeors
found near the top of the stratiform ice deck that dis-
play elevated positive ZDR. This method may still
misidentify regions of dendritic ice growth that occur
between2108 and2208C as ZDR columns as a result of
the positive ZDR of oblate ice; however, no such re-
gions were found and no such contamination is ex-
pected in the cases studied here. Both KDP and ZDR
volume above the melting level were calculated by
summing the area included in the aforementioned KDP
and ZDR thresholds, respectively, in a 3-km slab above
the melting level.
b. Meteorology
Four days during MC3E were selected for analysis,
each featuring deep convection over Oklahoma and
southern Kansas. Some characteristics of storms ob-
served on each day are listed in Table 1. These days were
chosen because all featured deep convection and were
sampled by aircraft, suitable for detailed model evalu-
ation. The four cases displayed significant differences in
organizational mode and intensity. In some cases, such
as 20 and 24 May, the organizational morphology of the
prevalent storm systems changed considerably during
the observational period.
1) 0700–1100 UTC 25 APRIL 2011 (LATE NIGHT–EARLY MORNING LOCAL)
Storms initiated along a lower-tropospheric boundary
associated with a weak surface low pressure system. The
skew T–logp diagram indicates a linear 0–6-km shear of
approximately 30ms21 (see Fig. 3) with strong upper-
tropospheric westerly and southerly winds. Such a wind
profile has been shown to favor linear squall-line de-
velopment with leading-stratiform precipitation (Parker
and Johnson 2000), and the storms that developed in
southern Oklahoma were indeed of this type. However,
the storms of interest were located in northern Okla-
homa to southern Kansas and developed along a weak
low-level baroclinic zone. Convection cells in this region
were initially oriented west to east but organized into
south-north-oriented lines as they reached maturity.
Evidence of both orientations can be seen in the mid-
tropospheric radar plots in Fig. 2.
2) 0700–1100 UTC 20 MAY 2011 (LATE NIGHT–EARLY MORNING LOCAL)
This case exhibited cellular convection that developed
in the early morning (local time) along a dryline gener-
ated on 19 May and with synoptic forcing for ascent pro-
vided by an approaching upper-level low pressure system.
Storms subsequently organized into a linear mesoscale
convection system at approximately 0830 UTC. As on
TABLE 1. Summary of days considered in this study.
Day
Times analyzed
(UTC)
Melting
level (km) Storm type Notes
25 Apr 0600–1200 3.6 Disorganized MCS
20 May 0200–1300 4.4 Trailing-stratiform MCS Disorganized, isolated cells transition to
organized squall-line MCS.
23 May 2000–0500 4.2 Supercell Record hail size for Oklahoma recorded
during this storm system.
24 May 1900–0200 4.3 Supercell, leading-stratiform MCS EF5 tornado reported during this
storm system.
742 MONTHLY WEATHER REV IEW VOLUME 144
Unauthenticated | Downloaded 03/19/22 10:17 PM UTC

FIG. 2. Examples of radar observations and analysis from KVNX on each of the 4 days in this study. (left) Radar reflectivity at
approximately the melting level, (middle) KDP integrated in a slab above the melting level, and (right) KDP column objects identified by
the algorithm described in this paper. Each object is color coded and the number of objects is listed in the plot title.
FEBRUARY 2016 VAN L I ER -WALQU I ET AL . 743
Unauthenticated | Downloaded 03/19/22 10:17 PM UTC

25 April, 0–6-km shear was approximately 30ms21;
however, on this day the surface winds were strongly
southerly, and convection matured into ‘‘leading line,
trailing stratiform’’ structures (Parker and Johnson 2000).
A south-to-north-oriented convection line with trailing
stratiform can be clearly seen in the radar imagery in
Fig. 2. Later soundings show a well-developed rear-inflow
jet as is typical in such storms Biggerstaff and
Houze (1991).
3) 2100–0200 UTC 23 MAY 2011 (LATE
AFTERNOON–LATE EVENING)
On 23 May, the upper-level flow was nearly zonal,
with a weak short-wave trough located just west of
Oklahoma and a weak surface boundary extending from
southwest Oklahoma into southeast Kansas. Cellular
convection initiated along a dryline located in western
Oklahoma and exhibited anvils that expanded rapidly to
the east and southeast. By the time the storm had
reached maturity, upper-level winds were oriented from
northwest to southeast, promoting anvil expansion in
that direction (see Fig. 3). Thick stratiform anvil struc-
tures can be clearly seen in the radar reflectivity in Fig. 2.
Isolated convection in southern Oklahoma dissipated,
while storms to the north organized along the surface
boundary and eventually produced a northwest-to-
southeast-moving bow echo.
4) 2000–0100 UTC 24 MAY 2011 (LATE
AFTERNOON–EARLY EVENING)
In contrast to the previous day, convection on 24 May
developed in association with an approaching upper-level
FIG. 3. Soundings from the ARM SGP central facility for each of the 4 days. Times chosen are shortly before radar
time series analysis in this study, except for 23 May, which has a sounding from a time closer to storm maturity.
744 MONTHLY WEATHER REV IEW VOLUME 144
Unauthenticated | Downloaded 03/19/22 10:17 PM UTC

trough and deepening surface low pressure system.
Convection initiated along the dryline at approximately
1830 UTC, rapidly moved east-northeast, and produced
thick stratiform anvils that expanded to the north and
east. Cellular and supercellular features later organized
into south-to-north-oriented lines that continued to
propagate eastward through the remainder of the
evening (local time).
3. Summary of results
a. Time series observations: KVNX, C-SAPR, LMA,and multi-Doppler updrafts
To illustrate one example of how KDP, ZDR, updraft
mass flux, and lightning flash rates contemporaneously
evolve, time series are shown for a single day, 23 May
2011. Time series for the other days analyzed here are
made available as online supplemental material (see
Figs. S1–S12 in the online supplemental material).
2000 UTC 23 MAY–0500 UTC 24 MAY 2011
Time series of bulk polarimetric radar analysis from
KVNX data collected on 23 May 2011 are shown in
Fig. 4. The KDP volume above the melting level shows
very little signal until approximately 2120 UTC, when it
increased dramatically, peaking just before 2200 UTC.
Between 2200 and 2330, KDP volume above the melting
level remained elevated, while experiencing consider-
able fluctuations. Subsequently, KDP volume decreased
before showing three sharp increases peaking at 0045,
0145, and again at 0400 UTC, respectively. There is in-
consistency in terms of the relationship between KDP
volume observed above the melting level and KDP area
at the surface. In particular, the period between 2120
and 2330 UTC showed greater KDP area at the surface
relative to above the melting layer, when compared with
the period between 2330 and 0200 UTC. C-SAPR data
from storms on 23 May (Fig. 5) agreed well with KVNX
in both magnitude and timing of the presence of KDP
observed above the melting level, but data are tempo-
rally limited for this case because of a radar malfunction.
Rain rates above both the 40 and 90mmh21 thresholds
are well correlated with one another and generally fol-
lowed the evolution of KDP volume above the melting
level, though limited data exist for comparison.
The ZDR volume above the melting level is seen to
have increased before elevated positive values of KDP
became evident. This finding is in agreement with use
of ZDR columns as an early observational signal of
deep convection updrafts (Bringi et al. 1991). The ZDR
volume above the melting level followed the general
trend of KDP volume, but maxima were not always
contemporaneous. For example, the peak inKDP volume
at 0145 UTC is visible in ZDR volume, but its shape and
strength relative to other peaks is different than forKDP;
KDP column heights are generally higher than on
25 April or 20 May, though lower than 24 May, with a
mode in the height distribution at about 6 km, or almost
2 km above the melting level. The ZDR volume above
the melting level is generally much greater than KDP
volume above the melting level. This can be explained,
in part, by noting that KDP, unlike ZDR, requires sig-
nificant concentrations of liquid hydrometeors, and
may therefore be absent in cases where size sorting
produces low concentrations of large droplets, for ex-
ample. However, choice of KDP and ZDR thresholds is
likely also a factor in comparison between respective
volumes above the melting level. There are generally
more KDP columns that exceed 7 km in height during
the later period of the storm system (after 0000 UTC)
compared with the earlier period of the storm system.
The KDP columns detected in the C-SAPR radar show
generally good agreement with KVNX in median
column height.
LMA flash analysis, shown in Fig. 6 together with
polarimetric radar analysis from KVNX, show that total
lightning flash activity appears to lag local maxima in
KDP volume in time but generally appears better cor-
related temporally with ZDR volume above the melting
level. Total flash activity peaks at values greater about
equal to those observed on 20 May, despite much lower
values of KDP volume above the melting level.
Comparison ofKDP from C-SAPRwith multi-Doppler
wind retrievals is shown in Fig. 7. Lag correlation (not
shown) peaks at rt 5 0:93 when updraft mass flux at 08Cprecedes the onset of KDP volume above the melting
level by at approximately 14min (compared to a corre-
lation of r5 0:79 for zero lag). This appears to echo
results shown in Fig. 6, where the presence of KDP vol-
ume above the melting level can be seen to lag both
lightning activity and ZDR volume above the melting
level. One may hypothesize by extension that updraft
statistics might be correlated with ZDR above the melt-
ing level on this day, and thus in this case, ZDR may
better track the early updraft than KDP. Whether or not
this is the case, the fact that a lag in correlation between
KDP above the melting level and other observational
metrics is observed on this day, but not others, suggests
that this lag may be related to storm morphological and
microphysical properties unique to the 23 May case.
b. Statistical correlations
In order for meaningful comparison to be made be-
tween observations and simulations, aggregated statis-
tics of relationships between storm-relevant variables
should be employed. This reduces the effects of spatial
FEBRUARY 2016 VAN L I ER -WALQU I ET AL . 745
Unauthenticated | Downloaded 03/19/22 10:17 PM UTC

and temporal phase errors related to the timing and
propagation of the simulated storm system. We note,
however, that it is unreasonable to assume that a linear
correlation provides the best statistical analysis for re-
lationships that are undoubtedly nonlinear, and so
Spearman rank correlation coefficients r are shown to-
gether with Pearson correlation coefficients r.
Figure 8 shows volumes that exceed the
KDP . 0:758km21 threshold in a 2-km slab above the
melting level compared with similar volumes observed
FIG. 4. Analysis of polarimetric observations from the S-band Vance WSR-88D on
23 May 2011. (top) Area with KDP . 0:758 km21 at each level (filled colors), volume with
KDP . 0:758 km21 above themelting level (gray line), and themelting level (dotted line). (second
from top) As in (top), but for ZDR . 1 dB. (middle) Number of KDP columns detected (black)
and area of each column (red). (second from bottom)Maximumheight of theKDP . 0.758 km21
contour for each KDP column (colored histogram), median height (gray line), and melting level
(dotted line). (bottom) As in (second from bottom), except for the maximum height of the
ZDR . 1-dB contour for each KDP column. Domain is red circle in Fig. 1.
746 MONTHLY WEATHER REV IEW VOLUME 144
Unauthenticated | Downloaded 03/19/22 10:17 PM UTC

at low levels (a 2-km slab above the surface). The KDP
volume above the melting level can be considered a
KDP signal associated with deep convection updrafts,
whereas the low-level volume is more closely related to
convective rain rates. The two quantities plotted to-
gether thus provide a basis for insight into how much of
convective rainfall is associated with deep convection
updrafts, in essence providing a measure of convective
intensity at a given time as well as the likelihood of
mixed-phase processes in deep convection. In Fig. 8
these data are presented for each time observed using
the KVNX radar, with all plots sharing an axis ratio of
1:4.5 between KDP volume above the melting level and
KDP volume at low levels. In addition, data from each
day are scaled so that plots are directly comparable,
allowing for both comparison of ratio of low-level KDP
to high-level KDP as well as temporal evolution of that
ratio and low and high KDP volumes. In these figures,
points closer to the lower-right section of the plots can
be considered more closely associated with concurrent
deep convective updrafts than points closer to the
upper-left section.
Data from 25 April in Fig. 8 show a generally high
ratio of KDP at low level to KDP at high levels. This is in
keeping with other metrics such as lightning and updraft
mass flux that suggest that convection was weaker on
this day compared with others. On the other hand,
20 May displays great variability in this deep convection
KDP ratio, in agreement with conclusions from lightning
data as well asKDP column heights recorded at this time
(see online supplemental material time series plots S5–
S8 for details). Specifically, the relationship between
FIG. 5. Analysis of polarimetric observations from the C-SAPR radar on 23 May 2011. As in
Fig. 4, but with KDP volume threshold increased to 1.58 km21 and with ZDR analysis omitted,
owing to radar characteristics (see text). Domain is blue circle in Fig. 1.
FEBRUARY 2016 VAN L I ER -WALQU I ET AL . 747
Unauthenticated | Downloaded 03/19/22 10:17 PM UTC

low-level KDP and high-level KDP shows a stronger
deep convective updraft signature before 0730 UTC,
which is associated with the more intense lightning and
higher KDP columns observed during this time, associ-
ated with largely disorganized cellular and multicellu-
lar convection. This is in contrast to the strongly
organized convection of the trailing-stratiform MCS
that follows. Thus, in cases such as 20 May where
convective morphology changes so dramatically, KDP
volume alone is insufficient to characterize the in-
tensity of deep convection, although both the ratio of
high- and low-levelKDP signals as well as the heights of
KDP columns do provide some indication of these
changes. Also, 23 May features variability in the re-
lationship observed between high- and low-level KDP.
In this case, later cells appear to be more characteristic
of deep convective updrafts. Here 24 May features a
generally smaller ratio of KDP at low levels to KDP at
high levels, indicating consistent deep convective up-
drafts, in agreement with both lightning frequency and
updraft mass flux, which are the highest of the 4 days
considered. Later times show slightly increased deep
convection character as well as higher KDP columns
(see comparison inFig. 9), a shift that is contemporaneous
with the shift in storm morphology from supercellular
storms to an intense leading-stratiform squall line. It
bears noting that increased organization on this day is
associated with an increased intensity of KDP and light-
ningmetrics shown here—the opposite of the trend found
for 20 May.
Figure 9 shows KDP column heights as detected by
KVNX and C-SAPR for each of the 4 days investigated.
As previously discussed, results from KVNX suggest
that 24 May features the strongest convection of the
4 days, followed by 23 and 20 May and 25 April, in
roughly that order. Heights of KDP columns range from
just above the melting layer to 5 km above the melting
layer, in the case of some KDP columns detected on
24 May. The tails of these distributions are uncertain, as
beamwidth effects may result in significant exaggeration
of the maximum height of features far from the radar.
Assuming a simple linear model of resolution and un-
certainty error that increases with distance, cumulative
probability distributions of KDP column height were
calculated. The heights of the 10% (20%) probability
levels [i.e., 10% (20%) probability of a given column
height exceeding this value] are 5.7 (5.3) km for 25April,
7.3 (6.6) km for 20 May, 6.8 (6.3) km for 23 May, and
FIG. 6. As in Fig. 4, however (top) shows time–height histogram of lightning flash initiation
from the LMA (filled colors), together with time histogram of total flash rate (white line) and
median height of initiation (gray line). Domain is overlap of yellow and red circles in Fig. 1.
748 MONTHLY WEATHER REV IEW VOLUME 144
Unauthenticated | Downloaded 03/19/22 10:17 PM UTC

7.6 (7) km for 24 May. These values are suggested as
conservative estimates of maximum column heights re-
corded, given uncertainties caused by increased resolution
error with distance from the KVNX radar.
Results from C-SAPR (also shown in Fig. 9) match
KVNX results quite well despite differences in radar
domain and resolution. Modes of the KDP column
height distributions are generally in very good agree-
ment. The KDP column heights recorded in the KVNX
data for 20May suggest that the heights ofKDP columns
may vary significantly within the course of a day in
accordance to changing morphology and intensity of
convection. For example, in the case of 20 May, a de-
crease in both height and variability of KDP column
heights is related to a change from disorganized con-
vection cells to a trailing-stratiform MCS with gener-
ally less intense convection. On 24 May, a similar
organizational process occurs, with distinct super-
cellular storms merging into a leading-stratiform squall
line after 2230 UTC. In this case the change in storm
morphology to a linearly organized state is associated
with an increase in intensity of the metrics here asso-
ciated with deep convection.
Multi-Doppler wind retrieval-derived updraft mass
flux at the environmental 2108C level shows good
(r. 0:8) correlation with C-SAPR KDP volume above
the melting level for 25 April and 20 and 23 May
(Fig. 10). Here 24 May shows poor correlation, likely
attributable to issues with wind retrieval on this day,
including severe attenuation of X- and C-band radars
as well as problems with Doppler dealiasing. In some
cases, KDP is shown to correlate better with updraft
mass flux at different levels. For example, on 25April,KDP
volume is better correlated with updraft mass flux at
the2208 and2308C levels and on 20 May,KDP volume is
best correlated with updraft mass flux at the 08C level (see
Fig. 7 as well as Figs. S4, S8, and S12 in the online sup-
plemental material). We decline to offer a hypothesis on
this peculiarity, as a conclusive answer might require a
detailed analysis of uncertainties in the multi-Doppler
wind retrievals for each day studied, which is beyond the
scope of the current study.
The KDP volume above the melting level, as detected
by C-SAPR, is well correlated with intense surface rain
rates estimated via the R(A) method of Ryzhkov et al.
(2014) and Giangrande et al. (2014). These values are
shown together in Fig. 11. All days show correlation
coefficients of r . 0.75.
To investigate whether strong updrafts appear in the
vicinity of KDP columns, a joint histogram of KDP col-
umn heights as detected by the C-SAPR radar and
coincident maximum updraft speed, as retrieved by
multi-Doppler wind analysis, is shown in Fig. 12. Maxi-
mum retrieved updraft speed (w. 1m s21) is collected
in the 3D columnar region defined by the 2D KDP col-
umn object boundaries; KDP column height shows a
weak correlation (r 5 0.37) with multi-Doppler re-
trieved updraft speed. One hypothesis for this weak
FIG. 7. Updraft (w. 1m s21) mass flux at four levels from multi-Doppler wind retrieval,
KDP . 1.58 km21 volume above the melting level, and KDP ‘‘supercooled mass’’ from the C-
SAPR radar (see text) on 23 May 2011. Domain is black square in Fig. 1.
FEBRUARY 2016 VAN L I ER -WALQU I ET AL . 749
Unauthenticated | Downloaded 03/19/22 10:17 PM UTC

correlation is that true correlations between these
variables may occur with some spatial and temporal
lag. Loney et al. (2002), for example, noted that up-
drafts and the hydrometeors that produce KDP col-
umns are likely spatially distinct features, at least in
the absence of resolution-broadening of the KDP col-
umn. Furthermore, updrafts are likely to be tilted or even
helical depending on shear and storm helicity; these effects
are likely to impact the location and shape of polarimetric
features of deep convection updrafts (e.g., Kumjian and
Ryzhkov 2009). Amore robust approachmay be to search
for updrafts in the spatial region surrounding a KDP col-
umn or to analyze the full life cycle ofKDP columns from a
Lagrangian perspective. This last approach would also
reveal any correlations betweenKDP and updraft strength
that lag in time. A stronger correlation is observed be-
tweenKDP column area and maximum updraft speed, but
this may be partly explained by noting that no matter the
region chosen, larger areas are more likely to result in a
greater maximum updraft speed than smaller areas.
Each day featured widely varyingKDP column heights
as well as substantial variability inKDP volume, updraft,
and lightning statistics; however, common characteris-
tics can be identified for each day. Figure 13 shows a
clear relationship between KDP column height and KDP
column area for columns detected by KVNX. C-SAPR
results, also shown in Fig. 13, generally match these re-
sults, although column areas are not as great as in the
KVNX data, likely because the poorer resolution of the
KVNX data exaggerates column size and also results in
the apparent merging of columns. Spread in the joint
distribution of KDP column area and height can be ex-
plained either by resolution effects or variations in the
area–height relationship over the life cycle of a con-
vection cell or both. Evaluating this last possible
explanation requires analysis of the full life cycle of
convective cells in a Lagrangian framework.
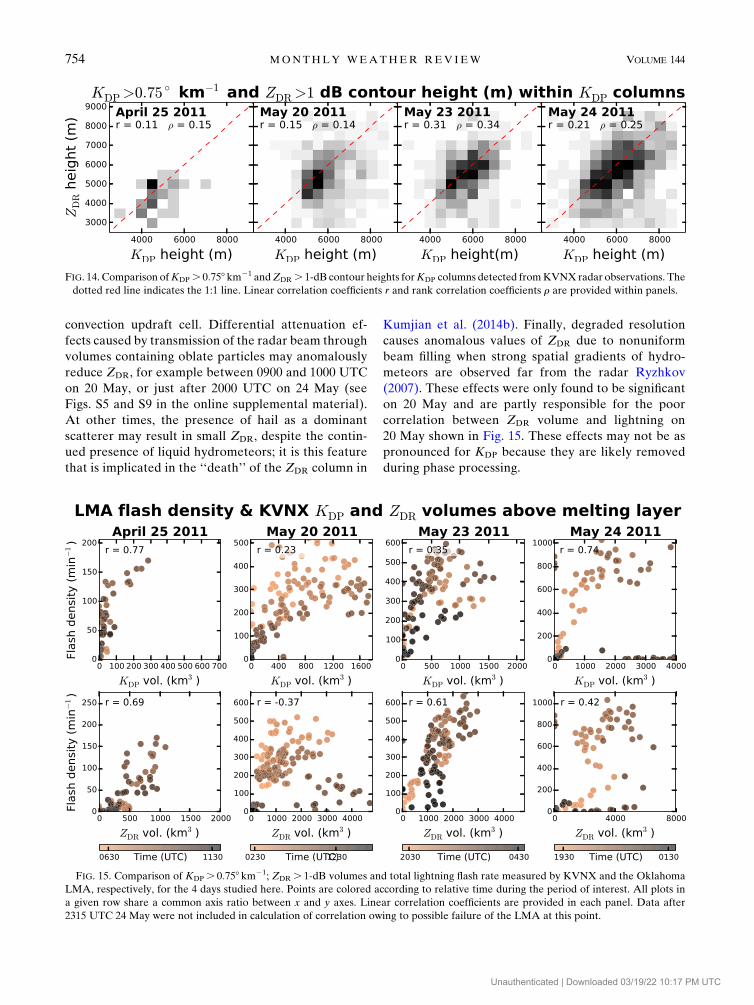
TheKDP column height is also correlated with height
of coincident ZDR features (Fig. 14). This correlation
indicates that when KDP columns are present, ZDR
columns also tend to be present; ZDR height tends to be
lower than KDP height partly from anomalous re-
duction of ZDR values from differential attenuation or
the presence of hail in the radar volume or both.
Analysis of KDP and ZDR volumes above the melting
level (see top two panels of Fig. 4) suggest that deep
convective signatures of KDP and ZDR evolve semi-
independently. As such, it is likely that the presence of
KDP and ZDR columns are not strictly contemporane-
ous or spatially collocated and one may draw similar
conclusions from previous studies (Loney et al. 2002;
Kumjian et al. 2014a).
Finally, the relationships between lightning total
flash rate and KDP and ZDR volumes are shown in
Fig. 15 to further explore the relationship between the
polarimetric signals associated with mixed-phase pro-
cesses in deep convection updrafts and lightning, a
phenomenon physically linked with such processes in
continental convection. For all 4 days, a positive cor-
relation is found between KDP volume above the
melting level and total flash density, though correlation
is only moderate and highly variable across the 4 days
studied (for an example of collocation of lightning
flashes and KDP columns; see Fig. S13 in the online
supplemental material). Interestingly, data from both
20 May during the disorganized phase of convection
before 0730 UTC and data from 23 May indicate a
lagged correlation (not shown) of approximately
r5 0:6 at 10-min lag (i.e., lightning peaks 10min after
KDP volume above the melting layer does, on average).
FIG. 8. Scatterplot of KDP . 0:758 km21 volume above the melting level and KDP . 0:758 km21 volume in the bottom two kilometers
above the surface. Colors indicate observation time, with darker colors indicating later observation times. Each plot is scaled identically,
with a ratio of 1:4.5 for the axes of KDP above the melting level and KDP at low levels, respectively. Because of this scaling, units are
not shown.
750 MONTHLY WEATHER REV IEW VOLUME 144
Unauthenticated | Downloaded 03/19/22 10:17 PM UTC

This lagged correlation underscores a need for treat-
ment of the full updraft life cycle in order to better
ascertain the relationships between lightning, KDP
above the melting level, and updraft strength. The ZDR
volume above the melting level also shows correlation
with flash rates on all days except 20 May, where
resolution effects produce anomalously large ZDR
volume above the melting layer. On 24 May, periods of
substantial differential attenuation and the possible
presence of hail in the radar volume results in many
samples with copious lightning flash activity but rela-
tively small ZDR volume above the melting level.
FIG. 9. Histogram of KDP column-top height as detected by (a) the KVNX radar and (b) the
C-SAPR radar for the 4 days of the study. Also shown as white and black lines in (a) are
subjectively selected subsamples of the full histogram to demonstrate nonstationarity of KDP
column height statistics.
FEBRUARY 2016 VAN L I ER -WALQU I ET AL . 751
Unauthenticated | Downloaded 03/19/22 10:17 PM UTC

4. Discussion
The strong link seen betweenKDP observed above the
melting level and updraft statistics in three out of four
cases supports our working hypothesis that KDP is a
useful proxy for deep convection updrafts. Detail of the
KDP signal also elucidates information relevant to
changing storm morphology and, likely, updraft micro-
physics. Lightning flash rates also show that KDP and
lightning flash activity do not always display a simple
covariance, and the relationship between these variables
may depend on the morphological characteristics of the
convection that produces them. For example, early dis-
organized convection cells on 20 May appear more
electrically active for a given KDP volume above the
melting level. This especially active period, in turn, oc-
curs at a time whenKDP volume above the melting level
is large relative to KDP volume at low levels, indicating
an increased deep convective character of the storm
system. This early phase of storm activity on 20May also
displays lagged correlations between KDP volume and
lightning flash activity. Similarly lagged relationships are
seen for observations on 23May but are not significantly
for 25 April or 24 May. We hypothesize that lagged
correlation occurs at the scale of individual updraft cells
and, thus, may not be evident in cases where many cells
exist at varying points in their life cycles. In cases such as
early 20May and throughout 23May, overall lag may be
evident by virtue of updraft cells with temporally corre-
lated life cycles. On 20 May it is unclear what causes this
correlation; however, on 23 May multiple convection cells
initiate almost simultaneously along a dryline, in compar-
ison with organized MCS squall lines occurring later on
20 May and late on 24 May that consist of many updraft
cells at different stages of their life cycles.
As previously mentioned, our results suggest that
analysis ofKDP columns above themelting level is useful
for characterizing deep convection. Height of KDP col-
umns, likely related to the life cycle of individual updraft
cells, reveal variability that tracks other metrics of storm
intensity, in particular on 20 and 24 May where partic-
ularly high KDP columns are observed when lightning
flash activity peaks, for example. Nevertheless, further
work is planned to better ascertain fundamental spatial
characteristics of KDP columns and other polarimetric
features of deep convection and are mentioned in the
conclusions. Perhaps unsurprisingly, we find that radar
resolution strongly affects measures of KDP columns.
For example, C-SAPR typically detects a greater num-
ber of smaller KDP columns than KVNX. These results
are also in agreement with results from Loney et al.
(2002), in which radar perception of a KDP column fails
to capture the finescale structure of hydrometeor fields
detected in situ.
It should be noted that ZDR sometimes shows good
agreement with lightning as well, such as for the storms
on 25 April and 23 May. In particular, ZDR above the
melting level may be better suited to revealing the early
appearance of deep convection than KDP above the
melting level. On 25 April and 23 and 24 May, ZDR
volume above the melting level increases to appreciable
values (approximately 100 km2) 30–60min before KDP
volume does. This earlier detectionmay result fromZDR
column producing convective updrafts that quickly
FIG. 11. C-SAPR KDP . 3:58 km21 volume above the melting
level vs domain-averaged rain rates for rain above 90mmh21,
derived using specific attenuation (Ryzhkov et al. 2014; Giangrande
et al. 2014). Domain is blue circle in Fig. 1.
FIG. 10. Updraft mass flux at 2108C from multi-Doppler wind
retrieval vs KDP . 1:58 km21 volume above the melting level. Do-
main is black square in Fig. 1. Colors as indicated in legend, where
linear correlation coefficients are also provided.
752 MONTHLY WEATHER REV IEW VOLUME 144
Unauthenticated | Downloaded 03/19/22 10:17 PM UTC

produce large raindrops in relatively low concentrations
through droplet recirculation pathways (Kumjian et al.
2014b). Considerable values of liquid water content that
might result in elevated KDP only occur later as the
microphysical processes that produce them become ac-
tive. These processes may include droplet shedding by
wet hail, as suggested by Hubbert et al. (1998), or the
formation of mixed-phase hydrometeors (e.g., small wet
hail), as suggested by Loney et al. (2002), or lofting of
supercooled rain produced by warm-rain processes.
Particularities endemic to the measurement of ZDR
present problems for its use inmapping the life cycle of a
FIG. 13. Comparison ofKDP . 0:758 km21 contour heights andKDP column areas forKDP columns detected by the (top) KVNX radar and
(bottom) C-SAPR radar. Linear r and rank r correlation coefficients provided within panels.
FIG. 12. (left) Joint histogram of KDP column-top height from the C-SAPR analysis and multi-Doppler-derived
maximum updraft speed detected within KDP column region. (right) Joint histogram of KDP column area from the
C-SAPR analysis and maximum updraft speed. Data aggregated from 25 Apr and 20, 23, and 24 May cases within
the domain of the multi-Doppler analysis. Linear correlation coefficients provided within panels.
FEBRUARY 2016 VAN L I ER -WALQU I ET AL . 753
Unauthenticated | Downloaded 03/19/22 10:17 PM UTC
convection updraft cell. Differential attenuation ef-
fects caused by transmission of the radar beam through
volumes containing oblate particles may anomalously
reduce ZDR, for example between 0900 and 1000 UTC
on 20 May, or just after 2000 UTC on 24 May (see
Figs. S5 and S9 in the online supplemental material).
At other times, the presence of hail as a dominant
scatterer may result in small ZDR, despite the contin-
ued presence of liquid hydrometeors; it is this feature
that is implicated in the ‘‘death’’ of the ZDR column in
Kumjian et al. (2014b). Finally, degraded resolution
causes anomalous values of ZDR due to nonuniform
beam filling when strong spatial gradients of hydro-
meteors are observed far from the radar Ryzhkov
(2007). These effects were only found to be significant
on 20 May and are partly responsible for the poor
correlation between ZDR volume and lightning on
20 May shown in Fig. 15. These effects may not be as
pronounced for KDP because they are likely removed
during phase processing.
FIG. 15. Comparison of KDP . 0:758 km21; ZDR . 1-dB volumes and total lightning flash rate measured by KVNX and the Oklahoma
LMA, respectively, for the 4 days studied here. Points are colored according to relative time during the period of interest. All plots in
a given row share a common axis ratio between x and y axes. Linear correlation coefficients are provided in each panel. Data after
2315 UTC 24 May were not included in calculation of correlation owing to possible failure of the LMA at this point.
FIG. 14. Comparison ofKDP . 0:758 km21 andZDR . 1-dB contour heights forKDP columns detected fromKVNX radar observations. The
dotted red line indicates the 1:1 line. Linear correlation coefficients r and rank correlation coefficients r are provided within panels.
754 MONTHLY WEATHER REV IEW VOLUME 144
Unauthenticated | Downloaded 03/19/22 10:17 PM UTC

Lagged correlations between KDP and both updraft
mass flux and lightning flash rates, observed primarily
early on 20 May and throughout 23 May strongly
suggest that correlations between KDP and other as-
pects of deep convective storm activity occur on the
life cycle of an updraft cell rather than the life cycle
of a storm system, which may comprise many con-
vective updrafts in various stages of maturity. Storm-
wide analysis may serve to underestimate these
relationships, as multiple updraft cells may be present
at differing stages of their life cycles. Cell tracking
may allow a more complete characterization of KDP
as a signal of deep convection updrafts. We hypothe-
size that only by tracking individual updraft cells
within larger storm systems can definitive answers be
found concerning the variability of KDP columns
within a single storm system as well as between dif-
ferent storm systems. Future work will investigate
these ideas, with detailed comparison between mod-
eled and observed updraft cells.
5. Conclusions
In this study observations by C- and S-band polari-
metric radars of four storm systems during the MC3E
field campaign were analyzed to investigate the char-
acteristics of enhanced positive specific differential
phase (KDP) above the melting level to motivate its use
as an observational metric of deep convection updraft
properties. The volume above the melting level where
KDP . 0:758km21 and KDP . 1:58km21 from KVNX
and C-SAPR radars, respectively, were recorded. In
addition, KDP columns thought to be proxies for deep
convection updraft were identified. These data were
then statistically compared with lightning flash activity,
ZDR fromKVNX,precipitationestimates from theC-SAPR
radar, and updrafts retrieved using two X-band radars
and the C-SAPR radar.
The KDP volume was found to correlate well with
retrieved updraft mass flux in three out of four cases,
with some evidence that KDP lags peak updraft
mass flux by approximately 14min; KDP volume also
shows a strong relationship with flash rate. Here again
there is some indication that lightning flash rates may
lag KDP volume by approximately 10min. The KDP
column heights were shown to be variable between
days studied and also show variability within a single
day, in accordance with changes in storm morphology.
Despite this, consistent statistical relationships are
seen between KDP column height and column hori-
zontal area. Intense rain rates (above 90mmh21)
correlate well with KDP volume, in contrast to more
moderate convective rain rates (above 40mmh21).
This difference indicates that KDP is best correlated
with especially intense convection and may not track
moderate deep convection activity as well. Finally,
ZDR volume shows similar correlations as KDP, with
ZDR at times a better indicator of the early stages of
deep convection, as well as more moderate convec-
tion. Conversely, when convection is more intense,
ZDR may suffer from artifacts related to differential
attenuation and other factors. These findings suggest
the combined use of ZDR and KDP columns to char-
acterize deep convection updrafts.
Loney et al. (2002) note that significant radar resolu-
tion degradation may preclude the use of KDP and ZDR
to ascertain the structure of hydrometeor fields. Com-
parison betweenKDP columns detected by C-SAPR and
KVNX further support this result and suggest that
NEXRAD radars may be inappropriate for determining
fundamental scales of such features because of in-
adequate range resolution. Work has begun comparing
the spatial statistics of polarimetric radar features ob-
served at varying radar resolutions alongside high-
resolution modeled simulations of deep convection in
order to answer questions such as the following: What is
the fundamental size of a KDP or ZDR column? How
closely are these columns spaced from one another?
What is the variability of these metrics between and
within storm systems? How do characteristics of simu-
lated updrafts and forward-modeled polarimetric prop-
erties compare with those observed?
Acknowledgments. This research was supported by
the Office of Science (BER), U.S. Department of En-
ergy, Award DE-SC0006988. MC3E data were obtained
from the Atmospheric Radiation Measurement (ARM)
Program sponsored by the U.S. Department of Energy,
Office of Science, Office of Biological and Environ-
mental Research, Climate and Environmental Sciences
Division. Argonne National Laboratory’s work was
supported by the U.S. Department of Energy, Office of
Science, Office of Biological and Environmental Re-
search, under Contract DE-AC02-06CH11357. This
work has been supported by the Office of Biological and
Environmental Research (OBER) of the U.S. De-
partment of Energy (DOE) as part of the ARM Pro-
gram. The authors thank Scott Giangrande, Alexander
Ryzhkov, and Matthew Kumjian for helpful discussions
during preparation of this manuscript.
REFERENCES
Ackerman, T. P., and G. M. Stokes, 2003: The Atmospheric Ra-
diation Measurement Program. Phys. Today, 56, 38–44,
doi:10.1063/1.1554135.
FEBRUARY 2016 VAN L I ER -WALQU I ET AL . 755
Unauthenticated | Downloaded 03/19/22 10:17 PM UTC

Anderson, N. F., C. A. Grainger, and J. L. Stith, 2005: Character-
istics of strong updrafts in precipitation systems over the
central tropical Pacific Ocean and in the Amazon. J. Appl.
Meteor., 44, 731–738, doi:10.1175/JAM2231.1.
Aydin, K., and V. Giridhar, 1992: C-band dual-polarization radar
observables in rain. J. Atmos. Oceanic Technol., 9, 383–390,
doi:10.1175/1520-0426(1992)009,0383:CBDPRO.2.0.CO;2.
——, Y. Zhao, and T. A. Seliga, 1989: Rain-induced attenuation ef-
fects on C-band dual-polarization meteorological radars. IEEE
Trans. Geosci. Remote Sens., 27, 57–66, doi:10.1109/36.20275.
Barnes, S. L., 1964: A technique for maximizing details in numer-
ical weather map analysis. J. Appl. Meteor., 3, 396–409,
doi:10.1175/1520-0450(1964)003,0396:ATFMDI.2.0.CO;2.
Biggerstaff, M. I., and R. A. Houze, 1991: Kinematic and pre-
cipitation structure of the 10–11 June 1985 squall line.Mon.Wea.
Rev., 119, 3034–3065, doi:10.1175/1520-0493(1991)119,3034:
KAPSOT.2.0.CO;2.
Blossey, P. N., C. S. Bretherton, J. Cetrone, andM.Kharoutdinov,
2007: Cloud-resolving model simulations of KWAJEX:
Model sensitivities and comparisons with satellite and radar
observations. J. Atmos. Sci., 64, 1488–1508, doi:10.1175/
JAS3982.1.
Braun, S. A., M. T. Montgomery, K. J. Mallen, and P. D. Reasor,
2010: Simulation and interpretation of the genesis of Tropical
Storm Gert (2005) as part of the NASA Tropical Cloud Sys-
tems and Processes experiment. J. Atmos. Sci., 67, 999–1025,
doi:10.1175/2009JAS3140.1.
Bringi, V. N., and V. Chandrasekar, 2001: Polarimetric Doppler
Weather Radar: Principles and Applications. Cambridge Uni-
versity Press, 664 pp.
——, D. A. Burrows, and S. M. Menon, 1991: Multiparameter ra-
dar and aircraft study of raindrop spectral evolution in warm-
based clouds. J. Appl. Meteor., 30, 853–880, doi:10.1175/
1520-0450(1991)030,0853:MRAASO.2.0.CO;2.
——, L. Liu, P. C. Kennedy, V. Chandrasekar, and S. A. Rutledge,
1996: Dual multiparameter radar observations of intense
convective storms: The 24 June 1992 case study. Meteor. At-
mos. Phys., 59, 3–31, doi:10.1007/BF01031999.
Bruning, E. C., W. D. Rust, T. J. Schuur, D. R. MacGorman, P. R.
Krehbiel, and W. Rison, 2007: Electrical and polarimetric ra-
dar observations of a multicell storm in TELEX. Mon. Wea.
Rev., 135, 2525–2544, doi:10.1175/MWR3421.1.
Calhoun, K. M., D. R. MacGorman, C. L. Ziegler, and M. I.
Biggerstaff, 2013: Evolution of lightning activity and storm
charge relative to dual-Doppler analysis of a high-precipitation
supercell storm. Mon. Wea. Rev., 141, 2199–2223, doi:10.1175/
MWR-D-12-00258.1.
Caniaux, G., J.-P. Lafore, and J.-L. Redelsperger, 1995: A nu-
merical study of the stratiform region of a fast-moving squall
line. Part II: Relationship between mass, pressure, and mo-
mentum fields. J. Atmos. Sci., 52, 331–352, doi:10.1175/
1520-0469(1995)052,0331:ANSOTS.2.0.CO;2.
Carey, L. D., and S. A. Rutledge, 1998: Electrical and multipa-
rameter radar observations of a severe hailstorm. J. Geophys.
Res., 103, 13 979–14 000, doi:10.1029/97JD02626.
——,——,D. A. Ahijevych, and T. D. Keenan, 2000: Correcting
propagation effects in C-band polarimetric radar observa-
tions of tropical convection using differential propaga-
tion phase. J. Appl. Meteor., 39, 1405–1433, doi:10.1175/
1520-0450(2000)039,1405:CPEICB.2.0.CO;2.
Cifelli, R., and V. Chandrasekar, 2010: Dual-polarization radar
rainfall estimation. Rainfall: State of the Science, F. Y. Testik
andM. Gebremichael, Eds., Amer. Geophys. Union, 105–125.
Collis, S., A. Protat, and K.-S. Chung, 2010: The effect of radial
velocity gridding artifacts on variationally retrieved vertical
velocities. J.Atmos.OceanicTechnol., 27, 1239–1246, doi:10.1175/
2010JTECHA1402.1.
——, ——, P. T. May, and C. Williams, 2013: Statistics of storm
updraft velocities from TWP-ICE including verification with
profiling measurements. J. Appl. Meteor. Climatol., 52, 1909–
1922, doi:10.1175/JAMC-D-12-0230.1.
Deierling, W., andW. A. Petersen, 2008: Total lightning activity as
an indicator of updraft characteristics. J. Geophys. Res., 113,
D16210, doi:10.1029/2007JD009598.
Doviak, R. J., and D. S. Zrnic, 1993: Doppler Radar and Weather
Observations. Courier Dover Publications, 562 pp.
Fridlind, A. M., and Coauthors, 2012: A comparison of TWP-ICE
observational data with cloud-resolving model results.
J. Geophys. Res., 117, D05204, doi:10.1029/2011JD016595.
Giangrande, S. E., R. McGraw, and L. Lei, 2013: An application of
linear programming to polarimetric radar differential phase
processing. J. Atmos. Oceanic Technol., 30, 1716–1729,
doi:10.1175/JTECH-D-12-00147.1.
——, S. Collis, A. K. Theisen, and A. Tokay, 2014: Precipitation
estimation from the ARM distributed radar network during
the MC3E campaign. J. Appl. Meteor. Climatol., 53, 2130–
2147, doi:10.1175/JAMC-D-13-0321.1.
Gray, M. E. B., 2000: Characteristics of numerically simulated
mesoscale convective systems and their application to pa-
rameterization. J. Atmos. Sci., 57, 3953–3970, doi:10.1175/
1520-0469(2001)058,3953:CONSMC.2.0.CO;2.
Griffin, E. M., T. J. Schuur, D. R. MacGorman, M. R. Kumjian,
and A. O. Fierro, 2014: An electrical and polarimetric
analysis of the overland reintensification of Tropical Storm
Erin (2007). Mon. Wea. Rev., 142, 2321–2344, doi:10.1175/
MWR-D-13-00360.1.
Heistermann, M., and Coauthors, 2015: The emergence of open-
source software for the weather radar community.Bull. Amer.
Meteor. Soc., 96, 117–128, doi:10.1175/BAMS-D-13-00240.1.
Heymsfield, A. J., A. Bansemer, P. R. Field, S. L. Durden, J. L.
Stith, J. E. Dye, W. Hall, and C. A. Grainger, 2002: Ob-
servations and parameterizations of particle size distribu-
tions in deep tropical cirrus and stratiform precipitating
clouds: Results from in situ observations in TRMM field
campaigns. J. Atmos. Sci., 59, 3457–3491, doi:10.1175/
1520-0469(2002)059,3457:OAPOPS.2.0.CO;2.
Homeyer, C. R., and M. R. Kumjian, 2015: Microphysical charac-
teristics of overshooting convection from polarimetric radar
observations. J. Atmos. Sci., 72, 870–891, doi:10.1175/
JAS-D-13-0388.1.
Hubbert, J., V. N. Bringi, L. D. Carey, and S. Bolan, 1998: CSU-
CHILL polarimetric radar measurements from a severe hail
storm in eastern Colorado. J. Appl. Meteor., 37, 749–775,
doi:10.1175/1520-0450(1998)037,0749:CCPRMF.2.0.CO;2.
——, S. M. Ellis, W.-Y. Chang, and Y.-C. Liou, 2014: X-band po-
larimetric observations of cross coupling in the ice phase of
convective storms in Taiwan. J. Appl. Meteor. Climatol., 53,
1678–1695, doi:10.1175/JAMC-D-13-0360.1.
Jayaratne, E., C. Saunders, and J. Hallett, 1983: Laboratory studies
of the charging of soft-hail during ice crystal interactions.
Quart. J. Roy. Meteor. Soc., 109, 609–630, doi:10.1002/
qj.49710946111.
Kumjian, M. R., 2013: Principles and applications of dual-
polarization weather radar. Part I: Description of the polari-
metric radar variables. J.Oper.Meteor., 1, 226–242, doi:10.15191/
nwajom.2013.0119.
756 MONTHLY WEATHER REV IEW VOLUME 144
Unauthenticated | Downloaded 03/19/22 10:17 PM UTC

——, and A. V. Ryzhkov, 2009: Storm-relative helicity revealed
frompolarimetric radarmeasurements. J. Atmos. Sci., 66, 667–
685, doi:10.1175/2008JAS2815.1.
——, A. P. Khain, N. Benmoshe, E. Ilotoviz, A. V. Ryzhkov, and
V. T. J. Phillips, 2014a: The anatomy and physics of zDR col-
umns: Investigating a polarimetric radar signature with a
spectral bin microphysics model. J. Appl. Meteor. Climatol.,
53, 1820–1843, doi:10.1175/JAMC-D-13-0354.1.
——, S. A. Rutledge, R. M. Rasmussen, P. C. Kennedy, and
M. Dixon, 2014b: High-resolution polarimetric radar obser-
vations of snow-generating cells. J. Appl. Meteor. Climatol.,
53, 1636–1658, doi:10.1175/JAMC-D-13-0312.1.
Lang, S., W.-K. Tao, J. Simpson, and B. Ferrier, 2003: Modeling of
convective–stratiform precipitation processes: Sensitivity to
partitioning methods. J. Appl. Meteor., 42, 505–527,
doi:10.1175/1520-0450(2003)042,0505:MOCSPP.2.0.CO;2.
——, ——, X. Zeng, and Y. Li, 2011: Reducing the biases in sim-
ulated radar reflectivities from a bulk microphysics scheme:
Tropical convective systems. J. Atmos. Sci., 68, 2306–2320,
doi:10.1175/JAS-D-10-05000.1.
Lang, T. J., and S. A. Rutledge, 2002: Relationships between con-
vective storm kinematics, precipitation, and lightning. Mon.
Wea. Rev., 130, 2492–2506, doi:10.1175/1520-0493(2002)130,2492:
RBCSKP.2.0.CO;2.
Lawson, R. P., E. Jensen, D. L. Mitchell, B. Baker, Q. Mo, and
B. Pilson, 2010: Microphysical and radiative properties of
tropical clouds investigated in TC4 andNAMMA. J. Geophys.
Res., 115, D00J08, doi:10.1029/2009JD013017.
Levin, Z., and W. R. Cotton, Eds., 2008: Aerosol Pollution Impact
on Precipitation: A Scientific Review. Springer, 386 pp.
Loney, M. L., D. S. Zrnic, J. M. Straka, and A. V. Ryzhkov, 2002:
Enhanced polarimetric radar signatures above the melting
level in a supercell storm. J. Appl. Meteor., 41, 1179–1194,
doi:10.1175/1520-0450(2002)041,1179:EPRSAT.2.0.CO;2.
Lund, N. R., D. R.MacGorman, T. J. Schuur,M. I. Biggerstaff, and
W. D. Rust, 2009: Relationships between lightning location
and polarimetric radar signatures in a small mesoscale con-
vective system. Mon. Wea. Rev., 137, 4151–4170, doi:10.1175/
2009MWR2860.1.
MacGorman, D. R., and Coauthors, 2008: TELEX: The
Thunderstorm Electrification and Lightning Experiment.
Bull. Amer. Meteor. Soc., 89, 997–1013, doi:10.1175/
2007BAMS2352.1.
Mather, J. H., and J. W. Voyles, 2013: TheARMClimate Research
Facility: A review of structure and capabilities. Bull. Amer.
Meteor. Soc., 94, 377–392, doi:10.1175/BAMS-D-11-00218.1.
Matsui, T., X. Zeng, W.-K. Tao, H. Masunaga, W. S. Olson, and
S. Lang, 2009: Evaluation of long-term cloud-resolving model
simulations using satellite radiance observations and multi-
frequency satellite simulators. J. Atmos. Oceanic Technol., 26,
1261–1274, doi:10.1175/2008JTECHA1168.1.
——, W.-K. Tao, S. J. Munchak, M. Grecu, and G. J. Huffman,
2015: Satellite view of quasi-equilibrium states in tropical
convection and precipitation microphysics. Geophys. Res.
Lett., 42, 1959–1968, doi:10.1002/2015GL063261.
Mechem, D. B., S. S. Chen, and R. A. Houze, 2006: Momentum
transport processes in the stratiform regions of mesoscale
convective systems over the western Pacific warm pool.Quart.
J. Roy. Meteor. Soc., 132, 709–736, doi:10.1256/qj.04.141.
Mrowiec, A. A., O. M. Pauluis, A. M. Fridlind, and A. S.
Ackerman, 2015: Properties of a mesoscale convective system
in the context of an isentropic analysis. J. Atmos. Sci., 72,
1945–1962, doi:10.1175/JAS-D-14-0139.1.
North, K. W., 2016: Kinematic retrievals in deep convective clouds
from a network of scanning Doppler radars in Oklahoma
during MC3E. M.S. thesis, McGill University, Montreal,
Quebec, Canada.
Parker, M. D., and R. H. Johnson, 2000: Organizational modes
of midlatitude mesoscale convective systems. Mon. Wea.
Rev., 128, 3413–3436, doi:10.1175/1520-0493(2001)129,3413:
OMOMMC.2.0.CO;2.
Payne, C. D., T. J. Schuur, D. R. MacGorman, M. I. Biggerstaff,
K. M. Kuhlman, and W. D. Rust, 2010: Polarimetric and
electrical characteristics of a lightning ring in a supercell
storm. Mon. Wea. Rev., 138, 2405–2425, doi:10.1175/
2009MWR3210.1.
Pereyra, R. G., E. E. Avila, N. E. Castellano, and C. P. Saunders,
2000: A laboratory study of graupel charging. J. Geophys. Res.,
105, 20 803–20 812, doi:10.1029/2000JD900244.
Reynolds, S., M. Brook, and M. F. Gourley, 1957: Thunderstorm
charge separation. J. Meteor., 14, 426–436, doi:10.1175/
1520-0469(1957)014,0426:TCS.2.0.CO;2.
Roerdink, J. B. T. M., and A. Meijster, 2001: The watershed
transform: Definitions, algorithms and parallelization strate-
gies. Fundamenta Informaticae, 41, 187–228.
Ryzhkov, A. V., 2007: The impact of beam broadening on the
quality of radar polarimetric data. J. Atmos. Oceanic Technol.,
24, 729–744, doi:10.1175/JTECH2003.1.
——, and D. S. Zrnic, 1996: Assessment of rainfall measure-
ment that uses specific differential phase. J. Appl. Meteor.,
35, 2080–2090, doi:10.1175/1520-0450(1996)035,2080:
AORMTU.2.0.CO;2.
——, M. Diederich, P. Zhang, and C. Simmer, 2014: Potential
utilization of specific attenuation for rainfall estimation, mit-
igation of partial beam blockage, and radar networking.
J. Atmos. Oceanic Technol., 31, 599–619, doi:10.1175/
JTECH-D-13-00038.1.
Sachidananda, M., and D. S. Zrnic, 1986: Differential propagation
phase shift and rainfall rate estimation. Radio Sci., 21, 235–
247, doi:10.1029/RS021i002p00235.
Shi, J. J., and Coauthors, 2010: WRF simulations of the 20–
22 January 2007 snow events over eastern Canada: Compari-
son with in situ and satellite observations. J. Appl. Meteor.
Climatol., 49, 2246–2266, doi:10.1175/2010JAMC2282.1.
Steiner, M., and J. A. Smith, 1998: Convective versus stratiform
rainfall: An ice-microphysical and kinematic conceptual model.
Atmos.Res., 47–48, 317–326, doi:10.1016/S0169-8095(97)00086-0.Stith, J. L., J. E. Dye, A. Bansemer, A. J. Heymsfield, C. A. Grainger,
W. A. Petersen, and R. Cifelli, 2002: Microphysical observations
of tropical clouds. J. Appl. Meteor., 41, 97–117, doi:10.1175/
1520-0450(2002)041,0097:MOOTC.2.0.CO;2.
——, J. A. Haggerty, A. Heymsfield, and C. A. Grainger, 2004:
Microphysical characteristics of tropical updrafts in clean con-
ditions. J. Appl. Meteor., 43, 779–794, doi:10.1175/2104.1.——,——, C.Grainger, andA.Detwiler, 2006: A comparison of the
microphysical and kinematic characteristics of mid-latitude and
tropical convective updrafts and downdrafts. Atmos. Res., 82
(1–2), 350–366, doi:10.1016/j.atmosres.2005.12.008.
Takahashi, T., 1978: Riming electrification as a charge generation
mechanism in thunderstorms. J. Atmos. Sci., 35, 1536–1548,
doi:10.1175/1520-0469(1978)035,1536:REAACG.2.0.CO;2.
Tao,W.-K., J.-P. Chen, Z. Li, C.Wang, and C. Zhang, 2012: Impact
of aerosols on convective clouds and precipitation. Rev. Geo-
phys., 50, RG2001, doi:10.1029/2011RG000369.
——, and Coauthors, 2014: The Goddard Cumulus Ensemble
model (GCE): Improvements and applications for studying
FEBRUARY 2016 VAN L I ER -WALQU I ET AL . 757
Unauthenticated | Downloaded 03/19/22 10:17 PM UTC

precipitation processes. Atmos. Res., 143, 392–424, doi:10.1016/
j.atmosres.2014.03.005.
Tessendorf, S. A., L. J. Miller, K. C. Wiens, and S. A. Rutledge,
2005: The 29 June 2000 supercell observed during STEPS. Part
I: Kinematics and microphysics. J. Atmos. Sci., 62, 4127–4150,
doi:10.1175/JAS3585.1.
——, S. A. Rutledge, and K. C. Wiens, 2007a: Radar and lighting
observations of normal and inverted polarity multicellular
storms from steps. Mon. Wea. Rev., 135, 3682–3706,
doi:10.1175/2007MWR1954.1.
——, K. C. Wiens, and S. A. Rutledge, 2007b: Radar and lighting
observations of the 3 June 2000 electrically inverted storm
from STEPS. Mon. Wea. Rev., 135, 3665–3681, doi:10.1175/
2006MWR1953.1.
Thomas, R. J., P. R. Krehbiel, W. Rison, S. J. Hunyady, W. P.
Winn, T. Hamlin, and J. Harlin, 2004: Accuracy of the light-
ning mapping array. J. Geophys. Res., 109, D14207,
doi:10.1029/2004JD004549.
Trapp, R. J., and C. A. Doswell III, 2000: Radar data objective
analysis. J. Atmos. Oceanic Technol., 17, 105–120, doi:10.1175/
1520-0426(2000)017,0105:RDOA.2.0.CO;2.
Varble, A., and Coauthors, 2011: Evaluation of cloud-resolving
model intercomparison simulations using TWP-ICE
observations: Precipitation and cloud structure. J. Geophys. Res.,
116, D12206, doi:10.1029/2010JD015180.
——, and Coauthors, 2014a: Evaluation of cloud-resolving and
limited area model intercomparison simulations using TWP-
ICE observations: 1. Deep convective updraft properties.
J. Geophys. Res. Atmos., 119, 13 891–13 918, doi:10.1002/
2013JD021371.
——, and Coauthors, 2014b: Evaluation of cloud-resolving and
limited area model intercomparison simulations using
TWP-ICE observations: 2. Precipitation microphysics.
J. Geophys. Res. Atmos., 119, 13 919–13 945, doi:10.1002/
2013JD021372.
Wiens, K. C., S. A. Rutledge, and S. A. Tessendorf, 2005: The
29 June 2000 supercell observed during STEPS. Part II:
Lightning and charge structure. J. Atmos. Sci., 62, 4151–4177,
doi:10.1175/JAS3615.1.
Zeng, X., W.-K. Tao, S. W. Powell, R. A. Houze, P. Ciesielski,
N. Guy, H. Pierce, and T. Matsui, 2013: A comparison of the
water budgets between clouds from AMMA and TWP-ICE.
J. Atmos. Sci., 70, 487–503, doi:10.1175/JAS-D-12-050.1.
Zhu, P., and Coauthors, 2012: A limited area model (LAM) in-
tercomparison study of a TWP-ICE active monsoon meso-
scale convective event. J. Geophys. Res., 117, D11208,
doi:10.1029/2011JD016447.
Zrnic, D. S., and A. V. Ryzhkov, 1999: Polarimetry for weather
surveillance radars. Bull. Amer. Meteor. Soc., 80, 389–406,
doi:10.1175/1520-0477(1999)080,0389:PFWSR.2.0.CO;2.
758 MONTHLY WEATHER REV IEW VOLUME 144
Unauthenticated | Downloaded 03/19/22 10:17 PM UTC