Embed Size (px)
Citation preview

®
annual report 2017
KaTanA
IMMERSIVE AUDIO FOR
ON PC AND TV
GAMES MUSICMOVIES
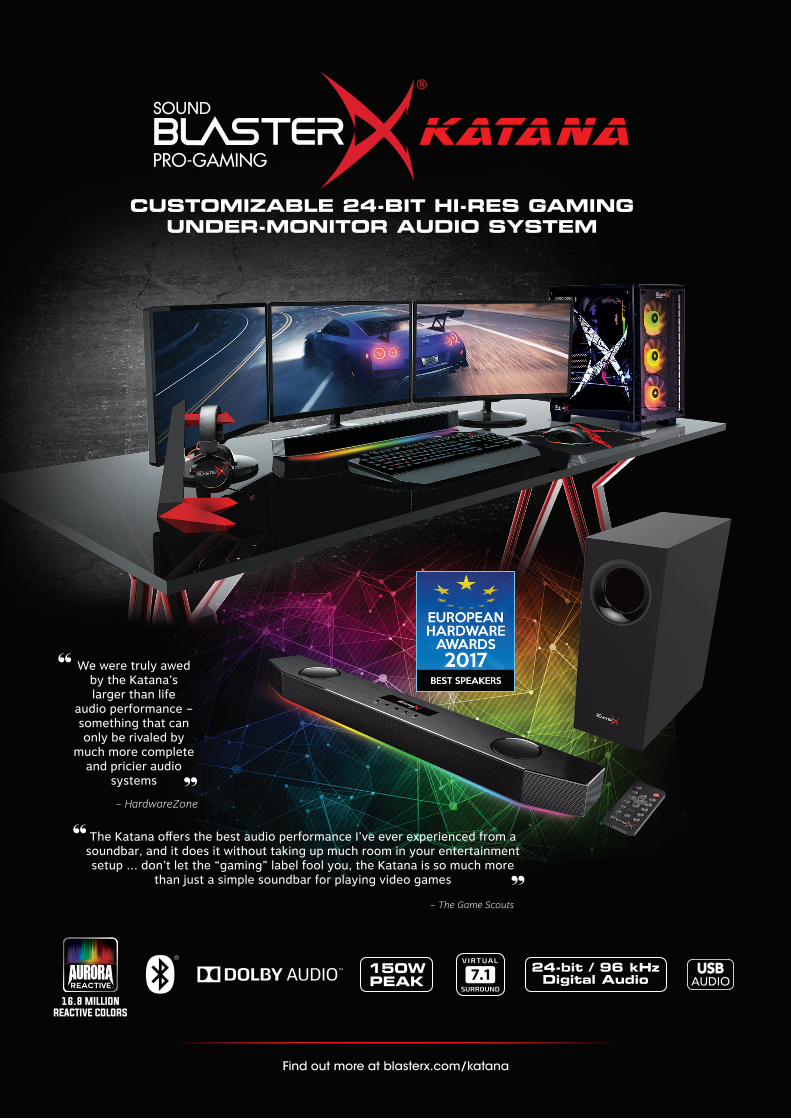
Find out more at blasterx.com/katana
customizable 24-bit hi-res gaming under-monitor audio system
KaTanA
16.8 MIllION REACTIVE COlORS
150WPeaK
We were truly awed by the Katana’s larger than life
audio performance – something that can only be rivaled by
much more complete and pricier audio
systems
The Katana offers the best audio performance I’ve ever experienced from a soundbar, and it does it without taking up much room in your entertainment setup ... don’t let the “gaming” label fool you, the Katana is so much more
than just a simple soundbar for playing video games
- HardwareZone
- The Game Scouts
“
“
“
“

1
Chairman’s Message 2
Financial Highlights and Review 3
Board of Directors and Executive Officers 5
Corporate Governance 6
Directors’ Statement 15
Independent Auditor’s Report 19
Consolidated Income Statement 22
Consolidated Statement of Comprehensive Income 23
Balance Sheets 24
Consolidated Statement of Changes in Equity 25
Consolidated Statement of Cash Flows 26
Notes to the Financial Statements 27
SGX-ST Listing Manual Requirements 66
CONTENTS

2
CREATIVE TECHNOLOGY LTD AND ITS SUBSIDIARIES
For the financial year ended 30 June 2017CHAIRMAN’S MESSAGE
Dear Shareholders,
For fiscal year 2017, the financial performance for the Group continued to be adversely affected by the difficult and uncertain market conditions for the Group’s products. Sales for the Group declined further as revenue contributions from new products during the year were not sufficient to offset the decline in sales resulting from the challenging market conditions. Sales were also affected by the delay in shipment of a new major product during the year.
Sales for fiscal year 2017 were US$70 million compared to US$85 million for fiscal year 2016. Gross profit as a percentage of sales was 28% in fiscal 2017 compared to 27% in fiscal 2016. While sales were lower in fiscal 2017, there was an improvement in operating results for the Group, due mainly to the higher gross profit margin and lower operating expenses for the year. Net loss for fiscal 2017 was US$23 million, compared to a net profit of US$3 million in fiscal 2016. Net results for the previous year was a profit as it included the contribution from higher other gains, comprising mainly US$34 million from settlements in a patent lawsuit. Further highlights of the Group’s financial performance are detailed in the “Financial Highlights and Review” section of the annual report.
During the year, we have continued with the development and introduction of new products in key product categories. Products launched during the year include the Sound BlasterX AE-5, a new advanced sound card, the Creative Outlier Sports, a high quality sweatproof wireless in-ear headphone, the Creative iRoar Go, a product in the Roar family of portable Bluetooth wireless speakers, and the Sound BlasterX Katana, a member of the Sound BlasterX family of speakers under the Sound BlasterX Pro-Gaming Series (a new line of high-end gaming audio peripherals for gaming enthusiasts and pro-gamers). The Sound BlasterX AE-5 is a SABRE32 Ultra Class Hi-Resolution PCIe Gaming Sound Card and DAC, which features a high-performance gaming headphone amplifier for PCs, custom-built to deliver pristine audio fidelity. The Sound BlasterX Katana, the flagship product in the family of Sound BlasterX speakers, is an all-in-one 24-bit Under-Monitor Audio System which utilizes Creative’s most powerful multi-core audio DSP and can also operate as a Sound Blaster sound card.
And finally, we have our flagship offering, the X-Fi Sonic Carrier. The Sonic Carrier which personifies the Audio of Tomorrow, is a powerful home entertainment system with Dolby Atmos and Creative‘s proprietary SuperWide X-Fi, giving users the best of the two worlds of Super High-end Audio and 3D Cinematic Sound. This mind-blowing system is set to revolutionize how users experience their audio with the ultimate immersive cinematic sound experience. It is like bringing the cinema to your home.
Since its inception in prototype form at CES 2016, it has consistently garnered rave reviews from both lay persons and industry insiders alike. We’ve marketed this in a kick-starter style programme, which has been oversubscribed, with pre-orders paid in full. Over the last year, we have been putting the finishing touches to the Sonic Carrier and have introduced a slew of improvements, including Creative’s very own SuperWide X-Fi. This technology enables listeners to experience a whole new dimension in music listening, way beyond a high-end stereo system. We believe that this will be the way people will want to listen to music in the future.
The Sonic Carrier has also just picked-up an award from CEDIA 2017 held at the San Diego Convention Centre. The occasion brought together more than 20,000 home tech pros and 500+ exhibitors to the leading event in smart and home technology. We were thrilled by the response the Sonic Carrier received from participants at the event. Many were blown away by the sheer power, fidelity, and 3D immersive cinematic audio delivered by the Sonic Carrier. Mark Henninger, Senior Editor of the respected AVS Forum – the go-to forum for members of the professional audio community made a last-minute unplanned visit to our booth at CEDIA. Sonic Carrier impressed him so much that it won an AVS Forum Best of CEDIA 2017 award. Here are excerpts from his review of the Sonic Carrier:
“The quality of the holographic surround-sound the Creative X-Fi Sonic Carrier puts out is something I have not heard before from any soundbar. Oh, and the subwoofer. Wow. That’s easily the best wireless soundbar sub I have ever heard.”
“With no walls and no ceiling, just a noisy open convention center, the X-Fi Sonic Carrier still created a 3D immersive audio experience. For real. I challenge anyone who ever encounters a similar demo to take it and tell me otherwise. My mind was completely blown, Creative has delivered sonic holography in a 2-piece solution so advanced… I love to get a taste of the future, and this thing is undeniably futuristic.”
This game-changing product is a huge investment for Creative, and we expect to commence shipment soon. While optimistic, as a big-ticket item in a totally new category, the Sonic Carrier may take some time to realize its full potential.
Looking ahead, for the current fiscal year, the Group expects no significant change in the uncertain and challenging market conditions. However, the potential revenue growth opportunities provided by the new products, including the Sonic Carrier, is expected to help the Group work towards an improvement in financial performance for the year.
Sim Wong HooChairman & Chief Executive Officer

3
CREATIVE TECHNOLOGY LTD AND ITS SUBSIDIARIES
Overview US$million
2017 2016
Sales, net 69.9 84.6 Gross profit 19.6 23.0 Gross profit margin 28% 27% Expenses 42.5 52.1 Net (loss) profit (22.9) 2.7 Sales for the financial year ended 30 June 2017 (“FY2017”) were US$69.9 million compared to US$84.6 million for the
financial year ended 30 June 2016 (“FY2016”). Gross profit in FY2017 was US$19.6 million at a margin of 28% compared to US$23.0 million at a margin of 27% in FY2016. Net loss in FY2017 was US$22.9 million compared to net profit of US$2.7 million in FY2016.
Sales
The Group’s sales decreased by 17% to US$69.9 million in FY2017 compared to US$84.6 million in FY2016. Sales were lower in FY2017 due to the uncertain and difficult market conditions which continued to affect the sales of the Group’s products and sales across all geographical regions.
US$million
Sales by Product Category 2017 2016
Audio, speakers and headphones 64.1 77.8 Personal digital entertainment 4.1 2.8 Other products 1.7 4.0
69.9 84.6
Sales of all product categories in FY2017 have decreased compared to FY2016 with the exception of sales of personal digital entertainment products which has increased due to an increase in sales of 3D cameras.
US$million
Sales by Region 2017 2016
Asia Pacific 38.0 42.5 The Americas 9.6 14.6 Europe 22.3 27.5
69.9 84.6
By geographical region, sales in FY2017 decreased across all three regions by 11%, 34% and 19% in the Asia Pacific, the Americas and the Europe region respectively. As a percentage of total sales, the Asia Pacific region sales contributed 54% of total sales in FY2017 compared to 50% in FY2016. Sales in the Americas region was 14% of total sales in FY2017 compared to 17% in FY2016 and the sales in the Europe region was 32% of total sales in FY2017 against 33% in FY2016.
Gross Profit
Gross profit was US$19.6 million in FY2017 compared to US$23.0 million in FY2016. Gross profit margin as a percentage of sales was 28% in FY2017 compared to 27% in FY2016. Gross profit in FY2017 included write-down of excess inventories resulting from the reduction in sales. Gross profit for FY2017 was in line with the sales mix.
FINANCIAL HIGHLIGHTS AND REVIEWFor the financial year ended 30 June 2017

4
CREATIVE TECHNOLOGY LTD AND ITS SUBSIDIARIES
For the financial year ended 30 June 2017
Expenses
Total expenses decreased from US$52.1 million in FY2016 to US$42.5 million in FY2017.
Selling, general and administrative expenses were US$30.4 million in FY2017 compared to US$36.8 million in FY2016. The reduction in selling, general and administrative expenses in FY2017 was due mainly to lower level of sales and lower legal expenses in FY2017.
Research and development expenses were US$12.1 million in FY2017 compared to US$15.3 million in FY2016. The decrease in research and development expenses was due mainly to cost cutting actions taken by management in the previous year.
Net Loss
Net loss in FY2017 was US$22.9 million compared to net profit of US$2.7 million in FY2016. Net loss in FY2017 included other gains of US$1.4 million, other losses of US$1.4 million and share of loss of associated companies of US$0.3 million. Net profit in FY2016 included employee severance charges of US$4.1 million in the first quarter of FY2016, other gains of US$41.5 million, other losses of US$1.4 million, share of loss of associated companies of US$0.7 million and income tax expense of US$8.0 million.
Other gains of US$1.4 million in FY2017 were mainly due to US$1.3 million gain on disposal of investments. Other gains of US$41.5 million in FY2016 were mainly due to US$33.5 million proceeds from settlements in patent lawsuit, US$2.7 million gain on disposal of investments and US$5.2 million from write-back of subcontract accruals made in prior years.
Other losses of US$1.4 million in FY2017 relates to foreign exchange loss of US$0.7 million and impairment loss on investments of US$0.7 million. Other losses of US$1.4 million in FY2016 relates to foreign exchange loss of US$0.4 million and impairment loss on investments of US$0.9 million.
Income tax expense of US$8.0 million in FY2016 was due mainly to US$7.8 million withholding tax payments relating to the proceeds from the patent lawsuit settlements, and US$0.4 million adjustment for potential transfer pricing and withholding tax exposure of foreign subsidiaries.
Balance Sheet
The US$19.1 million decrease in cash and cash equivalents was due mainly to operating loss in FY2017.
The decrease in trade receivables by US$1.7 million to US$5.9 million and inventories by US$4.6 million to US$20.4 million were in line with the lower level of sales.
The decrease in available-for-sale financial assets by US$2.3 million to US$9.6 million was due mainly to disposal of investments.
Accrued liabilities and provisions decreased by US$3.9 million to US$19.5 million as at 30 June 2017 were due mainly to lower level of operating activities.
FINANCIAL HIGHLIGHTS AND REVIEW

5
CREATIVE TECHNOLOGY LTD AND ITS SUBSIDIARIES
DIRECTORS AND EXECUTIVE OFFICERS
Creative’s directors and executive officers are as follows:-
Name Age Position
Sim Wong Hoo 62 Chairman of the Board and Chief Executive OfficerLee Kheng Nam 69 Independent Non-Executive DirectorNg Kai Wa 61 Independent Non-Executive DirectorLee Gwong-Yih 62 Independent Non-Executive DirectorNg Keh Long 58 Chief Financial Officer
SIM WONG HOO founded Creative in 1981 and has been its Chairman of the Board and Chief Executive Officer since its inception.
LEE KHENG NAM has been a Director of Creative since 1991. He is presently a Venture Partner of GGV Capital and also Chairman of Advantec Pte Ltd, an investment holding company. Mr. Lee is also currently Deputy Chairman of Vertex Venture Holdings Ltd (VVH), wholly-owned subsidiary of Temasek Holdings (Private) Limited engaged in the venture capital direct investment and fund management business. Mr. Lee was General Manager (1988 to February 1995) and subsequently President of Vertex Management Pte Ltd (VMPL) and executive Director of VVH from March 1995 to February 2004. Prior to this, he was with NatSteel group of companies as the Manager of the Project Development Department and the Ministry of National Development where he was Deputy Director of Planning. He sits on the boards of several companies, both local and overseas. He formerly served on the boards of Centillium Communications, Inc, Chartered Semiconductor Manufacturing Ltd, GRIC Communications Inc., ActivCard Corp and Gemplus International S.A. Mr. Lee holds a Bachelor of Science degree in Mechanical Engineering (First Class Honours) from Queen’s University, Canada and a Master of Science degree in Operations Research and Systems Analysis from the U.S. Naval Postgraduate School.
NG KAI WA became a Director of Creative in 2005. He has been the Co-Founder, Chairman and Chief Executive Officer of InnoMedia Pte Ltd since 1995. InnoMedia is a leading supplier of broadband access IP Telephony, and SIP Trunking solutions to Cable MSOs, broadband service providers and distribution partners. Prior to that, he was the Co-Founder, Chief Technology Officer and Vice Chairman of the Board of Creative Technology Ltd. Mr. Ng holds an Executive Master of Business Administration Degree from the National University of Singapore and a Diploma in Electronic and Electrical Engineering from Ngee Ann Polytechnic.
LEE GWONG-YIH became a Director of Creative in 2009. He is Managing Director of Translink Capital. Prior to joining Translink Capital in 2014, Mr. Lee was Chairman and Chief Executive Officer of the CyberTAN Technology, Inc. since 2006. Prior to CyberTan, Mr Lee founded two start-up companies, Transmedia in March of 1998 and Digicom Systems in May of 1987. Both companies were successfully acquired by Cisco Systems and Creative Labs in 1999 and 1994 respectively. Mr Lee holds a Master of Science degree in Electrical Engineering from the State University of New York at Stony Brook and a Bachelor of Science degree in Electrical Engineering from National Chiao-Tung University, Taiwan.
NG KEH LONG joined the Company in April 1993 as Financial Controller and held various financial positions until 1998 when he was appointed as Chief Financial Officer. Prior to joining Creative, he was a Senior Manager with Price Waterhouse (now PricewaterhouseCoopers LLP), where he gained more than ten years’ experience in finance, accounting and auditing.
BOARD OF DIRECTORS AND EXECUTIVE OFFICERS

6
CREATIVE TECHNOLOGY LTD AND ITS SUBSIDIARIES
For the financial year ended 30 June 2017
PRINCIPLE 1: THE BOARD’S CONDUCT OF ITS AFFAIRS
The principal functions of the Board of Directors of the Company (the “Board”) are to provide guidance and to decide on certain important matters, including those involving the review and approval of strategic plans, direction and policies, to review the Group’s performance, to review the adequacy and integrity of internal controls, and to approve material acquisitions and disposals of assets. The Board also reviews management performance and sets the Company’s values and standards and ensures that obligations to shareholders and other stakeholders are understood and met. Sustainability issues are also considered as part of its strategic formulations.
These functions are either carried out directly by the Board or through committees, namely the Audit Committee, the Nominating Committee and the Remuneration Committee, established by the Board (collectively referred to as “Board Committees”).
Matters which are specifically reserved to the full Board for decision-making include those involving the review and approval of strategic plans, direction and policies, material acquisitions and disposals of assets, corporate or financial restructuring and share issuances, dividends and other returns to shareholders.
The Constitution of the Company allow the Company’s Directors to participate in a Board meeting by telephone conference or video conference whereby all persons participating in the meeting are able to communicate as a group, without requiring the Directors’ physical presence at the meeting.
The number of Board and Board Committee meetings held in the financial year ended 30 June 2017 and the attendance of directors during these meetings is as follows:
Audit Remuneration NominatingName of Director Board Committee Committee Committee(Number of Meetings Held) (5) (6) (2) (1)
Sim Wong Hoo 5 – 2 1Lee Kheng Nam 5 6 2 1Ng Kai Wa 5 6 2 1Lee Gwong-Yih 5 6 – –
Upon appointment of each new director, a letter is provided setting out the director’s duties and obligations. The Group also conducts an orientation programme for new directors to familiarize them with the business activities and corporate governance practices. The Company will provide training for first-time director in areas such as accounting, legal and industry-specific knowledge as appropriate. None of the directors is first-time director.
Directors are updated regularly on the Group’s strategic directions, financial performance, updates on corporate governance practices, relevant new laws, regulations and changing business risks during Board meetings or at specially-convened sessions.
Directors are also encouraged to request for sponsorship from the Company to attend courses to update their knowledge and better equip themselves to discharge their duties as Directors.
CORPORATE GOVERNANCE
Creative Technology Ltd (“Creative” or the “Company”, and together with its subsidiaries, the “Group”) is committed to maintaining good corporate governance in accordance with the principles and guidelines set out in the Code of Corporate Governance issued in May 2012 (the “Code”). Creative’s approach on corporate governance takes into consideration the principles and guidelines set out in the Code, substantially complied with the key principles and supporting guidelines set out in the Code except where specifically identified and disclosed in this report.
This report outlines the main corporate governance practices that were in place throughout the financial year, with specific references to each of the principles of the Code.

7
CREATIVE TECHNOLOGY LTD AND ITS SUBSIDIARIES
PRINCIPLE 2: BOARD COMPOSITION AND GUIDANCE
The Board comprises four members, one of whom is an Executive Director and three of whom are independent non-Executive Directors. The criteria of independence are based on the definition given in the Code. Key information regarding the Directors is disclosed in Board of Directors and Executive Officers. Together the Board has a diverse wealth of experience as well as skills and knowledge and the diversity of experience, skills and competencies of the Directors enhance the effectiveness of the Board in carrying out its responsibilities.
The Board in reviewing Board composition will consider the benefits of all aspects of diversity, including diversity of skills, experience, background, gender, age and other relevant factors. These differences will be considered in determining the optimum composition of the Board and when possible should be balanced appropriately. All Board appointments are made based on merit, in the context of the skills, experience, independence and knowledge which the Board as a whole requires to be effective.
The Executive Director is Mr Sim Wong Hoo, the Chairman and Chief Executive Officer of the Company. He is also a substantial shareholder.
The independent non-Executive Directors are Mr Lee Kheng Nam, Mr Ng Kai Wa and Mr Lee Gwong-Yih.
Two Directors have served as independent directors on the Board for more than nine years from the respective dates of their first appointment. They are Mr Lee Kheng Nam and Mr Ng Kai Wa. The Board had conducted a rigorous review on their status, taking into consideration all other factors in accessing the independence of a Director. These factors include, inter alia, if the Director has any interest, business relationship and/or other material contractual relationship with the Group which could reasonably be perceived to compromise his independence and interfere with the exercise of his independent business judgement with a view to the best interests of the Group. After due and careful review, the Board had determined Mr Lee Kheng Nam and Mr Ng Kai Wa are independent directors of the Company. The Board is of the view that their more than nine years of service has not affected their objectivity. They have continued to demonstrate ability to exercise strong independent judgement and act in the interests of the Company. Further, having gained in-depth understanding of the business of the Group, Mr Lee Kheng Nam and Mr Ng Kai Wa provide the Company with the experience and knowledge of the industry. Their contributions will be valuable to the Company.
The independent non-Executive Directors contribute to the Board by monitoring and reviewing Management’s performance against goals and objectives. Their views and opinions provide different perspectives to the Group’s business. While reviewing Management’s proposals or decisions, they bring independent judgement to bear on business activities and transactions involving conflicts of interest and other complexities. Where appropriate and necessary, the non-Executive Directors would also meet without the presence of Management.
The Board is of the view that the current Board, with independent non-Executive Directors making up at least half of the Board, provides for a strong and independent element on the Board capable of exercising objective judgement on corporate affairs of the Group. No individual or small group of individuals dominates the Board’s decision-making.
PRINCIPLE 3: CHAIRMAN AND CHIEF EXECUTIVE OFFICER
The Company has the same Chairman and Chief Executive Officer (“CEO”), Mr Sim Wong Hoo. Mr Sim Wong Hoo has played an instrumental role in developing the business, and has provided the Group with strong leadership and vision. Even though the Company does not have separate persons for the Chairman and CEO, the Company believes that the independent non-Executive Directors have demonstrated high commitment in their role as Directors and have ensured that there is a good balance of power and authority. As such, there is no need for the role of the Chairman and CEO to be separated.
Mr Sim Wong Hoo is a substantial shareholder of the Company with a shareholding of approximately 33.09%. With his substantial shareholding, his interest is aligned with the Company and that of the other shareholders.

8
CREATIVE TECHNOLOGY LTD AND ITS SUBSIDIARIES
For the financial year ended 30 June 2017
Mr Sim, the Chairman provides strategic guidance and leads the Board. He is responsible for ensuring the effectiveness of the Board and its governance processes. With the assistance of the Company Secretary, he sets the agenda for Board meetings and ensures complete and accurate information is provided to the Board to facilitates good decision-making in particular on strategic issues. At meetings, he promotes a culture of open dialogue and debate, facilitating the effective contribution of all Directors. He also maintains effective communication with shareholders. At shareholder meetings, he ensures constructive dialogue between shareholders, Directors and Management. He is responsible for making strategic proposals to the Board and implementing the Group’s strategies and policies as well as the Board’s decision. He assumes executive responsibility for the day-to-day management of the Group.
Mr Lee Kheng Nam is the Lead Independent Director. As the Lead Independent Director, he leads and encourages dialogue between independent directors and provides feedback to the Chairman and CEO. As the Lead Independent Director, he is also available as the alternate channel for shareholders, should shareholders fail to resolve concerns through the normal channels of the Chairman and CEO, Chief Financial Officer or when such normal channels are inappropriate.
PRINCIPLE 4: BOARD MEMBERSHIP
The Nominating Committee (the “NC”) consists of three members, two of whom are independent non-Executive Directors. The Chairman of the NC, Mr Ng Kai Wa, is an independent non-Executive Director. The other two members are Mr Sim Wong Hoo, an Executive Director, and Mr Lee Kheng Nam, an independent non-Executive Director.
The principal functions of the NC are, among other matters, to recommend all Board and Board Committee appointments, re-appointments or re-elections, to determine the independence of each Director, and to identify new Directors who have the diversity of experience and appropriate knowledge and skills to contribute effectively to the Board.
The key terms of reference of the NC include the following.
• Review the Board’s succession plans and make recommendations to the Board on all appointments and re-appointments of Directors of the Company;
• Review the independence of Directors; and• Assess the effectiveness of the Board as a whole and contribution by each individual Director.
When a Director has multiple board representations, such director has to ensure that sufficient time and attention is given to the affairs of the Company. On the issue of multiple board representations, the Board is of the view that it should be left to the judgement and discretion of each Director. As such, the NC and the Board have decided not to set any maximum number of listed company board representations that any director may hold. The NC is satisfied that sufficient time and attention are being given by all the Directors to the affairs of the Company.
The Board does not have a practice of appointing alternate directors. There were no alternate directors in this financial year.
The Board has adopted a process for the selection, appointment and re-appointment of directors to the Board. The NC reviews the compositions of the Board periodically. It assesses and shortlists candidates for a position on the Board when a need arises. The search and nomination process for new Directors, if any, will be through recommendations of Directors and Management and external search services. Potential candidates are interviewed by the NC to access suitability and commitment.
New Directors are at present appointed by way of a Board resolution, after the NC approves their appointment. The Company’s Constitution provides that all Directors except Executive Directors are to retire at least once every three years by rotation, if they are appointed by the Company at a general meeting, and a newly appointed Director must submit himself for re-election at the next Annual General Meeting. The retiring Director is nonetheless eligible for re-election by shareholders at every Annual General Meeting. Accordingly, Mr Lee Gwong-Yih will, on the date of the Annual General Meeting, retire as Director. The NC recommends his re-appointment as Director at the Annual General Meeting to be held on 19 October 2017.
CORPORATE GOVERNANCE
PRINCIPLE 3: CHAIRMAN AND CHIEF EXECUTIVE OFFICER (cont’d)

9
CREATIVE TECHNOLOGY LTD AND ITS SUBSIDIARIES
PRINCIPLE 5: BOARD PERFORMANCE
The NC assesses the effectiveness of the Board as a whole and its board committees and each individual director, and also assesses the contribution by the Chairman and each individual director to the effectiveness of the Board. The Company believes that the Board’s performance is ultimately reflected in the performance of the Group. The Company assesses the Board’s performance through its ability to steer the Group in the right direction and the support it renders to Management. In evaluating directors’ performance, factors including the directors’ attendance, participation and level of participation and contributions at the main board and board committee meetings and other Company activities, are also taken into consideration.
The NC uses its best efforts to ensure that the Directors appointed to the Board possess the relevant necessary background, experience, knowledge and skills so as to enable each Director to bring to the Board an independent and objective perspective to contribute to the effectiveness of the Board.
The Company believes that apart from the Directors’ fiduciary duties (i.e. acting in good faith, with due diligence and care, and in the best interests of the Company and its shareholders), the Board’s key responsibilities are to set strategic directions and to ensure that the long term objective of enhancing shareholders’ value is achieved.
PRINCIPLE 6: ACCESS TO INFORMATION
In order to ensure that the Board is able to fulfill its responsibilities, management provides the Board members with regular updates of the performance and financial position of the Group. Information provided includes board papers with updates on key performance indicators, and background or explanatory information relating to matters to be brought before the Board. Management staff and the Company’s auditors, who can provide insight into the matters for discussion, are also invited from time to time to attend such meetings. This enables the Board to make informed and sound business decisions and be kept abreast of key challenges, opportunities and developments for the Group.
The Company Secretary attends all Board meetings and ensures that all Board procedures are followed. The Company Secretary keeps the Directors informed of any significant developments or events relating to the Group. He ensures good communication flows within the Board and between Management and the Directors. The Company Secretary, together with other management staff of the Company, also ensures that the Company complies with the applicable statutory and regulatory rules. The appointment and removal of the Company Secretary is subject to the approval of the Board.
The Directors have separate and independent access to the Company’s senior management and the Company Secretary at all times. Should the Directors, whether as a group or individually, need independent professional advice, the Company will appoint a professional advisor selected by the group or individual, and approved by the Chairman and CEO, to render the advice. The cost of such independent professional advice will be borne by the Company.

10
CREATIVE TECHNOLOGY LTD AND ITS SUBSIDIARIES
For the financial year ended 30 June 2017
PRINCIPLE 7: PROCEDURES FOR DEVELOPING REMUNERATION POLICIES PRINCIPLE 8: LEVEL AND MIX OF REMUNERATION PRINCIPLE 9: DISCLOSURE ON REMUNERATION
The Remuneration Committee (the “RC”) consists of three Directors, two of whom are independent non-Executive Directors. The Chairman of the RC is Mr Sim Wong Hoo, an Executive Director. The other two members are Mr Lee Kheng Nam and Mr Ng Kai Wa, both of whom are independent non-Executive Directors.
The principal functions of the RC are, among other matters, to recommend to the Board the structure of the compensation programme for each Board member and the CEO (or executive of equivalent rank) to ensure that the programme is competitive and sufficient to attract, retain and motivate each Board member and CEO of the required quality to run the Company successfully; to review each Board member’s and CEO’s compensation annually and determine appropriate adjustments where necessary; and to review any other long term incentive schemes which may be set up from time to time. The RC members are also members of the committees administering the Creative Employee Share Option Plans and the Creative Performance Share Plan.
The RC has access to relevant remuneration data and would seek expert advice from external remuneration consultants whenever required. During the year, there was no requirement for the engagement of external consultants.
Mr Sim Wong Hoo, the Chairman and CEO of the Company, and the Chairman of the RC, has been receiving a nominal sum of S$1 as his annual remuneration since the financial year ended 30 June 2008. He has also opted to be excluded from participating in the Creative Performance Share Plan.
Taking into consideration the remuneration package of Mr Sim Wong Hoo, there is minimal risk of any potential conflict of interest, and his ability to perform the role of the Chairman of the RC is similar to that of a non-Executive Director. Accordingly, the Board is of the view that he is suitable to perform the role of the Chairman of the RC.
The Company adopts a remuneration policy for employees comprising a fixed component and a performance based variable component. The fixed component is in the form of a base salary. The variable component is in the form of a variable bonus that is linked to the Company’s and the individual employee’s performance. Another element of the variable component is the grant of performance shares to employees under the Company’s Performance Share Plan. The Company’s employees participate in the performance review process that assesses the individual’s performance against set performance targets. Performance against these targets is a factor determining remuneration. This seeks to align the interests of the employees with that of the shareholders.
Each non-Executive Director is paid an annual Director’s fee of S$60,000 (pro-rated where length of service is less than one year) and is subject to shareholders’ approval at the Annual General Meeting. The Director’s fee proposed to be paid to each of the Directors for the financial year ended 30 June 2017 is as follows:
Name of Director Director’s Fee*
Lee Kheng Nam S$60,000Ng Kai Wa S$60,000Lee Gwong-Yih S$60,000 * Executive Directors are not paid a Director’s Fee.
Each non-Executive Director also participates in the Company’s stock options and performance share plan. The details of the Directors’ stock options and performance share awards are set out in the Directors’ Statement. Non-Executive Directors are not paid any salary, bonus, or other remuneration.
CORPORATE GOVERNANCE

11
CREATIVE TECHNOLOGY LTD AND ITS SUBSIDIARIES
The number of top five key executives of the Group (who are not Directors or the CEO) in remuneration bands is as follows:
Remuneration Bands Number of Key Executives
S$250,000 to S$499,999 2Less than S$250,000 3
For confidentiality and competitive reasons, the Company is not disclosing each individual executive’s remuneration and their names. The aggregate total remuneration paid to the top five key executives for the financial year ended 30 June 2017 was S$1,334,000.
None of the employees of the Group whose annual remuneration exceeds S$50,000 are immediate family members of the CEO or any other Director of the Company.
Details of the Creative Employee Share Option Plans and Creative Performance Share Plan are set out in the Notes to the Financial Statements.
PRINCIPLE 10: ACCOUNTABILITY
The Company provides shareholders with quarterly and annual financial results of the Group within the regulatory reporting periods, i.e. results for the first 3 quarters are released to shareholders within 45 days of the end of each quarter whilst the annual results are released within 60 days from the financial year end. In presenting the Group’s annual and quarterly results, the Board aims to provide shareholders with a balanced and understandable assessment of the Group’s performance and financial position with a commentary at the date of the announcement of the significant trends and competitive conditions of the industry in which it operates.
The management provides all Directors with financial updates of the Group’s performance, on a regular basis and when required, to enable the Board to make a balance and informed assessment of the Group’s performance, position and prospect. The CEO and the Chief Financial Officer (“CFO”) also provide assurance to the Board on the integrity of the financial statements of the Company and its subsidiaries.
The Board, together with the management, takes adequate steps to ensure compliance with all the Group’s policies, legislative and regulartory requirements, including requirements under the listing rules.
PRINCIPLE 11: RISK MANAGEMENT AND INTERNAL CONTROLS
The Board acknowledges that it is responsible for the overall risk management and internal control framework, but recognises that no cost effective risk management and internal control systems will preclude all errors and irregularities, as such a system is designed to manage rather than eliminate the risk of failure to achieve business objectives, and can provide only reasonable and not absolute assurance against the occurrence of material errors, poor judgement in decision-making, human errors, frauds or other irregularities.
The Board reviews the Group’s business and operational activities as presented by the management to identify areas of significant risks and recommends as appropriate, the measures to control and mitigate such risks. Annually, the Board reviews the adequacy and effectiveness of the Company’s risk management and internal control systems, including financial, operational, compliance and information technology controls.
12
CREATIVE TECHNOLOGY LTD AND ITS SUBSIDIARIES
For the financial year ended 30 June 2017
For the financial year ended 30 June 2017, the Board has received assurance from the CEO and CFO that:
• the financial records have been properly maintained and the financial statements give a true and fair view of the Group’s operations and finances; and
• the risk management and internal control systems have been adequate and effective to address the risks which the Group considers relevant and material to its operations.
The Board, with the concurrence of the Audit Committee, is of the opinion that the Group’s internal controls (including financial, operational, compliance and information technology controls) and risk management systems have been adequate and effective for the risks which the Group considers relevant and material to its operations for the financial year ended 30 June 2017. This opinion is arrived at based on the framework established and maintained by the Group, the work performed by the internal and external auditors, reviews carried out by Management, as well as assurances received from the CEO and CFO.
PRINCIPLE 12: AUDIT COMMITTEE
Given the growing emphasis accorded to risk management, the Board has nominated the Audit Committee (“AC”) to assist the Board in risk management responsibilities and function.
The AC consists of three Directors, all of whom are independent non-Executive Directors. The Chairman of the AC is Mr Lee Kheng Nam. The other two members are Mr Ng Kai Wa and Mr Lee Gwong-Yih. The Board considers Mr Lee Kheng Nam, who has the appropriate financial management knowledge and experience, well qualified to chair the AC. The other members of the AC also have the appropriate accounting or relevant financial expertise or experience to discharge their responsibilities. The principal functions of the AC, among other matters, are:
• to review and recommend for approval of the Board the quarterly and full year financial results and related announcement to be released on SGX-ST;
• assist the Board to review and oversee the internal controls and the Group’s Enterprise Risk Management Framework;
• provide guidance to management and renders assistance to the Board to determine the nature and extent of significant risks which the Board would be willing to take in achieving the Group’s strategic objectives;
• to review the scope and results of the audit and its cost-effectiveness and the independence and objectivity of the external auditors;
• to review the scope of work of the appointed internal auditors and evaluate the effectiveness of the internal auditors;
• to review the findings of the internal and external auditors and the response from the management;
• to make recommendations to the Board on the appointment, re-appointment and/or removal of internal and external auditors, and to approve the remuneration and terms of engagement of the internal and external auditors;
• to review interested person transactions;
• to review whistle-blowing investigations within the Group and ensuring appropriate follow-up in accordance with the Group’s whistle-blowing policy; and
• reports any material matters, findings and recommendations to the Board.
The AC has explicit authority to investigate any matter within its terms of reference, full access to and co-operation by Management and full discretion to invite any director or executive officer to attend its meetings, and reasonable resources to enable it to discharge its functions properly.
CORPORATE GOVERNANCE
PRINCIPLE 11: RISK MANAGEMENT AND INTERNAL CONTROLS (cont’d)

13
CREATIVE TECHNOLOGY LTD AND ITS SUBSIDIARIES
The number of meetings convened by the AC is set out in Principle 1: The Board’s Conduct of its Affairs. For the financial year, the AC has met with the external auditors in the absence of key management personnel.
In the review of the financial statements for the financial year ended 30 June 2017, the AC has reviewed with the CFO and the external auditors on changes to accounting standards and significant issues and assumptions which are relevant to the Group and have a direct impact on the group’s financial statements. The AC also considered the report from the external auditors, including their findings on the key areas of audit focus. Significant matters that were discussed with management and external auditors have been included as key audit matters in the independent auditors’ report for the financial year ended 30 June 2017. Refer to pages 19 to 21 of this Annual Report.
The Company has in place a whistle-blowing procedure where staff of the Group can raise in confidence concerns on possible improprieties relating to accounting, financial reporting, internal controls and auditing matters. Under these procedures, arrangements are in place for independent investigation of such matters raised and for appropriate follow up action to be taken. In relation to whistle blowing by non-employees, the whistle blower may report any impropriety and/or concern in writing to the CFO or the AC at the registered office address of the Company.
PRINCIPLE 13: INTERNAL AUDIT
The Board has approved the outsourcing of the Company’s internal audit function as they are of the view that the current size and scope of the Group’s operations does not warrant having internal audit function within the organization. Boardroom Business Solutions Pte. Ltd. (“Boardroom”) has been appointed to perform risk assessment and conducts review to assess the adequacy and effectiveness of the Group’s internal controls. The AC reviews and endorses the internal audit plan and the internal audit reports which include the audit findings and recommendations of the internal auditors and management’s responses to such findings. Any material non-compliance or failures in the internal audit function and the recommendations for improvements are reported to the AC. The AC also reviews the progress of any corrective, preventive or improvement measures as required.
The AC is satisfied that Boardroom has the appropriate resource to discharge its duties effectively as the staff assigned are members of the Institute of Internal Auditors, and adhere to standards set by nationally recognized professional bodies. For the financial year ended 30 June 2017, the AC is satisfied that the internal audit function is adequate and effective.
PRINCIPLE 14: SHAREHOLDER RIGHTS
The Group is committed to treat all shareholders fairly and equitably. The Group recognizes, protects and facilitates the exercise of shareholders’ rights, and continually reviews and updates such governance arrangements.
The Company ensures that there is adequate, timely and sufficient information pertaining to changes in the Group’s business which could be likely to materially affect the share price or value.
The Company ensures that shareholders have the opportunity to participate effectively and vote at the general meetings. Shareholders are also informed of the rules including voting procedures that govern the general meetings.
PRINCIPLE 15: COMMUNICATION WITH SHAREHOLDERS
The Company announces its quarterly and full year results within the regulatory periods. Material and price-sensitive information is publicly released via SGXNET on a timely basis. All shareholders of the Company receive the annual report of the Company and the notice of the Annual General Meeting, for which a notice is also advertised in the press and released via SGXNET. Shareholders and investors can access information on the Company at its website at www.creative.com which provides, inter-alia, corporate announcements, press releases and the latest financial results as disclosed by the Company on SGXNET. From time to time, the Company holds briefings with analysts and the media to coincide with the release of the Group’s results. Shareholders may also seek clarification on investor related issues by email provided in the Company’s website at www.creative.com.

14
CREATIVE TECHNOLOGY LTD AND ITS SUBSIDIARIES
For the financial year ended 30 June 2017
PRINCIPLE 15: COMMUNICATION WITH SHAREHOLDERS (cont’d)
Specific guidelines have been laid down for compliance in respect of all public communications. The Company does not practise selective disclosure in the communication of material information. In addition, the Company has also put in place operational procedures to respond promptly to queries from SGX-ST on any unusual trading activities in its securities.
The Company pays an annual dividend, taking into consideration the Company’s financial performance, present cash position, projected cash flow generated from operations and projected capital requirements. This is provided that the amount of dividend declared does not exceed the Company’s retained earnings.
PRINCIPLE 16: CONDUCT OF SHAREHOLDER MEETINGS
At general meetings of the Company, shareholders are given the opportunity to communicate their views and ask the Directors and management questions regarding matters affecting the Company. The Board and senior management are available at the Annual General Meeting to respond to, and to assist the Directors in responding to shareholders’ questions. The Company’s external auditors are also present to address shareholders’ queries relating to the conduct of the audit and the preparation and content of the auditor’s report. Shareholders also have the opportunity to communicate with the Directors after the meeting. Shareholders also have the opportunity to communicate with the Directors after the meeting. The Company prepares minutes of the general meetings relating to the agenda of the meeting and responses from the Board and Management. The minutes are available to shareholders upon their request.
In accordance with the Constitution of the Company, shareholders may appoint not more than two proxies to attend and vote on their behalf. A proxy need not be a member of the Company. Relevant intermediaries such as the Central Provident Fund and custodian banks are entitled to appoint more than two proxies to attend and vote at the meeting. Shareholders who hold shares through these relevant intermediaries will be allowed to attend and vote at the forthcoming AGM subject to being appointed a proxy by their respective relevant intermediaries.
Every matter requiring shareholders’ approval is proposed on a separate resolution. Each item of special business included in the notice of meeting is accompanied, where appropriate, by an explanation for the proposed resolution.
The Company has adopted electronic poll voting for the general meetings to ensure greater transparency and efficiency in the voting process and results. Shareholders are invited to vote on each of the resolutions by poll, using an electronic voting system. The voting results of all votes cast for or against each resolution are screened at the meeting and announced via the SGXNet after the meeting.
DEALINGS IN SECURITIES In line with the recommended practices on dealings in securities set out in the SGX-ST Listing Rules, the Company provides internal guidance with regards to dealing in the Company’s securities by the Company, its Directors and officers. These guidelines prohibit dealing in the Company’s securities on short-term considerations and while in possession of unpublished material price-sensitive information in relation to such securities, and during the period commencing two weeks before the announcement of Group’s financial statements for each of the first three quarters of its financial year and one month before the announcement of the Group’s full year financial statements.
CORPORATE GOVERNANCE
15
CREATIVE TECHNOLOGY LTD AND ITS SUBSIDIARIES
3. DIRECTORS’ INTERESTS IN SHARES OR DEBENTURES
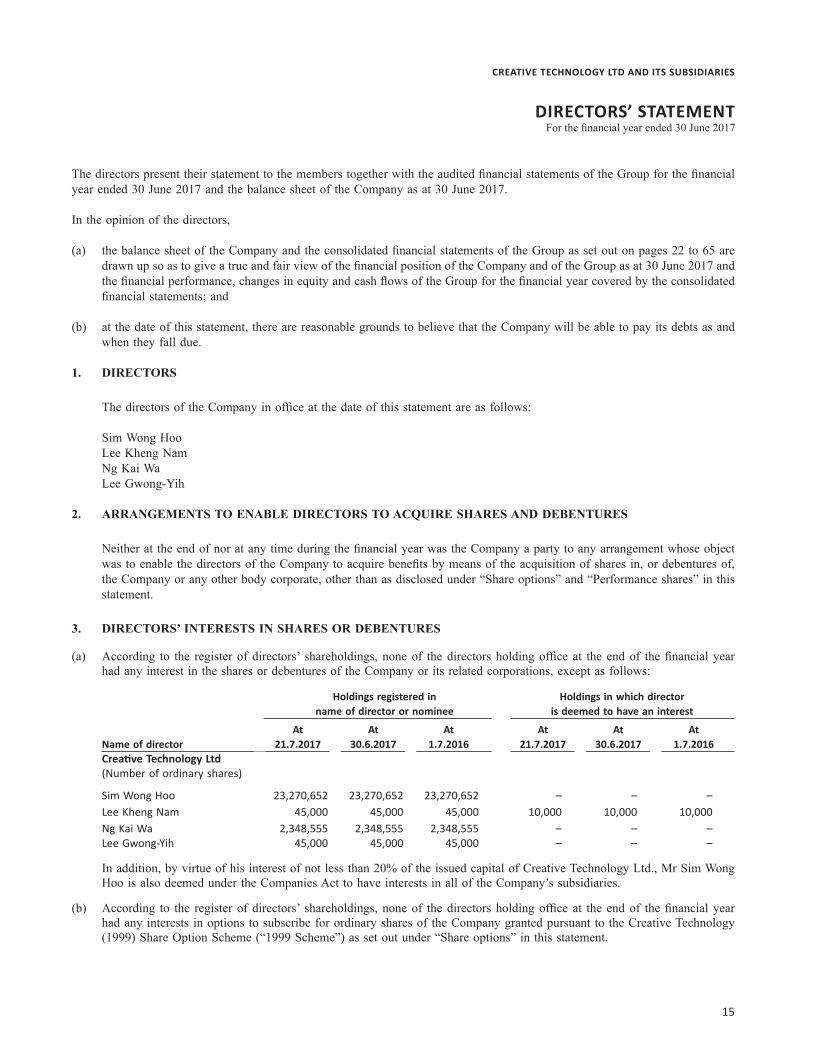
(a) According to the register of directors’ shareholdings, none of the directors holding office at the end of the financial year had any interest in the shares or debentures of the Company or its related corporations, except as follows:
Holdings registered in Holdings in which director name of director or nominee is deemed to have an interest
At At At At At At Name of director 21.7.2017 30.6.2017 1.7.2016 21.7.2017 30.6.2017 1.7.2016
Creative Technology Ltd (Number of ordinary shares)
Sim Wong Hoo 23,270,652 23,270,652 23,270,652 – – – Lee Kheng Nam 45,000 45,000 45,000 10,000 10,000 10,000 Ng Kai Wa 2,348,555 2,348,555 2,348,555 – – – Lee Gwong-Yih 45,000 45,000 45,000 – – –
In addition, by virtue of his interest of not less than 20% of the issued capital of Creative Technology Ltd., Mr Sim Wong Hoo is also deemed under the Companies Act to have interests in all of the Company’s subsidiaries.
(b) According to the register of directors’ shareholdings, none of the directors holding office at the end of the financial year had any interests in options to subscribe for ordinary shares of the Company granted pursuant to the Creative Technology (1999) Share Option Scheme (“1999 Scheme”) as set out under “Share options” in this statement.
The directors present their statement to the members together with the audited financial statements of the Group for the financial year ended 30 June 2017 and the balance sheet of the Company as at 30 June 2017.
In the opinion of the directors,
(a) the balance sheet of the Company and the consolidated financial statements of the Group as set out on pages 22 to 65 are drawn up so as to give a true and fair view of the financial position of the Company and of the Group as at 30 June 2017 and the financial performance, changes in equity and cash flows of the Group for the financial year covered by the consolidated financial statements; and
(b) at the date of this statement, there are reasonable grounds to believe that the Company will be able to pay its debts as and when they fall due.
1. DIRECTORS
The directors of the Company in office at the date of this statement are as follows:
Sim Wong Hoo Lee Kheng Nam Ng Kai Wa Lee Gwong-Yih
2. ARRANGEMENTS TO ENABLE DIRECTORS TO ACQUIRE SHARES AND DEBENTURES
Neither at the end of nor at any time during the financial year was the Company a party to any arrangement whose object was to enable the directors of the Company to acquire benefits by means of the acquisition of shares in, or debentures of, the Company or any other body corporate, other than as disclosed under “Share options” and “Performance shares” in this statement.
DIRECTORS’ STATEMENTFor the financial year ended 30 June 2017

16
CREATIVE TECHNOLOGY LTD AND ITS SUBSIDIARIES
For the financial year ended 30 June 2017
4. SHARE OPTIONS
(a) Employee share option plans The Creative Technology (1999) Share Option Scheme (“1999 Scheme”) was approved by shareholders at an Extraordinary
General Meeting on 30 December 1998 which allows options to be granted to full-time employees as well as consultants and non-executive directors. The total number of shares that may be granted under the 1999 Scheme was 7.5 million, provided that such amount shall be automatically increased on the first day (1 July) of each of the five financial years ended 30 June 2001, 2002, 2003, 2004 and 2005 by four percent of the issued share capital of the Company as at the last day of the immediate preceding financial year. The Option Committee has the discretion to decide the vesting schedule in the letter of offer. If it is not specifically stated in the letter of offer, 1/4 of the total amount of the grant vests on the first anniversary of the grant date and 1/48 of the total amount of the grant vests on the last day of each calendar month thereafter.
The exercise price of the options is determined at the average of the closing prices of the Company’s shares as quoted on the Singapore Exchange Securities Trading Limited (“SGX-ST”) or the National Association of Securities Dealers Automated Quotations (“NASDAQ”) for five market days preceding the date of the grant.
Options expire after the tenth anniversary of the date of grant, except in the case of options granted to participants other than employees, options expire not later than the fifth anniversary of the date of grant. Effective 12 November 2007, amendments were made to the 1999 Scheme to allow the use of treasury shares to satisfy share based exercises. The options under the 1999 Scheme do not entitle the holders of the options, by virtue of such holdings, to any right to participate in any share issue of any other company.
The 1999 Scheme expired on 29 December 2008 but the options granted prior to the expiry date will continue to vest according to the terms and conditions of the 1999 Scheme and the respective grants.
Details of the Directors’ share options are set out as follows:
Number of unissued ordinary shares of the Comapany under option Aggregate Aggregate Granted in granted since exercised since Aggregate financial commencement commencement Aggregate outstanding year ended of scheme to of scheme to options as at Name of director 30.6.2017 30.6.2017 30.6.2017 lapsed 30.6.2017
Lee Kheng Nam – 160,000 80,000 80,000 – Ng Kai Wa – 80,000 – 80,000 –
There were no options exercised during the financial years ended 30 June 2017 and 2016.
DIRECTORS’ STATEMENT

17
CREATIVE TECHNOLOGY LTD AND ITS SUBSIDIARIES
(b) Share options outstanding The number of unissued ordinary shares of the Company under option in relation to the 1999 Scheme outstanding at the
end of the financial year was as follows:
Number of unissued ordinary shares Weighted under option at average Grant date 30.6.2017 exercise price Expiry date
December 2007 1,014,000 US$4.70 31 December 2017 1,014,000
5. PERFORMANCE SHARES The Creative Performance Share Plan (the “Plan”) was approved by shareholders at an Extraordinary General Meeting on 29
October 2009 under which awards (the “Award”) of fully-paid shares, their equivalent cash value or combinations thereof, will be issued free of charge, to eligible employees and non-executive directors of the Company and its subsidiaries, provided that certain prescribed performance targets are met and/or upon expiry of the prescribed vesting periods.
The aggregate number of shares for which an Award may be granted on any date under the Plan, when added to the number of shares issued and/or issuable in respect of all Awards granted under the Plan and all shares, options or awards granted under any other share option or share scheme of the Company then in force, shall not exceed 15% of the total issued shares of the Company (excluding treasury shares) on the day preceding that date. Outstanding options under the 1999 Scheme are excluded from the computation of the 15% limit for the Plan. The Plan shall continue in force at the discretion of the Committee, subject to a maximum period of 10 years commencing on 29 October 2009.
On 31 March 2010, 2,793,600 performance shares were granted to non-executive directors and employees under the Plan. Of the total performance shares granted, 716,950 shares were vested immediately on the date of grant. The remaining performance shares will be released over 4 annual performance periods subject to the completion of service and the achievement of prescribed performance targets in each of the performance periods.
There were no awards granted under the Plan during the financial years ended 30 June 2017 and 2016. However, as at 30 June 2017, the Committee has extended the performance period till 31 December 2017 for 218,000 performance shares granted on 31 March 2010 that were subject to the achievement of prescribed performance targets.
18
CREATIVE TECHNOLOGY LTD AND ITS SUBSIDIARIES
For the financial year ended 30 June 2017DIRECTORS’ STATEMENT
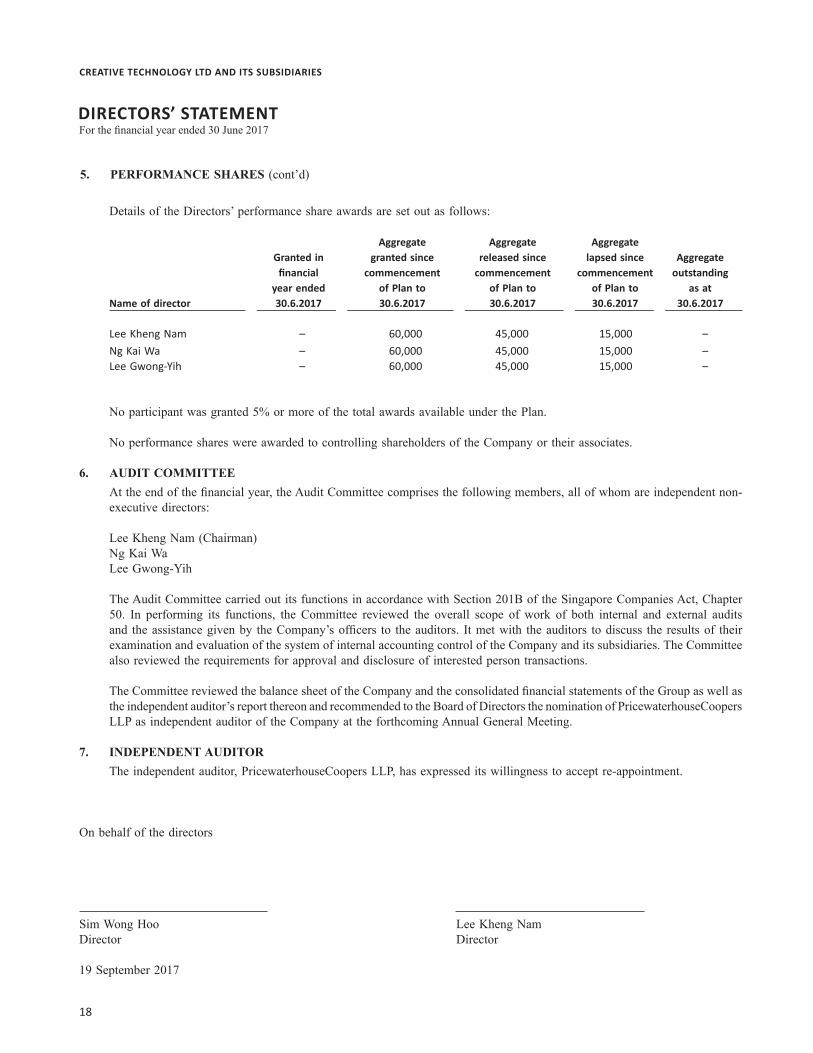
Details of the Directors’ performance share awards are set out as follows:
Aggregate Aggregate Aggregate Granted in granted since released since lapsed since Aggregate financial commencement commencement commencement outstanding year ended of Plan to of Plan to of Plan to as at Name of director 30.6.2017 30.6.2017 30.6.2017 30.6.2017 30.6.2017
Lee Kheng Nam – 60,000 45,000 15,000 – Ng Kai Wa – 60,000 45,000 15,000 – Lee Gwong-Yih – 60,000 45,000 15,000 –
No participant was granted 5% or more of the total awards available under the Plan.
No performance shares were awarded to controlling shareholders of the Company or their associates.
6. AUDIT COMMITTEE At the end of the financial year, the Audit Committee comprises the following members, all of whom are independent non-
executive directors:
Lee Kheng Nam (Chairman) Ng Kai Wa Lee Gwong-Yih
The Audit Committee carried out its functions in accordance with Section 201B of the Singapore Companies Act, Chapter 50. In performing its functions, the Committee reviewed the overall scope of work of both internal and external audits and the assistance given by the Company’s officers to the auditors. It met with the auditors to discuss the results of their examination and evaluation of the system of internal accounting control of the Company and its subsidiaries. The Committee also reviewed the requirements for approval and disclosure of interested person transactions.
The Committee reviewed the balance sheet of the Company and the consolidated financial statements of the Group as well as the independent auditor’s report thereon and recommended to the Board of Directors the nomination of PricewaterhouseCoopers LLP as independent auditor of the Company at the forthcoming Annual General Meeting.
7. INDEPENDENT AUDITOR The independent auditor, PricewaterhouseCoopers LLP, has expressed its willingness to accept re-appointment.
On behalf of the directors
Sim Wong Hoo Lee Kheng NamDirector Director
19 September 2017
5. PERFORMANCE SHARES (cont’d)

19
CREATIVE TECHNOLOGY LTD AND ITS SUBSIDIARIES
Report on the Financial Statements
Our opinionIn our opinion, the accompanying consolidated financial statements of Creative Technology Ltd (“the Company”) and its subsidiaries (“the Group”) and the balance sheet of the Company are properly drawn up in accordance with the provisions of the Companies Act, Chapter 50 (“the Act”) and Financial Reporting Standards in Singapore (“FRSs”) so as to give a true and fair view of the consolidated financial position of the Group and the financial position of the Company as at 30 June 2017 and of the consolidated financial performance, consolidated changes in equity and consolidated cash flows of the Group for the financial year ended on that date.
What we have auditedThe financial statements of the Company and the Group comprise:
• the balance sheet of the Group as at 30 June 2017;
• the balance sheet of the Company as at 30 June 2017;
• the consolidated statement of comprehensive income for the year then ended;
• the consolidated statement of changes in equity for the year then ended;
• the consolidated statement of cash flows of the Group for the year then ended; and
• the notes to the financial statements, including a summary of significant accounting policies.
Basis for Opinion We conducted our audit in accordance with Singapore Standards on Auditing (“SSAs”). Our responsibilities under those standards are further described in the Auditor’s Responsibilities for the Audit of the Financial Statements section of our report.
We believe that the audit evidence we have obtained is sufficient and appropriate to provide a basis for our opinion.
IndependenceWe are independent of the Group in accordance with the Accounting and Corporate Regulatory Authority (“ACRA”) Code of Professional Conduct and Ethics for Public Accountants and Accounting Entities (“ACRA Code”) together with the ethical requirements that are relevant to our audit of the financial statements in Singapore, and we have fulfilled our other ethical responsibilities in accordance with these requirements and the ACRA Code.
Our Audit ApproachAs part of designing our audit, we determined materiality and assessed the risks of material misstatement in the accompanying financial statements. In particular, we considered where management made subjective judgments; for example, in respect of significant accounting estimates that involved making assumptions and considering future events that are inherently uncertain. As in all of our audits, we also addressed the risk of management override of internal controls, including among other matters consideration of whether there was evidence of bias that represented a risk of material misstatement due to fraud.
Key Audit MattersKey audit matters are those matters that, in our professional judgement, were of most significance in our audit of the financial statements of the financial year ended 30 June 2017. These matters were addressed in the context of our audit of the financial statements as a whole, and in forming our opinion thereon, and we do not provide a separate opinion on these matters.
INDEPENDENT AUDITOR’S REPORTto the members of Creative Technology Ltd.

20
CREATIVE TECHNOLOGY LTD AND ITS SUBSIDIARIES
For the financial year ended 30 June 2017
Key Audit Matter Audit Matter
Inventory valuationThe total inventory and related excess and obsolete provision as of 30 June 2017 amounts to US$28.2 million and US$7.8 million, respectively. This is a key audit matter because the gross inventory and related provision are material to the financial statements, involve a high level of judgment and are subject to uncertainty due to the short product life cycle of consumer electronical products, changing consumer demands and trends, as well as rapid technological changes.
How our audit addressed the Key Audit Matter
Our work done is as follows:1. We assessed the assumptions, and considered the nature and suitability
of historic data used in estimating the provisions;2. We compared the inventory on hand against the future sales projections
as well as historical trends to assess the provision amount;3. For raw materials, we considered the compatibility of use in the production
of other products in determining the provision amount;4. We tested the inventory balances to determine that they are carried at
the lower of cost and net realisable value.5. We also checked the Group’s disclosure in the financial statements in
respect of this matter.
Based on our procedures, we found management’s assessment in respect of inventory valuation to be reasonable. We also found that the disclosures in the financial statements in respect of this matter to be adequate.
Other Information Management is responsible for the other information. The other information comprises all the sections of the annual report but does not include the financial statements and our auditor’s report thereon.
Our opinion on the financial statements does not cover the other information and we do not and will not express any form of assurance conclusion thereon.
In connection with our audit of the financial statements, our responsibility is to read the other information identified above and, in doing so, consider whether the other information is materially inconsistent with the financial statements or our knowledge obtained in the audit, or otherwise appears to be materially misstated. If, based on the work we have performed on the other information that we obtained prior to the date of this auditor’s report, we conclude that there is a material misstatement of this other information, we are required to report that fact. We have nothing to report in this regard.
Responsibilities of Management and Directors for the Financial StatementsManagement is responsible for the preparation of financial statements that give a true and fair view in accordance with the provisions of the Act and FRSs, and for devising and maintaining a system of internal accounting controls sufficient to provide a reasonable assurance that assets are safeguarded against loss from unauthorised use or disposition; and transactions are properly authorised and that they are recorded as necessary to permit the preparation of true and fair financial statements and to maintain accountability of assets.
In preparing the financial statements, management is responsible for assessing the Group’s ability to continue as a going concern, disclosing, as applicable, matters related to going concern and using the going concern basis of accounting unless management either intends to liquidate the Group or to cease operations, or has no realistic alternative but to do so.
The directors’ responsibilities include overseeing the Group’s financial reporting process.
Auditor’s Responsibilities for the Audit of the Financial Statements Our objectives are to obtain reasonable assurance about whether the financial statements as a whole are free from material misstatement, whether due to fraud or error, and to issue an auditor’s report that includes our opinion. Reasonable assurance is a high level of assurance, but is not a guarantee that an audit conducted in accordance with SSAs will always detect a material misstatement when it exists. Misstatements can arise from fraud or error and are considered material if, individually or in the aggregate, they could reasonably be expected to influence the economic decisions of users taken on the basis of these financial statements.
INDEPENDENT AUDITOR’S REPORTto the members of Creative Technology Ltd.

21
CREATIVE TECHNOLOGY LTD AND ITS SUBSIDIARIES
As part of an audit in accordance with SSAs, we exercise professional judgement and maintain professional scepticism throughout the audit. We also:
• Identify and assess the risks of material misstatement of the financial statements, whether due to fraud or error, design and perform audit procedures responsive to those risks, and obtain audit evidence that is sufficient and appropriate to provide a basis for our opinion. The risk of not detecting a material misstatement resulting from fraud is higher than for one resulting from error, as fraud may involve collusion, forgery, intentional omissions, misrepresentations, or the override of internal control.
• Obtain an understanding of internal control relevant to the audit in order to design audit procedures that are appropriate in the circumstances, but not for the purpose of expressing an opinion on the effectiveness of the Group’s internal control.
• Evaluate the appropriateness of accounting policies used and the reasonableness of accounting estimates and related disclosures made by management.
• Conclude on the appropriateness of management’s use of the going concern basis of accounting and, based on the audit evidence obtained, whether a material uncertainty exists related to events or conditions that may cast significant doubt on the Group’s ability to continue as a going concern. If we conclude that a material uncertainty exists, we are required to draw attention in our auditor’s report to the related disclosures in the financial statements or, if such disclosures are inadequate, to modify our opinion. Our conclusions are based on the audit evidence obtained up to the date of our auditor’s report. However, future events or conditions may cause the Group to cease to continue as a going concern.
• Evaluate the overall presentation, structure and content of the financial statements, including the disclosures, and whether the financial statements represent the underlying transactions and events in a manner that achieves fair presentation.
• Obtain sufficient appropriate audit evidence regarding the financial information of the entities or business activities within the Group to express an opinion on the consolidated financial statements. We are responsible for the direction, supervision and performance of the group audit. We remain solely responsible for our audit opinion.
We communicate with the directors regarding, among other matters, the planned scope and timing of the audit and significant audit findings, including any significant deficiencies in internal control that we identify during our audit.
We also provide the directors with a statement that we have complied with relevant ethical requirements regarding independence, and to communicate with them all relationships and other matters that may reasonably be thought to bear on our independence, and where applicable, related safeguards.
From the matters communicated with the directors, we determine those matters that were of most significance in the audit of the financial statements of the current period and are therefore the key audit matters. We describe these matters in our auditor’s report unless law or regulation precludes public disclosure about the matter or when, in extremely rare circumstances, we determine that a matter should not be communicated in our report because the adverse consequences of doing so would reasonably be expected to outweigh the public interest benefits of such communication.
Report on Other Legal and Regulatory RequirementsIn our opinion, the accounting and other records required by the Act to be kept by the Company and by those subsidiary corporations incorporated in Singapore of which we are the auditors have been properly kept in accordance with the provisions of the Act.
The engagement partner on the audit resulting in this independent auditor’s report is Lee Chian Yorn.
PricewaterhouseCoopers LLPPublic Accountants and Chartered AccountantsSingapore, 19 September 2017

22
CREATIVE TECHNOLOGY LTD AND ITS SUBSIDIARIES
For the financial year ended 30 June 2017
Group
2017 2016 Note US$’000 US$’000
Sales, net 69,895 84,574 Cost of goods sold 4 (50,300) (61,605)
Gross profit 19,595 22,969
Expenses:Selling, general and administrative (30,404) (36,793)Research and development (12,131) (15,289)
Total expenses 4 (42,535) (52,082)
Other income 6 430 354 Other gains 7 1,355 41,538Other losses 8 (1,380) (1,370)Share of loss of associated companies 17 (326) (724) (Loss) profit before income tax (22,861) 10,685
Income tax expense 9 (12) (7,973)
Net (loss) profit (22,873) 2,712
Attributable to: Equity holders of the Company (22,906) 2,620 Non-controlling interests 33 92
Earnings (loss) per share attributable to equity holders of the Company 10 - Basic (US$ per share) (0.33) 0.04 - Diluted (US$ per share) (0.33) 0.04
CONSOLIDATED INCOME STATEMENT
The accompanying notes form an integral part of these financial statements.

23
CREATIVE TECHNOLOGY LTD AND ITS SUBSIDIARIES
The accompanying notes form an integral part of these financial statements.
Net (loss) profit (22,873) 2,712
Other comprehensive (loss) income:
Items that may be reclassified subsequently to profit or loss:
Available-for-sale financial assets: - Fair value gains (losses) 188 (3,007)
- Reclassification (1,346) (2,723)
Total comprehensive loss for the financial year (24,031) (3,018)
Total comprehensive (loss) income attributable to: Equity holders of the Company (24,064) (3,110)Non-controlling interests 33 92
Total comprehensive loss for the financial year (24,031) (3,018)
Group 2017 2016
US$’000 US$’000
CONSOLIDATED STATEMENT OF COMPREHENSIVE INCOMEFor the financial year ended 30 June 2017

24
CREATIVE TECHNOLOGY LTD AND ITS SUBSIDIARIES
For the financial year ended 30 June 2017
LIABILITIES Current liabilities: Trade payables 22 9,300 9,651 417 1,588 Amounts due to subsidiaries 13 – – 9,272 8,325 Accrued liabilities and provisions 23 19,477 23,377 10,169 11,468 Current income tax liabilities 5 347 – – 28,782 33,375 19,858 21,381 Non-current liabilities: Amounts due to subsidiaries 13 – – 19,105 30,162 Deferred income tax liabilities 24 10,426 10,302 – – 10,426 10,302 19,105 30,162 Total liabilities 39,208 43,677 38,963 51,543 NET ASSETS 74,433 98,500 106,616 127,236
EQUITY Share capital 25 266,753 266,753 266,753 266,753Treasury shares 25 (16,262) (16,262) (16,262) (16,262)Fair value reserve 5,416 6,574 – – Other reserves 26 62,315 62,364 34,851 34,900Accumulated losses 27 (244,112) (221,219) (178,726) (158,155) 74,110 98,210 106,616 127,236Non-controlling interests 323 290 – – Total equity 74,433 98,500 106,616 127,236
The accompanying notes form an integral part of these financial statements.
BALANCE SHEETSAs at 30 June 2017
Group Company 2017 2016 2017 2016 Note US$’000 US$’000 US$’000 US$’000ASSETS Current assets: Cash and cash equivalents 11 75,282 94,738 69,892 88,362 Trade receivables 12 5,850 7,570 193 245 Amounts due from subsidiaries 13 – – 36,277 43,979 Inventories 14 20,413 25,052 2,489 5,153 Other current assets 15 1,422 1,797 597 633 102,967 129,157 109,448 138,372 Non-current assets: Available-for-sale financial assets 16 9,622 11,960 – – Amounts due from subsidiaries 13 – – 21,323 14,923 Investments in subsidiaries 18 – – 14,665 25,353 Property and equipment 19 866 870 143 131 Other non-current assets 21 186 190 – – 10,674 13,020 36,131 40,407
Total assets 113,641 142,177 145,579 178,779

25
CREATIVE TECHNOLOGY LTD AND ITS SUBSIDIARIES
Share Treasury Fair value Other Accumulated Non-controlling Total capital shares reserve reserves losses Total interests equity Note US$’000 US$’000 US$’000 US$’000 US$’000 US$’000 US$’000 US$’000 2017 Beginning of financial year 266,753 (16,262) 6,574 62,364 (221,219) 98,210 290 98,500
Loss for the year – – – – (22,906) (22,906) 33 (22,873)Other comprehensive loss for the year – – (1,158) – – (1,158) – (1,158)Total comprehensive (loss) income for the year – – (1,158) – (22,906) (24,064) 33 (24,031)
Employee share-based expense 26 – – – (49) – (49) – (49)Unclaimed dividends – – – – 13 13 – 13Total transactions with owners, recognized directly in equity – – – (49) 13 (36) – (36)
End of financial year 266,753 (16,262) 5,416 62,315 (244,112) 74,110 323 74,433
2016 Beginning of financial year 266,753 (16,262) 12,304 62,562 (223,847) 101,510 198 101,708
Profit for the year – – – – 2,620 2,620 92 2,712Other comprehensive loss for the year – – (5,730) – – (5,730) – (5,730)Total comprehensive (loss) income for the year – – (5,730) – 2,620 (3,110) 92 (3,018)
Employee share-based expense 26 – – – (198) – (198) – (198)Unclaimed dividends – – – – 8 8 – 8Total transactions with owners, recognized directly in equity – – – (198) 8 (190) – (190)
End of financial year 266,753 (16,262) 6,574 62,364 (221,219) 98,210 290 98,500
CONSOLIDATED STATEMENT OF CHANGES IN EQUITYFor the financial year ended 30 June 2017
The accompanying notes form an integral part of these financial statements.

26
CREATIVE TECHNOLOGY LTD AND ITS SUBSIDIARIES
For the financial year ended 30 June 2017CONSOLIDATED STATEMENT OF CASH FLOWS
The accompanying notes form an integral part of these financial statements.
Group
2017 2016 Note US$’000 US$’000Cash flows from operating activities: Net (loss) profit (22,873) 2,712 Adjustments for: Income tax expense 12 7,973 Depreciation of property and equipment 4 221 535 Employee share-based expense 5 (49) (198) Share of loss of associated companies 326 724 (Gain) loss on disposal of property and equipment 7,8 (9) 2 Impairment loss of available-for-sale financial assets 8 692 945 Gain on disposal of available-for-sale financial assets 7 (1,346) (2,723) Currency translation loss 351 840 Dividend income 6 – (2) Interest income 6 (430) (352)
(23,105) 10,456Changes in working capital, net of effects from disposal of subsidiaries Trade receivables 1,720 2,212 Inventories 4,639 3,827 Other assets and receivables 403 (554) Trade payables (351) (5,988) Accrued liabilities and provisions (3,776) (8,068)
Cash (used in) provided by operations (20,470) 1,885 Interest received 408 327 Income tax paid (355) (7,870)
Net cash used in operating activities (20,417) (5,658)
Cash flows from investing activities: Purchase of property and equipment (217) (54) Proceeds from sale of property and equipment 9 8 Proceeds from sale of available-for-sale financial assets 2,934 2,828 Purchase of available-for-sale financial assets (1,100) (500) Loan to associated company (326) (724) Dividend received – 2
Net cash provided by investing activities 1,300 1,560
Cash flows from financing activities: Unclaimed dividends 13 8
Net cash provided by financing activities 13 8
Net decrease in cash and cash equivalents (19,104) (4,090)Cash and cash equivalents at beginning of financial year 11 94,738 99,668 Effects of currency translation on cash and cash equivalents (352) (840)
Cash and cash equivalents at end of financial year 11 75,282 94,738

27
CREATIVE TECHNOLOGY LTD AND ITS SUBSIDIARIES
NOTES TO THE FINANCIAL STATEMENTSFor the financial year ended 30 June 2017
These notes form an integral part of and should be read in conjunction with the accompanying financial statements.
1. GENERAL INFORMATION
Creative Technology Ltd. (the “Company”) is listed on the Singapore Exchange Securities Trading Limited (“SGX-ST”) and incorporated and domiciled in Singapore. The address of its registered office is:
31 International Business Park #03-01 Creative Resource Singapore 609921.
The principal activities of the Company and its subsidiaries consist of the design, manufacture and distribution of digitised sound and video boards, computers and related multimedia and personal digital entertainment products.
2. SIGNIFICANT ACCOUNTING POLICIES
2.1 Basis of preparation
These financial statements have been prepared in accordance with Singapore Financial Reporting Standards (“FRS”) under the historical cost convention, except as disclosed in the accounting policies below.
The Group and the Company conduct a substantial portion of its business in United States dollars (“US$” or “$”). All dollar amounts included in the financial statements and in the notes herein are United States dollars unless designated as Singapore dollars (“S$”). The Group and the Company operate on a thirteen week calendar closing on the Friday closest to the natural calendar quarter. The Group’s financial year 2017 ended on 30 June 2017, the Friday nearest to 30 June 2017, while the prior financial year ended on 1 July 2016. All financial years are described by their natural calendar dates.
The preparation of financial statements in conformity with FRS requires management to exercise its judgement in the process of applying the Group’s accounting policies. It also requires the use of certain critical accounting estimates and assumptions. The areas involving a higher degree of judgement or complexity, or areas where assumptions and estimates are significant to the financial statements, are disclosed in Note 3.
Interpretations and amendments to published standards effective in 2016
On 2 July 2016, the Group adopted the new or amended FRS and Interpretations to FRS (“INT FRS”) that are mandatory for application for the financial year. Changes to the Group’s accounting policies have been made as required, in accordance with the transitional provisions in the respective FRS and INT FRS.
The adoption of these new or amended FRS and INT FRS did not result in substantial changes to the accounting policies of the Group and the Company and had no material effect on the amounts reported for the current or prior financial years.
2.2 Group accounting
(a) Subsidiaries Subsidiaries are entities (including special purpose entities) over which the Group has control. The Group controls an entity
when the Group is exposed to, or has rights to, variable returns from its involvement with the entity and has the ability to affect those returns through its power over the entities. Subsidiaries are fully consolidated from the date on which control is transferred to the Group. They are de-consolidated from the date on which control ceases.
The purchase method of accounting is used to account for the acquisition of subsidiaries. The cost of an acquisition is measured as the fair value of the assets given, equity instruments issued or liabilities incurred or assumed at the dates of exchange, plus costs directly attributable to the acquisition. Identifiable assets acquired and liabilities and contingent liabilities assumed in a business combination are measured initially at their fair value on the date of acquisition, irrespective of the extent of non-controlling interests. Please refer to the paragraph “Intangible assets – Goodwill on acquisitions” for the accounting policy on goodwill on acquisition of subsidiaries.

28
CREATIVE TECHNOLOGY LTD AND ITS SUBSIDIARIES
For the financial year ended 30 June 2017
In preparing the consolidated financial statements, transactions, balances and unrealised gains on transactions between group entities are eliminated. Unrealised losses are also eliminated but are considered an impairment indicator of the assets transferred. Accounting policies of subsidiaries have been changed where necessary to ensure consistency with the policies adopted by the Group.
Non-controlling interests are that part of the net results of operations and of net assets of a subsidiary attributable to the interests which are not owned directly or indirectly by the equity holders of the Company. They are shown separately in the consolidated income statement, consolidated statement of comprehensive income, statement of changes in equity and balance sheet. Total comprehensive income is attributed to the non-controlling interests based on their respective interests in a subsidiary, even if this results in the non-controlling interests having a deficit balance.
Please refer to the paragraph “Investments in subsidiaries and associated companies” for the accounting policy on investments in subsidiaries in the separate financial statements of the Company.
(b) Transactions with non-controlling interests Changes in the Group’s ownership interest in a subsidiary that do not result in a loss of control over the subsidiary are
accounted for as transactions with equity owners of the Company. Any difference between the change in the carrying amounts of the non-controlling interests and the fair value of the consideration paid or received is recognised in a separate reserve within equity attributable to the equity holders of the Company.
(c) Associated companies Associated companies are entities over which the Group has significant influence, but not control, and generally accompanied
by a shareholding giving rise to between and including 20% and 50% of the voting rights. Investments in associated companies are accounted for in the consolidated financial statements using the equity method of accounting less impairment losses.
Investments in associated companies are initially recognised at cost. The cost of an acquisition is measured at the fair value of the assets given, equity instruments issued or liabilities incurred or assumed at the date of exchange, plus costs directly attributable to the acquisition.
In applying the equity method of accounting, the Group’s share of its associated companies’ post-acquisition profits or losses are recognised in profit or loss and its share of post-acquisition movements in reserves is recognised in equity directly. These post-acquisition movements are adjusted against the carrying amount of the investment. When the Group’s share of losses in an associated company equals or exceeds its interest in the associated company, including any other unsecured non-current receivables, the Group does not recognise further losses, unless it has obligations or has made payments on behalf of the associated company.
Unrealised gains on transactions between the Group and its associated companies are eliminated to the extent of the Group’s interest in the associated companies. Unrealised losses are also eliminated unless the transaction provides evidence of an impairment of the asset transferred. The accounting policies of associated companies have been changed where necessary to ensure consistency with the accounting policies adopted by the Group.
Dilution gains and losses arising from investments in associated companies are recognised in profit or loss.
Please refer to the paragraph “Investments in subsidiaries and associated companies” for the accounting policy on investments in associated companies in the separate financial statements of the Company.
NOTES TO THE FINANCIAL STATEMENTS
2. SIGNIFICANT ACCOUNTING POLICIES (cont’d)2.2 Group accounting (cont’d) (a) Subsidiaries (cont’d)

29
CREATIVE TECHNOLOGY LTD AND ITS SUBSIDIARIES
2.3 Intangible assets
(a) Goodwill on acquisitions Goodwill represents the excess of the cost of an acquisition over the fair value of the Group’s share of the identifiable assets,
liabilities and contingent liabilities of the acquired subsidiaries and associated companies at the date of acquisition.
Goodwill on subsidiaries is recognised separately as intangible assets and carried at cost less accumulated impairment losses.
Goodwill on associated companies is included in the carrying amount of the investments.
Gains and losses on the disposal of subsidiaries and associated companies include the carrying amount of goodwill relating to the entity sold.
(b) Acquired trademarks and licenses Trademarks and licenses acquired are initially recognised at cost and are subsequently carried at cost less accumulated
amortisation and accumulated impairment losses. These costs are amortised to profit or loss using the straight-line method over the shorter of the contractual rights and estimated useful lives of the assets, ranging from one to ten years.
The amortisation period and amortisation method are reviewed at least at each balance sheet date. The effects of any revision are recognised in profit or loss when the changes arise.
2.4 Impairmentofnon-financialassets
(a) Goodwill Goodwill is tested for impairment annually and whenever there is indication that the goodwill may be impaired. Goodwill
included in the carrying amount of an investment in an associated company is tested for impairment as part of the investment, rather than separately.
For the purpose of impairment testing of goodwill, goodwill is allocated to each of the Group’s cash-generating-units (“CGU”) expected to benefit from synergies arising from the business combination.
An impairment loss is recognised when the carrying amount of a CGU, including the goodwill, exceeds the recoverable amount of the CGU. The recoverable amount of a CGU is the higher of the CGU’s fair value less cost to sell and value-in-use.
The total impairment loss of a CGU is allocated first to reduce the carrying amount of goodwill allocated to the CGU and then to the other assets of the CGU pro-rata on the basis of the carrying amount of each asset in the CGU.
An impairment loss on goodwill is recognised in profit or loss and is not reversed in a subsequent period.
(b) Intangible assets Property and equipment Investments in subsidiaries and associated companies
Intangible assets, property and equipment and investments in subsidiaries and associated companies are tested for impairment whenever there is any objective evidence or indication that these assets may be impaired.
For the purpose of impairment testing, the recoverable amount (i.e. the higher of the fair value less cost to sell and the value-in-use) is determined on an individual asset basis unless the asset does not generate cash inflows that are largely independent of those from other assets. If this is the case, the recoverable amount is determined for the CGU to which the asset belongs.

30
CREATIVE TECHNOLOGY LTD AND ITS SUBSIDIARIES
For the financial year ended 30 June 2017
If the recoverable amount of the asset (or CGU) is estimated to be less than its carrying amount, the carrying amount of the asset (or CGU) is reduced to its recoverable amount.
The difference between the carrying amount and recoverable amount is recognised as an impairment loss in profit or loss.
An impairment loss for an asset other than goodwill is reversed if, and only if, there has been a change in the estimates used to determine the asset’s recoverable amount since the last impairment loss was recognised. The carrying amount of this asset is increased to its revised recoverable amount, provided that this amount does not exceed the carrying amount that would have been determined (net of any accumulated amortisation or depreciation) had no impairment loss been recognised for the asset in prior years.
A reversal of impairment loss for an asset other than goodwill is recognised in profit or loss.
2.5 Cash and cash equivalents
Cash and cash equivalents include cash at bank and on hand and short-term bank deposits with various banks which are subject to an insignificant risk of change in value.
2.6 Financial assets
(a) Classification The Group classifies its financial assets in the following categories: loans and receivables and available-for-sale financial
assets. The classification depends on the nature of the asset and the purpose for which the assets were acquired. Management determines the classification of its financial assets at initial recognition.
(i) Loans and receivables Loans and receivables are non-derivative financial assets with fixed or determinable payments that are not quoted
in an active market. They are presented as current assets, except for those maturing later than 12 months after the balance sheet date which are presented as non-current assets. Loans and receivables are presented as “cash and cash equivalents”, “trade receivables”, “amounts due from subsidiaries”, other receivables and loan within “other current assets” and “other non-current receivables” on the balance sheet.
(ii) Available-for-salefinancialassets Available-for-sale financial assets are non-derivatives that are either designated in this category or not classified in any
of the other categories. They are presented as non-current assets unless management intends to dispose of the assets within 12 months after the balance sheet date.
(b) Recognition and derecognition Regular way purchases and sales of financial assets are recognised on trade-date, the date on which the Group commits to
purchase or sell the asset.
Financial assets are derecognised when the rights to receive cash flows from the financial assets have expired or have been transferred and the Group has transferred substantially all risks and rewards of ownership. On disposal of a financial asset, the difference between the carrying amount and the sale proceeds is recognised in profit or loss. Any amount previously recognised in other comprehensive income relating to that asset is transferred to profit or loss.
NOTES TO THE FINANCIAL STATEMENTS
2. SIGNIFICANT ACCOUNTING POLICIES (cont’d)
2.4 Impairmentofnon-financialassets(cont’d) (b) Intangible assets Property and equipment Investments in subsidiaries and associated companies (cont’d)
31
CREATIVE TECHNOLOGY LTD AND ITS SUBSIDIARIES
(c) Initial measurement Financial assets are initially recognised at fair value plus transaction costs.
(d) Subsequent measurement Avaiable-for-sale financial assets are subsequently carried at fair value. Loans and receivables are subsequently carried at
amortised cost using the effective interest method.
Interest and dividend income on available-for-sale financial assets are recognised separately in profit or loss. Changes in fair values of available-for-sale equity securities are recognised in other comprehensive income and accumulated in the fair value reserve, together with the related currency translation differences.
(e) Impairment The Group assesses at each balance sheet date whether there is objective evidence that a financial asset or a group of financial
assets is impaired and recognises an allowance for impairment when such evidence exists.
(i) Loans and receivables Significant financial difficulties of the debtor, probability that the debtor will enter bankruptcy, and default or significant
delay in payments are objective evidence that these financial assets are impaired.
The carrying amount of these assets is reduced through the use of an impairment allowance account which is calculated as the difference between the carrying amount and the present value of estimated future cash flows, discounted at the original effective interest rate. When the asset becomes uncollectible, it is written off against the allowance account. Subsequent recoveries of amounts previously written off are recognised against the same line item in profit or loss.
The allowance for impairment loss account is reduced through profit or loss in a subsequent period when the amount of impairment loss decreases and the related decrease can be objectively measured. The carrying amount of the asset previously impaired is increased to the extent that the new carrying amount does not exceed the amortised cost had no impairment been recognised in prior periods.
(ii) Available-for-salefinancialassets A significant or prolonged decline in the fair value of an equity security below its cost is considered as an indicator
that the available-for-sale financial asset is impaired.
If any evidence of impairment exists, the cumulative loss that was recognised in the fair value reserve is reclassified to profit or loss. The cumulative loss is measured as the difference between the acquisition cost (net of any principal repayments and amortisation) and the current fair value, less any impairment loss previously recognised as an expense. The impairment losses recognised as an expense on equity securities are not reversed through profit or loss.
2.7 Inventories
Inventories are carried at the lower of cost and net realisable value. Cost is determined using standard cost, appropriately adjusted at the balance sheet date to approximate actual cost on a weighted average basis. In the case of finished products, cost includes materials, direct labour and an appropriate proportion of production overheads. Net realisable value is the estimated selling price in the ordinary course of business, less applicable variable selling expenses.
2.8 Investments in subsidiaries and associated companies
Investments in subsidiaries and associated companies are carried at cost less accumulated impairment losses in the Company’s balance sheet. On disposal of investments in subsidiaries and associated companies, the difference between disposal proceeds and the carrying amounts of the investments are recognised in profit or loss.

32
CREATIVE TECHNOLOGY LTD AND ITS SUBSIDIARIES
For the financial year ended 30 June 2017NOTES TO THE FINANCIAL STATEMENTS
2. SIGNIFICANT ACCOUNTING POLICIES (cont’d)
2.9 Property and equipment
(a) Measurement Property and equipment are initially recognised at cost and subsequently carried at cost less accumulated depreciation and
accumulated impairment losses.
Cost recognised includes purchase price and any cost that is directly attributable to bringing the asset to the location and condition necessary for it to be capable of operating in the manner intended by management.
(b) Depreciation No depreciation is provided on freehold land. Depreciation is calculated using the straight-line method to allocate their
depreciable amounts over the estimated useful lives as follows:
Leasehold improvements - Shorter of lease term or useful life Buildings - 20 to 30 years Machinery and equipment - 1 to 6 years Furniture, fixtures and office equipment - 1 to 8 years
The residual values, estimated useful lives and depreciation methods are reviewed and adjusted as appropriate, at each balance sheet date. The effects of any revision are recognised in profit or loss when the changes arise.
(c) Subsequent measurement Subsequent expenditure relating to property and equipment that has already been recognised is added to the carrying amount
of the asset only when it is probable that future economic benefits associated with the item will flow to the Group and the cost of the item can be measured reliably. All other repair and maintenance expenses are recognised in profit or loss when incurred.
(d) Disposal On disposal of an item of property and equipment, the difference between the disposal proceeds and its carrying amount is
recognised in profit or loss when incurred.
2.10 Trade and other payables
Trade and other payables are initially recognised at fair value, and subsequently carried at amortised cost using the effective interest method.
2.11 Provisions
Provisions are recognised when the Group has a present legal or constructive obligation as a result of past events, it is more likely than not that an outflow of resources will be required to settle the obligation and the amount has been reliably estimated. Changes in the estimated timing or amount of the expenditure or discount rate are recognised in profit or loss when the changes arise.
(a) Warranties The warranty provision represents management’s best estimate of probable liability under its product warranties. Management
determines the warranty provision based on known product failures (if any), historical experience, and other currently available evidence.
(b) Provision for legal claims and fees Management records provisions when it is probable that a liability has been incurred and the amount of loss can be reasonably
estimated.

33
CREATIVE TECHNOLOGY LTD AND ITS SUBSIDIARIES
(c) Other provisions Other provisions are measured at the present value of the expenditure expected to be required to settle the obligation using
a pre-tax discount rate that reflects the current market assessment of the time value of money and the risks specific to the obligation. The increase in the provision due to the passage of time is recognised in profit or loss.
2.12 Fairvalueestimationoffinancialassetsandliabilities
The fair values of financial instruments traded in active markets are based on quoted market prices at the balance sheet date. The quoted market prices used for financial assets are the current bid prices; the appropriate quoted market prices for financial liabilities are the current asking prices.
The fair values of financial instruments that are not traded in an active market are determined by using valuation techniques. The Group uses a variety of methods and makes assumptions that are based on market conditions existing at each balance sheet date.
The fair values of current financial assets and liabilities carried at amortised cost approximate their carrying amounts.
2.13 Revenue recognition
Sales comprise the fair value of the consideration received or receivable for the sale of goods in the ordinary course of the Group’s activities. Sales are presented net of value-added tax, rebates and discounts, and after eliminating sales within the Group. The Group recognises revenue when the amount of revenue and related cost can be reliably measured, the Group has delivered the products to the customers, the customers have accepted the products, significant risks and rewards of ownership have been transferred and when it is probable that the collectability of the related receivables is reasonably assured. License income is recognised based on the consideration in relation to the assignment of rights for a fixed fee; this revenue is recognised upon completion of the contract.
Allowances are provided for estimated returns and discounts based on historical experience, current economic trends and changes in customer demand and acceptance of its products. Such allowances are adjusted periodically to reflect actual and anticipated experience. When recognising revenue, the Group records estimated reductions to revenue for customer and distributor programs and incentive offerings, including price protection, promotions, other volume-based incentives and rebates.
2.14 Research and development costs
As the Group cannot definitively distinguish the research phase from the development phase of its internal projects to create intangible assets, the Group treats the expenditure on its internal projects as if they were incurred in the research phase only. Accordingly, all research and development costs are recognised as an expense when incurred.
2.15 Income taxes
Current income tax for current and prior periods is recognised at the amount expected to be paid to or recovered from the tax authorities, using the tax rates and tax laws that have been enacted or substantively enacted by the balance sheet date.
Deferred income tax is recognised for all temporary differences arising between the tax bases of assets and liabilities and their carrying amounts in the financial statements except when the deferred income tax arises from the initial recognition of goodwill or an asset or liability in a transaction that is not a business combination and affects neither accounting nor taxable profit or loss at the time of the transaction.
A deferred income tax liability is recognised on temporary differences arising on investments in subsidiaries and associated companies, except where the Group is able to control the timing of the reversal of the temporary difference and it is probable that the temporary difference will not reverse in the foreseeable future.

34
CREATIVE TECHNOLOGY LTD AND ITS SUBSIDIARIES
For the financial year ended 30 June 2017
A deferred income tax asset is recognised to the extent that it is probable that future taxable profit will be available against which the deductible temporary differences and tax losses can be utilised.
Deferred income tax is measured:
(i) at the tax rates that are expected to apply when the related deferred income tax asset is realised or the deferred income tax liability is settled, based on tax rates and tax laws that have been enacted or substantively enacted by the balance sheet date; and
(ii) based on the tax consequence that will follow from the manner in which the Group expects, at the balance sheet date, to recover or settle the carrying amounts of its assets and liabilities.
Current and deferred income taxes are recognised as income or expense in profit or loss.
2.16 Operating leases
Leases where substantially all risks and rewards incidental to ownership are retained by the lessors are classified as operating leases. Payments made under operating leases (net of any incentives received from the lessors) are recognised in profit or loss on a straight-line basis over the period of the lease. When a lease is terminated before the lease period expires, any payment made (or received) by the Group as penalty is recognised as an expense (or income) when termination takes place.
2.17 Employee compensation
Employee benefits are recognised as an expense, unless the cost qualifies to be capitalised as an asset.
(a) Definedcontributionplans Defined contribution plans are post-employment benefit plans under which the Group pays fixed contributions into separate
entities such as the Central Provident Fund or pension on a mandatory, contractual or voluntary basis. The Group has no further payment obligations once the contributions have been paid.
(b) Share-based compensation Share options The share options plan is an equity-settled, share-based compensation plan. The fair value of the employee services received
in exchange for the grant of options is recognised as an expense in profit or loss with a corresponding increase in share-based compensation reserves over the vesting period. The total amount to be recognised over the vesting period is determined by reference to the fair value of the options granted on the date of the grant. Non-market vesting conditions are included in the estimation of the number of shares under options that are expected to become exercisable on the vesting date. At each balance sheet date, the Group revises its estimates of the number of shares under options that are expected to become exercisable on the vesting date and recognises the impact of the revision of the estimates in profit or loss, with a corresponding adjustment to share-based compensation reserves over the remaining vesting period.
When the options are exercised, the proceeds received (net of transaction costs) and the related balance previously recognised in other reserves are credited to share capital account when new ordinary shares are issued, or to the “treasury shares” account when treasury shares are re-issued to the employees.
NOTES TO THE FINANCIAL STATEMENTS
2. SIGNIFICANT ACCOUNTING POLICIES (cont’d)2.15 Income taxes (cont’d)

35
CREATIVE TECHNOLOGY LTD AND ITS SUBSIDIARIES
Performance shares The performance share plan contemplates the award of fully-paid ordinary shares, their equivalent cash value or combinations
thereof, free of charge, provided that certain prescribed performance targets are met and/or upon expiry of the prescribed vesting periods.
The fair value of employee services received in exchange for the grant of the awards is recognised as a share-based compensation expense in profit or loss with a corresponding increase in the share-based compensation reserves over the vesting period. The amount is determined by reference to the fair value of the performance shares on the grant date.
If the performance target is a market condition, the probability of the performance target being met is taken into account in estimating the fair value of the ordinary shares granted at the grant date. The compensation expense is charged to profit or loss on a basis that fairly reflects the manner in which the benefits will accrue to the employee under the plan over the prescribed vesting periods from date of grant. No adjustments to the amounts charged to profit or loss are made whether or not the market condition is met.
For performance share grants with non-market conditions, the Company revises its estimates of the number of share grants expected to vest and corresponding adjustments are made to profit or loss and share-based compensation reserves.
2.18 Currency translation
(a) Functional and presentation currency Items included in the financial statements of each entity in the Group are measured using the currency of the primary
economic environment in which the entity operates (“functional currency”). The functional currency of the Company is the United States Dollar (“US$”), which reflects the economic environment in which the activities of the Company are largely exposed to. The financial statements are presented in United States Dollar.
(b) Transactions and balances Transactions in a currency other than the United States Dollar (“foreign currency”) are translated into the United States
Dollar using the exchange rates at the dates of the transactions. Currency translation differences from the settlement of such transactions and from the translation of monetary assets and liabilities denominated in foreign currencies at the closing rates at the balance sheet date are recognised in profit or loss.
Non-monetary items measured at fair values in foreign currencies are translated using the exchange rates prevailing at the date when the fair values are determined.
(c) TranslationofGroupentities’financialstatements The results and financial position of all the Group’s entities (none of which has the currency of a hyperinflationary economy)
that have a functional currency different from the presentation currency are translated into the presentation currency by way of assets and liabilities being translated at the closing exchange rates prevailing at the date of the balance sheet, and income and expenses being translated at average exchange rates (unless the average is not a reasonable approximation of the cumulative effect of the rates prevailing on the transaction dates, in which case, income and expenses are translated using the exchange rates at the dates of the transactions).
Goodwill and fair value adjustments arising on the acquisition of foreign operations are treated as assets and liabilities of the foreign operations and translated at the closing rates at the date of the balance sheet.
2.19 Segment reporting
Operating segments are reported in a manner consistent with the internal reporting provided to the chief operating decision-maker.

36
CREATIVE TECHNOLOGY LTD AND ITS SUBSIDIARIES
For the financial year ended 30 June 2017
2.20 Share capital and treasury shares
Ordinary shares are classified as equity. Incremental costs directly attributable to the issuance of new ordinary shares are deducted against the share capital account.
Where the Company’s ordinary shares are repurchased (“treasury shares”), the consideration paid, including any directly attributable incremental cost, is presented as a component within equity attributable to the Company’s equity holders, until they are cancelled, sold or reissued.
When treasury shares are subsequently cancelled, the cost of treasury shares are deducted against the share capital account if the shares are purchased out of capital of the Company, or against the retained earnings of the Company if the shares are purchased out of earnings of the Company.
When treasury shares are subsequently sold or reissued pursuant to the employee share options and performance share plan, the cost of treasury shares is reversed from the treasury share account and the realised gain or loss on sale or reissue, net of any directly attributable incremental transaction costs and related income tax, is recognised in other reserves of the Company.
2.21 Dividends to Company’s shareholders
Dividends to the Company’s shareholders are recognised when the dividends are approved for payment.
3. CRITICAL ACCOUNTING ESTIMATES, ASSUMPTIONS AND JUDGEMENTS
Estimates, assumptions and judgements are continually evaluated and are based on historical experience and other factors, including expectations of future events that are believed to be reasonable under the circumstances.
(a) Revenue recognition Allowances are provided for estimated returns and discounts. Management analyses historical returns, current economic trends and
changes in customer demand and acceptance of its products when evaluating the adequacy of the sales returns allowance. Such allowances are adjusted periodically to reflect actual and anticipated experience. When recognising revenue, the Group records estimated reductions to revenue for customer and distributor programs and incentive offerings, including price protection, promotions, other volume-based incentives and rebates. Significant management judgement and estimates must be used in connection with establishing these allowances in any accounting period. The Group may take action when necessary in response to market conditions to increase customer incentive offerings, possibly resulting in an incremental reduction of revenue at the time the incentive is offered. The Group’s net revenue for the financial year ended 30 June 2017 was US$69,895,000 (2016: US$84,574,000).
(b) Impairment of loans and receivables The Group assesses at each balance sheet date whether there is any objective evidence that a financial asset is impaired.
To determine whether there is objective evidence of impairment, the Group considers factors such as the probability of insolvency or significant financial difficulties of the debtor and default or significant delay in payments.
Where there is objective evidence of impairment, the amount and timing of future cash flows are estimated based on historical loss experience for assets with similar credit risk characteristics.
NOTES TO THE FINANCIAL STATEMENTS
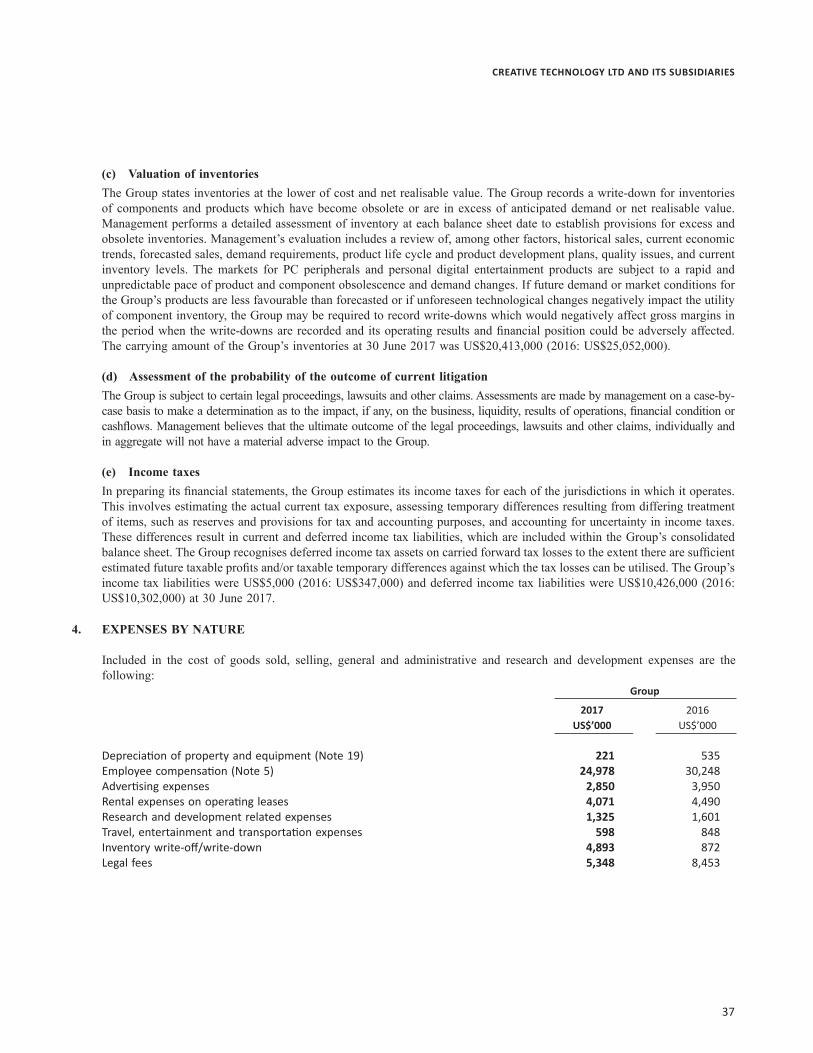
37
CREATIVE TECHNOLOGY LTD AND ITS SUBSIDIARIES
4. EXPENSES BY NATURE
Included in the cost of goods sold, selling, general and administrative and research and development expenses are the following:
Group
2017 2016 US$’000 US$’000
Depreciation of property and equipment (Note 19) 221 535 Employee compensation (Note 5) 24,978 30,248 Advertising expenses 2,850 3,950 Rental expenses on operating leases 4,071 4,490 Research and development related expenses 1,325 1,601 Travel, entertainment and transportation expenses 598 848 Inventory write-off/write-down 4,893 872 Legal fees 5,348 8,453
(c) Valuation of inventories The Group states inventories at the lower of cost and net realisable value. The Group records a write-down for inventories
of components and products which have become obsolete or are in excess of anticipated demand or net realisable value. Management performs a detailed assessment of inventory at each balance sheet date to establish provisions for excess and obsolete inventories. Management’s evaluation includes a review of, among other factors, historical sales, current economic trends, forecasted sales, demand requirements, product life cycle and product development plans, quality issues, and current inventory levels. The markets for PC peripherals and personal digital entertainment products are subject to a rapid and unpredictable pace of product and component obsolescence and demand changes. If future demand or market conditions for the Group’s products are less favourable than forecasted or if unforeseen technological changes negatively impact the utility of component inventory, the Group may be required to record write-downs which would negatively affect gross margins in the period when the write-downs are recorded and its operating results and financial position could be adversely affected. The carrying amount of the Group’s inventories at 30 June 2017 was US$20,413,000 (2016: US$25,052,000).
(d) Assessment of the probability of the outcome of current litigation The Group is subject to certain legal proceedings, lawsuits and other claims. Assessments are made by management on a case-by-
case basis to make a determination as to the impact, if any, on the business, liquidity, results of operations, financial condition or cashflows. Management believes that the ultimate outcome of the legal proceedings, lawsuits and other claims, individually and in aggregate will not have a material adverse impact to the Group.
(e) Income taxes In preparing its financial statements, the Group estimates its income taxes for each of the jurisdictions in which it operates.
This involves estimating the actual current tax exposure, assessing temporary differences resulting from differing treatment of items, such as reserves and provisions for tax and accounting purposes, and accounting for uncertainty in income taxes. These differences result in current and deferred income tax liabilities, which are included within the Group’s consolidated balance sheet. The Group recognises deferred income tax assets on carried forward tax losses to the extent there are sufficient estimated future taxable profits and/or taxable temporary differences against which the tax losses can be utilised. The Group’s income tax liabilities were US$5,000 (2016: US$347,000) and deferred income tax liabilities were US$10,426,000 (2016: US$10,302,000) at 30 June 2017.

38
CREATIVE TECHNOLOGY LTD AND ITS SUBSIDIARIES
For the financial year ended 30 June 2017NOTES TO THE FINANCIAL STATEMENTS
5. EMPLOYEE COMPENSATION Group
2017 2016 US$’000 US$’000 Wages and salaries 22,819 23,940 Employer’s contribution to defined contribution plans including Central Provident Fund 2,208 2,441 Termination benefits – 4,065 Employee share-based expense (Note 26) (49) (198) 24,978 30,248
6. OTHER INCOME Group
2017 2016 US$’000 US$’000 Interest income 430 352 Dividend income – 2 430 354
7. OTHER GAINS Group
2017 2016 US$’000 US$’000 Gain/reclassification on disposal of available-for-sale financial assets 1,346 2,723 Gain on disposal of property and equipment 9 – Litigation settlement – 33,500 Write-back of subcontract accruals – 5,200 Other gains – 115 1,355 41,538
8. OTHER LOSSES Group
2017 2016 US$’000 US$’000 Impairment loss of available-for-sale financial assets (Note 16) 692 945 Loss on disposal of property and equipment – 2 Currency translation loss 682 423 Other losses 6 – 1,380 1,370

39
CREATIVE TECHNOLOGY LTD AND ITS SUBSIDIARIES
9. INCOME TAXES Group
2017 2016 US$’000 US$’000 Tax expense attributable to (loss) profit is made up of:
Current income tax: - Tax expense for current financial year 5 56 - Withholding tax 308 7,888 313 7,944
(Over) under provision in prior financial years : - Current income tax (301) (371) - Deferred income tax (Note 24) – 400 12 7,973
The tax expense on Group’s results differs from the theoretical amount that would arise using the Singapore standard rate of income tax as follows:
Group
2017 2016 US$’000 US$’000 (Loss) profit before income tax (22,861) 10,685
Share of loss of associated companies (326) (724) (Loss) profit before tax and share of loss of associated companies (22,535) 11,409 Tax calculated at tax rate of 17% (2016: 17%) (3,831) 1,940 Effects of - tax exempt loss (income) 418 (4,896) - income not subject to tax (552) (113) - expenses not deductible for tax purposes 166 161 - different tax rates in other countries 57 104 - deferred tax assets not recognised 4,028 3,463 - utilisation of tax losses and other reserves (281) (605) - withholding tax 308 7,888 - (over) under provision in previous financial years (301) 31
Tax expense 12 7,973
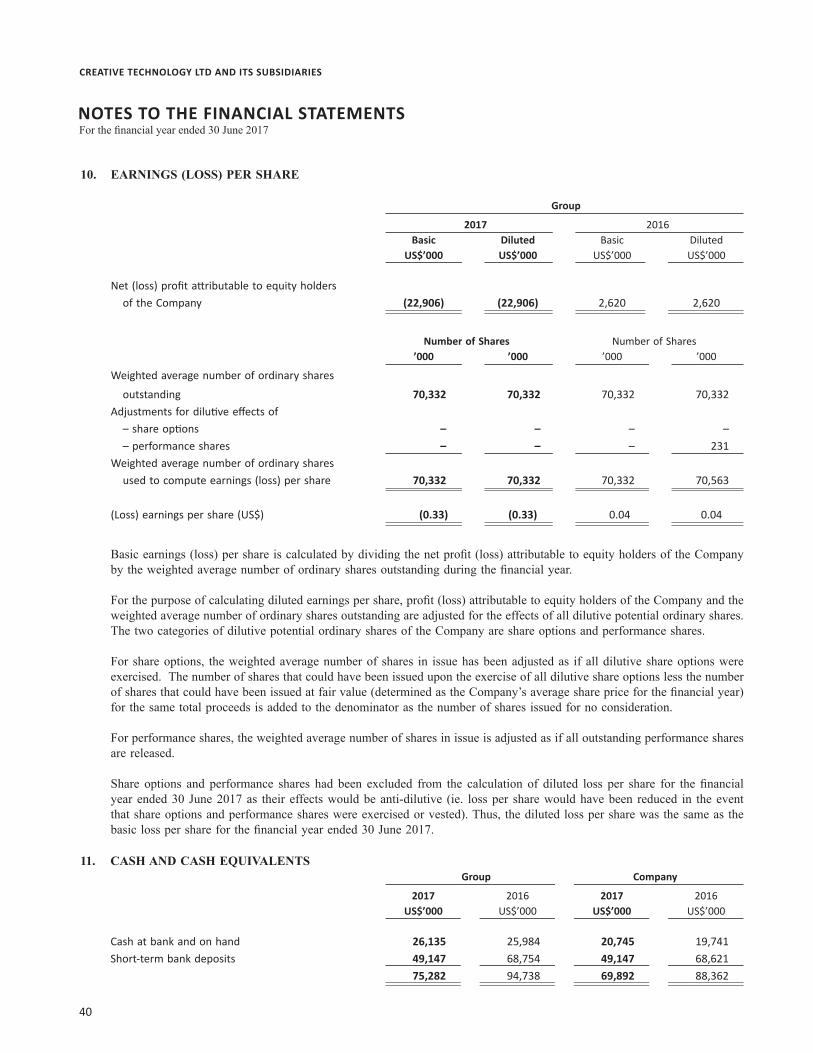
40
CREATIVE TECHNOLOGY LTD AND ITS SUBSIDIARIES
For the financial year ended 30 June 2017NOTES TO THE FINANCIAL STATEMENTS
Basic earnings (loss) per share is calculated by dividing the net profit (loss) attributable to equity holders of the Company by the weighted average number of ordinary shares outstanding during the financial year.
For the purpose of calculating diluted earnings per share, profit (loss) attributable to equity holders of the Company and the weighted average number of ordinary shares outstanding are adjusted for the effects of all dilutive potential ordinary shares. The two categories of dilutive potential ordinary shares of the Company are share options and performance shares.
For share options, the weighted average number of shares in issue has been adjusted as if all dilutive share options were exercised. The number of shares that could have been issued upon the exercise of all dilutive share options less the number of shares that could have been issued at fair value (determined as the Company’s average share price for the financial year) for the same total proceeds is added to the denominator as the number of shares issued for no consideration.
For performance shares, the weighted average number of shares in issue is adjusted as if all outstanding performance shares are released.
Share options and performance shares had been excluded from the calculation of diluted loss per share for the financial year ended 30 June 2017 as their effects would be anti-dilutive (ie. loss per share would have been reduced in the event that share options and performance shares were exercised or vested). Thus, the diluted loss per share was the same as the basic loss per share for the financial year ended 30 June 2017.
10. EARNINGS (LOSS) PER SHARE
Group
2017 2016 Basic Diluted Basic Diluted
US$’000 US$’000 US$’000 US$’000 Net (loss) profit attributable to equity holders of the Company (22,906) (22,906) 2,620 2,620
Number of Shares Number of Shares ’000 ’000 ’000 ’000
Weighted average number of ordinary shares
outstanding 70,332 70,332 70,332 70,332 Adjustments for dilutive effects of – share options – – – – – performance shares – – – 231 Weighted average number of ordinary shares used to compute earnings (loss) per share 70,332 70,332 70,332 70,563
(Loss) earnings per share (US$) (0.33) (0.33) 0.04 0.04
11. CASH AND CASH EQUIVALENTS Group Company
2017 2016 2017 2016 US$’000 US$’000 US$’000 US$’000 Cash at bank and on hand 26,135 25,984 20,745 19,741 Short-term bank deposits 49,147 68,754 49,147 68,621 75,282 94,738 69,892 88,362

41
CREATIVE TECHNOLOGY LTD AND ITS SUBSIDIARIES
13. AMOUNTS DUE FROM (TO) SUBSIDIARIES Company
2017 2016 US$’000 US$’000 Amounts due from subsidiaries - current - Trade 1,994 1,982 - Non-trade 62,740 57,954
64,734 59,936 Less: Allowance for impairment (28,457) (15,957)
36,277 43,979 Amounts due from subsidiaries - non-current - Trade 21,184 21,184 - Non-trade 143,578 154,173
164,762 175,357 Less: Allowance for impairment (143,439) (160,434)
21,323 14,923 Amounts due to subsidiaries - current - Trade (2,950) (3,440) - Non-trade (6,322) (4,885)
(9,272) (8,325) Amounts due to subsidiaries - non-current - Trade (19,105) (19,105) - Non-trade – (11,057)
(19,105) (30,162)
The non-trade amounts due from and due to subsidiaries are interest-free and unsecured.
The current portions of non-trade amounts due from and due to subsidiaries are repayable on demand. There is no fixed repayment terms for the non-current portions of non-trade amounts due from and due to subsidiaries.
Management has assessed the fair values of the non-current amounts due from and due to subsidiaries and concluded that the fair values at balance sheet date approximate carrying values.
12. TRADE RECEIVABLES Group Company
2017 2016 2017 2016 US$’000 US$’000 US$’000 US$’000 Trade receivables - Associated companies – 40 – 40
- Non-related parties 8,640 11,196 1,998 2,235 8,640 11,236 1,998 2,275 Less: Allowance for sales returns and impairment of receivables (2,790) (3,666) (1,805) (2,030)
Trade receivables - net 5,850 7,570 193 245

42
CREATIVE TECHNOLOGY LTD AND ITS SUBSIDIARIES
For the financial year ended 30 June 2017NOTES TO THE FINANCIAL STATEMENTS
14. INVENTORIES Group Company
2017 2016 2017 2016 US$’000 US$’000 US$’000 US$’000 Raw materials 3,754 6,859 2,488 5,041 Finished products 16,659 18,193 1 112
20,413 25,052 2,489 5,153 The cost of inventories recognised in “cost of goods sold” amounts to US$50,302,000 (2016: US$60,481,000).
15. OTHER CURRENT ASSETS Group Company
2017 2016 2017 2016 US$’000 US$’000 US$’000 US$’000 Prepaid expenses and security deposits 731 1,097 401 512 Prepaid non-income taxes 523 512 73 – Other receivables from associated companies – 3 – 3 Other receivables from non-related parties 168 185 123 118
1,422 1,797 597 633
The other receivables from associated companies and non-related parties are unsecured, interest-free and repayable on demand.
16. AVAILABLE-FOR-SALE FINANCIAL ASSETS Group Company
2017 2016 2017 2016 US$’000 US$’000 US$’000 US$’000 Beginning of financial year 11,960 18,239 – – Fair value gains (losses) recognised in other comprehensive income 188 (3,007) – – Additions 1,100 500 – – Disposals (2,934) (2,827) – – Impairment losses (Note 8) (692) (945) – –
End of financial year 9,622 11,960 – – Available-for-sale financial assets are analysed as follows: Group Company
2017 2016 2017 2016 US$’000 US$’000 US$’000 US$’000 Listed equity securities 4,422 4,491 – – Unlisted equity securities 5,200 7,469 – –
9,622 11,960 – –
The Group has recognised impairment losses of US$692,000 (2016: US$945,000) against securities whose fair values were below cost during the financial year.
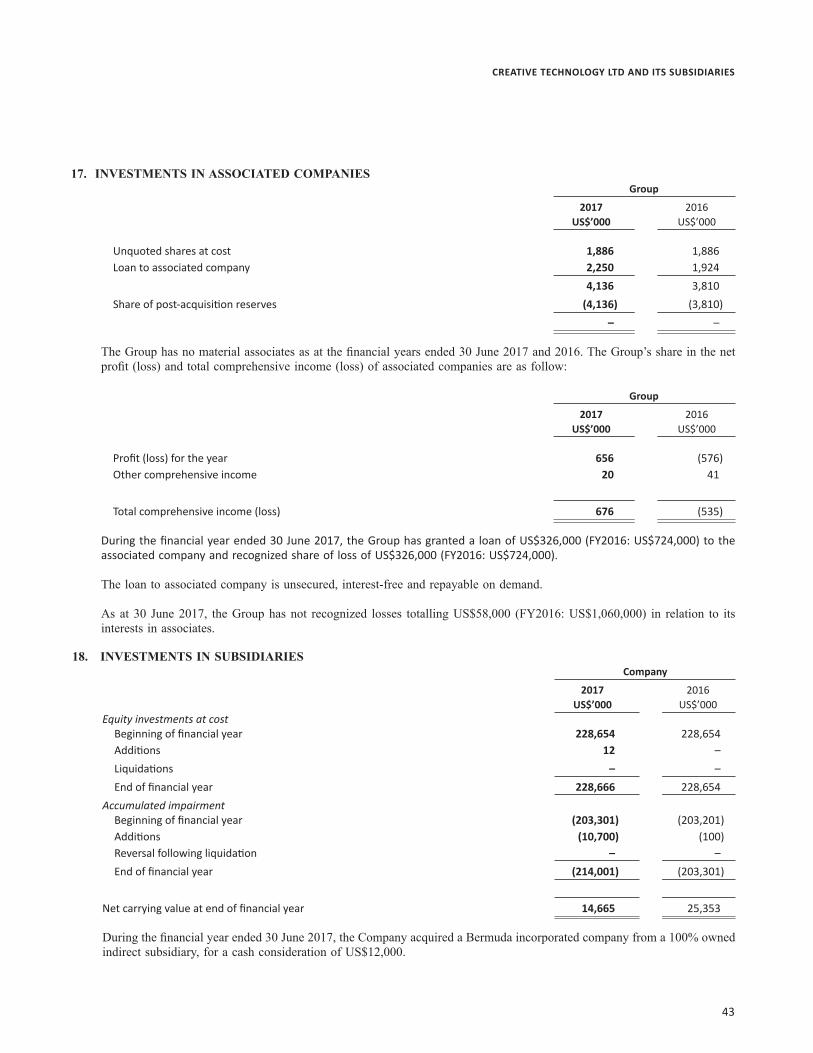
43
CREATIVE TECHNOLOGY LTD AND ITS SUBSIDIARIES
17. INVESTMENTS IN ASSOCIATED COMPANIES Group
2017 2016 US$’000 US$’000
Unquoted shares at cost 1,886 1,886 Loan to associated company 2,250 1,924 4,136 3,810 Share of post-acquisition reserves (4,136) (3,810)
– – The Group has no material associates as at the financial years ended 30 June 2017 and 2016. The Group’s share in the net
profit (loss) and total comprehensive income (loss) of associated companies are as follow:
Group
2017 2016 US$’000 US$’000
Profit (loss) for the year 656 (576) Other comprehensive income 20 41
Total comprehensive income (loss) 676 (535)
During the financial year ended 30 June 2017, the Group has granted a loan of US$326,000 (FY2016: US$724,000) to the associated company and recognized share of loss of US$326,000 (FY2016: US$724,000).
The loan to associated company is unsecured, interest-free and repayable on demand.
As at 30 June 2017, the Group has not recognized losses totalling US$58,000 (FY2016: US$1,060,000) in relation to its interests in associates.
18. INVESTMENTS IN SUBSIDIARIES Company
2017 2016 US$’000 US$’000 Equity investments at cost
Beginning of financial year 228,654 228,654 Additions 12 – Liquidations – – End of financial year 228,666 228,654 Accumulated impairment
Beginning of financial year (203,301) (203,201) Additions (10,700) (100) Reversal following liquidation – – End of financial year (214,001) (203,301)
Net carrying value at end of financial year 14,665 25,353 During the financial year ended 30 June 2017, the Company acquired a Bermuda incorporated company from a 100% owned
indirect subsidiary, for a cash consideration of US$12,000.

44
CREATIVE TECHNOLOGY LTD AND ITS SUBSIDIARIES
For the financial year ended 30 June 2017
19. PROPERTY AND EQUIPMENT
Furniture, Machinery fixtures Leasehold Land and and and office improvements buildings equipment equipment Total US$’000 US$’000 US$’000 US$’000 US$’000 Group 2017 Cost Beginning of financial year 1,191 2,455 2,400 5,426 11,472 Additions 28 – 11 178 217 Disposals – – (67) (301) (368) End of financial year 1,219 2,455 2,344 5,303 11,321
Accumulated depreciation Beginning of financial year 1,186 1,742 2,339 5,335 10,602 Depreciation charge (Note 4) 9 62 32 118 221 Disposals – – (67) (301) (368) End of financial year 1,195 1,804 2,304 5,152 10,455
Net book value End of financial year 24 651 40 151 866
NOTES TO THE FINANCIAL STATEMENTS
Group 2016 Cost Beginning of financial year 2,427 2,455 3,150 12,750 20,782 Additions – – 5 49 54 Disposals (1,236) – (1,136) (6,992) (9,364) Reclassification – – 381 (381) –
End of financial year 1,191 2,455 2,400 5,426 11,472
Accumulated depreciation Beginning of financial year 2,351 1,680 2,839 12,551 19,421 Depreciation charge (Note 4) 71 62 251 151 535 Disposals (1,236) – (1,132) (6,986) (9,354) Reclassification – – 381 (381) – End of financial year 1,186 1,742 2,339 5,335 10,602
Net book value End of financial year 5 713 61 91 870
The impairment loss of US$10,700,000 in the financial year ended 30 June 2017 (2016: US$100,000) reflects the write-down of the carrying amount of the Company’s investments in certain subsidiaries to the recoverable amount following a review of the subsidiaries’ net assets value.
Details of significant subsidiaries are included in Note 37.
18. INVESTMENTS IN SUBSIDIARIES (cont’d)

45
CREATIVE TECHNOLOGY LTD AND ITS SUBSIDIARIES
Company 2017 Cost Beginning of financial year 995 2,295 4,561 7,851Additions – 3 122 125Disposals – (67) (160) (227)
End of financial year 995 2,231 4,523 7,749
Accumulated depreciation Beginning of financial year 995 2,236 4,489 7,720Depreciation charge – 31 82 113Disposals – (67) (160) (227)
End of financial year 995 2,200 4,411 7,606
Net book value End of financial year – 31 112 143
Furniture, Machinery fixtures Leasehold and and office improvements equipment equipment Total US$’000 US$’000 US$’000 US$’000
Company 2016 Cost Beginning of financial year 1,715 3,052 9,380 14,147Additions – 5 16 21Disposals (720) (762) (4,835) (6,317)
End of financial year 995 2,295 4,561 7,851
Accumulated depreciation Beginning of financial year 1,645 2,945 9,188 13,778Depreciation charge 69 50 133 252Disposals (719) (759) (4,832) (6,310)
End of financial year 995 2,236 4,489 7,720
Net book value End of financial year – 59 72 131

46
CREATIVE TECHNOLOGY LTD AND ITS SUBSIDIARIES
For the financial year ended 30 June 2017
20. INTANGIBLE ASSETS Group Company
2017 2016 2017 2016 US$’000 US$’000 US$’000 US$’000
Goodwill arising on consolidation (Note (a)) – – – – Trademarks and licences (Note (b)) – – – –
– – – –
(a) Goodwill arising on consolidation
Group
2017 2016 US$’000 US$’000
Cost Beginning and end of financial year 2,262 2,262 Accumulated amortisation Beginning and end of financial year 2,262 2,262 Net book value – –
NOTES TO THE FINANCIAL STATEMENTS
(b) Trademarks and licences Group Company
2017 2016 2017 2016 US$’000 US$’000 US$’000 US$’000
Cost Beginning of financial year 11,847 11,847 – – Write-off – – – – End of financial year 11,847 11,847 – –
Accumulated amortisation Beginning of financial year 11,847 11,847 – – Write-off – – – – End of financial year 11,847 11,847 – –
Net book value – – – –

47
CREATIVE TECHNOLOGY LTD AND ITS SUBSIDIARIES
21. OTHER NON-CURRENT ASSETS Group Company
2017 2016 2017 2016 US$’000 US$’000 US$’000 US$’000
Security deposits 186 190 – –
186 190 – –
22. TRADE PAYABLES Group Company
2017 2016 2017 2016 US$’000 US$’000 US$’000 US$’000
Trade payables - Non-related parties 9,300 9,651 417 1,588
23. ACCRUED LIABILITIES AND PROVISIONS Group Company
2017 2016 2017 2016 US$’000 US$’000 US$’000 US$’000 Marketing accruals 2,494 3,613 68 68 Payroll accruals 3,058 3,209 1,321 1,408 Warranty (Note (a)) 354 583 – – Restructuring (Note (b)) 1,002 989 281 281 Royalty accruals 306 2,006 126 84 Legal claims and fees (Note (c)) 6,474 5,971 5,750 5,750 Deposits and other creditors 1,953 2,146 352 936 Freight and duty accruals 211 222 – – Professional fees accruals 649 705 410 449 Other accruals 2,976 3,933 1,861 2,492
19,477 23,377 10,169 11,468
(a) Warranty The warranty period for the bulk of the products typically ranges between 1 to 2 years. The product warranty provision
reflects management’s best estimate of probable liability under its product warranties. Management determines the warranty provision based on known product failures (if any), historical experience, and other currently available evidence.

48
CREATIVE TECHNOLOGY LTD AND ITS SUBSIDIARIES
For the financial year ended 30 June 2017
Movements in provision for warranty are as follows:
Group Company
2017 2016 2017 2016 US$’000 US$’000 US$’000 US$’000
Beginning of financial year 583 793 – 792 Provision (write-back) made (51) 331 – (652)
Provision utilised (178) (541) – (140) End of financial year 354 583 – –
(b) Restructuring
Movements in provision for restructuring are as follows:
Group Company
2017 2016 2017 2016 US$’000 US$’000 US$’000 US$’000
Beginning of financial year 989 1,343 281 281 Currency translation difference 13 (91) – – Provision utilised – – – – Provision written back – (263) – –
End of financial year 1,002 989 281 281
NOTES TO THE FINANCIAL STATEMENTS
23. ACCRUED LIABILITIES AND PROVISIONS (cont’d)(a) Warranty (cont’d)
(c) Legal claims and fees The provision for legal claims is in respect of certain legal claims brought against the Group. In the opinion of management,
after taking appropriate legal advice, the outcomes of these legal claims are not expected to give rise to any significant loss beyond the amounts provided at 30 June 2017. Management considers that disclosure of further details of these claims will seriously prejudice the Group’s negotiating position and accordingly, further information on the nature of the obligation has not been provided.

49
CREATIVE TECHNOLOGY LTD AND ITS SUBSIDIARIES
24. DEFERRED INCOME TAX LIABILITIES Movements in deferred income tax account are as follows:
Group Company
2017 2016 2017 2016 US$’000 US$’000 US$’000 US$’000
Beginning of financial year 10,302 9,902 – – Currency translation difference 156 – – – Provision utilised (32) – – – Additional provision in prior financial – 400 – – years (Note 9) End of financial year 10,426 10,302 – –
Deferred income tax liabilities (assets) consist of the following:
Group 2017 Beginning of financial year – 10,302 10,302 – 10,302 Currency translation difference – 156 156 156 Provision utilised – (32) (32) – (32)
End of financial year – 10,426 10,426 – 10,426 2016
Beginning of financial year 5,388 9,902 15,290 (5,388) 9,902 (Over) additional provision (5,388) 400 (4,988) 5,388 400
End of financial year – 10,302 10,302 – 10,302
Net deferred tax liabilities
US$’000
Unremitted offshore interest incomeUS$’000
Transfer pricing
and withholding tax
US$’000
Totaldeferred
tax liabilitiesUS$’000
Deferredtax assests-tax lossesUS$’000

50
CREATIVE TECHNOLOGY LTD AND ITS SUBSIDIARIES
For the financial year ended 30 June 2017
The deferred income tax liabilities/assets are expected to be settled/recovered after one year.
Deferred income tax assets are recognised for tax losses and other reserves carried forward to the extent that realisation of the related tax benefits through future taxable profit is probable.
Respectively, the Group and the Company have unrecognised tax losses of approximately US$709,000,000 and US$424,000,000 (2016: US$682,000,000 and US$406,000,000) at the balance sheet date which can be carried forward and used to offset against future taxable income subject to meeting certain statutory requirements by those companies with unrecognised tax losses in their respective countries of incorporation. Approximately US$198,000,000 of the Group’s tax losses expire between 2018 and 2037. The Group also has United States tax deductions not included in unrecognised tax losses of approximately US$60,000,000 (2016: US$60,000,000) as a result of the exercise of employee share options of which the tax benefit has not been realised. The tax benefit of the deductions, when realised will be accounted for as a credit to other reserves rather than a reduction of the income tax expense.
NOTES TO THE FINANCIAL STATEMENTS
24. DEFERRED INCOME TAX LIABILITIES (cont’d)
Company 2017 Beginning and end of financial year – – – –
2016
Beginning of financial year 5,388 5,388 (5,388) – Over provision (5,388) (5,388) 5,388 –
End of financial year – – – –
Net deferred tax liabilities
US$’000
Unremitted off-shore
interest incomeUS$’000
Totaldeferred
tax liabilitiesUS$’000
Deferredtax assests-tax lossesUS$’000

51
CREATIVE TECHNOLOGY LTD AND ITS SUBSIDIARIES
25. SHARE CAPITAL AND TREASURY SHARES Number of ordinary shares Amount
Issued share Treasury Share Treasury capital shares capital shares
’000 ’000 US$’000 US$’000 Group and Company 2017 Beginning and end of financial year 75,000 (4,668) 266,753 (16,262) 2016 Beginning and end of financial year 75,000 (4,668) 266,753 (16,262)
All issued ordinary shares are fully paid. There is no par value for these ordinary shares.
(a) Treasury shares No shares were acquired in the financial years ended 30 June 2017 and 2016.
The Company did not issue any treasury shares pursuant to the Creative Technology (1999) Share Option Scheme (“1999 Scheme”) in the financial years ended 30 June 2017 and 30 June 2016.
For the financial year ended 30 June 2017, the Company did not issue any treasury shares (2016: nil) pursuant to the Creative Performance Share Plan.
(b) Share options The Creative Technology (1999) Share Option Scheme (“1999 Scheme”) was approved by shareholders at an Extraordinary
General Meeting on 30 December 1998 which allows options to be granted to full-time employees as well as consultants and non-executive directors. The total number of shares that may be granted under the 1999 Scheme was 7.5 million, provided that such amount shall be automatically increased on the first day (1 July) of each of the five financial years ended 30 June 2001, 2002, 2003, 2004 and 2005 by four percent of the issued share capital of the Company as at the last day of the immediate preceding financial year. The Option Committee has the discretion to decide the vesting schedule in the letter of offer. If it is not specifically stated in the letter of offer, 1/4 of the total amount of the grant vests on the first anniversary of the grant date and 1/48 of the total amount of the grant vests on the last day of each calendar month thereafter.
The exercise price of the options is determined at the average of the closing prices of the Company’s shares as quoted on the SGX-ST or the National Association of Securities Dealers Automated Quotations (“NASDAQ”) for five market days preceding the date of the grant.
Options expire after the tenth anniversary of the date of grant, except in the case of options granted to participants other than employees, options expire not later than the fifth anniversary of the date of grant. Effective 12 November 2007, amendments were made to the 1999 Scheme to allow the use of treasury shares to satisfy share based exercises. The options under the 1999 Scheme do not entitle the holders of the options, by virtue of such holdings, to any right to participate in any share issue of any other company.
The 1999 Scheme expired on 29 December 2008 but the existing options granted prior to the expiry date will continue to vest according to the terms and conditions of the 1999 Scheme and the respective grants.

52
CREATIVE TECHNOLOGY LTD AND ITS SUBSIDIARIES
For the financial year ended 30 June 2017
2017 2016
Weighted Weighted average average Number of remaining Number of remaining shares contractual shares contractual Range of outstanding term outstanding term exercise prices (‘000) (in years) (‘000) (in years)
US$3.00 to US$4.99 1,014 0.50 1,092 1.50
(c) Performance shares The Creative Performance Share Plan (the “Plan”) was approved by shareholders at an Extraordinary General Meeting on 29
October 2009 under which awards (the “Award”) of fully-paid shares, their equivalent cash value or combinations thereof, will be issued free of charge, to eligible employees and non-executive directors of the Company and its subsidiaries, provided that certain prescribed performance targets are met and/or upon expiry of the prescribed vesting periods.
On 31 March 2010, 2,793,600 performance shares were granted subject to the terms and conditions of the Plan. Of the total performance shares granted, 716,950 shares were vested immediately on the date of grant.
NOTES TO THE FINANCIAL STATEMENTS
25. SHARE CAPITAL AND TREASURY SHARES (cont’d)(b) Share options (cont’d)
Number of Weighted average options exercise price (’000) (US$)
Outstanding at 30 June 2015 2,125 5.54 Exercised – – Cancelled/Forfeited/Expired (1,033) 6.43
Outstanding at 30 June 2016 1,092 4.70 Exercised – – Cancelled/Forfeited/Expired (78) 4.70 Outstanding at 30 June 2017 1,014 4.70
Exercisable at 30 June 2017 1,014 4.70
There were no options exercised during the financial years ended 30 June 2017 and 2016.
The options outstanding as at 30 June 2017 and 30 June 2016 were in the following exercise price ranges:
Movements in the number of unissued ordinary shares under option and their exercise prices were as follows:

53
CREATIVE TECHNOLOGY LTD AND ITS SUBSIDIARIES
Number of Fair value Expected Dividend Risk-free Share price Grant Vesting shares per share volatility yield interest rate at grant date date date (‘000) US$ % % % US$
31.3.2010 31.3.2011 514.5 3.49 56.07 1.99 0.45 3.57 31.3.2010 31.3.2012 514.5 3.40 56.07 1.99 0.62 3.57 31.3.2010 31.3.2013 514.5 3.33 56.07 1.99 0.72 3.57 31.3.2010 31.3.2014 514.5 3.29 56.07 1.99 1.08 3.57
Movements in the number of performance shares are as follows:
Outstanding Outstanding at Vested and at Grant 1 July 2016 Granted released Cancelled 30 June 2017 date (‘000) (‘000) (‘000) (‘000) (‘000)
31 March 2010 231 – – (13) 218
Outstanding Outstanding at Vested and at Grant 1 July 2015 Granted released Cancelled 30 June 2016 date (‘000) (‘000) (‘000) (‘000) (‘000)
31 March 2010 285 – – (54) 231
There were no shares released during the financial years ended 30 June 2017 and 2016.
26. OTHER RESERVES Group Company
2017 2016 2017 2016 US$’000 US$’000 US$’000 US$’000
(a) Composition: Capital reserves 19,932 19,932 6,951 6,951 Share-based compensation reserves (Note (b)) 42,383 42,432 27,900 27,949 62,315 62,364 34,851 34,900
Capital reserves arose from changes of interests in the group companies in prior financial years. Share-based compensation reserves comprised mainly of compensation expense for share options, tax benefits relating to exercise of non-qualified share options by US employees, performance share plans and Chairman’s gift of shares to employees.
There were no awards granted under the Plan during the financial years ended 30 June 2017 and 2016. However, as at 30 June 2017, the Committee has extended the performance period till 31 December 2017 for 218,000 performance shares granted on 31 March 2010 that were subject to the achievement of prescribed performance targets.
The fair value of the performance shares is determined at the grant date using the Monte Carlo simulation model which involves projecting future outcomes based on statistical distributions of key random variables including share price and volatility of returns.
The fair values and assumption inputs used in the model are as follows:
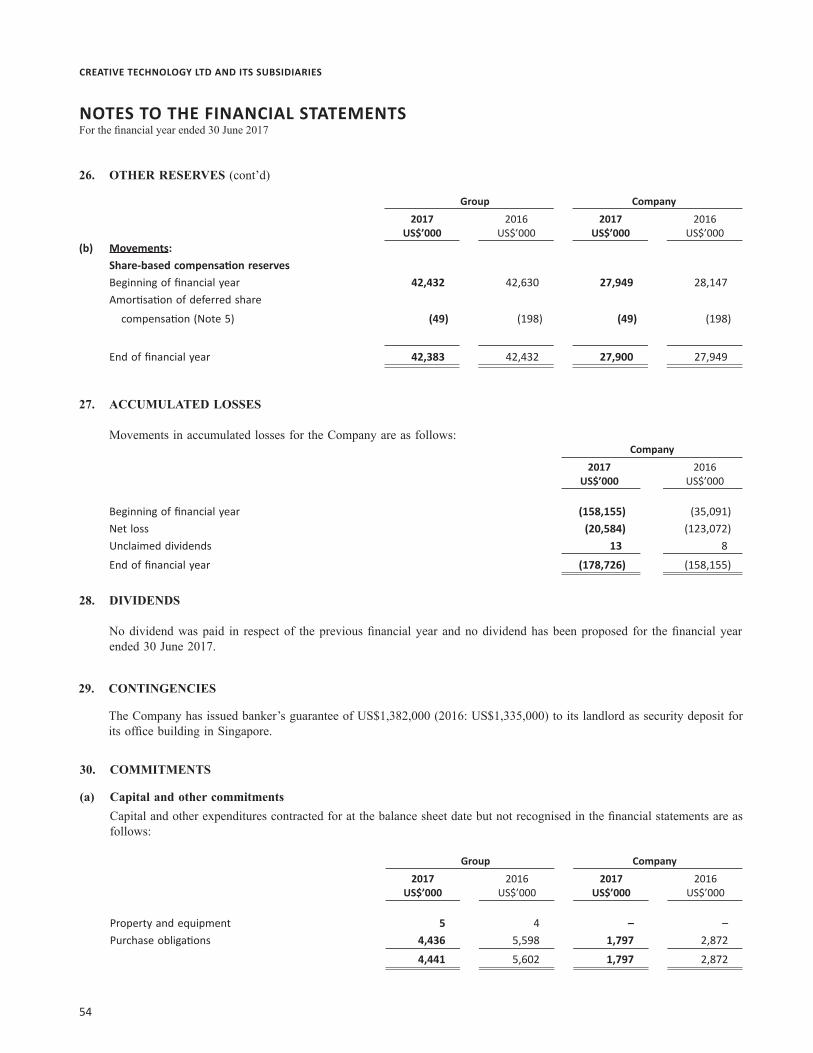
54
CREATIVE TECHNOLOGY LTD AND ITS SUBSIDIARIES
For the financial year ended 30 June 2017
Group Company 2017 2016 2017 2016
US$’000 US$’000 US$’000 US$’000(b) Movements: Share-based compensation reserves Beginning of financial year 42,432 42,630 27,949 28,147 Amortisation of deferred share
compensation (Note 5) (49) (198) (49) (198)
End of financial year 42,383 42,432 27,900 27,949
27. ACCUMULATED LOSSES
Movements in accumulated losses for the Company are as follows: Company 2017 2016
US$’000 US$’000 Beginning of financial year (158,155) (35,091) Net loss (20,584) (123,072) Unclaimed dividends 13 8
End of financial year (178,726) (158,155)
NOTES TO THE FINANCIAL STATEMENTS
28. DIVIDENDS
No dividend was paid in respect of the previous financial year and no dividend has been proposed for the financial year ended 30 June 2017.
29. CONTINGENCIES
The Company has issued banker’s guarantee of US$1,382,000 (2016: US$1,335,000) to its landlord as security deposit for its office building in Singapore.
26. OTHER RESERVES (cont’d)
30. COMMITMENTS
(a) Capital and other commitments Capital and other expenditures contracted for at the balance sheet date but not recognised in the financial statements are as
follows:
Group Company 2017 2016 2017 2016
US$’000 US$’000 US$’000 US$’000 Property and equipment 5 4 – – Purchase obligations 4,436 5,598 1,797 2,872
4,441 5,602 1,797 2,872

55
CREATIVE TECHNOLOGY LTD AND ITS SUBSIDIARIES
(b) Operating lease commitments – where the Group is a lessee The Group leases office space from non-related parties under non-cancellable operating lease agreements. The leases have
varying terms, escalation clauses and renewal rights.
The future minimum lease payables under non-cancellable operating leases contracted for at the balance sheet date but not recognised as liabilities, are as follows:
Group 2017 2016
US$’000 US$’000 Not later than one year 3,857 3,569 Between one and five years 7,008 3,835 Later then five years 1,755 –
12,620 7,404
31. FINANCIAL RISK MANAGEMENT
The Group is exposed to financial risks arising from its operations and the use of financial instruments. The Group’s principal financial instruments, other than foreign exchange contracts, comprise investments, cash at bank and short-term bank deposits. All financial transactions with the banks are duly accepted with Board of Directors’ resolutions, with banking mandates, which define the permitted financial instruments and facility limits, approved by the Board of Directors. The Group has various other financial assets and liabilities such as trade receivables and trade payables, which arise directly from its operations.
It is the Group’s policy not to engage in foreign exchange and/or derivatives speculation or trading or enter into any complex foreign exchange or derivatives transactions. From time to time, the Group enters into forward exchange contracts to reduce its exposure to currency translation gains and losses.
The main financial risks arising from the Group’s operations and the use of financial instruments are market risk (including price risk, interest rate risk and currency risk), credit risk and liquidity risk. Management does not view the Company on a standalone basis and therefore all risks relevant to the Group are considered and managed at the Group level. The policies for managing each of these risks at the Group level are summarised below.
(a) Market risk(i) Price risk As part of its long-term business strategy, from time to time, the Group makes strategic equity investments in companies
that can provide the Group with technologies or products that management believes will give the Group a competitive advantage in the markets in which the Group competes. The Group has strategic investments in quoted equity shares. The Group manages the risk of unfavourable changes by cautious review of the investments before investing and continuous monitoring of the performance of investments held and assessing market risk relevant to which the investments operate. The market value of these investments will fluctuate with market conditions. The table below summarises the impact to the Group’s fair value reserve in equity arising as a result of a 10% increase/decrease in prices of quoted equity securities. This analysis assumes that all other variables remain constant.
Equity 10% increase 10% decrease
US$’000 US$’000 Group 2017 Quoted equity securities 442 (442)
2016 Quoted equity securities 449 (449)

56
CREATIVE TECHNOLOGY LTD AND ITS SUBSIDIARIES
For the financial year ended 30 June 2017NOTES TO THE FINANCIAL STATEMENTS
(ii) Interest rate risk The Group has balances placed with reputable banks and financial institutions. The Group manages its interest rate risks
on its interest income by placing the cash balances in varying maturities and interest rate terms with due consideration to operating cash flow requirements and optimising yield.
(iii) Currency risk The functional currency of the companies in the Group is predominantly the US dollar and accordingly, gains and losses resulting
from the translation of financial assets and liabilities denominated in currencies other than the US dollar are reflected in the determination of net profit (loss). From time to time, the Group enters into forward exchange contracts to reduce its exposure to currency translation gains and losses. Forward exchange contracts are marked to market each period and the resulting gains and losses are included in the determination of net profit (loss). No forward exchange contracts were outstanding as at 30 June 2017 and 30 June 2016.
The Group’s currency exposure is as follows:
31. FINANCIAL RISK MANAGEMENT (cont’d)(a) Market risk (cont’d)
USD SGD EUR GBP Others Total US$’000 US$’000 US$’000 US$’000 US$’000 US$’000 Group 2017 Financial assets Cash and cash equivalents 52,718 1,378 10,150 3,402 7,634 75,282 Available-for-sale financial assets 5,374 4,248 – – – 9,622 Trade receivables 3,080 141 2,226 56 347 5,850 Other receivables 73 59 – 2 34 168 Other financial assets - deposits 143 50 75 – 75 343
Receivables from subsidiaries 458,231 30,457 6,526 73 357 495,644
519,619 36,333 18,977 3,533 8,447 586,909 Financial liabilities Financial liabilities (20,283) (5,309) (2,844) (46) (295) (28,777) Payables to subsidiaries (458,231) (30,457) (6,526) (73) (357) (495,644) (478,514) (35,766) (9,370) (119) (652) (524,421)
Net financial assets 41,105 567 9,607 3,414 7,795 62,488
10% strengthened Other Profit and comprehensive loss income US$’000 US$’000 (368) 425 961 – 341 – 780 – 466 444 1,032 – 354 – 503 –

57
CREATIVE TECHNOLOGY LTD AND ITS SUBSIDIARIES
10% weakened Other
Profit and comprehensive loss income US$’000 US$’000
Group 2017 SGD against USD 368 (425) EUR against USD (961) – GBP against USD (341) – Others against USD (780) – 2016 SGD against USD (466) (444) EUR against USD (1,032) – GBP against USD (354) – Others against USD (503) –
A change of 10% in foreign currency exchange rates relative to US$ at the reporting date would increase/(decrease) profit (loss) before tax by the amounts shown below. This analysis assumes that all other variables remain constant.
(b) Credit risk Credit risk refers to the risk that a counterparty will default on its contractual obligations resulting in financial loss to the
Group. Financial instruments that potentially subject the Group to significant concentrations of credit risk consist principally of cash and cash equivalents and trade receivables. The Group deals only with financial institutions with high credit ratings and limits the amount of credit exposure to any one financial institution. The Group sells its products to original equipment manufacturers, distributors and key retailers. The Group believes that the concentration of credit risk in its trade receivables is substantially mitigated due to performance of ongoing credit evaluations of its customers’ financial condition, use of short collection terms, use of letters of credit in certain circumstances, procurement of credit insurance coverage and the geographical dispersion of sales. The Group establishes allowances for doubtful accounts, returns and discounts for specifically identified doubtful accounts, returns and discounts based on credit profiles of its customers, current economic trends, contractual terms and conditions and historical payment, returns and discount experience.
USD SGD EUR GBP Others Total US$’000 US$’000 US$’000 US$’000 US$’000 US$’000 2016 Financial assets Cash and cash equivalents 64,609 10,005 11,800 3,402 4,922 94,738 Available-for-sale financial assets 7,525 4,435 – – – 11,960 Trade receivables 4,726 274 2,127 112 331 7,570 Other receivables 95 62 3 – 28 188 Other financial assets - deposits 143 236 66 22 81 548
Receivables from subsidiaries 467,034 31,265 6,381 54 392 505,126
544,132 46,277 20,377 3,590 5,754 620,130 Financial liabilities Financial liabilities (23,103) (5,913) (3,681) – (331) (33,028) Payables to subsidiaries (467,034) (31,265) (6,381) (54) (392) (505,126) (490,137) (37,178) (10,062) (54) (723) (538,154)
Net financial assets 53,995 9,099 10,315 3,536 5,031 81,976
10% strengthened Other Profit and comprehensive loss income US$’000 US$’000 (368) 425 961 – 341 – 780 – 466 444 1,032 – 354 – 503 –

58
CREATIVE TECHNOLOGY LTD AND ITS SUBSIDIARIES
For the financial year ended 30 June 2017NOTES TO THE FINANCIAL STATEMENTS
31. FINANCIAL RISK MANAGEMENT (cont’d)(b) Credit risk (cont’d)
Group 2017 2016
US$’000 US$’000 Past due 1 to 60 days 326 612 Past due 61 to 120 days 59 72 Past due over 120 days 555 331 940 1,015
The carrying amount of trade receivables individually determined to be impaired and the movements in the related allowance for impairment are as follows:
Group 2017 2016 US$’000 US$’000 Past due 1 to 60 days 67 1 Past due 61 to 120 days 27 111 Past due over 120 days 1,926 2,623 2,020 2,735 Less: Allowance for impairment (2,020) (2,735) – – Beginning of financial year 2,735 3,138 Currency translation differences – (7) Allowance write-back (95) (149) Allowance utilised (620) (247) End of financial year 2,020 2,735
The impaired trade receivables arose mainly from sales to customers who significantly delayed their payments.
(c) Liquidity risk To manage liquidity risk, the Group monitors its net operating cash flows and maintains an adequate level of cash and cash
equivalents and secured committed funding facilities from financial institutions. In assessing the adequacy of these funding facilities, management reviews its working capital requirements regularly.
As at 30 June 2017 and 30 June 2016, the Group’s financial liabilities mature in less than 1 year’s time.
The maximum exposure to credit risk for each class of financial instruments is the carrying amount of that class of financial instruments presented on the balance sheet.
As at 30 June 2017, there were no significant concentrations of credit risk and only 2 customers (2016: 2) individually accounted for 10% or more of net accounts receivable.
Bank deposits that are neither past due nor impaired are mainly deposits with banks with high credit-ratings assigned by international credit-rating agencies. Trade receivables that are neither past due nor impaired are substantially companies with a good collection track record with the Group.
There is no other class of financial assets that is past due and/or impaired except for trade receivables.
The age analysis of trade receivables past due but not impaired is as follows:

59
CREATIVE TECHNOLOGY LTD AND ITS SUBSIDIARIES
US$’000 Level 1 Level 2 Level 3 Total
Group 2017 Available-for-sale financial assets – Listed equity securities 4,422 – – 4,422
– Unlisted equity securities – – 5,200 5,200
4,422 – 5,200 9,622
2016 Available-for-sale financial assets – Listed equity securities 4,491 – – 4,491
– Unlisted equity securities – – 7,469 7,469
4,491 – 7,469 11,960 Fair values for listed equity securities are determined using quoted market prices at the balance sheet date. These instruments
are included in Level 1.
Fair values for unlisted equity securities are determined by using net asset values which approximate the fair value of the investments. These instruments are included in Level 3.
The changes in Level 3 instruments are as follows:
(d) Capital risk The Group’s and Company’s objectives when managing capital, which is total equity, are to safeguard the Group’s and Company’s
ability to continue as a going concern and to maintain an optimal capital structure so as to maximise shareholder value. In order to maintain or achieve an optimal capital structure, the Group and Company may adjust the amount of dividend payment, return capital to shareholders, issue new shares, buy back issued shares or obtain new borrowings.
As at 30 June 2017 and 2016, the Group and Company does not have any outstanding bank borrowings and the Group and Company is not subject to any externally imposed capital requirements.
(e) Fair value measurements The following table presents assets and liabilities measured at fair value and classified by level of the following fair value
measurement hierarchy:
(a) quoted prices (unadjusted) in active markets for identical assets or liabilities (Level 1); (b) inputs other than quoted prices included within Level 1 that are observable for the asset or liability, either directly (ie.
as prices) or indirectly (ie. derived from prices) (Level 2); and (c) inputs for the asset or liability that are not based on observable market data (unobservable inputs) (Level 3).
Group 2017 2016
US$’000 US$’000
Group Beginning of financial year 7,469 7,391 Purchase of level 3 securities 1,100 500 Disposals (2,934) (2,760) Fair value gain recognised in - other comprehensive income 65 2,338
Impairment losses (500) – End of financial year 5,200 7,469

60
CREATIVE TECHNOLOGY LTD AND ITS SUBSIDIARIES
For the financial year ended 30 June 2017NOTES TO THE FINANCIAL STATEMENTS
32. RELATED PARTY TRANSACTIONS
In addition to the information disclosed elsewhere in the financial statements, the following transactions took place between the Group and related parties at terms agreed between the parties:
(a) Sales and purchases of goods and services Group
2017 2016 US$’000 US$’000
Sales of goods and/or services to associated companies 655 1,052
Purchases of goods and/or services from associated companies – 32 Outstanding balances arising from sale/purchase of goods and services, are set out in Notes 12 and 15.
(b) Key management personnel compensation Key management personnel compensation is as follows: Group
2017 2016 US$’000 US$’000
Short-term employees benefits 999 1,016 Employer’s contribution to defined contribution plans including Central Provident Fund 56 52 1,055 1,068
Included in the above is total compensation to the Chairman and Chief Executive Officer of the Company amounting to S$1 (2016: S$1).
33. SEGMENT INFORMATION
Management determines the operating segments based on the reports reviewed and used by the chief operating decision-maker (“CODM”) to make strategic decisions.
The CODM considers the business from a geographic segment perspective. Geographically, management considers the performance of the business of the sale of advanced multimedia solutions for personal computers and personal digital entertainment products in Asia Pacific, Europe and The Americas.
The reportable operating segments derive their revenue primarily from the sale of advanced multimedia solutions for personal computers and personal digital entertainment products. In addition, services within Asia Pacific include investment holding and this is included within the reportable operating segment as it is included in the reports provided to the CODM.
(f) Financial instruments by category The carrying amount of the different categories of financial instruments is as disclosed on the face of the balance sheet and
in Note 11, Note 12, Note 13, Note 15, Note 16, Note 21, Note 22 and Note 23 to the financial statements.
31. FINANCIAL RISK MANAGEMENT (cont’d)

61
CREATIVE TECHNOLOGY LTD AND ITS SUBSIDIARIES
Other segment items Additions to - property and equipment 53 – 1 54 Depreciation 466 66 3 535 Impairment of available-for-sale financial assets (945) – – (945)
Segment assets 131,341 7,461 3,375 142,177
Segment liabilities 27,194 3,785 12,698 43,677
Asia Pacific The Americas Europe Total US$’000 US$’000 US$’000 US$’000
Group 2017 Sales 38,025 9,607 22,263 69,895
(Loss) profit after total expenses (23,495) 524 31 (22,940) Other income 429 1 – 430 Other gains 1,355 – – 1,355 Other losses (1,157) – (223) (1,380)
Share of loss of associated companies (326) – – (326) (Loss) profit before income tax (23,194) 525 (192) (22,861) Income tax (expense) credit (299) (170) 457 (12)
Net (loss) profit (23,493) 355 265 (22,873)
Other segment items Additions to - property and equipment 186 – 31 217 Depreciation 145 65 11 221 Impairment of available-for-sale financial assets (692) – – (692)
Segment assets 104,132 6,162 3,347 113,641
Segment liabilities 24,013 3,740 11,455 39,208
The segment information provided to the CODM for the reportable segments is as follows:
Group 2016 Sales 42,459 14,608 27,507 84,574
(Loss) profit after total expenses (31,086) 806 1,167 (29,113) Other income 337 1 16 354 Other gains 41,438 – 100 41,538 Other losses (1,076) (1) (293) (1,370)
Share of loss of associated companies (724) – – (724) Profit before income tax 8,889 806 990 10,685 Income tax (expense) credit (7,301) 335 (1,007) (7,973)
Net profit (loss) 1,588 1,141 (17) 2,712

62
CREATIVE TECHNOLOGY LTD AND ITS SUBSIDIARIES
For the financial year ended 30 June 2017NOTES TO THE FINANCIAL STATEMENTS
33. SEGMENT INFORMATION (cont’d)
Group 2017 2016
US$’000 US$’000 Audio, speakers and headphones 64,068 77,779 Personal digital entertainment 4,077 2,774 Other products 1,750 4,021 69,895 84,574
There was no customer who accounted for 10% or more of net revenues for the current and prior financial years.
Summary of property and equipment by country:
Group 2017 2016
US$’000 US$’000 Singapore 30,798 35,673 United States of America 9,607 14,608 Ireland 22,263 27,507 Other countries 7,227 6,786
69,895 84,574
Summary of net sales by product category:
Group 2017 2016
US$’000 US$’000 Singapore 187 145 United States of America 653 719 Ireland 21 1 Other countries 5 5
866 870
The revenue reported to the CODM excludes sales between segments. The revenue from external parties reported to the CODM is measured in a manner consistent with that in profit or loss. Geographic revenue information for the financial years ended 30 June 2017 and 30 June 2016 is based on the location of the selling entity.
The CODM assesses the performance of the operating segments based on net profit or loss. This is the measure reported to the CODM for the purposes of resource allocation and assessment of segment performance.
The amounts provided to the CODM with respect to total assets are measured in a manner consistent with that of the financial statements. For the purposes of monitoring segment performance and allocating resources between segments, the CODM monitors the total assets attributable to each segment. All assets are allocated to reportable segments.
The amounts provided to the CODM with respect to total liabilities are measured in a manner consistent with that of the financial statements. These liabilities are allocated based on the operations of the segment. All liabilities are allocated to reportable segments.
Summary of net sales by country:

63
CREATIVE TECHNOLOGY LTD AND ITS SUBSIDIARIES
34. EVENTS OCCURRING AFTER BALANCE SHEET DATE
Subsequent to the financial year ended 30 June 2017: (i) A wholly owned subsidiary, ZiiLabs Inc., Ltd (“ZiiLabs”), has entered into an agreement with a patent aggregator and
as a result, has settled ZiiLabs’ patent infringement lawsuits filed in the United States during the financial year ended 30 June 2017. As part of the agreement, ZiiLabs has received payment of US$31,200,000 in July 2017 and assigned certain rights to the patent aggregator.
(ii) The Singapore High Court has ruled in favor of the Company and it’s subsidiary Qmax Communications Pte Ltd(“QMax”) in respect of legal proceedings that the Company and QMax had initiated during the financial year ended 30 June 2012 against an equipment vendor to recover damages and losses suffered in relation to a wireless broadband project.
The Singapore High Court has ordered the equipment vendor to pay the Company and QMax judgement sums of
approximately US$9,300,000 and S$15,600,000 with interest at the rate of 5.33% from 20 January 2012 to the date of the satisfaction of the judgement.
The equipment vendor has filed a Notice of Appeal against the judgement to the Singapore Court of Appeal.
35. NEW OR REVISED ACCOUNTING STANDARDS AND INTERPRETATIONS
Below are the mandatory standards, amendments and interpretations to existing standards that have been published, and are relevant for the Group’s accounting periods beginning on or after 1 July 2017 and which the Group has not early adopted:
• FRS 115 Revenue from contracts with customers (effective for annual periods beginning on or after 1 January 2018)
This is the converged standard on revenue recognition. It replaces FRS 11 Construction contracts, FRS 18 Revenue, and related interpretations. Revenue is recognised when a customer obtains control of a good or service. A customer obtains control when it has the ability to direct the use of and obtain the benefits from the good or service. The core principle of FRS 115 is that an entity recognises revenue to depict the transfer of promised goods or services to customers in an amount that reflects the consideration to which the entity expects to be entitled in exchange for those goods or services. An entity recognises revenue in accordance with that core principle by applying the following steps:
– Step 1: Identify the contract(s) with a customer – Step 2: Identify the performance obligations in the contract – Step 3: Determine the transaction price – Step 4: Allocate the transaction price to the performance obligations in the contract – Step 5: Recognise revenue when (or as) the entity satisfies a performance obligation
FRS 115 also includes a cohesive set of disclosure requirements that will result in an entity providing users of financial statements with comprehensive information about the nature, amount, timing and uncertainty of revenue and cash flows arising from the entity’s contracts with customers.
At this stage, the Group is not able to estimate the impact of the new rules on the Group’s financial statements. The Group will make more detailed assessment of the impact over the next twelve months.

64
CREATIVE TECHNOLOGY LTD AND ITS SUBSIDIARIES
For the financial year ended 30 June 2017
• FRS 109 Financial instruments (effective for annual periods beginning on or after 1 January 2018)
The complete version of FRS 109 replaces most of the guidance in FRS 39. FRS 109 retains the mixed measurement model and establishes three primary measurement categories for financial assets: amortised cost, fair value through Other Comprehensive Income (OCI) and fair value through Profit or Loss. The basis of classification depends on the entity’s business model and the contractual cash flow characteristics of the financial asset. Investments in equity instruments are required to be measured at fair value through profit or loss with the irrevocable option at inception to present changes in fair value in OCI.
For financial liabilities, there were no changes to classification and measurement except for the recognition of changes in own credit risk in OCI, for liabilities designed at fair value through profit or loss. FRS 109 relaxes the requirements for hedge effectiveness by replacing the bright line hedge effectiveness tests. It requires an economic relationship between the hedged item and hedging instrument and for the ‘hedged ratio’ to be the same as the one management actually use for risk management purposes.
At this stage, the Group is not able to estimate the impact of the new rules on the Group’s financial statements. The Group will make more detailed assessment of the impact over the next twelve months.
• FRS 116 Leases (effective for annual periods beginning on or after 1 January 2019)
FRS 116 will result in almost all leases being recognised on the balance sheet, as the distinction between operating and finance leases is removed. Under the new standard, an asset (the right to use the leased item) and a financial liability to pay rentals are recognised. The only exceptions are short-term and low-value leases. The accounting for lessors will not change significantly.
The standard will affect primarily the accounting for the Group’s operating leases. As at the reporting date, the Group has non-cancellable operating lease commitments of US$12,620,000 (Note 30(b)).
Some of the commitments may be covered by the exception for short-term and low-value leases and some commitments may relate to arrangements that will not qualify as leases under FRS 116.
The Group is currently assessing the effects of the adoption of FRS 116.
36. AUTHORISATION OF FINANCIAL STATEMENTS
These financial statements were authorised for issue in accordance with a resolution of the Board of Directors of CREATIVE TECHNOLOGY LTD. on 19 September 2017.
NOTES TO THE FINANCIAL STATEMENTS
35. NEW OR REVISED ACCOUNTING STANDARDS AND INTERPRETATIONS (cont’d)

65
CREATIVE TECHNOLOGY LTD AND ITS SUBSIDIARIES
37. LISTING OF SIGNIFICANT COMPANIES IN THE GROUP Country of Proportion of business / ownership Name of companies Principal activities incorporation interest held 2017 2016 % % Significant subsidiaries held by the Group Creative Labs, Inc. (a) Distribution of digitised United States 100 100 sound and video boards, of America computers, related multimedia and personal digital entertainment products
Creative Labs (Europe) Limited (c) Distribution of digitised Republic of 100 100 sound and video boards, Ireland computers, related multimedia and personal digital entertainment products
Creative Labs Pte Ltd (b) Development and sale of Singapore 100 100 audio and multimedia entertainment products
CTI Limited (a) Investment holding Bermuda 100 100
CTI II Limited (a) Investment holding Bermuda 100 100
(a) Not required to be audited under the laws of the country of incorporation (b) Audited by PricewaterhouseCoopers LLP, Singapore (c) Audited by PricewaterhouseCoopers, Dublin
All the Singapore-incorporated subsidiaries were audited by the Company’s auditor, PricewaterhouseCoopers LLP, Singapore.
For subsidiaries which appointed different auditors, the Audit Committee and Board of Directors are satisfied that the appointment would not compromise the standard and effectiveness of the audit.
There are no significant associated companies held by the Group.

66
CREATIVE TECHNOLOGY LTD AND ITS SUBSIDIARIES
For the financial year ended 30 June 2017
DIRECTORS’ REMUNERATION
The following information relates to remuneration of directors of the Company during the financial year:
2017 2016Number of directors of the Company in remuneration bands: - above S$500,000 – –- S$250,000 to below S$500,000 – –- below S$250,000 4 4Total 4 4
The Company proposed to pay Directors’ fees of S$180,000 in the current financial year (2016: paid S$180,000) to its non-executive directors on its Board of Directors.
The Company paid a total remuneration of S$1 (2016: S$1) to its Chairman and Chief Executive Officer.
AUDITOR’S REMUNERATION
The following information relates to fees of the auditors during the financial year:
2017 2016 US$’000 US$’000
Audit fees paid/payable to: - Auditor of the Company 138 182- Other auditors * 43 30
Other fees paid/payable to: - Auditor of the Company 38 36- Other auditors * 18 19* Include PricewaterhouseCoopers member firms outside Singapore
The Group has complied with Rules 712 and 715 or 716 of the Listing Manual issued by SGX-ST in relation to its auditors.
SGX-ST LISTING MANUAL REQUIREMENTS
The Audit Committee has reviewed all non-audit services provided by the auditor of the Company and in the Audit Committee’s opinion, the non-audit services provided, will not affect the independence of the auditors.
PROPERTIES OF THE GROUP
The net book values of properties held by the Group are as follows:
2017 2016 US$’000 US$’000
Freehold land and buildings 651 713
MATERIAL CONTRACTS
There is no material contract entered into by the Company or any of its subsidiaries involving the interest of the chief executive officer, any director or controlling shareholder, either still subsisting at the end of the financial year or entered into since the end of the previous financial year.
Additional Requirements of SGX-ST Listing Manual

67
CREATIVE TECHNOLOGY LTD AND ITS SUBSIDIARIES
STATISTICS OF SHAREHOLDING AS AT 6 SEPTEMBER 2017
Number of Issued Shares : 75,000,000 Number of Issued Shares (excluding Treasury Shares) : 70,331,649 Number / Percentage of Treasury Shares : 4,668,351 (6.64%)Class of Shares : Ordinary shares Voting Rights (excluding Treasury Shares) : 1 vote per share
Based on the information available to the Company as at 6 September 2017, 63.43% of the issued ordinary shares of the Company is held by the public and therefore, Rule 723 of the Listing Manual issued by SGX-ST is complied with.
Number of Percentage of Number of Percentage of Size of shareholdings shareholders shareholders (%) shares shares (%)1 - 99 1,127 9.98 50,844 0.07 100 - 1,000 6,101 54.00 3,293,602 4.681,001 - 10,000 3,591 31.79 12,425,532 17.67 10,001 - 1,000,000 473 4.19 20,745,062 29.50 1,000,001 and above 5 0.04 33,816,609 48.08
Total 11,297 100.00 70,331,649 100.00
TWENTY LARGEST SHAREHOLDERS
Name of shareholder Number of shares Percentage (%) 1 Sim Wong Hoo 23,270,652 33.09 2 Citibank Nominees Singapore Pte Ltd 5,218,939 7.42 3 DBS Nominees (Private) Limited 2,776,001 3.95 4 Ng Keh Long 1,305,875 1.86 5 United Overseas Bank Nominees (Private) Limited 1,245,142 1.77 6 OCBC Nominees Singapore Private Limited 933,750 1.33 7 Pornchada Vanich 856,000 1.22 8 Maybank Kim Eng Securities Pte. Ltd. 748,389 1.06 9 BNP Paribas Nominees Singapore Pte Ltd 639,450 0.9110 BNP Paribas Securities Services Singapore Branch 627,539 0.8911 Hong Leong Finance Nominees Pte Ltd 606,000 0.8612 Phillip Securities Pte Ltd 397,400 0.5713 CIMB Securities (Singapore) Pte. Ltd. 369,600 0.5314 OCBC Securities Private Limited 367,000 0.5215 UOB Kay Hian Private Limited 352,700 0.5016 Merrill Lynch (Singapore) Pte Ltd 329,107 0.4717 Choo Ah Seng 323,850 0.4618 Raffles Nominees (Pte) Limited 290,947 0.4119 Chan Siew Kim Alice 259,400 0.3720 Low Ting Pong 243,160 0.35
Total 41,160,901 58.54
Number of ordinary sharesSubstantial shareholder Direct interest Deemed interest
Sim Wong Hoo 23,270,652 –
68
CREATIVE TECHNOLOGY LTD AND ITS SUBSIDIARIES
For the financial year ended 30 June 2017
CORPORATE INFORMATION
Board of Directors Sim Wong Hoo, Chairman of the Board and Chief Executive Officer Lee Kheng Nam, Independent Non-Executive Director Ng Kai Wa, Independent Non-Executive Director Lee Gwong-Yih, Independent Non-Executive Director
Company Secretary Ng Keh Long
RegisteredOffice 31 International Business Park #03-01 Creative Resource Singapore 609921 Tel: 65-6895-4000
Share Registrar Boardroom Corporate & Advisory Services Pte. Ltd. 50 Raffles Place #32-01 Singapore Land Tower Singapore 048623
Corporate Counsel Duane Morris & Selvam LLP 16 Collyer Quay #17-00 Singapore 049318
Independent Auditor PricewaterhouseCoopers LLP 8 Cross Street #17-00 PWC Building Singapore 048424 Audit Partner: Lee Chian Yorn Year of appointment: 2016 Number of years of appointment: 2 years

The next generation home theatre and high-end audio system with Dolby Atmos®, SuperWide X-Fi™
and multiple advanced technologies
combining the best oF tWo Worlds: suPer high-end audio and 3d cinematic sound
1000W rms
chest- Pounding
Find out more at soniccarrier.com
- Mark Henninger, Senior Editor at AVS Forum http://www.avsforum.com/creative-x-fi-sonic-carrier-soundbar-demo-cedia-2017/
With no walls and no ceiling, just a noisy open convention center, the X-Fi Sonic Carrier still created a 3D immersive audio experience. For real. I challenge anyone who ever encounters a similar demo to take it and tell me otherwise. My mind was
completely blown, Creative has delivered sonic holography in a 2-piece solution so advanced... But what it does is so compelling,
even though the demo happened at the very end of the show, I knew there was no choice but to give it an AVS Forum Best of CEDIA 2017 award... I love to get a taste of the future, and this
thing is undeniably futuristic.
Bravely, Creative showed my how the SuperWide X-Fi processing made a YouTube
trailer sound surprisingly immersive and expansive. I noted that I thought the effect
was so good, that I would likely never turn it off. The quality of the holographic surround-
sound the Creative X-Fi Sonic Carrier puts out is something I have not heard before from any
soundbar. Oh, and the subwoofer. Wow!
““
““
best oF cedia 2017
e3 2017
“ “
My lord, it was incredible. The sonic carrier was able to fill Creative’s booth on the busy show floor (at E3) with full, rich sound with the aid of the company’s proprietary SuperWide X-Fi tech that can give even compressed stereo sources a panoramic-like soundstage. But more impressively, surround sounds like a
bird’s song or its fluttering wings felt like they were happening behind and above me.
- Jeff Grubb, reporter at GamesBeat, VentureBeat.com

creative.com
®
the audio oF tomorroW is here