Embed Size (px)
Citation preview

Document No: QF – HA – 99 QF99 On line Data Entry instructions.docx Page 1 of 30 Version No: 3 Printed: 31-Jan-14
ON-LINE DATA ENTRY INSTRUCTIONS
NATA Accredited Proficiency Testing Scheme Provider Number: 14863
This facility is accredited by the National Association of Testing Authorities Australia, and complies with the requirements of ISO/IEC 17043:2010. Site Number 15363

Document No: QF – HA – 99 QF99 On line Data Entry instructions.docx Page 2 of 30 Version No: 3 Printed: 31-Jan-14
Copyright Information: The written material produced by the Haematology QAP is copyright and may not be used in any form for advertising, sales promotion or publicity. The material may not be reproduced in whole or in part for any purpose whatsoever (including presentations at meetings and conferences), without the prior written permission of the RCPA Quality

Document No: QF – HA – 99 QF99 On line Data Entry instructions.docx Page 3 of 30 Version No: 3 Printed: 31-Jan-14
Assurance Programs Pty Limited. Permission must be sought in writing from the Program Chair but will not be unreasonably refused.
CONTENTS
1 WELCOME ............................................................................................................... 4
2 REGISTRATION FOR GENERAL HAEMATOLOGY ODE ........................................ 6
3 VIEWING ENROLMENT STATUS ............................................................................ 11
4 RESULT PAGE CONFIGURATION ......................................................................... 13
5 DATA ENTRY .......................................................................................................... 14
6 REPORT REVIEW .................................................................................................... 16
7 REVIEWING THE INTERIM REPORT ........................................................................ 18
8 REVIEWING THE END OF CYCLE REPORT ........................................................... 22
9 SUMMARY REPORT ............................................................................................... 26
10 REVIEWING GROUP REPORTS (>1 analyte per page) .................................... 28

Document No: QF – HA – 99 QF99 On line Data Entry instructions.docx Page 4 of 30 Version No: 3 Printed: 31-Jan-14
WELCOME
On line data entry (ODE) is done via the Haematology QAP website. The home page of
the RCPA Quality Assurance Programs Pty Limited on the World Wide Web (Internet) is
www.rcpaqap.com.au. The RCPA Haematology QAP can be found by clicking onto the
link of the home page (Figure 1) or by typing www.rcpaqap.com.au/haematology.
What is Required
All participants accessing the web will require the following
• internet access • Adobe Acrobat reader
Figure 1

Document No: QF – HA – 99 QF99 On line Data Entry instructions.docx Page 5 of 30 Version No: 3 Printed: 31-Jan-14
Figure 2
Once laboratories arrive onto the Haematology home page they will be required to log in to
access the data entry facility. By clicking onto the “On Line Data Entry” tab (Figure 2), this will
direct you to the on line direct data entry facility.

Document No: QF – HA – 99 QF99 On line Data Entry instructions.docx Page 6 of 30 Version No: 3 Printed: 31-Jan-14
REGISTRATION FOR GENERAL HAEMATOLOGY ODE
Figure 3
Subscribers will need to register prior to using the Haematology on line data entry facility. Please click on the link shown above, ‘Apply for Access’ (Figure 3).
This will take you to the terms and conditions for this facility. If a laboratory agrees with the terms and conditions they will need to click “Accept” to proceed (Figure 4).
Laboratories will be required to enter in a User ID for identification. The Laboratory Number is the participant number, which has been allocated on enrolment and is specific to the laboratory (Figure 5).
Click “Next” to proceed with registration.
Enter in lab details as in Figure 6 and click “Next” to proceed.

Document No: QF – HA – 99 QF99 On line Data Entry instructions.docx Page 7 of 30 Version No: 3 Printed: 31-Jan-14
Figure 4
Figure 5

Document No: QF – HA – 99 QF99 On line Data Entry instructions.docx Page 8 of 30 Version No: 3 Printed: 31-Jan-14
Figure 6
A screen will appear where you will be required to enter a secret question and answer. This is done for identification, if in the future the laboratory forgets their password (Figure 7).
Figure 7

Document No: QF – HA – 99 QF99 On line Data Entry instructions.docx Page 9 of 30 Version No: 3 Printed: 31-Jan-14
Figure 8
Figure 8 illustrates that you have registered successfully, where laboratories will receive an email for confirmation (Figure 9).
Figure 9

Document No: QF – HA – 99 QF99 On line Data Entry instructions.docx Page 10 of 30 Version No: 3 Printed: 31-Jan-14
Figure 10
The username and password will be forward to the email address specified in registration,
as above in Figure 10. Return to the login screen and enter in the User ID, Lab Number
and Password, which was forwarded by email (Figure 11). Figure 11

Document No: QF – HA – 99 QF99 On line Data Entry instructions.docx Page 11 of 30 Version No: 3 Printed: 31-Jan-14
Figure 12
Once logged in, you will be forwarded to a welcome page, where you will be able to
view previous reports, data entry etc.
VIEWING ENROLMENT STATUS
Once laboratories have successfully logged onto the system they will have access to links
on the left hand side of the web page.
Click on “Data Entry” as shown in Figure 12, which will take you to the welcome page for
on line data entry (Figure 13).
On the top of the welcome page, 4 separate tab buttons will link to 4 separate pages listed below.
1. Welcome Page (current view). 2. Enrolments/What’s Due – Indicating the programs, in which laboratories are enrolled
and the due dates for on-line data entry. 3. Data Entry – This is the screen where you enter survey results. 4. Result Page Configuration – Used to configure the on-line data entry page so it may
be in the desired test order of the laboratory.
Click on the desired tab to go to the page of choice.

Document No: QF – HA – 99 QF99 On line Data Entry instructions.docx Page 12 of 30 Version No: 3 Printed: 31-Jan-14
Figure 13
Figure 14
Enrolments / What’s Due: The programs that are highlighted indicate the programs your
laboratory has enrolled in. This page will also provide the due date for on line data entry
(Figure 14).

Document No: QF – HA – 99 QF99 On line Data Entry instructions.docx Page 13 of 30 Version No: 3 Printed: 31-Jan-14
RESULT PAGE CONFIGURATION
Figure 15
The result page configuration is used so laboratories can arrange the order they wish to enter in
their results. Please note, not all programs offer this facility.
All available programs are listed and can be located by the tabs across the page. Click the
desired tab to perform the result entry configuration.
To configure the result entry page (Figure 15) laboratories will need to highlight the desired tests
(1), located on the left hand side of the page and transfer to the right hand side by pressing
“Add” (2).
To put them in the desired order for data entry, highlight the test. Using the “Move Up” or “Move
Down” buttons (3), place the test in the order laboratories wish to perform their data entry.
Once laboratories are happy with the order of the tests, click “Save” to save the configuration.
1
2
3

Document No: QF – HA – 99 QF99 On line Data Entry instructions.docx Page 14 of 30 Version No: 3 Printed: 31-Jan-14
DATA ENTRY
Figure 16
Click on the “Data Entry” tab and the click on the program for which you wish to enter results.
Enter in the results for the current survey samples. The specimen number is indicated at the top of
the column. Please make sure you enter the results in the correct units as these results will go
directly into the database. Results may be amended by the participating laboratory up until the
closing date of the survey. The method classification can be checked by placing the cursor over
the result entry field. If this is incorrect laboratories should notify the Haematology QAP on the
appropriate form located in the enrolment package (QF-HA-47).
Once happy with the entry of results click “Save” as indicated in Figure 16. A confirmation page
will appear to accept. Click Yes (Figure 17) to proceed.
Please note the serial number can only be entered when entering into the first run of the cycle.
The Haematology QAP will need to be notified if the serial number requires input after the first run.

Document No: QF – HA – 99 QF99 On line Data Entry instructions.docx Page 15 of 30 Version No: 3 Printed: 31-Jan-14
Figure 17
Figure 18
Once a laboratory has accepted the results an email should be sent to the email address
that has been entered when they registered for on line data entry (Figure 18). This is
confirmation that labs have submitted results for the current program survey.

Document No: QF – HA – 99 QF99 On line Data Entry instructions.docx Page 16 of 30 Version No: 3 Printed: 31-Jan-14
REPORT REVIEW
Figure 19
On the home page click on “Data Analysis” as shown above in Figure 19.
Figure 20
A welcome page will be illustrated with a tab for Program Selection. Click “Program
Selection”.

Document No: QF – HA – 99 QF99 On line Data Entry instructions.docx Page 17 of 30 Version No: 3 Printed: 31-Jan-14
Figure 21
By selecting “Program Selection”, a page will appear which lists all the programs in which
your laboratory has enrolled (in bold).
To review your desired report click on the program (Full Blood Count - step 1), the Cycle
number (15 - step 2), the run number (6 – step 3) and then the test you wish to review
(White Cell Count – step 4) and then click on “Report” (step 5) as above in Figure 21.
Please note, to view the type of report, select the appropriate tab (step 6 in Figure 21)
The End of Cycle report is only viewable on the last run of the cycle.
The reports that are reviewed will be similar to the hard copy reports that have been sent
to the laboratory. However the results are compared to the All Method Median, not to
the Method Medians for the instrument group. This facility is being reviewed at the
moment, although participants should still be able to review their performance compared
to their peer group laboratories using the same method and those using other procedures
to determine the test result.
1
2
3
4
5
6

Document No: QF – HA – 99 QF99 On line Data Entry instructions.docx Page 18 of 30 Version No: 3 Printed: 31-Jan-14
REVIEWING THE INTERIM REPORT
Figure 22
Once you have clicked report under the “Interim” tab a page similar to Figure 22 will
appear which has the same format as the hard copy reports sent to laboratories.
The Interim Report (Figure 22) allows you to have a more in depth review of the results that
have been submitted by all participants. The three areas that provide more information
are numbered above and will be discussed further.
1. Clicking anywhere within either of the histograms or any of the youden plots will display
another page that allows you to perform a filter on desired method classification to be
reviewed (Figure 23).
Figure 23 shows you the distribution of results seen in the Interim report for both samples of
the histogram and youden plot for all results.
1
2
3

Document No: QF – HA – 99 QF99 On line Data Entry instructions.docx Page 19 of 30 Version No: 3 Printed: 31-Jan-14
Figure 23
By using the filtering system as seen in Figure 24 you are able to choose the desired
principle or instrument, reagent or a combination (the example has selected Cell Dyn +
3200 / Ruby instruments).
Once you have selected the desired filter, click “Filter”. Results for this filter will be
highlighted on the histograms and youden plot, showing you the distribution of results for
that method classification. The filtered results will also display the median result for this
filter, the number of users in the group and the number of users that fell outside the
allowable limits of performance.

Document No: QF – HA – 99 QF99 On line Data Entry instructions.docx Page 20 of 30 Version No: 3 Printed: 31-Jan-14
Figure 24
2. By clicking anywhere within the area marked 2 in Figure 22 you will display additional
information seen in Figure 25. Figure 25

Document No: QF – HA – 99 QF99 On line Data Entry instructions.docx Page 21 of 30 Version No: 3 Printed: 31-Jan-14
This is the statistical review of the run number that you have chosen. In this case, samples
5-06a and 5-06b. This will display for each part of the method classification you are
performing, the median, mean, SD, CV, number of users and the number of outliers.
Please note that there is no additional filter for this area of the report. This is used to
review a laboratory’s own procedure.
3. By clicking anywhere within the area marked 3 in Figure 22 you will display additional
information as seen in Figure 26.
Figure 26
Figure 26 allows subscribers to review their imprecision or bias within the cycle of survey
results. This can be achieved by using Solo Pairs (as used in this example) or by using
Progressive Data.

Document No: QF – HA – 99 QF99 On line Data Entry instructions.docx Page 22 of 30 Version No: 3 Printed: 31-Jan-14
Subscribers are able to view the imprecision or bias in the Levey Jennings type plot, which
allows you to see the relationship of the samples that have been sent in that survey. For
example if it appears that you are experiencing bias or imprecision in a sample pair in
your Levey Jenning type plot you will be able to highlight the pairs of samples to see if the
bias or imprecision is due to the level sent in the survey. This in turn will allow laboratories
to review the results of their internal controls and check that a similar pattern is not being
experienced, allowing you to take action.
This is done by clicking on the pairs you wish to investigate in the Levey Jennings type plot.
You will notice that data points will be highlighted on the Linearity graph, as shown in
figure 26.
REVIEWING THE END OF CYCLE REPORT
Figure 27
Click on the “End of Cycle” (EOC) tab, select the desired program for review, click on the
desired analyte (WCC) and click “Report”.
A page similar to Figure 28 will appear which has the same format as the hard copy EOC
reports received in your laboratories.

Document No: QF – HA – 99 QF99 On line Data Entry instructions.docx Page 23 of 30 Version No: 3 Printed: 31-Jan-14
Figure 28
The End of Cycle Report (Figure 28) allows you to have a more in depth review of the
results that have been submitted by all participants. The two areas that provide more
information are numbered above and will be discussed further.
1. Clicking anywhere within the imprecision performance bars or within the Coefficient of Variation histogram will display another page that allows you to perform a filter on the desired method classification. You will be able to review comparative data of the imprecision seen in other methodology (Figure 29).
2. Clicking anywhere within the inaccuracy performance bars or within the linear regression charts will display another page that allows you to perform a filter on the desired method classification to review comparative data of the inaccuracy seen in other methodology (Figure 30).
1
1
2
2

Document No: QF – HA – 99 QF99 On line Data Entry instructions.docx Page 24 of 30 Version No: 3 Printed: 31-Jan-14
Figure 29
Figure 30
As shown before, use the down arrow to choose your desired methodology and press
“Filter” (Figure 30). All labs using this filtered method will appear on the histogram and
performance bars reflecting the performance of these laboratories.
Document No: QF – HA – 99 QF99 On line Data Entry instructions.docx Page 25 of 30 Version No: 3 Printed: 31-Jan-14
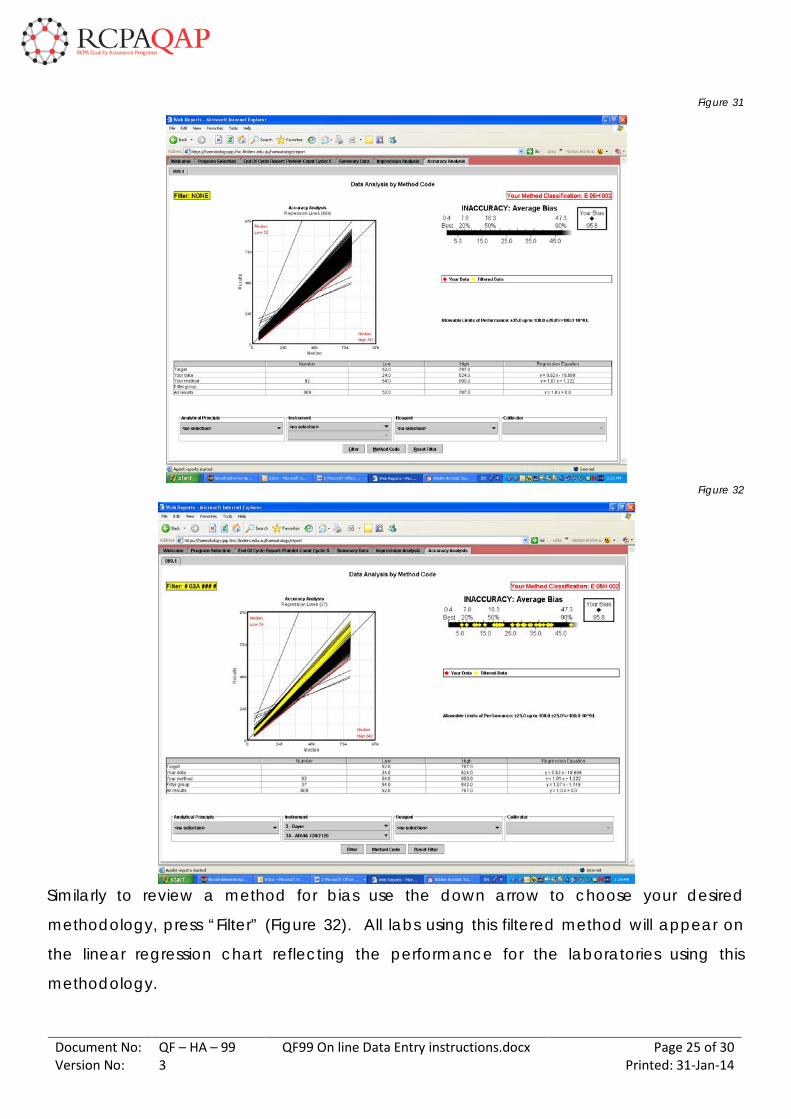
Figure 31
Figure 32
Similarly to review a method for bias use the down arrow to choose your desired
methodology, press “Filter” (Figure 32). All labs using this filtered method will appear on
the linear regression chart reflecting the performance for the laboratories using this
methodology.

Document No: QF – HA – 99 QF99 On line Data Entry instructions.docx Page 26 of 30 Version No: 3 Printed: 31-Jan-14
SUMMARY REPORT
Figure 33
To view the summary performance of the cycle, click “Performance Summary” as shown in Figure 33.
Figure 4

Document No: QF – HA – 99 QF99 On line Data Entry instructions.docx Page 27 of 30 Version No: 3 Printed: 31-Jan-14
This will provide a comparative listing of the performance of all methodology used to
quantitate the specified test (Figure 34). Please note this will be slightly different to the
results that appear in the hard copy report as results are based on the All Method
Median. The results obtained in your hard copy report are based on the Method Medians
(groups with greater than 10 users).
Figure 35
Clicking “Performance Summary” in Figure 33 will provide the performance summary
(Figure 35) for the laboratory. Please note the results will be slightly different to the results
that appear in your hard copy report as results are based on the All Method Median (not
method median).

Document No: QF – HA – 99 QF99 On line Data Entry instructions.docx Page 28 of 30 Version No: 3 Printed: 31-Jan-14
REVIEWING GROUP REPORTS (>1 ANALYTE PER PAGE)
Figure 36
Programs that have more than 1 analyte per page printed are known as group reports.
Most of these programs will have a combination of quantitative and qualitative results
illustrated on the page. These programs include,
DS = D-Dimer (Semi Quantiative) HP = Haemoglobinopathy GD = G6PD IP = Immunophenotyping (not available at this stage) PN = PNH MD = Molecular Diagnostics (not available at this stage) MO = Morphology (not available at this stage) SA = Special Haemostasis – Module A SB = Special Haemostasis – Module B SC = Special Haemostasis – Module C SD = Special Haemostasis – Module D SE = Special Haemostasis – Module E
To view an “Analyte Group Report”, (Figure 36 representing a Haemoglobinopathy report), click the desired program, the cycle number, the run number and the group report, click “Report”.

Document No: QF – HA – 99 QF99 On line Data Entry instructions.docx Page 29 of 30 Version No: 3 Printed: 31-Jan-14
Figure 37
Figure 38

Document No: QF – HA – 99 QF99 On line Data Entry instructions.docx Page 30 of 30 Version No: 3 Printed: 31-Jan-14
Figure 39
Figure 40
A set of tabs will appear which will list the reports in page numbers as it appears in the hard copy
report. By clicking on the various tabs it will take you through the full report sent for that survey run
(Figures 37– 40).