Embed Size (px)
Citation preview

Vol. 65: 105-122. 1990 MARINE ECOLOGY PROGRESS SERIES Mar. Ecol. Prog. Ser. l Published August 2
On iron limitation of the Southern Ocean: experimental observations in the Weddell and
Scotia Seas
Hein J. W. de Baarl, Anita G. J. ~ u m a ' , Rob F. ~o l t ing ' , Gerhard C. Cadee1, Guy ~ a c q u e s ~ , Paul J. ~ r e g u e r ~
' Netherlands Institute for Sea Research (NIOZ). PO Box 59, 1790 AB Den Burg, Texel, The Netherlands Laboratoire Arago, Universite Pierre et Marie-Curie. CNRS, F-66650 Banyuls-sur-Mer. France
Institut d'Etudes Marines, F-28287 Brest, France
ABSTRACT: Shipboard studies were performed for testing the classical hypothesis that Antarctic phytoplankton suffers from a deficiency of Fe In a suite of 5 experiments over 8 to 12 d periods and encompassing different water masses (Weddell Sea water proper, Weddell-Scotia Confluence water, Scotia Sea water), and various plankton communities, biomass and dynamic spring/summer (ice) conditions, we always observed Fe to stimulate chlorophyll a synthesis and nutrient assimilation. In 3 out of 5 experiments there was an immediate response to added Fe, while in the other 2 expenments an effect was observed after 3 to 6 d. In 4 out of 5 experiments final particulate organic carbon (POC) levels were also higher in Fe-enriched cultures compared to controls. However the controls were also found to outgrow steadily typical chlorophyll a and POC levels found in ambient waters. This strongly suggests that the in situ Fe concentration in itself does not hamper build-up of high biomass levels. Extrapolation to the in situ ecosystem therefore suggests that, despite enhancement of phytoplankton growth, Fe is not the major factor controlling phytoplankton in the Weddell/Scotia Seas. Marginal sediments appear to supply adequate dissolved Fe for supporting at least minimum growth of phytoplankton. More remote sectors of the Southern Ocean might be more likely candidates for occasional limitation by Fe alone.
INTRODUCTION
Illusions about the fertility of the Southern Ocean are no longer in fashion (Fogg 1977, El-Sayed 1984, Tre- guer & Jacques 1986). The Southern Ocean has very high nutrient levels in the surface waters while only low standing stocks of phytoplankton are found (Holm- Hansen 1985). Utilization of nutrients appears to be less efficient than in the coastal upwelling and oligotrophic ecosystems of temperate zones. Even during austral spring the phytoplankton biomass in the most produc- tive regions, notably frontal systems (e.g. the Weddell- Scotia Confluence) and the seasonally receding ice- edge zones, remains relatively modest (Sullivan et al. 1988). Spring levels of nutrients. although depressed, are still well above depletion (Hayes et al. 1984). This apparent 'Antarctic Paradox' (Treguer & Jacques 1986) is governed by a combination of physical, biological and chemical factors. Intense grazing pressure (Holm-
Hansen & Huntley 1984) undoubtedly plays an impor- tant role, whereas Light limitation within the mixed layer (Jacques & Minas 1981, Pnddle et al. 1986) has also been advocated. Whenever a single limiting factor such as temperature or light has been hypothesized, field measurements and experiments have provided contradicting results (Marra 1978, Jacques & Minas 1981, Priddle et al. 1986, Queguiner & Legendre 1986). At a given point in time and space a plankton bloom may eventually succumb for just one reason, e.g. a shortage of either nitrate, a trace element or light, or intense grazing pressure. However for the many and various ecosystems integrated over time and space in the vast overall Southern Ocean control by just one single factor would appear most unlikely.
There has long been speculation about possible defi- ciency of a biolimiting trace chemical constituent in the Weddell Sea region, notably Fe. Gran (1931, p.43) reflects on high nutrient levels in the Weddell/Scotia
106 Mar. Ecol. Prog. Ser. 65: 105-122, 1990
Seas reported by Ruud (1930) by stating 'that the growth of the plankton diatoms is determined by other factors than the concentration of phosphates and ni- trates besides light and temperature' and hints at his own experiments on Fe limitation. The balanced and scholarly overview by Hart (1934, p. 186) more explicitly briefly mentions Fe deficiency as one of many possible limiting factors in the Weddell Sea, Bransfield Strait and BeUngshausen Sea. Since then the possible lack of essential trace elements in the overall Southern Ocean has remained a subject of speculation (Martin & Fitzwater 1988). Thus far there is however a paucity of data on their Antarctic distribution (Orren & Monteiro 1985) whereas studies of their interaction with biota have also been frustrated by contamination problems (Hayes et al. 1984, Jacques et al. 1984). Carlucci & Cuhel (1977) investigated the distribution and biologi- cal effects of vitamin B12 in the Southern Ocean, indi- rectly hinting at the possible limiting role of CO, a major constituent of vitamin Blz.
The original mention (Gran 1931, Hart 1934) of Fe as one among several possible limiting factors specifically for the Southern Ocean was inspired by experiments of Gran (1931, 1932) on phytoplankton in temperate waters. These and subsequent studies in various re- gions (Harvey 1933, 1937a, b, Thompson & Bremner 1935, Menzel & Ryther 1961) may, in retrospect, not have been executed with the ultraclean techniques which are now considered necessary for trace metal studies. For example, reported Fe : P ratios in seawater and phytoplankton have decreased from about 4 : 1 (Harvey 1937a) to about 0.1 : 1 (Johnston 1964) to mod-
ern values around or below 0.001 : 1 (see Table 5). Only very recently, more than 50 yr after the Gran (1931) hypothesis, 2 simultaneous (August 1987), yet inde- pendent, studies (Martin & Fitzwater 1988, Coale 1988) convincingly demonstrated with clean methods the stimulation of phytoplankton by realistic Fe concen- trations in the Subarctic North Pacific, an area also characterized by elevated levels of macronutrients in the surface waters. Both for the Pacific area of actual investigation as well as the Antarctic region Fe was speculated to be the single growth limiting factor (Mar- tin & Fitzwater 1988, Martin & Gordon 1988, Martin et al. 1989, Martin 1990).
Here we report on the first reliable Antarctic experi- ments in conjunction with a field survey (Nolting & De Baar 1990), employing clean techniques throughout during the EPOS program. The European Polarstern Study (EPOS) was organized by the European Science Foundation, stimulating a joint effort between scientists from various disciplines and countries of origin. A suite of 3 expeditions was executed with RV 'Polarstern' in the 1988/1989 austral spring and summer seasons. Inspired by the pioneering 'Discovery' expeditions (Hart 1934) the Weddell/Scotia Seas were chosen as the study site of EPOS Leg 2 (Fig. 1). The comprehensive EPOS program was designed for investigating the interaction of physical, chemical and biological processes in the surface ocean at and around the receding ice-edge, with an eye towards unraveling the aforementioned 'Antarc- tic Paradox' (Hempel et al. 1989). Initial results of our study have already been reported (De Baar et al. 1989a) and presented (Buma et al. 1990).
Fig. l . General area with re- search rectangle stretching from North to South largely along the
49"W section
De Baar et al.: Iron limitation of the Southern Ocean 107
MATERIALS AND METHODS
Sampling relied on 12 to 17 modified Teflon-coated Go-Flo bottles on an all-Teflon-coated stainless steel CTD/Rosette frame, as used successfully for studies of nanomolar Fe and Mn distributions (Saager et al. 1989). The package was sent down to 500 m to flush out any possible remaining contamination, and the samplers were closed during the upcast at 30 to 50 m depth in order to avoid contamination from the ship. Upon recovery the bottles were mounted outside a Class-100 clean air laboratory van, then the water was led through all-Teflon (PTFE, FEP) lines into 20 l polycar- bonate vessels (Coale 1988) within the clean van. Dis- solved Fe, Fe+EDTA, EDTA and Mn were added from analytical stock solutions. The final physico-chemical state (valency, complexation) within the seawater is predicted from thermodynamics to be finely dispersed amorphous Fe(III)(OH)3 in equilibrium with about 0.1 nM dissolved Fe(II1) and negligible levels (ca 10-l0 nM) of dissolved Fe(1I) (Byrne et al. 1988). How- ever slow lunetics in combination with occurrence of colloids as well as organic complexes would probably yield higher abundance of both dissolved species Fe(II1) and Fe(I1); the latter have also been reported from direct determination (Waite & More1 1984, Hong & Kester 1986, MiUero et al. 1987). Our measurements of total Fe concentrations at the beginning and end of the experiments showed that no significant Fe losses occurred due to wall adsorption. The culture vessels were then moved inside a second, refrigerated, con- tainer van. During the experiments the sealed vessels were slowly revolving (1.0 rpm) under artificial light at the prescribed saturation level (100 PE m-2 S-' on a 16/8 light/dark cycle) for plankton communities encountered during the EPOS 2 cruise (Lancelot &
Mathot 1989). Vessels were brought into the Class-100 van daily in order to sample for shipboard determina- tions of nutrients (nitrate, phosphate, silicate) and chlorophyll a (Neveux & Panouse 1987). Samples were also taken and stored for analyses in the shore labora- tory of species composition and abundance, particulate organic carbon (POC), pigments (by HPLC) and trace metals.
Five experimental series, each comprising 2 to 7 cultures simultaneously, were run over periods of 8 to 12 d (Table 1). The initial phytoplankton populations were taken from stations (Fig. 2) located in the Scotia Sea (EPOS 159 and 182), in the Weddell-Scotia Conflu- ence (EPOS 145 and 158) and in the Weddell Sea proper under more than 90 O/O ice cover (EPOS 169). The overall research area stretched from North to South largely along the 49'W section (Figs. 1 and 2). The general eastward drift (Fig. l ) of the Antarctic Circumpolar Current is augmented by waters from the
Bellingshausen Sea and Bransfield Strait which also flow eastward, the latter passing over the various shel- ves of the archipelago. Different plankton communities were encountered. EPOS 145 was dominated by the diatom Corethron criophilum and nanoflagellates (mainly cryptomonads). EPOS 158 consisted largely of nanoflagellates (mainly cryptomonads). EPOS 159 and 182 from the Scotia Sea were dominated by the diatoms C. crjophilum, Chaetoceros dichaeta and Chaetoceros neglectus. Finally EPOS 169 was dominated by C. criophilum and various nanoflagellates. Preliminary shipboard microscopic inspection during the course of the experiments revealed some changes in relative species composition, but no complete take-over by a single species, and generally excellent physiological condition, the latter also monitored by the ratio chlorophyll a / phaeophytin (mostly higher than 10, never below 2) during shipboard inspection. In total 8 cultures ran with Fe additions, 4 with Fe and EDTA additions and 4 with Mn additions (Table 1). Simul- taneous experiments with additions of EDTA with Cu or Zn (EPOS 182; Table l ) , as well as results for orthosilicic acid, and information on phytoplankton community structure (cell counts and HPLC pigment data) will be reported elsewhere (Buma et al. unpubl.)
RESULTS
Addition of iron versus untreated controls
In all 5 experiments the Fe-enriched bottles as well as the control bottles showed rapid growth eventually leading to high levels of chlorophyll a and low nutrient concentrations (Figs. 3 to 7 ; Tables 2 and 3). EPOS 159 and 182, originating from the Scotia Sea proper, showed rapid response (within 2 to 5 d, Fig. 8) to Fe additions, with the most pronounced effect in EPOS 159 (Fig. 9). In the second experiment (EPOS 158) metal was added only after 2 d (t = 2), and 3 d later (t = 5) a similar distinct response was observed (Figs. 4 and 8) . However experiments started with Weddell-Scotia Confluence water and Weddell Sea water (EPOS 145, 169) showed no response to the metal enrichment during an initial period of 3 to 6 d (Figs. 3, 6 and 9). Initial effects of metal additions can be demonstrated by calculating linear regression coefficients over the initial period (3 to 6 d) between chlorophyll a (Control) and chlorophyll a (Fe =
10 nM) (Fig. 9). Only Fe = 10 nM additions are plotted and shown. The other Fe additions show comparable trends, as can be seen from Figs. 3 to 7.
During the second phase of the incubations (beyond 3 to 6 d after start of the experiment) all 5 enriched cultures clearly started to outgrow the controls (Figs. 3 to 7 and 9). Regression coefficients of chlorophyll a
108 Mar. Ecol. Prog. Ser. 65: 105-122, 1990
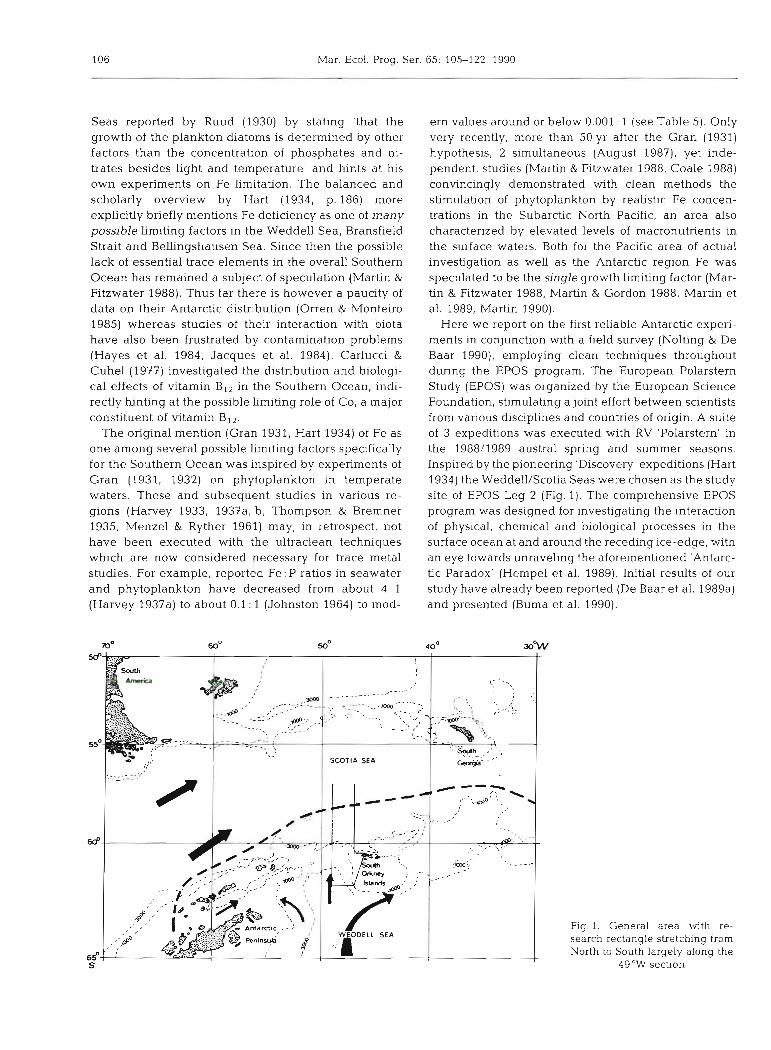
Table 1. General information on the 5 culture series. Number of untreated controls and nominal concentrations (nM) of trace metals and EDTA in the culture solutions. Metal a d d ~ t ~ o n s usually at t = 0, except for EPOS 158 at t = 2 d and for EPOS 145 second additions of 10 nM and 20 nM at t = 7 d. The 4 small-volume (2.5 1) cultures of EPOS 182 showed consistent trends for Fe and Mn,
but will otherwise be reported elsewhere (Buma et al. unpubl.)
EPOS experiment (Station) 145 158 159 169 182
Region or sea Confluence Confluence Scotia sea Weddell Sea Scotia Sea Latltude "S 58 59 57 62 57 Longitude "W 49 49 4 9 47 4 9 Date (1988) 27 Nov 8 Dec 12 Dec 17 Dec 27 Dec Ice cover - - - over 90 % - Sampling depth (m) 35 20 50 40 4 0 Temperature ("C) -0.6 -1.3 0.08 -1.77 1.62
No. of cultures (20 1) 4 7 2 6 7 (2.5 1 cultures) (4) Controls 2 2 1 1 1 Fe (nM) 10 1 a t t = 2 - -
20 10 at t = 2 10 10 1 at t = 2a - 10 + 30 at t = 0
10 + 30 at t = 4 1 + 3 0 + 1 a t t = 4 30
Fe + EDTA
Fe + EDTA + Mn EDTA (nM) control Mn (nM)
Mn Untreated control (2.5 1) Fe + EDTA (2.5 1) Fe + EDTA + Cu (2.5 1) Fe + EDTA + Zn (2.5 1)
End: Time (d) 10 Temperature ("C) 3.5 Deplet~on of: No3
a With daily 1 nM addition until 6 nM at t = 8 d
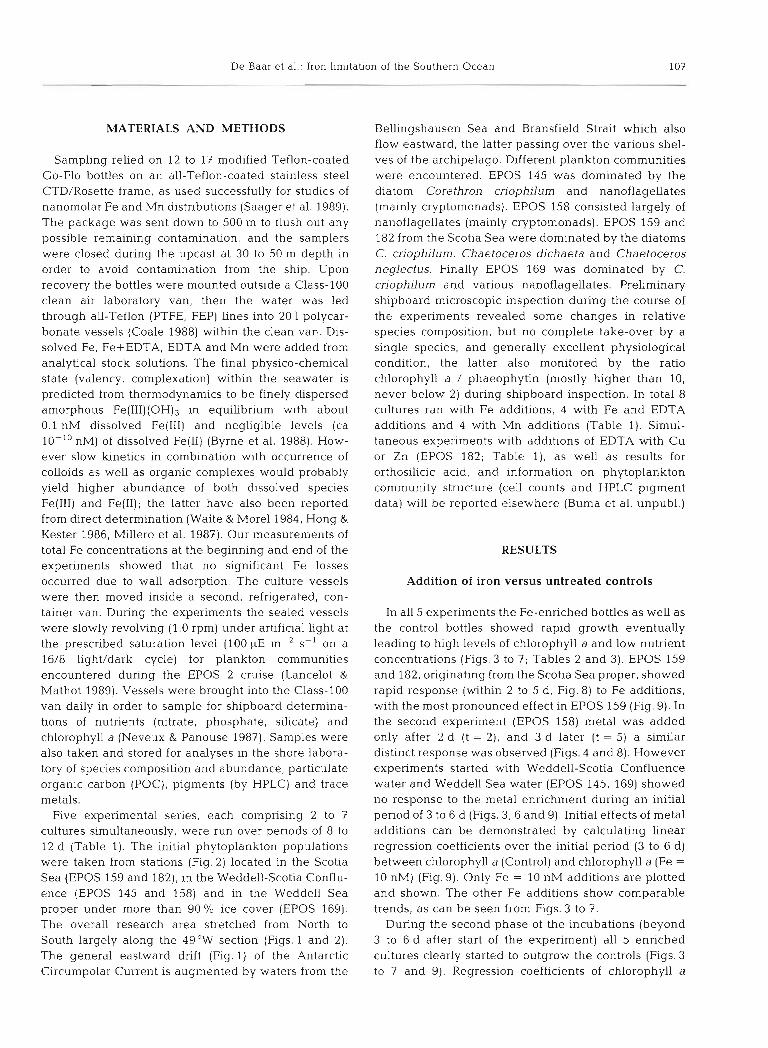
159,182 Scotia - Confluence Transition
58
56
Confluence
158
I I I I I I I I
Scotia Sea
Weddell Sea
U 2 63 53 52 51 50 49 48 47 46 45 44
West Fig. 2. Station locations in the Scotia Sea, the Scotia-Weddell Confluence and the Weddell Sea where waters were collected
for starting the experiments
(Control) plotted against chlorophyll a (Fe = 10 nM) from this second phase show ratios far above 1 (Fig. 9). At the point in time (3 to 6 d) where this secondary yet more distinct Fe effect started, the levels of chlorophyll a and nutrients in both the control and the Fe-enriched bottles had developed near the highest and lowest levels respectively found in the ambient surface waters. During the cruise the highest in situ chlorophyll a values measured were about 4.5 pg 1-l, consistent with earlier reported maximum values (Sullivan et al. 1988). Spring or summer values for nitrate and phosphate rarely drop below 20 and 1.5 p M respectively, only about 25 % below the winter values of 25 to 30 pM and 2 pM respectively. Silicate levels (not shown) in the Weddell Sea and Scotia Sea rarely drop more than 25 % below their respective winter values of about 80 and 25 yM (Van Bennekom pers. comm.). So the more pronounced effects of Fe in the second phase of the experiments took place under conditions (chlorophyll a, nutrients, community structure) no longer compar- able with the in situ situation.
De Baar et al.: Iron limita
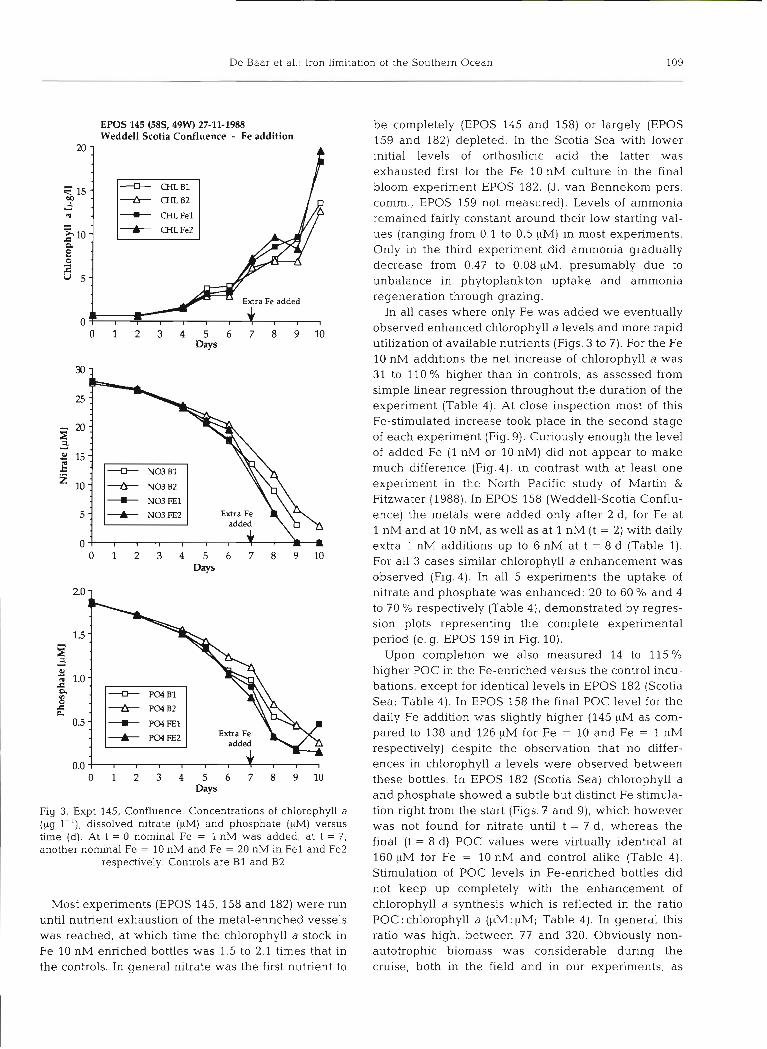
EPOS 145 (58S, 49W) 27-11-1988 Weddell Scotia Confluence - Fe addition
Fig. 3. Expt 145, Confluence. Concentrations of chlorophyll a (pg 1 - l ) , dissolved nitrate (KM) and phosphate (PM) versus time (d). At t = 0 nominal Fe = 1 nM was added, at t = 7, another nominal Fe = 10 nM and Fe = 20 nM in Fe1 and Fe2
respectively Controls are B1 and B2
Most experiments (EPOS 145, 158 and 182) were run until nutrient exhaustion of the metal-enriched vessels was reached, at which time the chlorophyll a stock in Fe 10 nM enriched bottles was 1.5 to 2.1 times that in the controls. In general nitrate was the first nutrient to
~tion of the Southern Ocean 109
be completely (EPOS 145 and 158) or largely (EPOS 159 and 182) depleted. In the Scotia Sea with lower initial levels of orthosilicic acid the latter was exhausted first for the Fe 10 nM culture in the final bloom experiment EPOS 182. (J. van Bennekom pers. comm., EPOS 159 not measured). Levels of ammonia remained fairly constant around their low starting val- ues (ranging from 0.1 to 0.5 yM) in most experiments. Only in the third experiment did ammonia gradually decrease from 0.47 to 0.08 PM, presumably due to unbalance in phytoplankton uptake and ammonia regeneration through grazing.
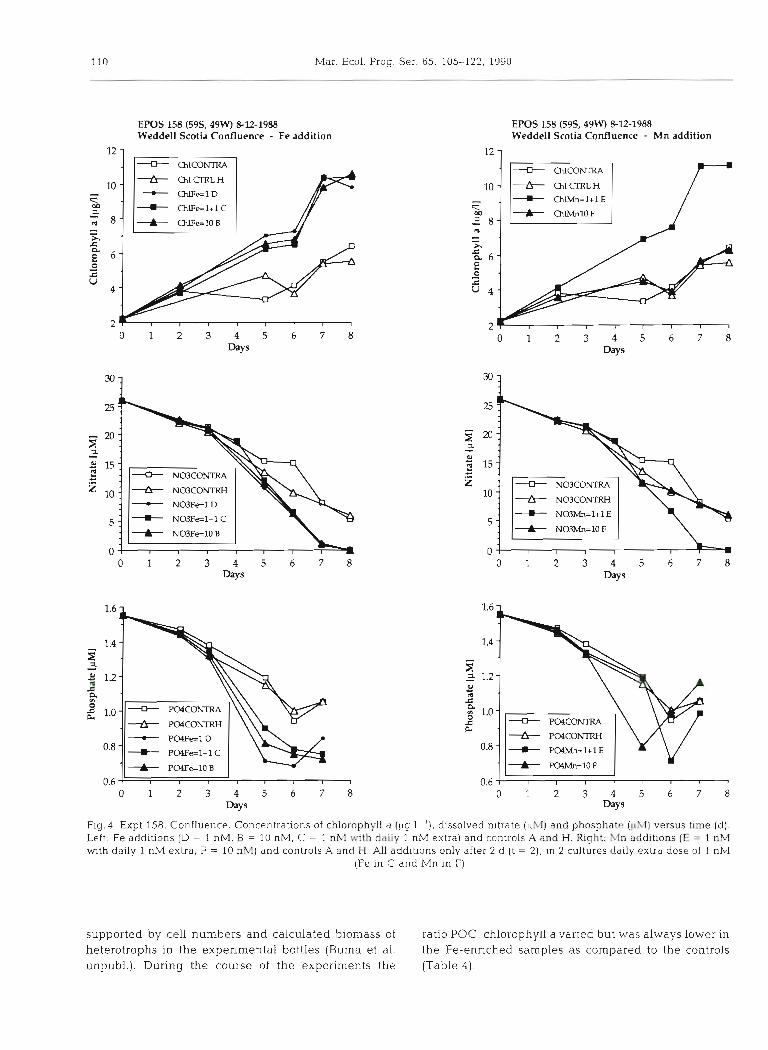
In all cases where only Fe was added we eventually observed enhanced chlorophyll a levels and more rapid utilization of available nutrients (Figs. 3 to 7). For the Fe 10 nM additions the net increase of chlorophyll a was 31 to 110 % higher than in controls, as assessed from simple linear regression throughout the duration of the experiment (Table 4). At close inspection most of this Fe-stimulated increase took place in the second stage of each experiment (Fig. 9). Curiously enough the level of added Fe (1 nM or 10 nM) did not appear to make much difference (Fig.4), in contrast with at least one experiment in the North Pacific study of Martin & Fitzwater (1988). In EPOS 158 (Weddell-Scotia Conflu- ence) the metals were added only after 2 d , for Fe at 1 nM and at 10 nM, as well as at 1 nM (t = 2) with daily extra 1 nM additions up to 6 nM at t = 8 d (Table 1). For all 3 cases similar chlorophyll a enhancement was observed (Fig.4). In all 5 experiments the uptake of nitrate and phosphate was enhanced: 20 to 60 O/O and 4 to 70 O/O respectively (Table 4), demonstrated by regres- sion plots representing the complete experimental period (e.g. EPOS 159 in Fig. 10).
Upon completion we also measured 14 to 115% higher POC in the Fe-enriched versus the control incu- bat ion~, except for identical levels in EPOS 182 (Scotia Sea; Table 4). In EPOS 158 the final POC level for the daily Fe addition was slightly higher (145 yM as com- pared to 138 and 126 yM for Fe = 10 and Fe = 1 nM respectively) despite the observation that no differ- ences in chlorophyll a levels were observed between these bottles. In EPOS 182 (Scotia Sea) chlorophyll a and phosphate showed a subtle but distinct Fe stimula- tion right from the start (Figs.? and g), which however was not found for nitrate until t = 7 d, whereas the final (t = 8 d) POC values were virtually identical at 160 FM for Fe = 10 nM and control alike (Table 4). Stimulation of POC levels in Fe-enriched bottles did not keep up completely with the enhancement of chlorophyll a synthesis which is reflected in the ratio POC: chlorophyll a (PM: PM; Table 4). In general this ratio was high, between 77 and 320. Obviously non- autotrophic biomass was considerable during the cruise, both in the field and in our experiments, as
Pho
spha
te lp
Ml
Pho
spha
te lp
M1
g'
gg
g$
g
Nit
rate
IpM
l
oo
lS
G8
E8
Nit
rate
lpM
l C
hlor
ophy
ll a
IpgA
l
De Baar et al.: Iron l in~i ta t~on of the Southern Ocean 111
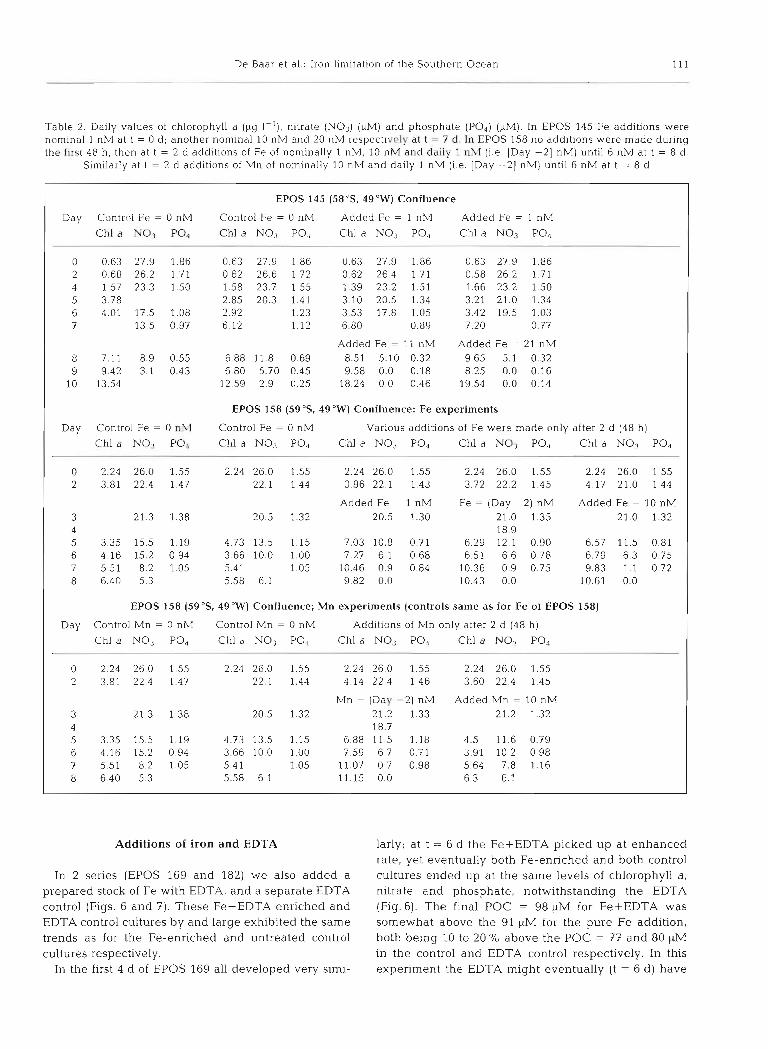
Table 2. Daily values of chlorophyll a ({kg I-'), nitrate (NO3) (stM) and phosphate (PO,) (1tM)- In EPOS 145 Fe additions were nominal 1 nM at t = 0 d ; another nominal 10 nM and 20 nlM respectiv~ly at t - 7 d. In EPOS 158 no additions were made during the first 48 h, then at t = 2 d additions of Fe of nominally 1 nM, 10 nM and daily 1 nh l (i.e. [Day -21 nM) until 6 nM at t = 8 d .
Similarly at t = 2 d additions of Mn of nominally 10 nM and daily 1 nM (i.e. [Day -21 nM) until 6 nM at t = 8 d
EPOS 145 (58"s. 49%') Confluence
Day Control Fe = 0 nM Control Fe = 0 nM Added Fe = 1 nM Added Fe = 1 nM
Chl a NO3 PO, Chl a NOJ PO4 Chl a NO,j PO, Chl a NO, PO, --
0 0.63 27.9 1.86 0.63 27.9 1.86 0 6 3 27.9 1.86 0.63 27 9 l 86 2 0.68 262 1 7 1 0.62 26.6 1.72 0.62 264 1.71 0.58 26 2 1 7 1 4 1.57 23 3 1 50 1.58 23.7 1.55 1.39 23.2 1.51 1.66 23.2 1 50 5 3.78 2.85 20.3 1.41 3 10 205 1.34 3.21 21.0 1.34 6 4.01 17.5 1.08 2.92 1.23 3.53 17.8 1.05 3.42 19.5 1.03 7 13.5 0.97 6.12 1.12 6.80 0.89 7.20 0.77
Added Fe = 11 nM Added Fe = 21 nM 8 7.11 8.9 0.55 6.88 11.8 0.69 8.51 5.10 0.32 9.65 5.1 0.32 9 9.42 3.1 0.43 6.80 5.70 0.45 9.58 0.0 0.18 8.25 0.0 0.16
10 13.54 12.59 2.9 0.25 18.24 0.0 0.46 19.54 0.0 0.14
EPOS 158 (59 OS. 49 "W) Confluence: Fe experiments
Day Control Fe = 0 n?I Control Fe = 0 nM Various additions of Fe were made only after 2 d (48 h)
Chl a NO,, PO, Chl a NO3 PO4 Chl a N o 3 PO4 Chl a NO3 PO, Chl a NO3 PO,
0 2.24 26.0 1.55 2.24 26.0 1.55 224 260 1.55 2.24 26 0 1.55 2.24 26.0 1.55 2 3.81 22.4 1.47 22.1 1.44 3.96 22.1 1.43 3.72 22.2 1.45 4.17 21.0 1.44
Added Fe = 1 nh? Fe = (Day -2) nM Added Fe = 10 nM 3 21.3 1.38 20.5 1.32 20.5 1.30 21.0 1.35 21.0 1.32 4 18.9 5 3.35 15.5 1.19 4.73 13.5 1.15 7.03 10.8 0.71 6.29 12.1 0.90 6.57 11.5 0.81 6 4.16 15.2 0.94 3.66 10.0 1.00 7.27 6.1 0.68 6.51 6.6 0.78 6.79 6.3 0.75 7 5.51 8.2 1.05 5.41 1.05 10.46 0.9 0.84 10.36 0.9 0.75 9.83 1.1 0.72 8 6.40 5.3 5.58 6.1 9.82 0.0 10.43 0.0 10.61 0.0
EPOS 158 (5g0S, 4g0W) Confluence; Mn experiments (controls same as for Fe of EPOS 158)
Day Control Mn = 0 nM Control Mn = 0 nh4 Additions of Mn only after 2 d (48 h)
Chl a NO3 PO, Chl a NO3 PO, Chl a N o 3 PO4 Chl a PO, - p-
0 2.24 26 0 1.55 2.24 26.0 1.55 2.24 26.0 1.55 2.24 26.0 1.55 2 3.81 22 4 1.47 22.1 1.44 4-14 22.4 1.46 3.60 22.4 1.45
Mn = (Day -2) nM Added Mn = 10 nM 3 21.3 1.38 20.5 1.32 21.2 1.33 21.2 1.32 4 18.7 5 3.35 15.5 1.19 4.73 13.5 1.15 6.88 11.5 1.18 4.5 11.6 0.79 6 4.16 15.2 0.94 3.66 10.0 1.00 7.59 6.7 0.71 3.91 10.2 0.98 7 5.51 8.2 1.05 5.4 1 1.05 11.07 0.7 0.98 5.64 7.8 1.16 8 6.40 5.3 5.58 6.1 11.15 0.0 6.3 6.1
Additions of iron and EDTA
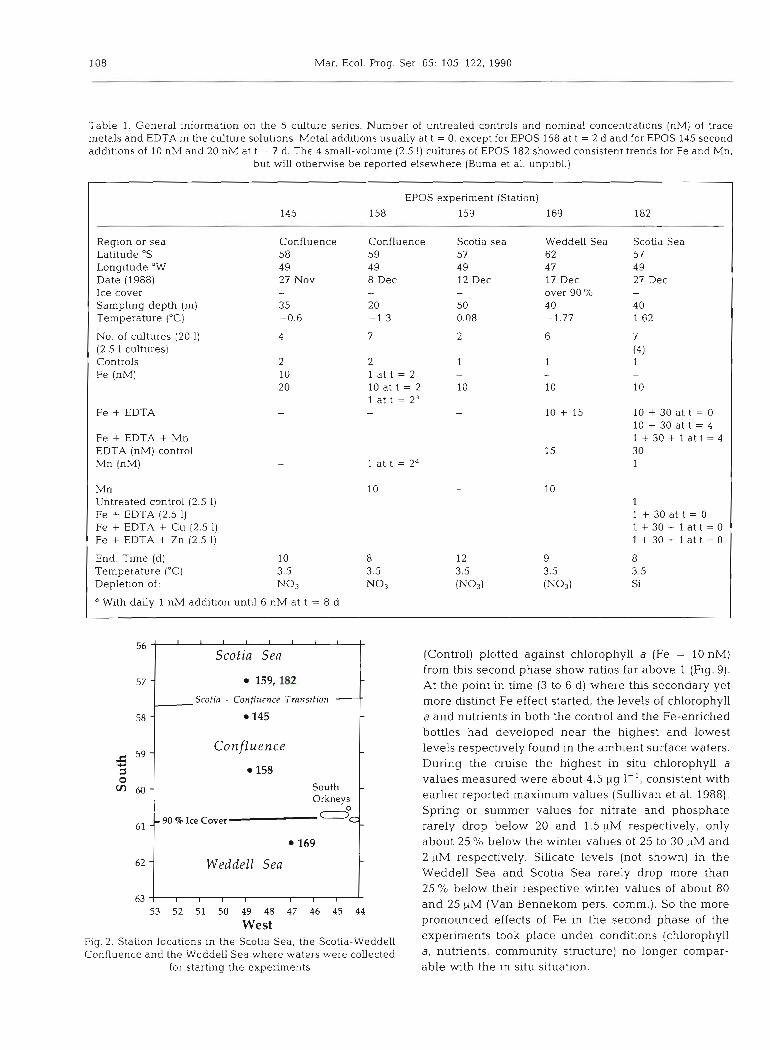
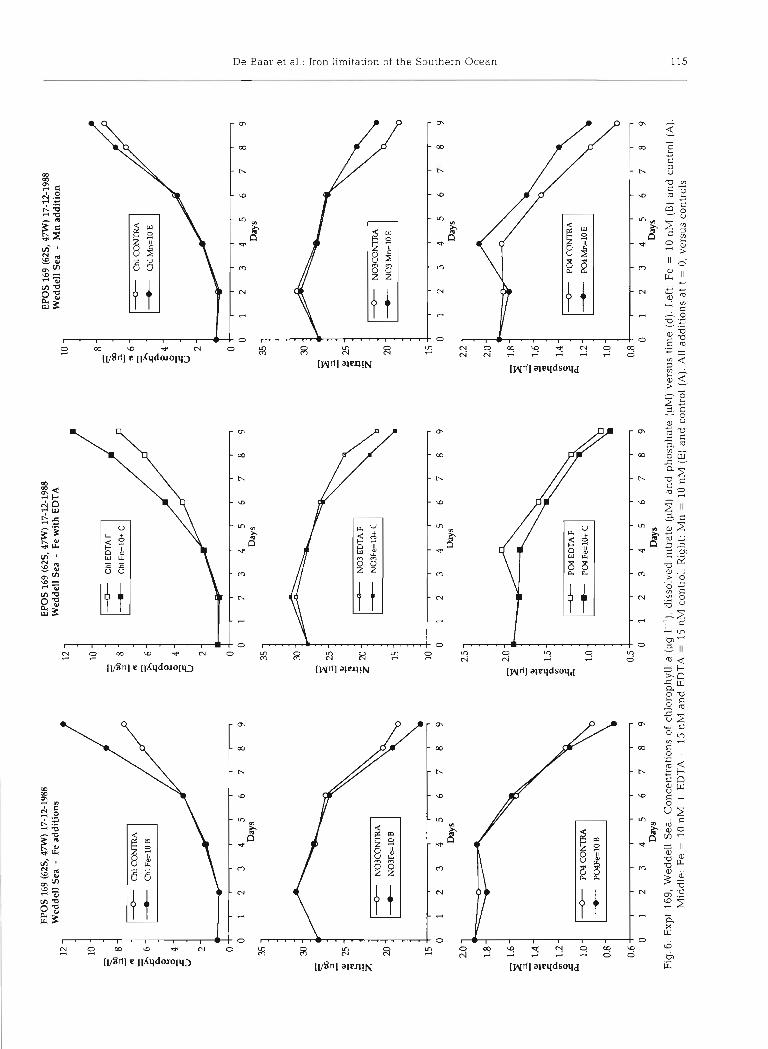
In 2 series (EPOS 169 and 182) we also added a prepared stock of Fe with EDTA, and a separate EDTA control (Figs. 6 and 7). These Fe+EDTA enriched and EDTA control cultures by and large exhibited the same trends as for the Fe-enriched and untreated control cultures respectively.
In the first 4 d of EPOS 169 all developed very simi-
larly; at t = 6 d the Fe+EDTA picked up at enhanced rate, yet eventually both Fe-enriched and both control cultures ended up at the same levels of chlorophyll a, nitrate and phosphate, notwithstanding the EDTA (Fig. 6). The final POC = 98 PM for Fe+EDTA was somewhat above the 91 yM for the pure Fe addition, both being 10 to 20 O/O above the POC = 77 and 80 yM in the control and EDTA control respectively. In this experiment the EDTA might eventually (t = 6 d) have
112 Mar. Ecol. Prog. Ser. 65: 105-122, 1990
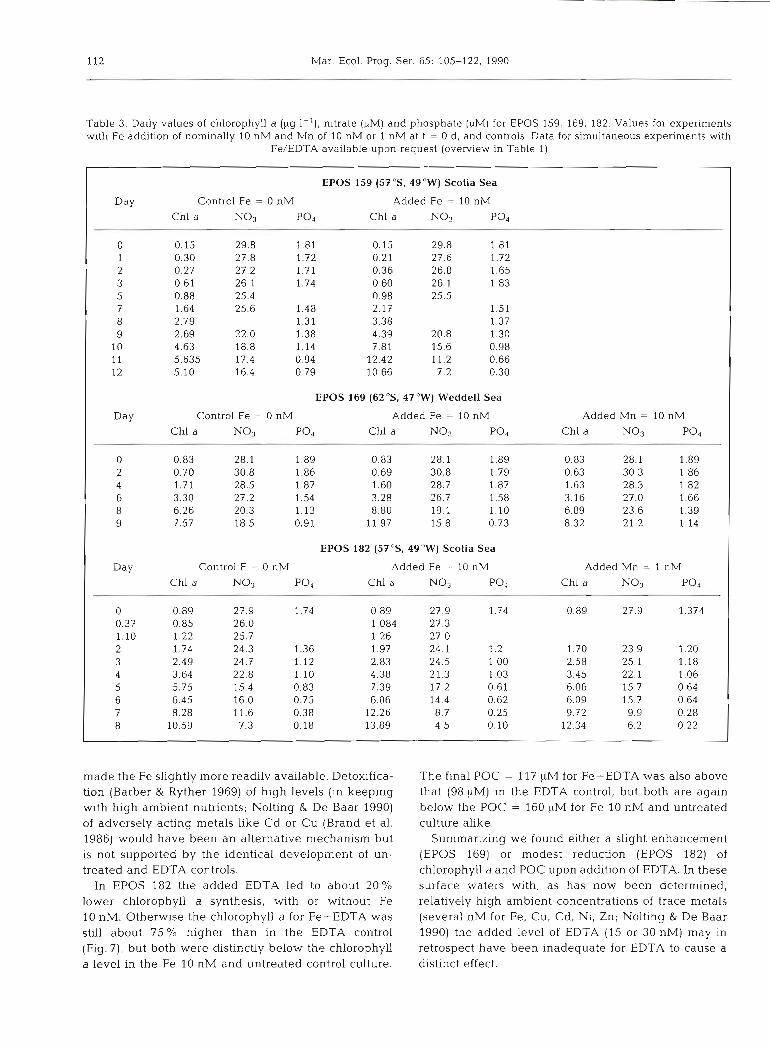
Table 3. Daily values of chlorophyll a (&g I-'), nitrate (FM) and phosphate (FM) for EPOS 159, 169, 182. Values for experiments with Fe addition of nominally 10 nM and Mn of 10 nM or 1 nM at t = 0 d, and controls. Data for simultaneous experiments with
Fe/EDTA available upon request (overview in Table 1)
EPOS 159 ( 5 7 5 , 4Q0W) Scotia Sea
Day Control Fe = 0 nM Added Fe = 10 nM
Chl a No3 PO, Chl a No3 p04
0 0.15 29.8 1.81 0.15 29.8 1.81 1 0.30 27.8 1.72 0.21 27.6 1.72 2 0.27 27.2 1.71 0.36 26.8 1.65 3 0.61 26.1 1.74 0 60 26.1 1.83 5 0.88 25.4 0.98 25.5 7 1.64 25.6 1.48 2.17 1.51 8 2.79 1.31 3.38 1.37 9 2.69 22.0 1.38 4.39 20.8 1.30
10 4.63 18.8 1.14 7.81 15.6 0.98 11 5.635 17.4 0.94 12.42 11.2 0.66 12 5.10 16.4 0.79 10.66 7.2 0.30
EPOS 169 (62 "S, 47"W) Weddell Sea
Day Control Fe = 0 nM Added Fe = 10 nM Added Mn = 10 nM
Chl a N o 3 p04 Chl a N o 3 p04 Chl a No3 p04
0 0.83 28.1 1.89 0.83 28.1 1.89 0.83 28.1 1.89 2 0.70 30.8 1.86 0.69 30.8 1.79 0.63 30.3 1.86 4 1.71 28.5 1.87 1.60 28.7 1.87 1.63 28.3 1.82 6 3.30 27.2 1.54 3 28 26.7 1.58 3.16 27.0 1.66 8 6.26 20.3 1.13 8.80 19.1 1.10 6.89 23.6 1.39 9 7.57 18.5 0.91 11 97 15.8 0.73 8.32 21.2 1.14
EPOS 182 (5ToS, 49OW) Scotia Sea
Day Control F = 0 nM Added Fe = 10 nM Added Mn = 1 nM
Chl a N o 3 p04 Chl a N o 3 p04 Chl a NO3 p04
0 0.89 27.9 1.74 0.89 27.9 1.74 0.89 27.9 1.374 0.37 0.85 26.0 1.084 27.3 1.10 1.22 25.7 1.26 27.0 2 1.74 24.3 1.36 1.97 24.1 1.2 1 .70 23.9 1.20 3 2.49 24.7 1.12 2.83 24.5 1.00 2.58 25.1 1.18 4 3.64 22.8 1.10 4.38 21.3 1.03 3.45 22.1 1.06 5 5.75 15.4 0.83 7.39 17.2 0.61 6.06 15.7 0.64 6 6.45 16.0 0.75 6.06 14.4 0.62 6.09 15.7 0.64 7 8.28 11.6 0.38 12.26 8.7 0.25 9.72 9.9 0.28 8 10.59 7.3 0.18 13.89 4.5 0.10 12.34 6.2 0 22
made the Fe slightly more readily available. Detoxifica- tion (Barber & Ryther 1969) of high levels (in keeping with high ambient nutrients; Nolting & De Baar 1990) of adversely acting metals like Cd or Cu (Brand et al. 1986) would have been an alternative mechanism but is not supported by the identical development of un- treated and EDTA controls.
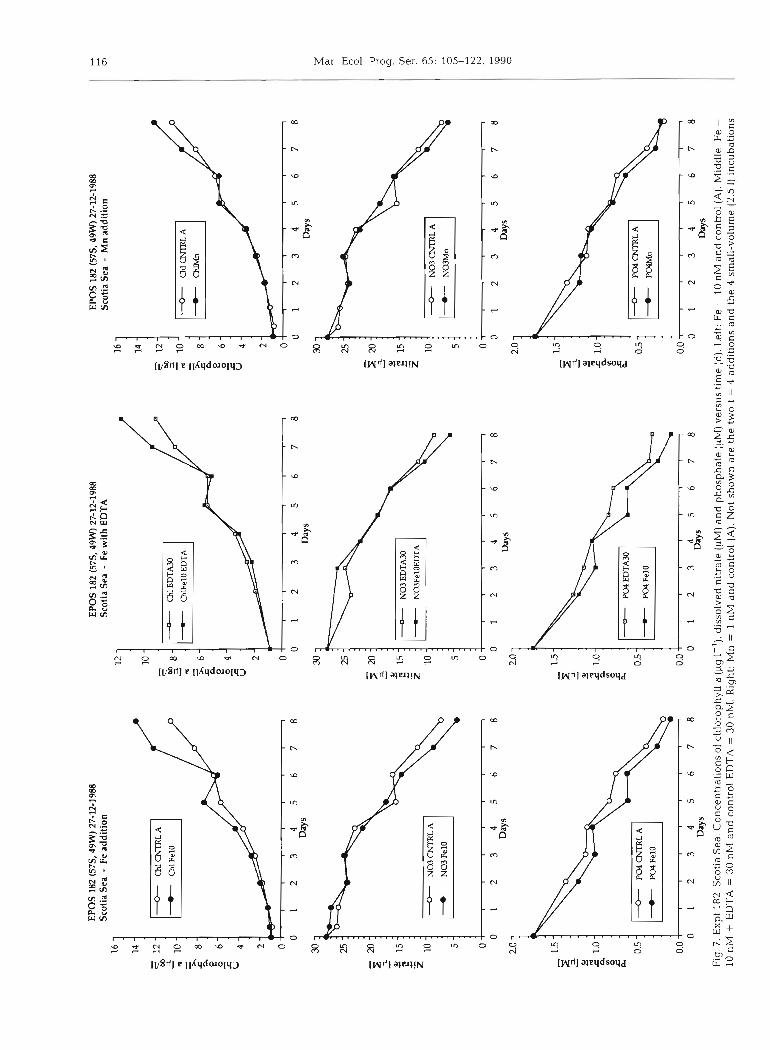
In EPOS 182 the added EDTA led to about 20% lower chlorophyll a synthesis, with or without Fe 10 nM. Otherwise the chlorophyll a for Fe+EDTA was still about 7.5% higher than in the EDTA control (Fig. 7), but both were distinctly below the chlorophyll a level in the Fe 10 nM and untreated control culture.
The final POC = 117 pM for Fe+EDTA was also above that (98 yM) in the EDTA control, but both are again below the POC = 160 pM for Fe 10 nM and untreated culture alike.
Surnmanzing we found either a slight enhancement (EPOS 169) or modest reduction (EPOS 182) of chlorophyll a and POC upon addition of EDTA. In these surface waters with, as has now been determined, relatively high ambient concentrations of trace metals (several nM for Fe, Cu, Cd, Ni, Zn; Nolting & De Baar 1990) the added level of EDTA (15 or 30 nM) may in retrospect have been inadequate for EDTA to cause a distinct effect.

De Baar et al.: Iron limitation of the Southern Ocean 113
Table 4. Initial and final values of particulate organic carbon (POC) for untreated controls and Fe = 10 nM incubations. Final POC values for Mn additions are mentioned in the text. Complete datasets available from principal authors, including the t = 4 d additions and 4 small-volume incubations of EPOS 182, are not dealt with here but otherwise show consistent trends for Fe and Mn. Relying also on data listed in Tables 2 and 3 various relations were calculated: (1) The ratio POC/chl at the end of the experiments is systematically lower in the Fe-enriched cultures, indicating that Fe stimulates chl synthesis more strongly than carbon fixation. (2) Slopes of linear regression (with correlation coefficient for given number of data points) of chl versus NO3 are systematically higher in the Fe = 10 nM versus controls. The ratio AC/AN for difference A over time interval t = 0 to t = end is also systematically higher in Fe - 10 nM versus controls. (3) The slope of linear regression chYchl for Fe = 10 nM and control respectively is systematically steeper than corresponding slope of N03 /N03 regression. The latter slope is steeper than for PO4/ PO4 of Fe = 10 nM and control respectively. The rauo ACIAC has values in between slopes of chl/chl and N03/N03. Summarizing, Fe appears to stimulate (i) chl synthesis, (li) carbon f~xation, (iii) NO3 assimilation and (iv) PO, assimilation in that
order Separate regressions for the first (3 to 6 d) and second periods of the experiments are shown in Fig. 9
EPOS station
145 158 159 169 182
Time (d) 0 10 10 0 8 8 0 12 0 9 0 8
Untreated control cultures
POC (PM) 12.5 136.7 135.0 15.0 95.0 84.2 4.2 89.3 5.0 80.0 10.8 160.0 POC/chl 238 212 129 82 178 181 320 231 77 127 148 181
Overall slopes of regression of 2 different properties throughout the control experiments:
Chl/N03 -0.37 -0.41 -017 -0.15 -0.45 -0.57 -0.48 Regress. coeff 1.00 0.95 0.93 0.87 0.98 0.98 0.99 Datapoints 6 7 6 5 10 6 10
NO3/Po4 16.2 15.7 23.0 29.4 12.8 11.3 13.8 Regress. coeff. 0.99 1.00 0.89 0.99 0.98 0.97 0.97 Datapoints 7 8 6 5 9 6 8
AC/AN 4.96 nd 3.7 3.5 7.0 7.8 7.23
Cultures with 10 n M Fe additions
POC (PM) 12.5 192.5 nd 15.0 138.3 4.2 191.7 5.0 90.8 10.8 160.8 POC/chl 238 118 82 156 320 216 77 91 148 139
Overall slopes of regression of 2 different properties throughout Fe-enriched experiments:
ChWN03 -0.48 -0.48 -0.29 -0.59 -0.78 -0.56 Regress. coeff. 0.91 0.88 0.97 0.98 0.99 0.98 Datapoints 8 8 6 9 6 10
NO3/P04 17 3 16.3 25.4 14.4 12.2 14.6 Regress. coeff. 0 98 0.99 0 97 0.99 0.97 0.91 Datapoints 8 8 6 8 6 8
AC/AN 6.52 nd 4.73 8.29 6.95 6.40
Comparison of Fe-enriched versus control experiment
Overall ratios of the same properties in the Fe-enriched versus the control experiment:
Chl/chl 1.31 1.53 2.00 2.10 1.60 1.40 Regress. coeff. 0.98 0.98 0.94 0.98 0.99 0.98 Datapoints 7 8 6 11 6 10
AC/AC 1.41 nd 1.54 2.14 1.14 1.01 NO3/No3 1.20 1.21 1.33 1.60 1.20 1.15
Regress. coeff. 0.99 0.99 1 00 0.98 1.00 0.99 Datapoints 14 14 12 9 6 10
P04 /P04 1.04 1.16 1.67 1.42 1.11 1.04 Regress. coeff. 0.96 0.99 0 98 0.98 0.99 0.99 Datapoints 16 16 12 10 6 8
nd: no data
114 Mar. Ecol. Prog. Ser. 65: 105-122, 1990
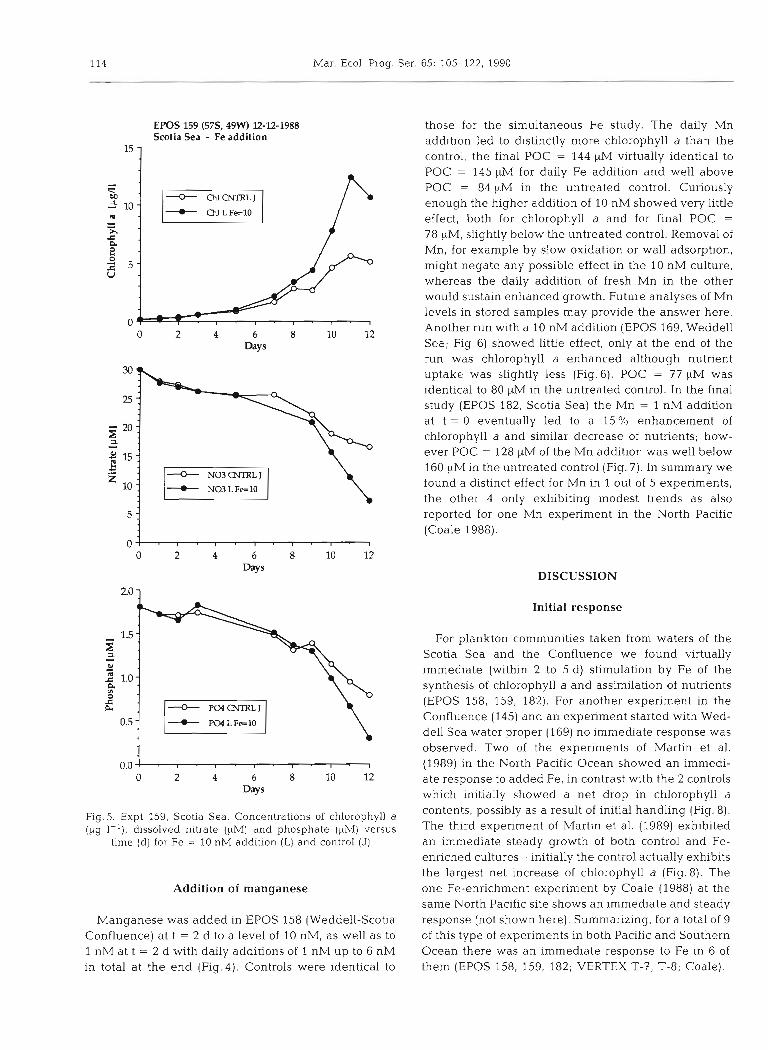
EPOS 159 (57S, 49W) 12-12-1988 Scotia Sea - Fe addition
"1 those for the simultaneous Fe study. The daily Mn addition led to distinctly more chlorophyll a than the control, the final POC = 144 WM virtually identical to POC = 145 pM for daily Fe addition and well above POC = 84 yM in the untreated control. Curiously enough the higher addition of 10 nM showed very little effect, both for chlorophyll a and for final POC =
78 pM, slightly below the untreated control. Removal of Mn, for example by slow oxidation or wall adsorption, might negate any possible effect in the 10 nM culture, whereas the daily addition of fresh Mn in the other would sustain enhanced growth. Future analyses of Mn levels in stored samples may provide the answer here. Another run with a 10 nM addition (EPOS 169, Weddell Sea; Fig. 6) showed little effect, only at the end of the run was chlorophyll a enhanced although nutrient uptake was slightly less (Fig. 6). POC = 77 pM was identical to 80 pM in the untreated control. In the final study (EPOS 182, Scotia Sea) the Mn = 1 nM addition at t = 0 eventually led to a 15 O/O enhancement of chlorophyll a and similar decrease of nutrients; how- ever POC = 128 yM of the Mn addition was well below 160 pM in the untreated control (Fig. 7). In summary we found a distinct effect for Mn in 1 out of 5 experiments, the other 4 only exhibiting modest trends as also reported for one Mn experiment in the North Pacific (Coale 1988).
DISCUSSION
Initial response
Fig.5. Expt 159, Scotia Sea. Concentrations of chlorophyll a (pg 1-l), dissolved nitrate ($M) and phosphate (FM) versus
time (d) for Fe = 10 nM addition (L) and control (J)
Addition of manganese
Manganese was added in EPOS 158 (Weddell-Scotia Confluence) a t t = 2 d to a level of 10 nM, as well as to 1 nM at t = 2 d with daily additions of 1 nM up to 6 nM in total at the end (Fig. 4 ) . Controls were identical to
For plankton communities taken from waters of the Scotia Sea and the Confluence we found virtually immediate (within 2 to 5 d) stimulation by Fe of the synthesis of chlorophyll a and assimilation of nutrients (EPOS 158, 159, 182). For another experiment in the Confluence (145) and an experiment started with Wed- dell Sea water proper (169) no immediate response was observed. Two of the experiments of Martin et al. (1989) in the North Pacific Ocean showed an immedi- ate response to added Fe, in contrast with the 2 controls which initially showed a net drop in chlorophyll a contents, possibly as a result of initial handling (Fig. 8). The third experiment of Martin et al. (1989) exhibited an immediate steady growth of both control and Fe- enriched cultures - initially the control actually exhibits the largest net increase of chlorophyll a (Fig. 8). The one Fe-enrichment experiment by Coale (1988) at the same North Pacific site shows an immediate and steady response (not shown here). Summarizing, for a total of 9 of this type of experiments in both Pacific and Southern Ocean there was an immediate response to Fe in 6 of them (EPOS 158, 159, 182; VERTEX T-7, T-8; Coale).
EPO
S 16
9 (6
2s. 47W) 17
-12-
1988
W
edde
ll S
ea -
Fe
wit
h E
DT
A
EPO
S 16
9 (6
2S, 4
7W) 1
7-12
-198
8 W
edde
ll S
ea -
Mn
add
itio
n
-+ Chl Fe=lO+ C
EPO
S 16
9 (6
2S, 47W) 17
-12-
1988
W
edde
ll S
ea -
Fe a
ddit
ions
12
-
l0 -
S.
8
-
- 4.
d
5 6
-
B -
S 4
-
C
U.
2 -
0
12 -
10 -
5 '2
8-
M
4.
m
A
6-
C
P
.
4-
8
.
2 -
0
II
II
II
l0 -
8 -
S.
a
W
6-
m - X
.
I1
O~
~~
l~
t~
I~
l
Ol
II
II
II
~~
I
01
23
45
67
89
0
12
34
56
78
9
01
23
45
67
89
D
ays
Day
S 3
5-
35
: 35
-
Day
s
30-
30-
'
z.
1
-.
?U{
- W.
2
25
- S
: Ii
: 2
.
2 m-
a-
15 -
II
II
10
30-
5 1
1 2 2
-
a-
I 15
I
~U
II
I
01
23
45
67
89
0
12
34
56
78
9
01
23
45
67
89
D
ays
Day
s 2.
0 2.
2 -
Day
s
1.8'-
O.
~~
~U
IU
IT
U~
I
2.5 -
1.8
1.6
P 20
: 1
1
W
M
E 1
.4
8:
m
C
.C
, 1.5
- 2 1
.2
8 :
C
L:
&
&.
1.0
1.0
- 0.
8
0.6
01
23
45
67
89
0
12
34
56
78
9
01
23
45
67
89
D
ays
Day
s D
ays
Fig
. 6. E
xpt
169,
Wed
dell
Sea
. C
once
ntra
tion
s of
ch
loro
phyl
l a
(pg
I-'),
di
ssol
ved
nitr
ate
(PM
) and
pho
spha
te (
PM
) ver
sus
tim
e (d
). L
eft:
Fe
= 1
0 n
M (
B)
and
cont
rol
(A).
M
iddl
e: F
e =
10
nM +
ED
TA
= 1
5 nM
and
ED
TA
= 1
5 nM
con
trol
. R
ight
: M
n =
10
nM
(E
) an
d c
ontr
ol (
A).
All
addi
tion
s at
t =
0, v
ersu
s co
ntro
ls
2.0
-
5 1
W
1.6-
..a m
C g
1.4-
C
L
1.2
-
1.0
-
0.
5~
~~
~~
11
~~
1
EPO
S 18
2 (5
7S, 4
9W)
27-U
-198
8 Sc
otia
Sea
- Fe
add
itio
n 16
- 14
- 5
12-
'2
.
- m 1
0-
-.
- 2
8-
P
.
d
0'
12
34
56
78
2.0 1
Days
EPO
S 18
2 (5
7S, 4
9W) 2
7-12
-198
8 Sc
otia
Sea
- F
e w
ith
ED
TA
12
-
10 -
0
4- 0
12
34
56
78
Days
30
1
EPO
S 18
2 (5
7S, 4
9W) 2
7-12
-198
8 Sc
otia
Sea
- M
n ad
diti
on
Fig
. 7
Exp
t 18
2, S
coti
a S
ea. C
once
ntra
tion
s of
chlo
roph
yll
a (p
g I-
'),
diss
olve
d ni
trat
e (y
M) a
nd
ph
osp
hat
e (P
M) v
ersu
s ti
me
(d).
Lef
t: F
e =
10
nM a
nd
con
trol
(A
). M
iddl
e: F
e =
10
nM
+ E
DT
A =
30
nM a
nd
con
trol
ED
TA
= 3
0 n
M.
Rig
ht:
Mn
= 1
nM
an
d c
ontr
ol (
A).
Not
sh
ow
n a
re t
he t
wo
t =
4 a
dd
it~
on
s an
d t
he
4 sm
all-
volu
me
(2.5
1) i
ncub
atio
ns
De Baar et al.: Iron limitation of the Southern Ocean 117
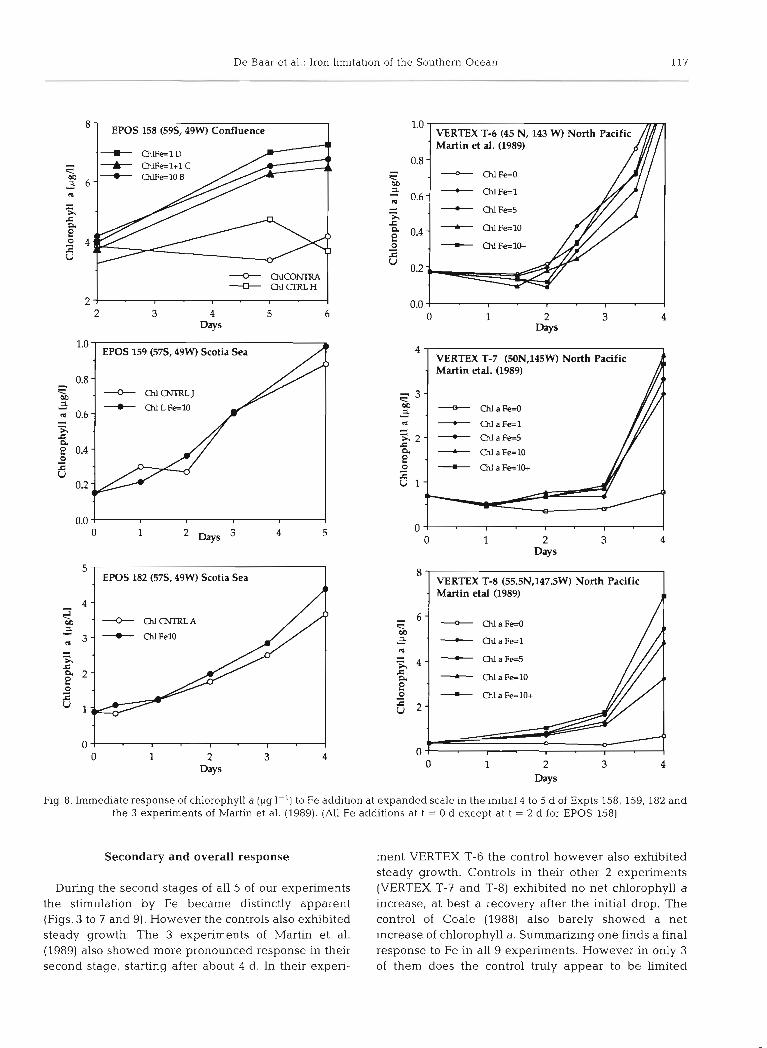
1 EPOS 158 (59S, 49W) Confluence
+ a c o r n * CM CIRLH
2 J
0.0 ! I I I
0 1 Days 3 4 5
EPOS 182 (57S, 49W) Scotia Sea
- U (hlCNTRLA
- --t- ChlFelO
I
VERTEX T-6 (45 N, 143 W) North Pacific Martin et al. (1989) - ChlFe=O - ChlFe=l - CNFe=5
- OIIFe=l(k
0.0 ! I I I 1 0 1 2 3 4
Days
0 0 1 2 3 4
Days
- VERTEX T-8 (55.5N,147.5W) North Pacific Martin etal (1989) I - ChlaFeEO b - CMaFe=l L
- - Chl a Fe==== - Chl aFe=lO - Ch1 a Fe=lO+
Fig. 8. Immediate response of chlorophyll a (pg l-l) to Fe addition at expanded scale in the initial 4 to 5 d of Expts 158, 159. 182 and the 3 experiments of Martin et al. (1989). (All Fe additions at t = 0 d except at t = 2 d for EPOS 158)
Secondary and overall response ment VERTEX T-6 the control however also exhibited steady growth. Controls in their other 2 experiments
During the second stages of all 5 of our experiments (VERTEX T-7 and T-8) exhibited no net chlorophyll a the stimulation by Fe became distinctly apparent increase, at best a recovery after the initial drop. The (Figs. 3 to 7 and 9). However the controls also exhibited control of Coale (1988) also barely showed a net steady growth. The 3 experiments of Martin et al. increase of chlorophyll a. Summarizing one finds a final (1989) also showed more pronounced response in their response to Fe in all 9 experiments. However in only 3 second stage, starting after about 4 d. In their experi- of them does the control truly appear to be Limited
118 Mar. Ecol. Prog. Ser. 65: 105-222, 1990
EPOS 145 (585, 49W) 27-11-88 Weddell Scotia Confluence
EPOS 159 (57S, 49W) 12-12-1988 Scotia Sea
5 10 Chl a [pgfll in Control
EPOS 169 (625,47W) 17-12-1988 Weddell Sea
14 I / A
Days 6 to 8 linear regression' l - y = - 3.45+ 2 . 0 0 ~ R A 2 = 0.996 0
0 0
y = 4.015 + 0.989~ RA2 = 0.998
1.1 line
j 0 2 4 6 8 10 12 14
Chl a [pg/l] in Control
Days 10 to 12 linear regression y= -13.04 + 4.56 X
RA2 =0.97 / r
0 1 chl 2 a lpg/ll 3 in Control 4 J 5 6
EPOS 182 (57S, 49W) 27-12-1988 Scotia Sea
Days 3 to 8 linear regression: 14 - y = 0.702 + 1.44~ RA2 = 0.983
0 . nowspnce -
Days 0 to 3 linear regression: y = 4.0445 + 1.148~ RA2 = O.%?
4 6 8 10 12 14 16 Chl a (pg/ll in Control
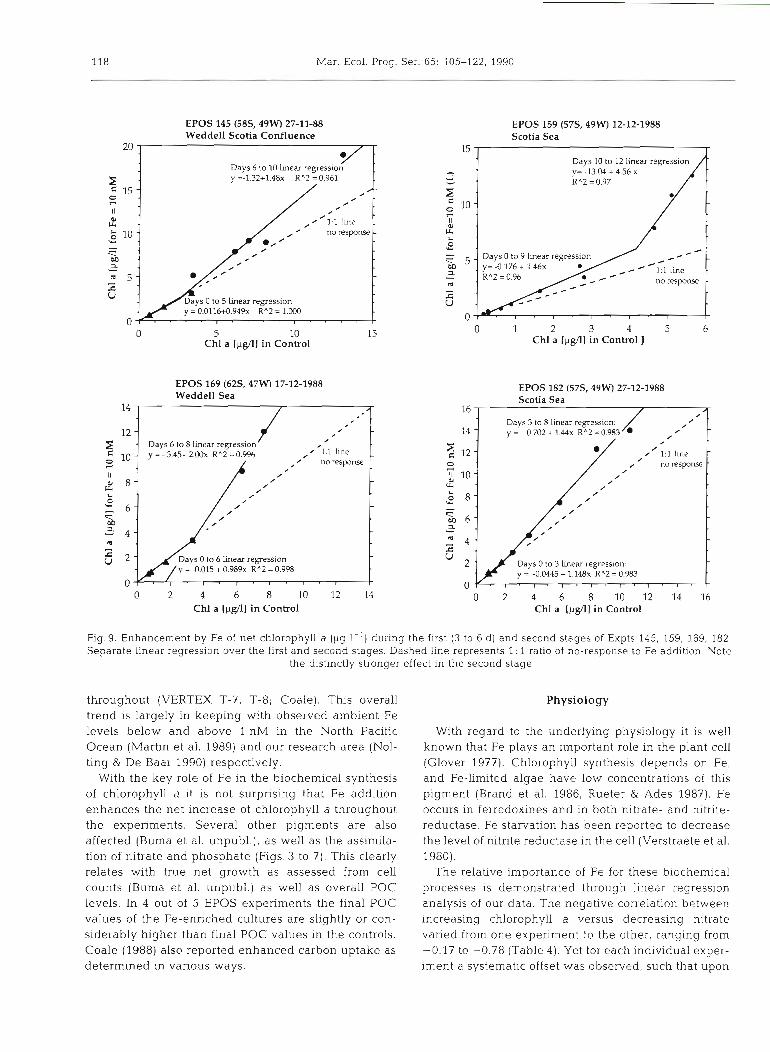
Fig.9. Enhancement by Fe of net chlorophyll a (pg 1 - l ) during the first (3 to 6 d) and second stages of Expts 145, 159, 169, 182 Separate linear regression over the first and second stages. Dashed line represents 1 : 1 ratio of no-response to Fe addition. Note
the distinctly stronger effect in the second stage
throughout (VERTEX T-7, T-8; Coale). This overall trend is largely in keeping with observed ambient Fe levels below and above 1 nM in the North Pacific Ocean (Martin et al. 1989) and our research area (Nol- ting & De Baar 1990) respectively.
With the key role of Fe in the biochemical synthesis of chlorophyll a it is not surprising that Fe addition enhances the net increase of chlorophyll a throughout the experiments. Several other pigments are also affected (Buma et al. unpubl.), as well as the assimila- tion of nitrate and phosphate (Figs. 3 to 7). This clearly relates with true net growth as assessed from cell counts (Buma et al. unpubl.) as well as overall POC levels. In 4 out of 5 EPOS experiments the final POC values of the Fe-enriched cultures are slightly or con- siderably higher than final POC values in the controls. Coale (1988) also reported enhanced carbon uptake as determined in various ways.
Physiology
Wlth regard to the underlying physiology it is well known that Fe plays an important role in the plant cell (Glover 1977). Chlorophyll synthesis depends on Fe, and Fe-limited algae have low concentrations of this pigment (Brand et al. 1986, Rueter & Ades 1987). Fe occurs in ferredoxines and in both nitrate- and nitrite- reductase. Fe starvation has been reported to decrease the level of nitrite reductase in the cell (Verstraete et al. 1980).
The relative importance of Fe for these blochemica1 processes is demonstrated through linear regression analysis of our data. The negative correlation between increasing chlorophyll a versus decreasing nitrate varied from one experiment to the other, ranging from -0.17 to -0.78 (Table 4 ) . Yet for each individual exper- iment a systematic offset was observed, such that upon
De Baar et al.: Iron limitatic ~n of the Southern Ocean 119
0 5 10 Uptake of Nitrate [PM] for Control
g 0.2 a - 5 0.0
0.0 0.2 0.4 0.6 0.8 1.0 1.2 Uptake of Phosphate [PM] for Control
- . EPOS 159 (57S, 49W) U-12-1988 - ScotiaSea
. ' 1:1 line .
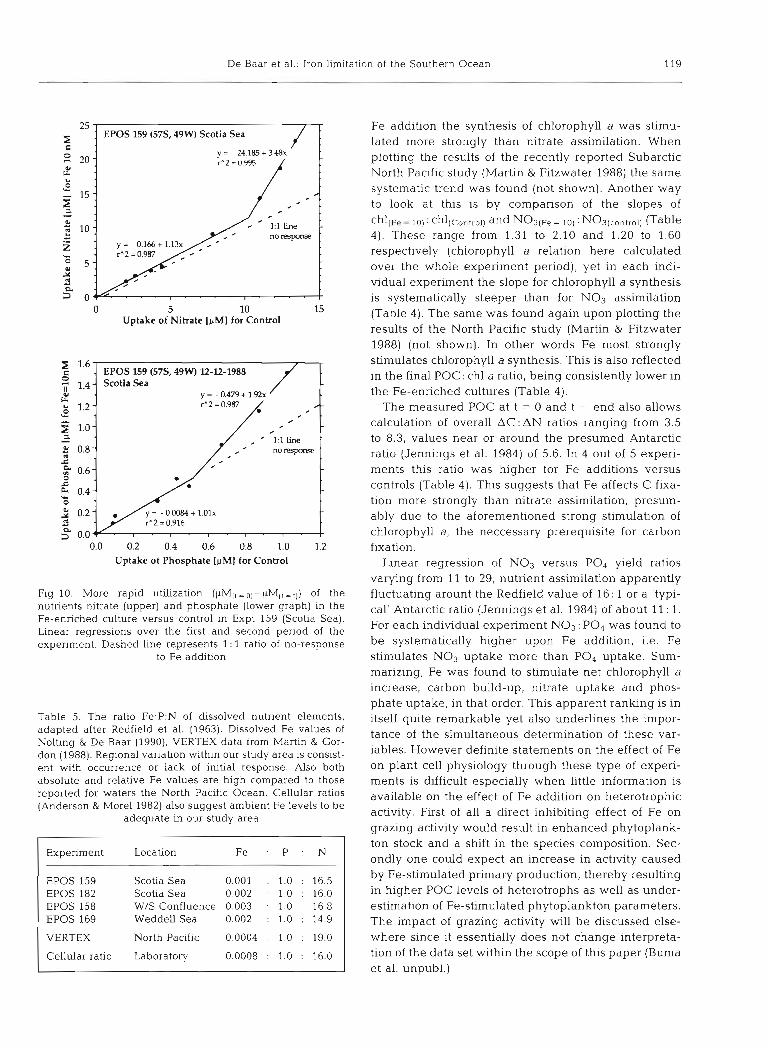
Fig. 10. More rapid utilization ( ~ M ( t = O I - ~ M ( t = r l ) of the nutrients nitrate (upper) and phosphate (lower graph) in the Fe-enriched culture versus control in Expt 159 (Scotia Sea). Linear regressions over the first and second period of the experiment. Dashed line represents 1: 1 ratio of no-response
to Fe addition
Table 5. The ratio Fe:P:N of dissolved nutrient elements, adapted after Redfield et al. (1963). Dissolved Fe values of Nolting & De Baar (1990), VERTEX data from Martin & Gor- don (1988). Regional variation within our study area is consist- ent with occurrence or lack of initial response. Also both absolute and relative Fe values are high compared to those reported for waters the North Pacific Ocean. Cellular ratios (Anderson & More1 1982) also suggest ambient Fe levels to be
adequate in our study area
Experiment Location Fe : P . N
EPOS 159 Scotia Sea 0.001 . 1.0 : 16.5 EPOS 182 Scotia Sea 0.002 : 1.0 : 16.0 EPOS 158 W/S Confluence 0.003 : 1.0 16.8 EPOS 169 Weddell Sea 0.002 : 1.0 : 14.9
VERTEX North Pacific 0.0004 . 1.0 : 19.0
Cellular ratio Laboratory 0.0008 : 1.0 : 16.0
Fe addition the synthesis of chlorophyll a was stimu- lated more strongly than nitrate assimilation. When plotting the results of the recently reported Subarctic North Pacific study (Martin & Fitzwater 1988) the same systematic trend was found (not shown). Another way to look at this is by comparison of the slopes of
ch l [~e - 10) : chl(~ontrol) and N 0 3 ( ~ e = 10) N03(cont ro l ) (Table 4). These range from 1.31 to 2.10 and 1.20 to 1.60 respectively (chlorophyll a relation here calculated over the whole experiment period), yet in each indi- vidual experiment the slope for chlorophyll a synthesis is systematically steeper than for NO3 assimilation (Table 4) . The same was found again upon plotting the results of the North Pacific study (Martin & Fitzwater 1988) (not shown). In other words Fe most strongly stimulates chlorophyll a synthesis. This is also reflected in the final POC: chl a ratio, being consistently lower in the Fe-enriched cultures (Table 4).
The measured POC at t = 0 and t = end also allows calculation of overall AC: AN ratios ranging from 3.5 to 8.3, values near or around the presumed Antarctic ratio (Jennings et al. 1984) of 5.6. In 4 out of 5 expen- ments this ratio was higher for Fe additions versus controls (Table 4). This suggests that Fe affects C fixa- tion more strongly than nitrate assimilation, presum- ably due to the aforementioned strong stimulation of chlorophyll a, the neccessary prerequisite for carbon fixation.
Linear regression of N o 3 versus PO4 yield ratios varying from 11 to 29, nutrient assimilation apparently fluctuating arount the Redfield value of 16 : 1 or a 'typi- cal' Antarctic ratio (Jennings et al. 1984) of about 11 : 1. For each individual experiment NO3 : PO4 was found to be systematically higher upon Fe addition, i.e. Fe stimulates NO3 uptake more than PO4 uptake. Sum- marizing, Fe was found to stimulate net chlorophyll a increase, carbon build-up, nitrate uptake and phos- phate uptake, in that order. This apparent ranlung is in itself quite remarkable yet also underlines the impor- tance of the simultaneous determination of these var- iables. However definite statements on the effect of Fe on plant cell physiology through these type of experi- ments is difficult especially when little information is available on the effect of Fe addition on heterotrophic activity. First of all a direct inhibiting effect of Fe on grazing activity would result in enhanced phytoplank- ton stock and a shift in the species composition. Sec- ondly one could expect an increase in activity caused by Fe-stimulated primary production, thereby resulting in higher POC levels of heterotrophs as well as under- estimation of Fe-stimulated phytoplankton parameters. The impact of grazing activity will be discussed else- where since it essentially does not change interpreta- tion of the data set within the scope of this paper (Buma et al. unpubl.)
120 Mar. Ecol. Prog. Ser. 65: 105-122, 1990
Implications for the field
When extrapolating results of the above shipboard laboratory experiments to the in situ ecosystem it appears conceivable that Fe may occasionally stimu- late phytoplankton growth and utilization of macro- nutrients in Scotia/Weddell Sea waters, since addition of Fe did indeed enhance phytoplankton biomass in comparison with the control experiments. However, there was a steady increase of chlorophyll a in the control bottles as well, reaching concentrations higher than ambient chlorophyll a levels. This was also found in one of the 3 Subarctic North Pacific experiments (Martin & Fitzwater 1988). Such findings suggest that experimental conditions in the controls were more favourable for phytoplankton growth than conditions in the field, obviously eliminating one (or more) growth suppressing factor which only exists in the field. Here we think of the turbulence regime or the remarkably intense grazing pressure by large herbivores such as Euphausia superba (Hempel et al. 1989). Also the con- stant light at the prescribed saturation level could benefit the steady build-up of phytoplankton biomass. The experimental approach of studying one limiting factor (Fe) dictates ruling out other limiting factors (light, large grazers). Inevitably the adopted experi- mental conditions will always deviate from the compli- cated and dynamic in situ conditions.
in the Scotia Sea. Higher levels of about 5 to 7 nM in the Confluence and Weddell Sea are consistent with the initial no-response period for the corresponding EPOS 145 and 169. These Fe levels are quite low but still an order of magnitude above those reported for surface waters in the North Pacific Ocean (Martin &
Gordon 1988). Upon addition of 1 nM Fe the effect was indeed less dramatic in our experiments as compared to the one North Pacific experiment of Coale (1988) and 2 of the 3 North Pacific experiments of Martin & Fitzwa- ter (Martm & Fitzwater 1988; their third experiment with steady growth of the control being remarkably similar to ours). When comparing our data on extended Fe: nutrient ratios with other areas (Table 5) ~t is obvi- ous that Fe was relatively high in the EPOS study area. Moreover Fe :P :N ratios match with a cellular ratio given by Anderson & More1 (1982) consistent with our findings that in situ Fe concentrahons can support phytoplankton growth adequately.
On the other hand surface water levels of Cd and Cu were about 0.4 to 0.8 and 3 to 4 nM respectively (Nolt- ing & De Baar 1990), in keeping with the higher nu- trient levels. Both Cd and Cu are known to be mostly toxic (Brand et al. 1986) and at the high levels encoun- tered may suppress rather than limit Antarctic phyto- plankton growth. In one experiment concurrent with EPOS 182 the added l nM of Cu did indeed yield slightly lower growth (Buma et al. unpubl.) (not shown, small 2.5 1 experiments listed in Table 1).
Ambient levels of dissolved iron Possible sources of dissolved iron
It is interesting to note that in Weddell Sea water and Weddell-Scotia Confluence water the added Fe only showed a pronounced effect after several days, once the cultures had reached levels of chlorophyll a and nutrients comparable to the maximum and minimum levels observed respectively in the real field situation during the cruise. This would suggest that there is adequate Fe in Antarctic waters to support modest growth and biomass, but not enough for efficient utili- zation of macronutrient resources. In those instances where phytoplankton growth is not limited by light, and stocks not depleted through intense grazing, Fe might become a limiting factor in these areas.
The experiments from the Scotia Sea (EPOS 159, 182) showed a more pronounced Fe effect right from the start (Table 2, Fig. 9). Here Fe-stimulated growth occurred at high nutrient levels, comparable with the field situation. However, in these waters too the hypothesis of Fe limitation does not receive full support when phytoplankton growth in the control bottles is considered. Our recent analyses (Nolting & De Baar 1990) of filtered seawater collected during the same expedition yielded ambient Fe levels of about 2 to 4 nM
Assuming steady state it appears that either the sur- face waters recycle their Fe resources quite efficiently, or there is an adequate supply from external sources. Here we observe that ice zone blooms (Sullivan et al. 1988) are associated with less saline meltwater, which may also carry an elevated Fe (Mn) signal from dust input. The EPOS Leg 2 study site, downwind and downstream from relatively nearby landmasses (America, Antarctic Peninsula) may receive adequate inputs from both aeolian and continental shelf sources. Nolting & De Baar (1990) report very high dissolved Fe levels of about 60 nM for a station on the shelf of the nearby South Orkney Islands. With similarly high dis- solved Fe over the shelves around the Antarctic Penin- sula and the general eastward flow of waters along the peninsula into our research area (Fig. 1) the supply of dissolved Fe would be adequate. In this respect the remote Indian and Pacific sections of the Southern Ocean might be more likely candidates for occasional limitation by Fe alone. Nevertheless the ~mportance of our Weddell-Scotia Sea study area for the overall South- ern Ocean cannot b e ignored. On the other hand one

De Baar et al.: Iron limitatic )n of the Southern Ocean 121
cannot avoid observing the many 'dirty' icebergs which slowly melt while drifting away from the Antarctic continent. They are literally carrylng along dirt - weath- ered material rich in A1 and Fe - of which at least a portion would dissolve and become available for plant uptake. These icebergs exist not only in the Weddell Sea but all around the Antarctic continent and might well be the missing source for the Fe budget (Martin & Fitzwater 1988) of the Southern Ocean, as actually already sug- gested by Hart (1934, p. 186).
CONCLUSIONS
From this and other studies (Martin & Fitzwater 1988, Martin & Gordon 1988, Coale 1988) it appears that Fe deficiency may occur once surface water levels are around or below the 0.1 to l nM range, presumably also depending on such factors as phytoplankton species and abundance, grazing, light and availability of other nutrients (Table 5). The Limited available data indicate Fe in oceanic surface waters to range from about 0.05 to 5 nM (Symes & Kester 1985, Hong & Kester 1986, Landing & Bruland 1987, Martin & Fitzwa- ter 1988, Martin & Gordon 1988, Saager et al. 1989, Nolting & De Baar 1990, Nolting et al. 1990) and Fe deficiency may occur more commonly than hltherto acknowledged. The role of Fe and other trace elements in affecting oceanic productivity deserves considerable attention (Martin & Fitzwater 1988, Martin & Gordon 1988), notably In current programmes like the Joint Global Ocean Flux Study (De Baar et al. 198913) which focus on past and present ocean/atmosphere exchange of CO, as one of the controls (Broecker & Denton 1989, De Baar & Stoll 1989) on the global carbon cycle.
The results of our study within the larger EPOS context (Hempel et al. 1989) confirm for the first time the original suggestion (Hart 1934) that Fe is one of several chemical and physical factors affecting phyto- plankton production in the Weddell-Scotia Sea.
Fe is not the single limiting factor (Martin & Fitzwater 1988, Martin & Gordon 1988, Martin et al. 1989, Martin 1990) for the biota in the Scotia-Weddell-Sea, although stimulation of phytoplankton growth can be achieved by addition of Fe, especially in the Scotia Sea region. Marginal sediments may provide ample dssolved Fe supporting at least minimum growth of phytoplankton (Nolting & De Baar 1990). More remote sectors of the Southern Ocean might in the future be demonstrated to be a more likely site for occasional Fe limitation. Limita- tion of the vast assemblage of various Antarctic ecosys- tems by just one single factor, e.g. Fe, would appear unlikely. In the Weddell-Scotia Seas, an important and well-studied (Hart 1934, Hempel et al. 1989) sector of the overall Southern Ocean, Fe deficiency can only be partly responsible for the Antarctic Paradox 'that the
growth of the plankton diatoms is determined by other factors than the concentration of phosphates and ni- trates besides light and temperature' (Gran 1931).
Acknowledgements. We express our sincere gratitude to the European Science Foundation, the Deutsche Forschungs- gemeinschaft and the Alfred Wegener Institut for allowing participation in EPOS. Officers and crew are thanked for accomodating our scientific and other needs most efficiently and pleasantly aboard the splendid RV 'Polarstern' through- out the fascinating journey. Speclal thanks go to our friends and colleagues Johan van Bennekom, Leo Goeyens, Jan Hegeman, Annick Masson, Jean Morvan and Michel Panouse for outstanding analytical support of this project. Peter Bjom- sen, Edna Graneli, Christiane Lancelot, Louk Lindner, Pieter- nel Montijn, Sven Ober, Ralph Schmidt, Victor Smetacek and Cees Veth each contributed in their individual unique way. Jacob Larsen and Helge Thoinsen provided valuable com- ments on an earlier version of the manuscript. Constructive comments by Dick Eppley, Winfried Gieskes. James Lovelock, Roe1 hegman , Marcel Veldhuis and Michael Whitfield are gratefully acknowledged. The excellent suggestions of 3 anonymous reviewers were gratefully incorporated in the manuscript. This research was supported by N W 0 (The Netherlands) and INSU (France).
LITERATURE CITED
Barber, R. T.. Ryther, J. H. (1969). Organic chelators: factors affecting prlmary production in the Cromwell Current upwelling. J . exp. mar. Biol. Ecol. 3: 191-193
Anderson, G. C., Morel, F. M. M. (1982). The influence of aqueous iron chemistry on the uptake of iron by the coastal diatom Thalassiosira weissflogii. Limnol. Oceanogr. 27: 789-813
Brand, L. E . , Sunda, W. G., Gulllard, R. R. L. (1986). Reduction of marine phytoplankton reproduction rates by copper and cadmium. J. exp. mar Biol. Ecol. 96: 225-250
Broecker, W. S., Denton, G. H. (1989). The role of ocean- atmosphere reorganizahons in glacial cycles. Geochim. Cosmochim. Acta 53: 2465-2501
Buma, A. G. J . , Nolting R. F., De Baar, H. J . W., Cadee, G. C.. Jacques, G.. Treguer, P. (1990). Testing the iron limitation hypothesis for phytoplankton from the Southern Ocean. EOS (Trans. Am. Geophys. Un.) 71: 67 (Abstract)
Byrne, R. H., Kump, L. R . , Cantrell, K. J . (1988) Theinfluence of temperature and pH on trace metal speciation In seawater. Mar. Chem 25: 163-181
Carlucci, A. F.. Cuhel, R. L. (1977). Vitamins in the south Polar Seas: distribution and significance of dissolved and particu- late vitamin B,,, thiamine, and biotin in the Southern Indian Ocean. In: Llano, G. A. (ed.) Adaptations within manne ecosysten~s. Smithsonian Institute, Washmgton, D. C., p . 115-128
Coale, K. H. (1988). Effects of iron, manganese, copper and zinc enrichments on productivity and biornass in the Subarctic Pacific. In: Copper complexation in the North Pacific Ocean. Ph. D. dissertation, Univ. of Cahfornia, Santa Cruz, Chap. 3, p. 148- 199
De Baar, H. J . W., Buma, A. G. J.. Jacques, G. Nolting, R. F., Treguer, P. J. (1989a). Trace metals - iron and manganese effects onphytoplankton growth. Ber. Polarforsch. 65: 3 4 4 4
De Baar, H. J . W., Fransz, H. G., Ganssen, G. M., Gieskes, W W. C., Mook, W. G. , Stel, J. H. (198913). Towards a joint global ocean flux study: rationale and objectives. In: Ayala-Cas- tanares, A.. Wooster, W. A., Yanez-Arancibia, A. (eds.)

122 Mar. Ecol. Prog. Ser. 65: 105-122. 1990
Oceanography 1988, Proceedings Joint Oceanographic Assembly. Acapulco, Mexico p. 11-33
De Baar, H J . W., Stoll, M. H. C. (1989). Storage of carbon dioxlde In the oceans. In: Okken, P. A.. Swart, R. I., Zwewer, S. (eds.) Climate and energy: the feasibility of controlling COz emiss~ons. Kluwer Acad. Publ., London, p. 143-177
El-Sayed, S. Z. (1984). Productivity of the antarctic waters - A reappraisal. In: Holm-Hansen, O., Bolis, L., Gilles, R. (eds.) Marine phytoplankton and productivity. Springer-Verlag, Berlin, p. 19-34
Fogg, G. E. (1977). Aquatic primary production in the Antarctic. Phil. Trans. R. Soc. 279: 27-38
Glover, H. E. (1977). Effect of iron-deficiency on Isochrysis galbana (Chrysophyceae) and Phaeodactylum tricornutum (Bacillariophyceae). J . Phycol. 13: 208-212
Gran, H. H. (1931). On the conditions for production of plank- ton in the sea. Rapp. P.-v. Cons. perm. Explor. Mer 75: 37-4 6
Gran. H. H. (1932). Phytoplankton. Methods and problems. J. Conseil VII: 343-358
Hart, T. J (1934). On the phytoplankton of the Southwest Atlantic and the Bellinghausen Sea 1929-1931. 'Discovery' Rep. 8: 1-268
Harvey. H. W. (1933) On the rate of diatom growth. J . mar. biol. Ass U. K . 19: 253-276
Harvey, H. W. (1937a). Thesupply of iron to diatoms. J . mar. biol. Ass. U. K. 22: 205-219
Harvey, H. W. (1973b). Note on colloidal ferric hydroxide in sea water. J. mar. biol. Ass. U.K. 22: 221-225
Hayes, P. K.. Whitaker,T.M., Fogg, G. E. (1984).Thedistribution and nutrient status of phytoplankton in the Southern Ocean between 20 and 70°W Polar Biol. 3: 153-165
Hempel, I., Schalk, P H. , Smetacek. V (1989). The expedition Antarktis VII/3 (EPOS LEG 2) of RV 'Polarstern' in 1988/ 1989. Ber Polarforsch. 65: 1-199
Holm-Hansen, 0 . (1985). Nutrient cycles in the marine ecosys- tems. In: Siegfried, W. R., Condy, P. R., Laws, R M. (eds.) Antarctic nutrient cycles and food webs. Springer-Verlag, Berlin, p. 6-10
Holm-Hansen, O., Huntley, M. (1984). Feeding requirements of krill in relation to food sources. J . Crust. Biol. 4(1): 156-173
Hong, H., Kester, D. R. (1986). Redox state of iron in the offshore waters of Peru. Limnol. Oceanogr. 31(3): 512-524
Jacques, G., Minas, M. (1981). Production prirnaire dans le secteur indien de l'ocean Antarctique en fin d'ete. Oceanologica Acta 4: 33-41
Jacques, G. , Fiala, M., Oriol, L. (1984). Demonstration, a partir de tests biologiques, de l'effet negligeable des elements traces sur la croissance du phytoplancton antarctique. C.-r. Acad. Sci. Paris 298: 527-530
Jennings, Jr. J. C., Gordon, L. I., Nelson, D. H. (1984). Nutrient depletion indicates highprimary productivity in the Weddell Sea. Nature, Lond. 309 51-54
Johnston, R. (1964). Sea water, the natural medium of phyto- pIankton. J mar biol. Ass. U. K 44: 87-109
Lancelot, C., Mathot, S. (1989). Phytoplankton: photosynthesis, growth and respiration. Ber. Polarforsch. 65: 78-86
Landing, W M., Bruland, K. W. (1987). The contrasting biogeochemistry of iron and manganese in the Pacific Ocean. Geochim. Cosrnochim. Acta 51: 2 9 4 3
Marra, J. (1978). Effect of short term variations in light intensity on photosynthesis of a marine phytoplankter; a laboratory simulation study. Mar Biol 46: 191-202
This article was submitted to the editor
Martin, J . H. (1990). Glacial-interglacial CO2 change: the iron hypothesis. Paleoceanography 5: 1 - 13
Martin, J. H , Fitzwater, S. E. (1988). Iron deficiency limits phytoplankton growth in the north-east Pacific subarctic. Nature, Lond. 331: 341-343
Martin, J. H., Gordon, R. M. (1988). Northeast Pacific Iron distributions in relation to phytoplanktonproductivity. Deep Sea Res. 35: 177-196
Martin, J. H., Gordon, R. M,, Fitzwater, S. (1989). VERTEX: phytoplankton/iron studies in the Gulf of Alaska. Deep Sea Res. 35 (5): 649-680
Menzel, D. W., Ryther, J . H. (1961). Nutrients limiting the production of phytoplankton in the Sargasso Sea, with special reference to iron. Deep Sea Res 7: 276-281
Millero, F. J., Sotolongo, S., Izaguirre, M. (1987). The oxidation lunetics of Fe (11) In seawater. Geochim. Cosmochim. Acta 51: 793-801
Neveux, J . , Panouse, M. (1987). Spectrofluorometric determina- tion of chlorophylls and pheophytins. Arch. Hydrobiol. 109: 567-581
Nolting, R. F., De Baar, H. J . W. (1990). Dissolved Fe, Cu, Zn and Cd in the Weddell and Scotia Seas oi the Southern Ocean. EOS (Trans. Am. Geophys. Un.) 71: 67 (Abstract)
Nolting, R. F., De Baar, H. J . W., De Jong, J. T. M. (1990). JGOFS North Atlantic Pilot Study: trace metal distributions. In: De Baar, H. J . W. Data Report of RV TYRO JGOFS, 1989 Leg I . NetherlandsInstitutefor SeaResearch (NIOZ) Report 1990-X
Orren, M. J . , Monteiro, P. M. S. (1985). Trace element geochemistry in the Southern Ocean. In: Siegfried, W. R., Condy, P. R., Laws, R. M. (eds.) Antarctic nutnent cycles and food webs. Springer-Verlag, Berlin, p. 30-37
Priddle, J . , Hawes, I . , Ellis-Evans, J C., Smith, T. J . (1986). Antarctic aquatic ecosystems as habitats for phytoplankton. Biol. Rev. 61: 199-238
Queguiner, B., Legendre, L. (1986). Phytoplankton photo- synthetic adaptation to high frequency light simulating those induced by sea surface waves. Mar. Biol. 90: 483-491
Rueter, J. G., Ades, D. R. (1987). The role of iron nutrition in photosynthesis and nltrogen assimilation in Scenedesmus quadricauda (Chlorophycea). J. Phycol. 23. 452457
Ruud, J. T. (1930). Nitratesand phosphatesin the Southern Seas. J . Conseil V: 347-360
Redfield, A. C.. Ketchum, B. H., hchards, F. A. (1963). The influence of organisms on the composition of seawater. In: Hill, M. N. (ed.) The sea. Wiley Interscience. New York, p. 26-77
Saager, P. M,, De Baar, H. J. W., Burk~ll, P. H. (1989). Manganese and iron in Indian Ocean waters. Geochim. Cosmochim. Acta 53: 2259-2267
Sullivan, C. W., McClain, C. R . , Comiso, J . C., Smith, W. 0 Jr. (1988). Phytoplankton standing crops within an antarctic ice edge assessed by satellite remote sensing. J Geophys Res. 93. 12487-12 498
Symes, C. J., Kester, D. R. (1985). The distribution of iron in the Northwest Atlantic. lMar Chem 17: 57-74
Thompson. T. G.. Bremner, R. W. (1935). The occurrence of iron in waters of the northeast Paclfic Ocean. J. Consell 10: 39-47
Treguer, P. J. , Jacques, G. (1986). L'Ocean Antarctique. Recherche 178: 746-755
Verstraete, D., Storch, R., Dunham, V. L. (1980). Acomparisonof the influence of iron and n~trate metabolism of Anabaena and Scenedesmus. Physiol. Plant 50: 47-51
W a ~ t e , T D., Morel, F. M M. (1984). CouIometric study of the redox dynamics of iron in seawater. Analyt. Chem. 56: 787-792
Manuscript first received: February 13, 1990 Revlsed version accepted: May 16, 1990