Embed Size (px)
Citation preview

Interactive Realtime Multimedia Applications on Service Oriented Infrastructures
ICT FP7‐214777
WP 7 Intelligent Networking
D7.4.1 Initial version of Path supervision Architecture
IRMOS_WP7_D7_4_1_PU_ALUD_v1_0
Scheduled Delivery: 30/11/2009 Actual Delivery: 30/11/2009 Version 1.0
Project co‐funded by the European Commission within the 7th Framework Programme Dissemination Level
PU Public X PP Restricted to other programme participants (including the Commission) RE Restricted to a group specified by the consortium (including the Commission)
CO Confidential, only for members of the consortium (including the Commission)

IRMOS IRMOS_WP7_D7_4_1_PU_ALUD_v1_0
Interactive Realtime Multimedia Applications on Service Oriented Infrastructures Created on 30/11/2009
D7.4.1 Initial version of Path supervision Architecture
© ALUD and other partners of the IRMOS consortium 2008‐2009 page 2/57
R esponsible Partner: Alcatel‐Lucent Deutschland AG (ALUD)
Revision history: Date Editor Status Version Changes 07.08.2008 Karsten
Oberle Draft 0.01 Initial Release
17.09.2008 Karsten Oberle
Draft 0.02 Input on performance metrics
08.12.2008 Karsten Oberle
Draft 0.1 Update of ToC and all sections
13.03.2009 Thomas Voith Draft 0.2 Integration of TID, ALUD input Indicating the scope of doc and relation to other D’s Adaption to new IRMOS template
20.4.2009 Thomas Voith Draft 0.3 Input from TID (ch. 4.6) Work assignments added
25.5.2009 Thomas Voith Draft 0.4 Input from GA meeting in Sestri Levante New chapter 6.1, clock synchronization
26.6.2009 Thomas Voith Draft 0.5 Input from TID included Implementation proposal added (ch. 9.2)
5.10.2009 Thomas Voith Draft 0.6 Work assignments included Partner inputs included Annex deletion candidate deleted. Monitoring example added Order changed in ch. 6 to bottom up (IXB towards FS)
9.10.2009 Thomas Voith Draft 0.7 RK, USTUTT input Some comments has been addressed
26.10.2009 Thomas Voith Draft 0.8 Input ALUD
28.10.2009 Thomas Voith Draft 0.9 Ch. 17 ready for WP7 internal review Chapter 8 is not ready
2.11.2009 Thomas Voith Draft 0.10 Addressing comments an input from WP7 internal review
4.11.2009 Thomas Voith Draft 0.11 Includes all WP7 input for last tuning
4.11.2009 Thomas Voith Draft 0.12 Version for internal QA review
24.11.2009 Thomas Voith Draft 0.13 Updated version for reviewers check
27.11.2009 Thomas Voith Draft 0.14 Clean version for QA check
30.11.2009 Thomas Voith Final 1.0 Final Version for submission to the EC

IRMOS IRMOS_WP7_D7_4_1_PU_ALUD_v1_0
Interactive Realtime Multimedia Applications on Service Oriented Infrastructures Created on 30/11/2009
D7.4.1 Initial version of Path supervision Architecture
Authors Thomas Voith, Markus Bauer, Manuel Stein, Karsten Oberle (ALUD), Roland Kübert, Sören erger, Yuri Grosman (USTUTT), Ralf Einhorn (DTO), Tor Neple (SINTEF), Eduardo Oliveros, osé Luis Urien (TID)
© ALUD and other partners of the IRMOS consortium 2008‐2009 page 3/57
BJ
), Tommaso Cucinotta (SSSA) Internal Reviewers ndividual reviewers: Kleopatra Konstanteli (NTUAonsolidating reviewer: Malcolm Muggeridge (XY) IC Copyright This report is © by ALUD and other members of the IRMOS Consortium 2008‐2009. Its uplication is allowed only in the integral form for anyone's personal use and for the urposes of research or education. dp Acknowledgements The research leading to these results has received funding from the EC Seventh Framework Programme FP7/2007‐2011 under grant agreement n° 214777 More information Tfhe most recent version of this document and all other public deliverables of IRMOS can be ound at http://www.irmosproject.eu

IRMOS IRMOS_WP7_D7_4_1_PU_ALUD_v1_0
Interactive Realtime Multimedia Applications on Service Oriented Infrastructures Created on 30/11/2009
D7.4.1 Initial version of Path supervision Architecture
© ALUD and other partners of the IRMOS consortium 2008‐2009 page 4/57
Glossary of Acronyms Acronym Definition ASC Application Service Component (IRMOS) A‐SLA Application – SLA (IRMOS) ATCA Advanced Telecommunications Computing Architecture BE Best effort CLI Command Line Interface CORBA Common Object Request Broker Architecture CFQ Completely Fair Queuing CRC Cyclic Redundancy Check D Deliverable Diffserv Differentiated Services (IETF) DM Deployment Manager (IRMOS) EC European Commission EE Execution Environment (IRMOS) FBB Functional Building Block FS Framework Services (IRMOS) FSC Framework Service Component (IRMOS) GPS Global Positioning System GT4 Globus Toolkit Version 4 HRP Hypothetical Reference Path (ITU‐T) HW Hardware IEEE Institute of Electrical and Electronics Engineers IETF Internet Engineering Task Force IGP Interior Gateway Protocol Intserv Integrated Services (IETF) IP Internet Protocol IPDV IP Packet Delay Variation IPER IP Packet Error Ratio IPLR IP Packet Loss Ratio IPTD IP Packet Transfer Delay IRMOS Interactive Real‐time Multimedia Applications on Service Oriented
Infrastructures ISONI Intelligent Service Oriented Network Infrastructure ITU‐T International Telecommunication Union ‐ Telecommunication
Standardization Sector IMXB ISONI Exchange Box (IRMOS) LAN Local Area Network M Monitoring MPLS Multi Protocol Label Switching MTU Maximal Transfer Unit NE Network Elements

IRMOS IRMOS_WP7_D7_4_1_PU_ALUD_v1_0
Interactive Realtime Multimedia Applications on Service Oriented Infrastructures Created on 30/11/2009
D7.4.1 Initial version of Path supervision Architecture
© ALUD and other partners of the IRMOS consortium 2008‐2009 page 5/57
NTP Network Time Protocol OS Operating System OSI Open Systems Interconnection (Reference Model) OSPF Open Shortest Path First (IETF) OWAMP One‐way Active Measurement Protocol OWD One Way Delay OWLR One Way Loss Rate PH Physical Host (IRMOS) PM Path Manager (IRMOS) QoS Quality of Service RED Random Early Detection RM Resource Manger (IRMOS) RPC Remote Procedure Call RSVP ReSerVation Protocol (IETF) RTCP RTP Control Protocol RTP Real‐time Transport Protocol RX Receiver SaaS Software as a Service SBM Subnet Bandwidth Management SC Service Component (IRMOS) SDH Synchronous Digital Hierarchy SLA Service Level Agreement SNMP Simple Network Management Protocol SOAP Simple Object Access Protocol SONET Synchronous optical networking TCP Transmission Control Protocol T‐SLA Technical‐ SLA (IRMOS) TTL Time To Live TWAMP Two‐way Active Measurement Protocol TX Transmitter UDP User Datagram Protocol UTC Universal Time Coordinated VL Virtual Link (IRMOS) VMU Virtual Machine Unit (IRMOS) VoIP Voice over IP VSN Virtual Service Network (IRMOS) VSND Virtual Service Network Description (IRMOS) WE Workflow Enactor (IRMOS) WFQ Weighted Fair Queuing WP Work Package WSRF Web Services Resource Framework XML Extensible Markup Language

IRMOS IRMOS_WP7_D7_4_1_PU_ALUD_v1_0
Interactive Realtime Multimedia Applications on Service Oriented Infrastructures Created on 30/11/2009
D7.4.1 Initial version of Path supervision Architecture
© ALUD and other partners of the IRMOS consortium 2008‐2009 page 6/57
6.3.2. Intra‐node measurement architecture...................................................................... 47. Outage detection (network) .................................................................................................... 48
7. Conclusion................................................................................................................................................. 50
Table of Contents 1. Executive Summary..................................................................................................................................9
2. Introduction ............................................................................................................................................. 11
3. 2.1. Objectives......................................................................................................................................... 11
Use cases and requirements.............................................................................................................. 13
3.1
. VSN monitoring............................................................................................................................. 13
4. 3.2. Technical SLA request – SLA violation................................................................................ 14
4.1 Transport network supervision....................................................................................................... 16
. IP Networks and QoS .................................................................................................................. 16
4.1.1. Best Effort Networks......................................................................................................... 17
4.1.2. QoS protocols ....................................................................................................................... 18
4.2. MPLS .................................................................................................................................................. 19
4.2.1. MPLS Network Reliance and Recovery ..................................................................... 19
4.3. SDH/SONET .................................................................................................................................... 204.44.5
. Typical values for networks .................................................................................................... 21
. Detection of service outages in the transport network ............................................... 22
4.5.1. Failure management with access to the network................................................. 22
5. 4.5.2. Failure management without access to the network.......................................... 23
5.1 Performance measurements ............................................................................................................. 24
. Measurement methodology..................................................................................................... 24
5.1.1. Inter‐node measurements .............................................................................................. 26
5.1.2. Intra‐node measurements .............................................................................................. 27
5.2. MTU size ........................................................................................................................................... 28
5.3. Packet Loss...................................................................................................................................... 325.45.5
. Bandwidth ....................................................................................................................................... 33
. Delay .................................................................................................................................................. 34
5.5.1. OWD versus RTT................................................................................................................. 34
5.5.2. One Way Delay..................................................................................................................... 34
5.5.3. Result ....................................................................................................................................... 36
5.6
. Delay Variation (Jitter)............................................................................................................... 37
6. 5.7. Synchronizing clocks .................................................................................................................. 38
6.1 ISONI path supervision framework ............................................................................................... 40
. Affected ISONI Components .................................................................................................... 41
6.1.1. Clock synchronization architecture............................................................................ 41
6.1.2. IXB ............................................................................................................................................. 42
6.1.3. Path Manager Node............................................................................................................ 43
6.1.4. Deployment Manager........................................................................................................ 43
6.2 6.1.5. ISONI SLA‐Manager ........................................................................................................... 43
. Measurement configuration .................................................................................................... 45
6.2.1. Inter‐node measurement ................................................................................................ 45
6.3 6.2.2. Intra‐node measurement ................................................................................................ 46
. Measurement reference architecture.................................................................................. 46
6.3.1. Inter‐node measurement architecture...................................................................... 46
6.4

IRMOS IRMOS_WP7_D7_4_1_PU_ALUD_v1_0
Interactive Realtime Multimedia Applications on Service Oriented Infrastructures Created on 30/11/2009
D7.4.1 Initial version of Path supervision Architecture
8. An A.
© ALUD and other partners of the IRMOS consortium 2008‐2009 page 7/57
References................................................................................................................................................. 51
nex Monitoring example ............................................................................................................... 53A.1. Monitoring XML Schema ........................................................................................................... 53A.2. Dust busting example ................................................................................................................. 55

IRMOS IRMOS_WP7_D7_4_1_PU_ALUD_v1_0
Interactive Realtime Multimedia Applications on Service Oriented Infrastructures Created on 30/11/2009
D7.4.1 Initial version of Path supervision Architecture
© ALUD and other partners of the IRMOS consortium 2008‐2009 page 8/57
List of Figures Figure 1 VSN specific monitoring ............................................................................................................. 14
Figure 2 SLA violation notification........................................................................................................... 15
Figure 3 Notification of failure in a LSP to ISONI ............................................................................... 23
Figure 4 Inter‐Node IXB measurements ................................................................................................ 26
ts .........................................
Figure 5 Intra‐Node IXB measuremen ....................................................... 27
Figure 6 Intra‐Node “star like” outage measurements.................................................................... 28
Figure 7 Formula of delay segments k with average delays µ....................................................... 37
Figure 8 Formula of jitter (variation σ).................................................................................................. 38
Figure 9 NTP stratum architecture for ISONI...................................................................................... 39
...............................................................
Figure 10 Measurement reporting ............................................ 40
Figure 11 ISONI monitoring message flow........................................................................................... 41
Figure 12 ISONI clock architecture .......................................................................................................... 42
Figure 13 Inter‐node measurements (example) ................................................................................ 45
Figure 14 Inter‐node measurement (abstract view)........................................................................ 46
Figure 15 G.800 series unified model ..................................................................................................... 47
Figure 16 Intra‐node Measurements (abstract view)...................................................................... 48Figure 17 Outage measurement detailed (abstract view) ............................................................. 49Figure 18 Monitoring XML Shema............................................................................................................ 53
List of Tables Table 1 Bandwidth management algorithms ...................................................................................... 17
Table 2 SDH data rates .................................................................................................................................. 20
Table 3 Examples of typical delay contribution by router role ................................................... 21
Table 4 Y.1541 examples.............................................................................................................................. 22
Table 5 ISONI encapsulated IPv4 packet – not encrypted ............................................................. 30
Table 6 ISONI encapsulated IPv4 packet –encrypted ...................................................................... 31able 7 Delay examples................................................................................................................................. 35able 8 Availability examples..................................................................................................................... 44 TT

IRMOS IRMOS_WP7_D7_4_1_PU_ALUD_v1_0
Interactive Realtime Multimedia Applications on Service Oriented Infrastructures Created on 30/11/2009
D7.4.1 Initial version of Path supervision Architecture
e 9/57 © ALUD and other partners of the IRMOS consortium 2008‐2009 pag
violation. As presented in
1. Executive Summary This document describes the initial version of the Path Supervision architecture. The Path Supervision is part of the overall IRMOS Intelligent Service Oriented Network Infrastructure (ISONI) Path Manager functional entity as being described in more detail in D7.2.1 [31], D7.3.1 [32] and ISONI Whitepaper [33]. The deliverable at hand, which is the initial version of the Path Supervision architecture, serves as input to the first IRMOS proof of concept demonstrator at the end of project year 2. The outcome of this deliverable will be consumed first inside the WP on Intelligent Networking and delivered as part of the integrated ISONI proof of concept with limited functionality at project month 22 (11/2009) for integration into the IRMOS proof of concept demonstrator. A follow up deliverable of the Path Supervision architecture is scheduled for project month 28 (05/2010) which will enhance the architecture in terms of unctionality and level of detail and make use of results and feedback achieved from the ffirst prototype tests. This task and therefore this deliverable D7.4.1 describes the development of path supervision architecture that allows the supervision of individual links and analyzes heir performance in order to optimize the network resource usage and to trigger tcounter measures in case of misbehavior or failure. Due to the importance and dependency on work carried within WP5 (Framework Services) on topics like monitoring, we decided to focus in this initial path supervision architecture on topics that are relevant to the overall architecture and the interfaces between work packages. For this reason, this document covers mainly two major aspects of the Path Supervision architecture, namely the network monitoring of eployed executed Virtual Service Networks (VSN) and the network infrastructure dhealth supervision, detecting outages and degradation of available transport resources. The first aspect deals with measurement of the individual Virtual Links (VLs) during application service execution phase, whose continuously monitored values are provided to the IRMOS framework services. A challenge herein is to allow individual easurement of the VLs with minimum intrusive influence to them while keeping the m
scalability of the platform high. The second aspect deals with detection of network outages and degradation. A VSN deployment is accompanied by a service level agreement between Framework Services and ISONI domain namely T‐SLA as introduced in D7.2.1 [31]. Network outages or degradation may cause T‐SLA violations. A T‐SLA is violated, if the given guarantees especially in respect to network QoS cannot be sustained. Research has been undertaken o assist the automated SLA negotiation in sense of dealing with errors namely SLA t
[33] and [24], the ISONI consists of a modular management middleware layer controlling a 2‐level hierarchical ISONI Domain resource structure. The network related middleware management is described in [30],[31],[32] amongst others.

IRMOS IRMOS_WP7_D7_4_1_PU_ALUD_v1_0
Interactive Realtime Multimedia Applications on Service Oriented Infrastructures Created on 30/11/2009
D7.4.1 Initial version of Path supervision Architecture
Special attention was required to create measurement and monitoring functions that fit to the existing management middleware by sustaining the node level autonomy. Another requirement was to make measurement as less intrusively as possible by avoiding mpact on deployed VLs and minimizing the measurement network resource overhead. he latter is important for having a scalable solution.
© ALUD and other partners of the IRMOS consortium 2008‐2009 page 10/57
iT

IRMOS IRMOS_WP7_D7_4_1_PU_ALUD_v1_0
Interactive Realtime Multimedia Applications on Service Oriented Infrastructures Created on 30/11/2009
D7.4.1 Initial version of Path supervision Architecture
© ALUD and other partners of the IRMOS consortium 2008‐2009 page 11/57
during application service execution phase. The framework needs to cover measurements of performance parameters of VL, such as delay, jitter, bandwidth etc, for internal ISONI usage, e.g. supervision of the framework and failure detection, load balancing etc., but also this data is required to deliver parts of
2. Introduction This document follows the set of specifications already provided in the work package on Intelligent Networking on the key functional building block (FBB) of ISONI regarding Networking, called Path Manager. The first three deliverables defining the architecture and functionality of the Path Manager have been provided as D7.1.1 [30], D7.2.1 [31], nd D7.3.1 a [32]. This deliverable is complementing the Path Manager architecture specifying network measurements and supervision. The document starts with an overview of use cases and requirements in chapter 3 regarding the needs of the ISONI customer in IRMOS, the Framework Services (FS), in terms of monitoring data to be provided for SLA supervision of different networking technology from Internet Protocol (IP) and Multiprotocol Label Switching (MPLS) to ptical networking (SDH), as example of technologies that provide growing levels of oguarantee and predictability. Chapter 4 continues with an overview of existing transport networks and supervision available today in those networks. As ISONI is built upon existing transport networks, e also make use of lower layer network supervision in e.g. SDH or MPLS networks as w
any research on this deep network level is out of scope for IRMOS. Regarding performance supervision and monitoring chapter 5 gives an insight on the arameters to be measured and supervised and respective types of measurement to be pperformed. Chapter 6 presents the ISONI path supervision framework developed in the deliverable at hand. It is shown where in the ISONI architecture those measurements are performed, hich functional building blocks are affected and the impact on ISONI architecture in his respect. wt
2.1. Objectives he scope of the work carried out is to enhance two main aspects of the Path Manager rchiteTa
cture
• and individual Network monitoring , i.e. health supervision of networks linkssupervision of virtual links on performance
• SLA violation reporting as a result of network health supervision The first aspect deals with a major research topic in this deliverable, which is seamless easurement and monitoring of the performance of the individual Virtual Links (VLs) m

IRMOS IRMOS_WP7_D7_4_1_PU_ALUD_v1_0
Interactive Realtime Multimedia Applications on Service Oriented Infrastructures Created on 30/11/2009
D7.4.1 Initial version of Path supervision Architecture
the data towards the customer, which is the FS. The FS itself can use this data inside its own monitoring framework to detect A‐SLA (the SLA contract with the IRMOS platform customer – the application provider) violations or resource shortage (which might equire a T‐SLA re‐negotiation), or even for the purpose of offline processes such as
© ALUD and other partners of the IRMOS consortium 2008‐2009 page 12/57
rbenchmarking. The framework must be designed and developed in a way that the measurement itself does not cause degradation, i.e., having a scalable, minimal intrusive and resource optimized solution. Monitoring in ISONI refers to continuous reporting about infrastructure resource usage of an executed application service, which covers usage reports of computing, storage and networking resources. Regarding monitoring this document is focused on the etwork level. The counterpart of monitoring in respect to computing and storage nresources is described in D6.1.2/3. Circumstances which may lead to ISONI T‐SLA violations are prolonged infrastructure resource outages or degradations of impacted parts (ASC or VL) of a running application (i.e. deployed and running VSN). Regarding ISONI T‐SLA violation this document is ocused on network T‐SLA violation reporting in relation to network. The counterpart of ‐SLA violation in respect to computing and storage resources is described in D6.1.2/3. fT

IRMOS IRMOS_WP7_D7_4_1_PU_ALUD_v1_0
Interactive Realtime Multimedia Applications on Service Oriented Infrastructures Created on 30/11/2009
D7.4.1 Initial version of Path supervision Architecture
ALUD and other partners of the IRMOS consortium 2008‐2009 page 13/57 ©
3. Use cases and requirements In general, from an outside view, ISONI is requested to satisfy the demands of IRMOS customers expressed to the FS. These customers’ requests have been adapted to the ISONI by the FS (which has translated the application requirements to the low‐level nfrastructure requirements). To make the monitoring of the A‐SLA by the FS and IRMOS icustomers possible, ISONI provides feedback mechanisms. First, it is required that the FS or customer gets feedback about whether the requested esources are sufficient or not. The application is given to Infrastructure Provider rnamely ISONI as a VSN, for which ISONI provides individual VSN monitoring. Second, it is required that – via FS – the customer gets notification of when the guarantees specified via the T‐SLA could not be kept during the application execution phase, leading to a T‐SLA violation.
3.1. VSN monitoring Once an application is deployed and executed, the Monitoring service of the IRMOS FS gathers information both about low‐level performance monitored data coming from the Infrastructure Provider through its own monitoring service, and information about high‐level performance monitored data coming from the Application Service Components (ASC) that are being executed (overall view described in D4.2.1 [26]). As depicted in Figure 1, the high‐level performance monitored data is gathered for each deployed VSN by a Monitoring service instance (M), which is deployed as part of a FSC inside each VSN. The Workflow Enactor instance (WE) is responsible to configure, start and stop the service. The incurred high‐level performance monitored data is reported by the
t for ISONI. The low‐level onitoring Service.
application as shown in Figure 1, which is transparenperformThe mo
ance monitored data is delivered by the ISONI to the FS M
• nitored low‐level data in respect to networking are: Average of used bandwidth measured over a time interval
• Delay and Jitter average per interval of the Virtual Links (VL) in case of real‐time The monitoring data is sent continuously to the FS Monitoring Service. Due to the fact hat the FS Monitoring Service has to store the monitored data anyway, ISONI does not tneed to store any individually prepared VSN monitoring reports on its own. The fol ng Service have been ag
lowing interface requirements in conjunctions with FS Monitori
• reed:
• The smallest monitoring time interval has been specified to 1 sec Report intervals of a VSN can be specified as multiple of 1 sec
• ll values are ISONI will send monitoring reports continuously and as soon as apresent
ISONI does not to store VSN individual reported data for later usage •

IRMOS IRMOS_WP7_D7_4_1_PU_ALUD_v1_0
Interactive Realtime Multimedia Applications on Service Oriented Infrastructures Created on 30/11/2009
D7.4.1 Initial version of Path supervision Architecture
© ALUD and other partners of the IRMOS consortium 2008‐2009 page 14/57
FSCFSMonitoring Service
ISONI domain
Node Node Node
VMUVMU
VSN
VMUVMU
IXB Node IXB Node IXB Node
IXB PH IXBPH IXBPH IXBPH IXBPH IXBPH IXBPH
Transport network
SC
SC
SC
FSC
ASCwrapper
VMUVMU VMUVMUVMUVMU
ISONI Gateway
WEM
VSNFSC
FSCFSCWEM
ApplicationMonitoring(high-level)
ResourceMonitoring(low-level)
D7.4.1
measuredvalues
ISONIMonitoring
Architecture
SC: Service ComponentFSC: Framework SCASC: Application SCM: MonitoringWE: Workflow Enactor
VMU: Virtual Machine UnitIXB: ISONI eXchange BoxPH: Physical Host
Figure 1 VSN specific monitoring
3.2. Technical SLA request – SLA violation Messages exchanged during the SLA negotiation phase regarding a T‐SLA contain the Virtual Service Network (VSN) that is part of the agreement [31]. This is necessary so that, in the first phase, ISONI can check resource availability and, in the second phase, ISONI can finalize the provisioning of resources and acknowledge the booking of the VSN. The specification of monitoring data is implicitly given in the VSN description: SONI will monitor all components of a given VSN that have QoS requirements and it will Inot monitor any other components. The whole VSN description is passed to the Deployment Manager, which provisions the computational resources, storage and links and configures monitoring on components with Quality of Service requirements. Monitoring data is passed outward from the ISONI from the Deployment Manager to the FS Monitoring Service and is not relevant for the ISONI SLA Manager, as the perpetual flow of monitoring data is neither analyzed by nor known to the ISONI SLA Manager. Furthermore, even though monitoring data may show slight aberrations in regard to the QoS guarantees given to the customer covered by an A‐SLA, these deviations have to be analyzed by the Framework Services (FS) and can then be reported to ISONI, so that, for example, compensating actions can be undertaken.

IRMOS IRMOS_WP7_D7_4_1_PU_ALUD_v1_0
Interactive Realtime Multimedia Applications on Service Oriented Infrastructures Created on 30/11/2009
D7.4.1 Initial version of Path supervision Architecture
© ALUD and other partners of the IRMOS consortium 2008‐2009 page 15/57
VSN ID
VSN ID
VSN ID
FSISONI
SLA Manager
Subscription
T‐SLAViolationoccurs
Violation information
Notification
DM instance
Figure 2 SLA violation notification T‐SLA violations, in contrast to the abovementioned slips against QoS guarantees, are considered by ISONI to be bad‐case events. This means that they are expected to take longer than the maximum allowed outage time of the T‐SLA contract, they are severe utages, and will also be an indication that ISONI‐internal fault management is ohappening. The process of violation reporting is shown in Figure 2. The Framework Services (FS) can subscribe to be notified when T‐SLA violations occur at the SLA Manager. Once an outage or degradation is detected by the Deployment Manager instance responsible for a given VSN, it is reported to the SLA Manager. The SLA Manager analyzes the outage information and may trigger a T‐SLA violation, which is then sent to FS as it has previously subscribed for violations. An outage might not entail a violation; consider, for example, the case of a link outage where the link availability is, for example, 95%. If the combined outage time is or will not be longer than 5%, there is no need to report an T‐LA violation. Obviously, T‐SLA violations can and will only be reported once the T‐SLA as been signed and the VSN is running.
his document covers the detection o
T‐SLA e a
Sh Tr
f network degradation and network outages eported towards the ISONI SLA manager. The detection of EE degradation and outages s covered by D6.1.2 and 3.
has b en signed nd the VSN is running. This document covers the detection of network degradation and network outages eported towards the ISONI SLA manager. The detection of EE degradation and outages s covered by D6.1.2 and 3. i
i
r

IRMOS IRMOS_WP7_D7_4_1_PU_ALUD_v1_0
Interactive Realtime Multimedia Applications on Service Oriented Infrastructures Created on 30/11/2009
D7.4.1 Initial version of Path supervision Architecture
© ALUD and other partners of the IRMOS consortium 2008‐2009 page 16/57
4. Transport network supervision This section provides an overview of the current available technologies for transport networks and the mechanisms to detect service degradation and outage in the network. The technologies covered include: IP networks, MPLS and SDH/SONET. These transport etwork technologies are not technologically alternative; in fact it would be feasible to ave IP using MPLS over SDH, for example. nh
4.1. Networks and QoS IP is a connectionless technology and does not guarantee bandwidth. It does not inherently support the preferential treatment of data traffic, so other mechanisms are equired to make network components aware of applications and their various
IP
rperformance requirements. Standard IP‐based networks, a.k.a., Internet, provide "best effort" data delivery by default. As more hosts are connected, network service demands eventually exceed capacity, but service is not denied. Instead it degrades gracefully. Although the resulting variability in delivery delays (jitter) and packet loss does not adversely affect typical Internet applications, like e‐mail, file transfer and www, other applications cannot adapt to nconsistent service levels. Delivery delays cause problems for applications with real‐itime requirements, such as those that deliver multimedia. Sufficient bandwidth is a necessary first step for accommodating these real‐time applications, but it is still not enough to avoid jitter during traffic bursts. Even on a relatively unloaded IP network, delivery delays can vary enough to continue to adversely affect real‐time applications. To provide some level of quantitative or qualitative determinism, IP services must be supplemented. This requires adding some "smarts" to the net to distinguish traffic with strict timing requirements from the one that can tolerate delay, jitter and loss. That is what Quality of Service (QoS) protocols are esigned to do. The goal of a QoS aware protocol is to provide some level of
e. dpredictability and control beyond the current IP "best‐effort" servic The challenge of IP QoS technologies is to provide differentiated delivery services for individual or aggregates flows without breaking the network “end‐to‐end” principle in the process, which dictates that the complexity remains in the end‐hosts, so that the etwork can remain relatively simple and scalable. One ambition of the IRMOS project is nto create a scalable application unaware resource infrastructure approach. The next table shows different bandwidth management algorithms and protocols, their elative QoS levels, and whether they are activated by network elements (Net), by pplications (App), or both ra
[1]:

IRMOS IRMOS_WP7_D7_4_1_PU_ALUD_v1_0
Interactive Realtime Multimedia Applications on Service Oriented Infrastructures Created on 30/11/2009
D7.4.1 Initial version of Path supervision Architecture
© ALUD and other partners of the IRMOS consortium 2008‐2009 age 17/57
Table 1 Bandwidth management algorithms
QoS Net App Description Price Most x Leased Lines: Provisioned resources end‐to‐end (e.g. private,
low‐traffic network) High
x x RSVP (Resource reSerVation Protocol) (IntServ Guaranteed) Service (provides feedback to application)
x x RSVP (IntServ Controlled) Load Servic
e (provides feedback to application)
x Multi‐Protocol Label Switching (MPLS) x x Differentiated (DiffServ) applied at network core ingress
appropriate to RSVP reservation service level for that flow. Prioritization using Subnet Bandwidth Manager (SBM) applied on the LAN would also fit this category.
x x Diffserv or SBM applied on per‐flow basis by source application
x Diffserv applied at network core ingress
x Fair queuing appliRED)
ed by network elements (e.g. CFQ, WFQ,
Least Best Effort Service Low We see that at the bottom of the QoS assurance is Best Effort Service and at the top end re dedicated private lines. MPLS mechanisms are located in the middle. As one can magine, prices go in the opposite direction: the better, the more expensive. ai
4.1.1. Best Effort Networks A Best Effort Internet or general‐purpose TCP/IP Networks is the most basic option. This type of network does not provide any guarantees that data is delivered or that a ser is given a guaranteed quality of service level or a certain priority. Thus users obtain uunspecified variable bit rate and delivery time, depending on the current traffic load. It is by far the cheaper option, and although QoS is not guaranteed, it may work quite well for most applications including those with basic real time requirements that are tolerant to sporadic or intermittent degradations in the quality levels of parameters like jitter, latency and packet loss, provided that the network is loaded at a relatively low level. Most of the current offer of services over Internet provides best effort QoS, ncluding soft real time services like VoIP (e.g. Skype), video services like youtube and i
p
almost all the SaaS and cloud computing services [39]. One first level for QoS is the guaranteed delivery of packets. This can be assured by connection‐oriented protocols like TCP or by application layer protocols in case that UDP transport is used. But this is insufficient for applications with timeliness requirements where it is not enough to guarantee the arrival of packets but also the arrival on time is required.

IRMOS IRMOS_WP7_D7_4_1_PU_ALUD_v1_0
Interactive Realtime Multimedia Applications on Service Oriented Infrastructures Created on 30/11/2009
D7.4.1 Initial version of Path supervision Architecture
owever, not all the Internet is strictly best‐effort as modern IP routers support some echanisms to provide some levels of QoS under certain circumstances to certain data lows, based on, for example, the IntServ or DiffServ protocols. For end‐to‐end transport
© ALUD and other partners of the IRMOS
• Subnet Bandwidth Management (SBM): Enables categorization and prioritization at Layer 2 (the data‐link layer in the OSI model) on shared and switched IEEE 802 networks.
IRMOS can use several types of transports, depending on the QoS requirements imposed by applications and customers as described in D7.3.1
consortium 2008‐2009 page 18/57
•
•
•
•
•
Hmflayer reservation of resources, the resource reservation protocol (RSVP) may be used.
4.1.2. QoS protocols There is more than one way to characterize Quality of Service (QoS). Generally speaking, QoS is o some lmo sothers)
the ability of a network element (e.g. an application, a host or a router) t provide evel of assurance for consistent network data delivery. Some applications are
re tringent about their QoS requirements than others, and for this reason (among we have two basic types of QoS available: Resource reservation (Integrated Services): network resources are allocated according to an application's QoS request (inside a T‐SLA), and subject to bandwidth management policy. Prioritization (Differentiated Services): network traffic is classified and network resources are allocated according to bandwidth management policy criteria. To achieve QoS, network elements give preferential treatment to packets identified
The taggreg
as having more priority.
se ypes of QoS guarantees can be applied to individual application "flows" or to flow ates, hence there are two other ways to characterize types of QoS: Per Flow: A "flow" is defined as an individual, uni‐directional, data stream between two applications (sender and receiver), uniquely identified by a 5‐tuple (transport protocol, source address, source port number, destination address, and destination port number).
• Per Aggregate: An aggregate is simply two or more flows. Typically the flows will have something in common (e.g. any one or more of the 5‐tuple parameters, a label or a priority number, or perhaps some authentication information).
Applicafor dof QoS,
tions, network topology and policy dictate which type of QoS is most appropriate in ividual flows or aggregates. To ensure the requirements for these different types
there are a number of different QoS protocols and algorithms: ReSerVation Protocol (RSVP): Provides the signalling to enable network resource reservation (otherwise known as Integrated Services). Although typically used on a per‐flow basis, RSVP is also used to reserve resources for aggregates.
• Differentiated Services (DiffServ): Provides a coarse and simple way to categorize and prioritize network traffic flow aggregates. Multi Protocol Label Switching (MPLS): Provides bandwidth management for aggregates via network routing control according to labels encapsulated in packet headers.
[32]. The ISONI QoS overlay

IRMOS IRMOS_WP7_D7_4_1_PU_ALUD_v1_0
Interactive Realtime Multimedia Applications on Service Oriented Infrastructures Created on 30/11/2009
D7.4.1 Initial version of Path supervision Architecture
•
•
© ALUD and other partners of the IRMOS consortium 2008‐2009 page 19/57
also ensure that the selected path is pre‐qualified to sustain the traffic loads while maintaining QoS conditions. If traffic loads become a problem, MPLS must be able to offload lower‐priority traffic to other links.
adaptation (IQOA) layer adapts the different QoS protocols and algorithms and cares about reservation protocols, if required.
4.2. MPLS Multi Protocol Label Switching (MPLS), developed by the IETF [3], is a data‐carrying mechanism that belongs to the family of packet‐switched networks. MPLS operates at an OSI Model layer that is generally considered to lay between traditional definitions of Layer 2 (Data Link Layer) and Layer 3 (Network Layer), and thus is often referred to as a Layer 2.5" protocol. It was designed to provide a unified data‐carrying service for both ircuit‐based clients and packet‐switching clients which provide a datagram service odel. It can be used to carry many different kinds of traffic, including IP packets, as
"cmwell as native ATM, SONET, and Ethernet frames.
4.2.1. MPLS Network Reliance and Recovery PLS has been primarily implemented in the core of the IP network. An MPLS recovery
lity as it did before the Mmust ensure that traffic can continue to flow with the same quafailure.of e a There
The standard for MPLS networks is to detect a problem and switch over to a path qu l quality within 60ms [4].
are two primary methods used to detect network failures: Heartbeat detection (or polling): This method, used in fast switching, detects and recovers from errors more rapidly, but uses more network resources. Each
g rdevice advertises that it is alive to a network mana er at a p escribed interval of time. If the heartbeat is missed, the path, link, or node is declared as failed, and a switchover is performed. In order to achieve a 50ms switchover, the heartbeats would need to occur about every 10ms. Error messaging: This method requires far less network resources, but is a slower method. When a device on the network detects an error, it sends a message to its neighbours to redirect traffic to a path or router that is working. Most routing protocols use adaptations of this method. The advantage of the
error message is that network overhead is low. The disadvantage is that it takes time to send the error‐and‐redirect message to the network components, and in certain cases the messages may never arrive.
MPLS could rely on the layer‐1 or layer‐2 protocols to perform error detection and orrection. MPLS could run on a protected SONET ring, or it could use ATM and Frame cRelay fault‐management programs for link and path protection. In addition to the protection MPLS networks could experience via SONET, ATM or Frame Relay, IP has its recovery mechanism in routing protocols, such as OSPF or IGP. he MPLS failure‐recovery protocol must not only perform rapid switching, but it must T

IRMOS IRMOS_WP7_D7_4_1_PU_ALUD_v1_0
Interactive Realtime Multimedia Applications on Service Oriented Infrastructures Created on 30/11/2009
D7.4.1 Initial version of Path supervision Architecture
he failure recovery method that has received much favourable press lately is RSVP‐TE. he soft‐state operations of RSVP‐TE make it very suitable for failure recovery. One eason is that the polling (reservation/path) functions are already in place for signalling.
‐
© ALUD and other partners of the IRMOS consortium 2008‐2009 page 20/57
TTrIf RSVP TE is already used for a signalling protocol, it makes a logical selection to protect
at 155.52 b a ra
ble 2 SDH data rates
MPLS tunnels [8].
4.3. SDH/SONET ynchronous optical networking (SONET) and Synchronous Digital Hierarchy (SDH), are
l Stwo closely related multiplexing protocols for transferring multiple digita bit streams using lasers or light‐emitting diodes (LEDs) over the same optical fiber. Both SDH and SONET are widely used today: SONET in the U.S. and Canada and SDH in the rest of the world.
DH is a transport protocol originally defined by ETSI. The structure of the protocol llows different frame rates for the encapsulated data, and the basic unit of framing in DH is a STM‐1 (Synchronous Tr l ‐ 1), which operates
SaS ansport Module leveMbit/s. The following ta le shows the different dat tes supported by SDH.
Ta
SDH level and Frame Format
Payload bandwidth (kbit/s)
Line Rate (kbit/s)
STM‐1 150,336 155,520 STM‐4 601,344 622,080 STM‐16 2,405,376 2,488,320 STM‐64 9,621,504 9,953,280 STM‐256 38,486,016 39,813,120 STM‐1024 153,944,064 159,252,240 SDH/SONET equipments are usually managed using SNMP, CORBA or XML. Due to andwidth all the time SDH/SONET is treated by ISONI a ct connected with SDH/SONET can benefit from its e
its guarantee of having a fixed bne. ISONI nodes dire
ovs a leased li
ctirhead information, which provides for a v
•
ariety of management and other fun o
arm and in‐service supervision of
ns such as: Alarm Indication Signals
• Pointer Adjustment Information • Path Status • Remote Defect, Error, and Failure Indications • Automatic Protection Switching Control • Synchronisation Status Message
fMuch o this overhead information is involved with althe particular SDH sections.

IRMOS IRMOS_WP7_D7_4_1_PU_ALUD_v1_0
Interactive Realtime Multimedia Applications on Service Oriented Infrastructures Created on 30/11/2009
D7.4.1 Initial version of Path supervision Architecture
.4. Typical values for networks
© ALUD and other partners of the IRMOS consortium 2008‐2009 page 21/57
the much more ent inter‐regional calls of km or less, the delays
would be approximately 150 m
xampl pical delay contribution by rout
4There are base values that are dependant on the type of transport, e.g. transmission delay on fiber, independently of the QoS provisioned. Packets with higher priorities can expect final values close to the theoretical limits, whereas packets with lower priorities will have a worse performance in case of congestion or they can even be discarded. IP packet transfer performance parameters, such as IP Packet Transfer Delay (IPTD), IP acket Delay Variation (IPDV), IP Packet Error Ratio (IPER) and IP Packet Loss Ratio P(IPLR) are defined in ITU‐T Rec. Y.1540. On the other hand, ITU‐T Rec. Y.1541[12] specifies six network Quality of Service (QoS) classes based on various IP applications, such as Voice over Internet Protocol (VoIP), multimedia conferencing and interactive data transfer. End‐to‐end IP performance objectives for the above IP packet transfer parameters are defined for every QoS class in this Recommendation. or many intra‐regional (e.g., within Africa, Europe, North America) routes in the range Fof 5000 km or less, users of VoIP connections are likely to experience mouth‐to‐ear delays <150 ms. This is assuming VoIP reference terminals with a total of 50 ms mean delay (10 ms packets), so for the network part, the calculation shows that the 100 ms objective of Y.1541 Class 0 can be met with a well‐engineered access network (with a T1 or E1 rate or larger as Y.1541 requires) and with as many as 12 network routers. For inter‐regional routes covered terrestrially, even those traversing the 27500 km of the ITU's traditional worst‐case Hypothetical Reference Connection, a VoIP mouth‐to‐ar path is likely to see a delay of just over 300 ms (assuming a contribution from VoIP erminals of 80 ms delay), so a well‐engineered network with 20 or fewer network outers should add about 225 ms (as per Appendix III/Y.1541). Of course, it is extremely nlikely that the
etru worst case of 27500 km will be encountered. For frequ , for example, 10000 corresponding
s.
Table 3 E es of ty er role
Role Average total delay (sum of queuing and processing)
Delay variation
Access Gateway 10 ms 16 ms Internetworking Gateway 3 ms 3 ms Distribution 3 ms 3 ms Core 2 ms 3 ms These values are for packets with high
is kind o
est priorities, of equipment. Trse)
that is, uced by th able III. 4
r role (
these 3/Y.15
values are the 41 lists Class minimum delays introd
delay contribution by route much w

IRMOS IRMOS_WP7_D7_4_1_PU_ALUD_v1_0
Interactive Realtime Multimedia Applications on Service Oriented Infrastructures Created on 30/11/2009
D7.4.1 Initial version of Path supervision Architecture
© ALUD and other partners of the IRMOS consortium 2008‐2009 page 22/57
Table 4 Y.1541 examples
Distance Average Delay (OWD) Max Delay Variation Cmlass 0 ax distance 4070 km.
100 ms 62 ms
Class 1 (longer distances) 12000 km
150 ms 83 ms max distanceClass 4 max distance 27500 km
884 ms ‐‐‐
4.5. Detection of service outages in the transport network
As mentioned previously IP, MPLS and SDH are technologies that work at different levels of the communication stack (considering the OSI Model, IP is layer 3, SDH is layer 1 and MPLS is located in the so called “layer 2.5”). Therefore, it is possible to have IP using MPLS over a SDH transport network, and for this reason the alarms and notifications received from the network could occur at different levels. For ISONI to detect a problem in the transport network we are going to consider two management scenarios: In the first one the Network Elements (NEs) of the transport network are reachable and it is possible to receive alarms and notifications directly from the NEs or through the Operations Systems; in the second scenario the elements of ISONI do not have access to management information of the NEs, because the Network Provider does not provide these interfaces to ISONI or because these interfaces are not supported by ISONI.
4.5.1. Failure management with access to the network The notification of failures could be done by receiving asynchronous push notifications from network equipments or periodically asking the equipment making use of a request‐response protocol. The technologies and protocols, equipment from different vendors may provide have different interfaces to for failure management. Among the possibilities that exist are: Command‐line Interface (CLI), CORBA, XML (with SOAP or XML‐RPC). But SNMP is the best supported management interface today and for this reason we will ase our description on this protocol.
epending on the transport network it could be possible to receive multiple otifications from
b Dnc
different elements in the network and from different layers in the ommunication stack caused by a single failure. It is the role of the Management Systems to manage and analyse this information to identify the primary cause of the error and decide if that error is going to influence the reliability and performance of the ISONI communications.

IRMOS IRMOS_WP7_D7_4_1_PU_ALUD_v1_0
Interactive Realtime Multimedia Applications on Service Oriented Infrastructures Created on 30/11/2009
D7.4.1 Initial version of Path supervision Architecture
© ALUD and other partners of the IRMOS consortium 2008‐2009 page 23/57
ISONI Node
ISONI Node
ISONI Node
ISONI Node
P1 P3 P5
MPLS core network
P2 P4
PE3
PE4
PE2
PE1
CE CE
CECE
Fault!
Management system
Path Manager 12
23
Issues SNMP notifications
Figure 3 Notification of failure in a LSP to ISONI
Considering a MPLS network as depicted in
Figure 3, if an error occurs in one Label Switched Path (LSP) (1), the error will be notified to the Management System of the network operator (2) (using, for instance, SNMP TRAP linkDown), the error notification ould be forwarded to the Path Manager (3) that will react to this error by performing cthe corresponding actions, like propagating it to the SLA Manager. The Management System has to take into account that some network failures will be recovered automatically by the transport network by changing dynamically the routing olicies in the network in a transparent way and it would not be necessary to perform ny action at ISONI level. pa
4.5.2. Failure management without access to the network In case there is no possibility of accessing the internal management operation system of the network some actions that are situated at the edge of the leased network could be performed to ensure that the links are working correctly, and detect possible outages. One option is to send test signals that are collaborating on active links. The most commonly used test signals are pseudo‐random bit patterns of different length
l end depending on the bit rate of the ink [18]. A tester at the receiving reads the incoming pattern. Packet errors may be reported to control the performance of the links. Another option is to use passive probes at the edges of the network to control the incoming traffic. In case of lack of traffic this event could be reported, but there is not certainty that in fact there is a problem in the link. Depending on the traffic in the link it could be impossible to measure some parameters using passive tests. For example if traffic does not include sequence numbers or timestamps it could be impossible to detect packet losses or jitter. In addition, to measure parameters like the end‐to‐end delay it would be necessary to receive specific traffic (for example RTCP packets).

IRMOS IRMOS_WP7_D7_4_1_PU_ALUD_v1_0
Interactive Realtime Multimedia Applications on Service Oriented Infrastructures Created on 30/11/2009
D7.4.1 Initial version of Path supervision Architecture
© ALUD and other partners of the IRMOS consortium 2008‐2009 page 24/57
5. Performance measurements 5.1. Measurement methodology In ance metrics have been specified (In
several IETF meetings criteria IP perform
• relation to RFC2330 ‐ Framework for IP Performance Metrics): The metrics must be concrete and well‐defined
• A methodology for a metric should have the property that it is repeatable: if the s umethodology is u ed multiple times nder identical conditions, the same
measurements should result in the same measurement results • The metrics must exhibit no bias for IP clouds implemented with identical
technology • The metrics must exhibit well‐understood and fair bias for IP clouds implemented
with non‐identical technology The metrics must be useful to users and providers in understanding the performance •they experience or provide
or a given set of well‐defined metrics, a number of distinct measurement ethodolo
Fm
gies may exist. A partial list includes:
• Direct measurement of a performance metric using injected test traffic. Example: measureme o tnt f he round‐trip delay of an IP packet of a given size over a given route at a given time.
• Projection of a metric from lower‐level measurements. Example: given accurate measurements of propagation delay and bandwidth for each step along a path, projection of the complete delay for the path for an IP packet of a given size.
• Estimation of a constituent metric from a set of more aggregated measurements. Example: given accurate measurements of delay for a given one‐hop path for IP packets of different sizes, estimation of propagation delay for the link of that one‐hop path.
• Estimation of a given metric at one time from a set of related metrics at other times. Example: given an accurate measurement of flow capacity at a past time, together with a set of accurate delay measurements for that past time and the current time, and given a model of flow dynamics, estimate the flow capacity that would be observed at the current time.
Units: When a quantity is quantitatively specified, we term the quantity a metric. Each metric will be defined in terms of standard units of measurement. The international metric system will be used (meters, seconds...). Appropriate related units based on thousands or thousandths of acceptable units are acceptable (e.g. km or ms, but not cm). The unit of information is the bit. When metric prefixes are used with bits or with combinations including bits, those prefixes will have their metric meaning (related to decimal 1000),

IRMOS IRMOS_WP7_D7_4_1_PU_ALUD_v1_0
Interactive Realtime Multimedia Applications on Service Oriented Infrastructures Created on 30/11/2009
D7.4.1 Initial version of Path supervision Architecture
nd not the meaning conventional with computer storage (related to decimal 1024). hen a time is given, it will be expressed in UTC.
© ALUD and other partners of the IRMOS consortium 2008‐2009 page 25/57
aW Methodology: Metrics are specified but measurement methodologies are not formally standardized. A methodology for a metric should have the property that it is repeatable: if the methodology is used multiple times under identical conditions, it should result in consistent measurements. In practice, as conditions usually change over time, it is enough to ask for “continuity”, to describe a property of a given methodology: a ethodology for a given metric exhibits continuity if, for small variations in conditions, m
it results in small variations in the resulting measurements. Network measurement methods can broadly be classified into passive methods that rely on data collected at e.g. routers, and active methods based on observations of actively‐injected probe packets. Network operators use active measurements because they are easy to conduct, have low overhead and, in contrast to passive data collection methods, measure exactly what normal data packets experience. One of the main disadvantages of active measurements is their limited accuracy due to the need to be non‐intrusive, thus eaving the measured systems uninfluenced by the observation, fundamentally affecting laccuracy [38]. ISONI uses passive measurement techniques as well as active measurement techniques. Active techniques, in which traffic is injected into the network. (The overall link can be haracterized and they are not aware of application protocols.) This is also known as cintrusive measurements. Passive techniques, in which existing traffic is recorded and analyzed. They deal with onnections (pair of IP addresses and ports) and they can distinguish between different
scprotocol streams. This is also known as non‐intrusive measurement . For active monitoring, it is clear that as the number of resource pairs increases, the injected traffic incurs a significant disruption in the network, so usually such measurements are performed sequentially, measuring one or a few paths at a time. In ontrast, a passive monitoring approach can provide an instant estimation across cdifferent paths, independently of their number. ISONI follows the strategy of doing passive monitoring rather than active monitoring. If ctive monitoring is unavoidable then ISONI prefers to do representative measurement a(e.g. just one per network path) to be minimal intrusive as possible. To minimize the monitoring measurement pairs the monitoring is done on different hierarchical levels if feasible. Measurements segmented on intra‐node and inter‐node ortions would reduce the intrusive impact on the inter‐node paths as elaborated in the ext chapters. pn

IRMOS IRMOS_WP7_D7_4_1_PU_ALUD_v1_0
Interactive Realtime Multimedia Applications on Service Oriented Infrastructures Created on 30/11/2009
D7.4.1 Initial version of Path supervision Architecture
ALUD and other partners of the IRMOS consortium 2008‐2009 page 26/57
5.1.1. Inter‐node measurements igure 4FI
depicts the inter‐node measurement showing the vertical and the horizontal XB measurements.
IXB Node IXB Node
VM
U
IXB PH IXB PH IXB PH IXB PH
IXB Node
IXB PH IXB PH
VM
U
VM
U
VM
U
VM
U
VM
U
VM
U
VM
U
VM
U
VM
U
VM
U
VM
U
VM
U
VM
U
VM
U
VM
U
IXBNode – PathID: “Vertical measurement”
IXBNode – IXBNode: Peer to peer measurement
ISP y
ISP x
ISONIPaths (Domain level view)
Figure 4 InterNode IXB measurements
or horizontal IXBF N to IXBN (inter‐node) measurements the amounts of node
irs are calculated as follows: measurement pa For leased lines: The number of measurement relations becomes linear with the number of leased lines.
endpoints. A measurement relation denotes a pair of measurementNRrelationstMeasuremen = sLeasedLine
Number of measurement results that will be generated sLeasedLineNNtsMeasuremenofNumber ⋅= 2
The formula considers just one measurement pair per leased lines, which is the case for xclusive connections without any cross traffic. On each end of the ISONI path
ated. emeasurement results are gener or LAN‐like connected nodes:F he measurement relations for PathIDs belonging to the same network would be: T
( )[ ] QoSclassesPathIDs
PathIDs NN
NRrelationstMeasuremen ⋅
⋅−=
!2!2!
©

IRMOS IRMOS_WP7_D7_4_1_PU_ALUD_v1_0
Interactive Realtime Multimedia Applications on Service Oriented Infrastructures Created on 30/11/2009
D7.4.1 Initial version of Path supervision Architecture
F or each measurement relation pair, each end generates measurement results
( )[ ]
© ALUD and other partners of the IRMOS consortium 2008‐2009 page 27/57
QoSclassesPathIDsN − !2
N
PathIDs NNtsMeasuremenofNumber ⋅=!N
QoS classes represent the number of assigned QoS classes per interface (PathID espectively). Nr PathID represent the number of inter‐node interfaces (PathIDs). R represents the number of reporting related measurements. For vertical measurement each physical interface to a network will be supervised. The kind of outages that can be detected depends on the provided notification features of the related transport network. It may happen that no notification in respect to network outage or degradation is supported. The possibilities here may be minimal.
5.1.2. Intra‐node measurements
Node internal connectivity
Node internal connectivity
Node internal connectivity
Node internal connectivity
IXB Node IXB Node
VMU
IXB PH IXB PH IXB PH IXB PH
VMU
VMU
VM
U
VMU
VMU
VMU
VMU
VMU
VMU
VMU
VM
U
IXBPH/Node – LAN : “Vertical measurement” IXBint – IXBint: Peer to peer measurement (node internal)
IXB PH
VMU
VM
U
VMU
Figure 5 ntraNode IXB surements
The node internal measurement (as depicted in
I mea
Figure 5) depends on the internal onnectivity architecture of the node. This is hidden for the domain level. In principle all cinter‐node measurements can also be applied within a node. The amount of outage measurements follows the same formulas as for inter‐node measurement in case of full meshed peer2peer like outage supervision. Intra‐node onnectivity needs to be supervised for outages permanently. A star like outage easurement as shown in
cFigure 6 reduces the amount of outage measurements. m

IRMOS IRMOS_WP7_D7_4_1_PU_ALUD_v1_0
Interactive Realtime Multimedia Applications on Service Oriented Infrastructures Created on 30/11/2009
D7.4.1 Initial version of Path supervision Architecture
Node internal connectivity
Node internal connectivity
Node internal connectivity
Node internal connectivity
IXB Node IXB Node
VM
U
IXB PH IXB PH IXB PH IXB PH
VM
U
VM
U
VMU
VM
U
VM
U
VM
U
VM
U
VM
U
VM
U
VM
U
VMU
IXB PH
VM
U
VMU
VM
UOutage
measurement
Outagemeasurement
Outagemeasurement
Outagemeasurement
IXBPH/Node – outage measurements “star like”
Figure 6 IntraNode “star like” outage measurements
he following chapters will elaborate for each required monitoring parameter the ccurate measurement methods. Ta
5.2. MTU size The Maximum Transmission Unit (MTU) of a network interface specifies the maximum IP data packet size, which can be transferred without any fragmentation. Networks based on Ethernet transport the IP packets via Ethernet frames. As specified in IEEE 02.3 the standard MTU size for Ethernet is 1500 Bytes. Additional overheads caused by 8tunnelling, encryption, and authentication may reduce the MTU size. osts residing in the internet may send packets that are too large for part of a given
comes unusable. Hpath. If this is not handled correctly the service provided be
here a T
re two possible methods to address them correctly:
• Permitting Packet fragmentation ‐ used mostly by older systems • Path MTU discovery [7] ‐ asking for ICMP notification when fragmentation would
be needed sually modern servers disable fragmentation and try to use path MTU discovery, but U
© ALUD and other partners of the IRMOS consortium 2008‐2009 page 28/57
sometimes the ICMP notifications are blocked. In former days Ethernet has been specified for using 1500 byte frame sizes. To maintain backward compatibility, Fast‐Ethernet used the same size, and today usual gigabit Ethernet devices also use 1500 byte frames. So any combination of 10/100/1000 Mbps Ethernet devices can handle frames without any fragmentation or reassembly.

IRMOS IRMOS_WP7_D7_4_1_PU_ALUD_v1_0
Interactive Realtime Multimedia Applications on Service Oriented Infrastructures Created on 30/11/2009
D7.4.1 Initial version of Path supervision Architecture
Many GE device manufacturers have created proprietary implementations extending the frame size to about 9000 Bytes called Jumbo frames, but they did not become part of the official IEEE 802.3 Ethernet standard. Jumbo packets help to increase the throughput for data traffic, but it impacts other jitter sensitive traffic. A larger MTU size is not feasible
b B
© ALUD and other partners of the IRMOS consortium 2008‐2009 page 29/57
since Ethernet uses a 32 it CRC, which looses its effectiveness above about 12000 ytes [19]. Jumbo frames increase the jitter on Ethernet links which strongly influences jitter ensitive traffic. If Jumbo frames are needed for high throughput data traffic, it is srecommended to separate this data traffic from jitter sensitive traffic. The MTU size is configured by default from ISONI to a value that allows traversing the IXB network without any fragmentation. On standard equipment ISONI takes care of using the correct MTU size, which will be a value smaller than the usual 1500 Bytes due o ISONI encapsulation overhead. There is no need to specify MTU size requirements in tthe VSND. This may cause fragmentation on public external traffic, which may deliver packets that o not fit in the smaller MTU size of ISONI encapsulated VLs. As an example d Table 5 and Table 6 depict the IPv4 packets structure for the unencrypted and encrypted cases. In this case ISONI may use special equipment allowing bigger MTU sizes, which would
ffic without fragmentation. So the oduced by ISONI encapsulation.
allow encapsulation of incoming consumer public traacket size will be increased just by the overhead intrpA standard‐sized frame is specified in IEEE 802.3 [9]. ISONI so far just does not support Jumbo packets (9000 Bytes), since it would increase the jitter on links with mixed QoS traffic. It is recommended that when Jumbo frames need to be supported, the data traffic with Jumbo frames is separated from jitter ensitive traffic. How this separation can be done using ISONI QoS classes is described in 7.3.1
sD
[32].

IRMOS IRMOS_WP7_D7_4_1_PU_ALUD_v1_0
Interactive Realtime Multimedia Applications on Service Oriented Infrastructures Created on 30/11/2009
D7.4.1 Initial version of Path supervision Architecture
© ALUD and other partners of the IRMOS consortium 2008‐2009 page 30/57
Table 5 ISONI encapsulated IPv4 packet – not encrypted
0 31
Version IH thLeng TOS Total length Iden tion tifica Flags Fragment offset
TTL Protocol= GRE Header checksum Source IP address
Desti dress nation IP adC R K S s Recur Flags Ver Protocol Type
GRE Key Version IHLength TOS Total length Iden tion tifica Flags Fragment offset
TTL Protocol Header checksum Source IP address
Destina ddress tion IP a
Payload
MTU size = Bytes 1472 Table 5 and Table 6 indicate 2 examples of encapsulated IPv4 packets as used within ISONI domain. The tunnelling overhead introduced by ISONI encapsulation is 28 Bytes (20 Bytes additional IP header plus 8 Byte GRE overhead using GRE key option). The sable MTU size from application is 1472 Bytes. To avoid fragmentation for public utraffic, the packet size must be enlarged by 28 Bytes between POP and related IXBs. or security reasons, the VL traversing insecure transport networks has to be encrypted, hich results in a smaller MTU size than in unencrypted case.
Fw

IRMOS IRMOS_WP7_D7_4_1_PU_ALUD_v1_0
Interactive Realtime Multimedia Applications on Service Oriented Infrastructures Created on 30/11/2009
D7.4.1 Initial version of Path supervision Architecture
© ALUD and other partners of the IRMOS consortium 2008‐2009 page 31/57
Table 6 ISONI encapsulated IPv4 packet –encrypted
0 31
Version IH thLeng TOS Total length Iden tion tifica Flags Fragment offset
TTL Protocol= GRE Header checksum Source IP address
De s stination IP addresESP: Security Parameter Index (SPI)
S q ence numbere u
Version IH thLeng TOS Total length Iden tion tifica Flags Fragment offset
TTL Protocol= GRE Header checksum Source IP address
Desti dress nation IP adC R K S s Recur Flags Ver Protocol Type
GRE Key Version IHLength TOS Total length Identification Flags Fragment offset
TTL Protocol Header checksum Source IP address
Destination IP address
Payload
Padding Padding Length Next Header Authentication Data (variable)
MTU size = 1416 Bytes A special challenge of ISONI is the support of VMU migration to other PHs or Nodes. Especially for inter‐node migration scenarios, the related MTU size could be less than in intra‐node case due to encryption overhead or dedicated transport network restrictions. During an ongoing live migration the MTU size cannot be changed, which may lead to fragmentation or service unavailability, if the MTU size on new network path is smaller than on the original one. A good approach is to assign to all VMU network interfaces the same MTU size covering the security overheads in general, regardless of using intra‐ or nter‐node network paths. Doing so ISONI is well prepared for any possible occurrence iof live migration. Jumbo frames are not required so far in IRMOS. Following the recommendation eparating high throughput traffic (with Jumbo frames) from jitter sensitive traffic, SONI is well prepared to do so by introducing an additional high throughput QoS class. sI

IRMOS IRMOS_WP7_D7_4_1_PU_ALUD_v1_0
Interactive Realtime Multimedia Applications on Service Oriented Infrastructures Created on 30/11/2009
D7.4.1 Initial version of Path supervision Architecture
© ALUD and other partners of the IRMOS consortium 2008‐2009 page 32/57
enough pause. ISONI may supervise the health of the node by watching the network interfaces on the sending side, for dropped packets, and respectively on receiving side, for malformed packets. But this information cannot be used to determine the loss rate for a virtual link of a dedicated VSN. This information may be considered to determine node internal problems like HW degradation or outages. Measurements from inside the VMUs watching TCP connection are not feasible for ISONI and it does not cover the entire traffic. Flow based measurement in general do not scale. These mechanisms are also
5.3. Packet Loss to be lost in transit from a source to a Packet loss is the probability of a packet
destinaThere a
tion. re two main reasons for packet loss:
• Congestion: Due to queue overflows of buffers in network nodes, which lead topacket drops.
• Errors: Due to corruption, leading to parts of the packet being modified in‐transit. When this is detected by a link‐layer checksum at the receiving end, the packet is discarded.
For real‐time applications such as conversational audio/video, it usually doesn't make much sense to retransmit lost packets, because the retransmitted copy would arrive too late (affecting jitter). The result of packet loss is usually degradation in sound or image quality, but the impact on the performance will depend deeply on the codec in use. Some odern audio/video codec provide a good level of robustness to loss, while the most m
effective image compression methods are usually very sensitive to loss. To measure the end to end packet one way loss rate (OWLR) along a particular path, it is ecessary to know how many packets were sent from the source and how many were
the one‐way loss rate can be derived as: nreceived at the destination. From these values OWLR = 1 ‐ (packets‐received/packets‐sent) From the standpoint of a single endpoint, both of these variables cannot be observed directly. The source endpoint can measure how many packets it has sent to the target endpoint, but it cannot know how many of those packets are successfully received. Similarly, the source endpoint can observe the number of packets it has received from the target endpoint, but it cannot know how many more packets were originally sent. Therefore continuous loss rate tracking requires additional information added to the ata stream (an intrusive measurement). Such an intrusive method is not feasible for dvirtual link individual measurements. There are some passive approaches to measure OWLR:
• s wSting: a TCP‐based Network Mea urement Tool, hich is based on tracking the repeated (lost) packets of the TCP stack [21]
• ‘Passive end‐to‐end packet loss estimation for GRID traffic monitoring’ [22] counts packets on a per flow basis waiting until flows are expired or make a long

IRMOS IRMOS_WP7_D7_4_1_PU_ALUD_v1_0
Interactive Realtime Multimedia Applications on Service Oriented Infrastructures Created on 30/11/2009
D7.4.1 Initial version of Path supervision Architecture
unsuitable for a segment based (portions intra‐node and inter‐node) loss rate measurements. Segment based would mean without terminating the flows. But this is in contradiction to required terminating for measurement (e.g. watching TCP stack). In ddition ISONI needs to monitor continuously, so waiting for expired flows is not an
© ALUD and other partners of the IRMOS consortium 2008‐2009 page 33/57
aadequate mechanism. s a result, the two passive OWL measurement approaches as describe above are not A
feasible for ISONI. The continuous end to end OWLR measurement is not possible on the IP layer without intrusive monitoring. To reduce the impact on virtual link traffic, this OWLR determination is done just for each ISONI inter‐node path by assuming that the OWLR loss rate of an inter‐node path can be projected to the related virtual links. This has to be done separately for the individual QoS classes, if VL is over QoS aware networks. A QoS ndividual measurement is not needed for direct connection like leased lines, SDH/Sonet ilinks. Within a node the loss rate is caused by dropped packets of the network scheduler, the RX/TX interface queues or switching/routing elements. Due to the fact that all inter‐VMU traffic is policed and the node is well provisioned, loss rate as part of VSN monitoring within a node may be regarded as negligible. In contradiction a loss rate monitoring in general between the subsystems of an ISONI node is a needed instrument for detection of HW degradation or outages. These measurements will be performed nrelated to a specific VSN . The mapping of failing HW to an impacted VSN is the uresponsibility of the PMN’s and is described in chapter 6.1.3.
ored per deployed VSN in general, thus it is not As a result, packet loss is not monitreporte eOption
d as part of monitoring r port to FS. s for intra‐node measurement:
• Intra‐node packet loss is regarded to be known and negligible, which is utage = loss supplemented by general health supervision for covering outages (o
• node path rate of 100 %). Intra‐node packet loss is measured for each possible intra‐
• Intra‐node packet loss is measured for each VL up to IXBN Inter‐node packet loss depends on used transport network and may not be negligible. If possible the loss rate will be measured for each available ISONI path and when a certain hreshold is exceeded degradation will be reported via the related DMs to the SLA anager, which may raise a SLA violation.
tM
5.4. Bandwidth Bandwidth is defined as the amount of data that can be carried in a given time period over a network. It is often also labeled as bandwidth capacity or available bandwidth expressed in amount of information per time (e.g. bit/s, kbit/s, Bytes/s …).

IRMOS IRMOS_WP7_D7_4_1_PU_ALUD_v1_0
Interactive Realtime Multimedia Applications on Service Oriented Infrastructures Created on 30/11/2009
D7.4.1 Initial version of Path supervision Architecture
Bandwidth test can be used for measuring the maximum capacity of a computer etwork, but during test the bandwidth is consumed by the bandwidth test and cannot
© ALUD and other partners of the IRMOS consortium 2008‐2009 page 34/57
rc.) or destination (Dst.) hosts or intermediate router.
• Processing delay or Forwarding delay – the time network nodes take to process the packet. Time spent in tasks like reading forwarding‐relevant information from the packet, computing the "forwarding decision" based on routing tables and other
nbe used in conjunction with deployed VL using the same network path. Instead ISONI measures the used bandwidth of each VL calculated based on sent IP packets. But this is not the same as the throughput experienced by an application, since the termination above IP layer is the responsibility of the VMU and is not part of the upervision of ISONI. As an example, ISONI does not know about repeated lost packets of sTCP connections. As a result, ISONI measures the used bandwidth of each VLs continuously up to IP layer. ISONI does not measure any throughput of higher layers like TCP or SCTP. It is the esponsibility of the FS to map the application requirements in terms of throughput to he link bandwidth. rt
5.5. Delay 5.5.1. OWD versus RTT Round‐Trip Time (RTT): In today's Internet, the path from a source to a destination may be different than the path from the destination back to the source ("asymmetric paths"), such that different sequences of routers are used for the forward and reverse paths. Therefore round‐trip measurements actually measure the performance of two distinct paths together. Even when the two paths are symmetric, they may have radically different performance characteristics due to asymmetric queuing. In most cases the RTT is determined by sending an ICMP Echo Request probe from one side to the other. The other side responds, sending back an ICMP Echo Response. But ICMP traffic is often handled differently than normal production traffic (TCP or UDP), hence performance measurements based on ICMP may not reflect the performance of real production traffic. Moreover, the performance of certain applications is solely based on the delay in one irection. The transfer of files through TCP depends on the transmission of actual data ackets rather than the short acknowledgement packets. dp
5.5.2. One Way Delay One Way Delay (OWD): Time it takes for a packet to reach its destination. There are several types of delay times to be taken into account and the resulting delay is he sum of all of them. The overall delay consists of two main components: node delays tand link delays. ode delay takes into account the kinds of delay experienced by a packet in a network lement, e.g. source (SNe

IRMOS IRMOS_WP7_D7_4_1_PU_ALUD_v1_0
Interactive Realtime Multimedia Applications on Service Oriented Infrastructures Created on 30/11/2009
D7.4.1 Initial version of Path supervision Architecture
© ALU um 2008‐2009 page 35/57 D and other partners of the IRMOS consorti
information, and to actually forward the packet towards the destination, which involves copying the packet to a different interface inside the node, rewriting parts of it (such as the IP TTL and any media‐specific headers) and possibly other processing such as fragmentation, accounting, or checking access control lists. It depends on the router architecture, CPU resources, availability of dedicated hardware, etc.
• Queuing delay – the time the packet sits in routing queues waiting for availability of the output link. It depends mainly on the amount of competing traffic towards the
d the priority of the packet itself. output link, the queuing buffer size an
t the same time link dela A
y is the sum of:
• Transmission delay, or Serialization delay, is the time it takes for a packet to be serialized into link transmission units (typically bits). It is the packet size (in bits) divided by the link's capacity (in bits per second).
• Propagation delay ‐ time it takes for the signal to propagate through the medium it is being transmitted through. On simple links, this is the link's physical length divided by the propagation speed. For instance, information transmitted via radio or through copper cables will travel at a speed close to c, the speed of light in vacuum, ~300000 km/s). The prevalent medium for long‐distance digital transmission is now light in optical fibres, where the propagation speed is about 2/3 c, i.e. 200000 km/s. Table 7 shows some examples.
Table 7 Delay examples
Some examples
Shortest Distance (km) Propagation Delay in Fiber (ms)
Madrid‐Stuttgart 1377 7 Oslo‐Athens 2608 13 Paris‐New York 5838 29 London‐Auckland 18353 92 In practice, propagation delays between these cities are significantly much higher because real cables do not go in straight line between the cities and they are divided in everal segments traversing intermediate equipment. ITU‐T G.826 specifies the sphysical‐to‐'air‐route'‐distance ratio of 1.25 in this respect. To be able to measure the delay between Source (Src) and Destination (Dst) in one direction, the measurement on both sides must accurately know the current time. The big challenge is the accurate clock synchronization of Src and Dst measurement systems. GPS systems afford one way to achieve synchronization to within several tens of µsec. Ordinary application of NTP may allow synchronization within several msec. A ombination of some GPS‐based NTP servers and a conservatively designed and cdeployed set of other NTP servers should yield good results. The one way delay measurement follows the following sequence:
• In principle, it is enough that both clocks are synchronized, that is that the two clocks agree on what time it is, although it is desirable that they are also accurate, that is that the two clocks agree with UTC.

IRMOS IRMOS_WP7_D7_4_1_PU_ALUD_v1_0
Interactive Realtime Multimedia Applications on Service Oriented Infrastructures Created on 30/11/2009
D7.4.1 Initial version of Path supervision Architecture
© ALUD and other partners of the IRMOS consortium 2008‐2009 page 36/57
5.5.3. Result For the ISONI inter‐node network path the measured delay values are mainly obtained by OWD measurements. RTT measurements are just done, if OWD measurements are not possible e.g. due to un‐synchronized clocks. This may occur for external service
• At the Src host, select Src and Dst IP addresses, and form a test packet with these addresses. Any 'padding' portion of the packet needed only to make the test packet a given size should be filled with randomized bits to avoid a situation in which the measured delay is lower than it would otherwise be due to compression techniques along the path.
• Src host, place a timestamp in the prepared test packet and send it towards Dst, which should be ready to receive the packet.
• If the packet arrives within a reasonable period of time, take a timestamp as soon t
as possible upon the receipt of the packet. By subtracting the two times amps, an estimate of one‐way delay can be computed.
• If the delay between Src's timestamp and the actual sending of the packet is known, then the estimate could be adjusted by subtracting this amount. This subtraction will give the propagation delay. Also applicable to the destination (delay between Dst’s timestamp and actual receipt).
Uncertainty in a measurement of one‐way delay is related, in part, to uncertainties in the locks of the Src and Dst hosts. Synchronization is the most important issue. Also cresolution and skew of both clocks is important. What it is really measured is host time (time between when a Src grabs a timestamp just rior to sending the test packet and when Dst grabs a timestamp just after having preceived the test packet) >= wire time. For minimizing delay measurement effects coming from periodic traffic behaviours Pseudo‐random Poisson process are used, when sending test packets. E xamp yles for dela measurement protocols:
• RFC 4656: A One‐way Active Measurement Protocol (OWAMP). OWAMP measures unidirectional characteristics such as one‐way delay and one‐way loss. High‐precision measurement of these one‐way IP performance metrics became possible with wider availability of good time sources (such as GPS and CDMA). OWAMP enables the interoperability of these measurements.
• Draft (last version: draft‐ietf‐ippm‐twamp‐09, expires Jan’09): A Two‐way Active Measurement Protocol (TWAMP). OWAMP can be used bi‐directionally to measure one‐way metrics in both directions between two network elements. However, it does not accommodate round‐trip or two‐way measurements. TWAMP is based on the OWAMP and adds two‐way or round‐trip measurement capabilities.

IRMOS IRMOS_WP7_D7_4_1_PU_ALUD_v1_0
Interactive Realtime Multimedia Applications on Service Oriented Infrastructures Created on 30/11/2009
D7.4.1 Initial version of Path supervision Architecture
omponents EASC, which do not belong to the ISONI domain embodying an essential cpart of the application. Delay measurements can be segmented into different parts. The Path Manager knows the node internal path for which a certain delay is associated. The manufacturer of a ode determines, whether the intra‐node values needs to be measured or just a pre‐ndetermined value is assumed here. The inter‐node delay is measured peer2peer between IXBN for each path representing the connectivity among ISONI Nodes. egment based delays measurements can simply be added by summing the average elay value of each measurement segment k as in: Sd
∑=
=n
kkµµ
1
Figure 7 Formula of delay segments k wit average delays µ hereas µW
h
k represents the average delay on segment k. and n represents the number of egments. s
5.6. Delay Variation (Jitter) The variation in packet delay is sometimes called "jitter". This term, however, causes confusion because it is used in different ways by different groups of people. The meaning we use here has to do with a metric that describes the level of disturbance of packet arrival times with respect to an "ideal" pattern, typically the pattern in which the ackets were sent. Such disturbances can be caused by competing traffic (i.e. queuing),
por by contention on processing resources in the network Delay variation is an issue for real‐time applications such as audio/video conferencing systems. They usually employ a jitter buffer to eliminate the effects of delay variation. Jitter is usually introduced in network nodes (routers), as an effect of queuing or contention for forwarding resources, especially on CPU‐based router architectures. ome types of links can also introduce jitter, for example through collision avoidance S
© ALUD and other partners of the IRMOS consortium 2008‐2009 page 37/57
synchronized clock as discussed for the Delay metric. In contrast the RFC 3393
(shared Ethernet) or link‐level retransmission (802.11 wireless LANs). IP Packet Delay Variation Metric for IPPM (RFC 3393) [5]. It is based on "A One‐Way‐elay metric for IPPM", RFC 2679 D [6]. In this case the jitter measurement requires
[5] defines an IP Delay Variation Metric (IPDV), which does not require synchronized clocks. Given a pair of packets within a stream of packets going

IRMOS IRMOS_WP7_D7_4_1_PU_ALUD_v1_0
Interactive Realtime Multimedia Applications on Service Oriented Infrastructures Created on 30/11/2009
D7.4.1 Initial version of Path supervision Architecture
from measurement point MP1 to measurement point MP2, the IPDV is the difference between the one‐way‐delay of the selected packets between those two points. This articular metric only compares the delays experienced by packets of equal size, on the pgrounds that delay is naturally dependent on packet size, because of serialization delay. ISONI normally will perform IP Packet Delay Variation Metrics based on OWD, if it is available. Otherwise ISONI will rely on RFC 3393 [5] defined metrics. Similar to the delay the jitter measurements are segmented into different parts k and can be calculated as follows:
∑=
=n
kk
1²σσ
Figure 8 Form la of jitter (variation σ) he jitter is expressed as variation ‘σ’. ‘k’ indicates the segment portions and ‘n’ the total T
u
amount of segments. The Path Manager knows the node internal path for which a certain jitter is associated. The manufacturer of a node determines whether the intra‐node values needs to be measured or just a pre‐determined value is assumed here. Using pre‐determined values
i nis possible, since the cross‐traff c inside a node is ma aged and well known. A manufacture must balance pros and cons trading exactness for intrusiveness. The inter‐node jitter is measured peer2peer between IXBN for each path representing the connectivity among ISONI Nodes.
5.7. Synchronizing clocks he one way measurements need to have synchronized clocks. Deviating time clocks Tbetween Src and Dst distort the measured values. NTP is the standard protocol for distributing accurate time around the Internet to hosts and is specified by several RFCs as outcome of IETF NTP Working Group work [35]. NTP uses a hierarchical, layered system of levels of clock sources. Each level of this hierarchy is called stratum. Stratum 0 is the highest level and is usually a caesium atom clock or a Global Positioning System (GPS) that receives time from satellites. The stratum level defines the distance from the reference clock. It defines the “distance” from the origin lock source and is not an indication of accuracy. (i.e. a "stratum 3" time sources could
r c
© ALUD and other partners of the IRMOS consortium 2008‐2009 page 38/57
be more accurate than anothe "stratum 2" time source) The accuracy of next level time synchronization of system clock depends on the uncertainty introduced by processing on the stratum server itself and the delay distance o the time server. In respect to the latter one the most accurate time offsets come from onstellations with the minimum network delay to a given server tc
[36] .
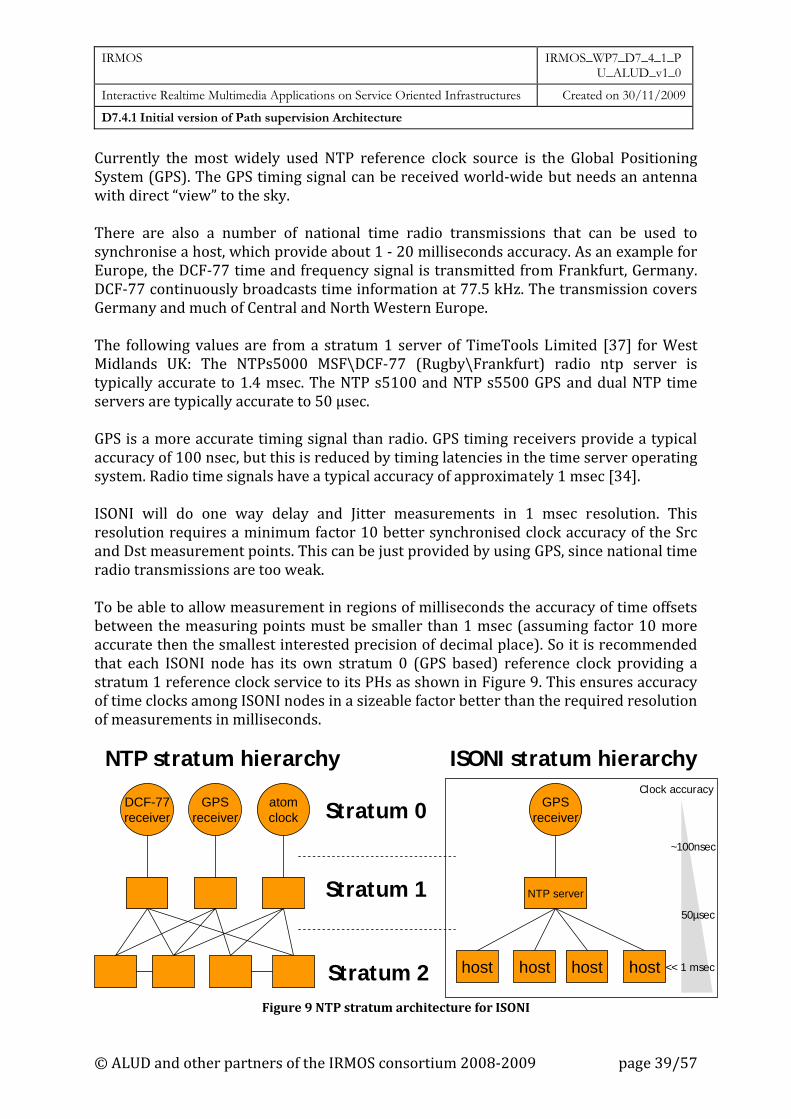
IRMOS IRMOS_WP7_D7_4_1_PU_ALUD_v1_0
Interactive Realtime Multimedia Applications on Service Oriented Infrastructures Created on 30/11/2009
D7.4.1 Initial version of Path supervision Architecture
Currently the most widely used NTP reference clock source is the Global Positioning ystem (GPS). The GPS timing signal can be received world‐wide but needs an antenna
Swith direct “view” to the sky. There are also a number of national time radio transmissions that can be used to synchronise a host, which provide about 1 ‐ 20 milliseconds accuracy. As an example for Europe, the DCF‐77 time and frequency signal is transmitted from Frankfurt, Germany. CF‐77 continuously broadcasts time information at 77.5 kHz. The transmission covers D
Germany and much of Central and North Western Europe. The following values are from a stratum 1 server of TimeTools Limited [37] for West Midlands UK: The NTPs5000 MSF\DCF‐77 (Rugby\Frankfurt) radio ntp server is ypically accurate to 1.4 msec. The NTP s5100 and NTP s5500 GPS and dual NTP time tservers are typically accurate to 50 µsec. GPS is a more accurate timing signal than radio. GPS timing receivers provide a typical ccuracy of 100 nsec, but this is reduced by timing latencies in the time server operating asystem. Radio time signals have a typical accuracy of approximately 1 msec [34]. ISONI will do one way delay and Jitter measurements in 1 msec resolution. This resolution requires a minimum factor 10 better synchronised clock accuracy of the Src nd Dst measurement points. This can be just provided by using GPS, since national time aradio transmissions are too weak. To be able to allow measurement in regions of milliseconds the accuracy of time offsets between the measuring points must be smaller than 1 msec (assuming factor 10 more accurate then the smallest interested precision of decimal place). So it is recommended that each ISONI node has its own stratum 0 (GPS based) reference clock providing a stratum 1 reference clock service to its PHs as shown in Figure 9. This ensures accuracy f time clocks among ISONI nodes in a sizeable factor better than the required resolution f measurements in milliseconds. oo
© ALUD and other partners of the IRMOS consortium 2008‐2009 page 39/57
DCF-77receiver
GPSreceiver
atomclock Stratum 0
Stratum 1
Stratum 2
GPSreceiver
NTP server
host host host host
NTP stratum hierarchy ISONI stratum hierarchy
~100nsec
<< 1 msec
50µsec
Clock accuracy
Figure 9 NTP stratum architecture for ISONI

IRMOS IRMOS_WP7_D7_4_1_PU_ALUD_v1_0
Interactive Realtime Multimedia Applications on Service Oriented Infrastructures Created on 30/11/2009
D7.4.1 Initial version of Path supervision Architecture
© ALUD and other partners of the IRMOS consortium 2008‐2009 page 40/57
6. ISONI path supervision framew rk This chapter describes the influence on the supervision framework of the ISONI architecture. It expands the framework with the monitoring functionality. It will show ow the monitoring values will travel from the Physical Host to the monitoring interface
o
hfor the Framework services. he ISONI supervision is also used for outage reporting in case of serious problems and ailures, which results in T‐SLA violations reported to the FS. Tf
Nodelevel
Domainlevel
ISONI
VMU
IXB PH
IXB Node
Deployment Manager
Transport network
VMU
NodeMeasurement
Deployment ManagerISONI SLA Manager
VSNMonitoring
T-SLA violationreporting
Access link supervision Access link supervision
NodeMeasurement
VSNMonitoring
IXB PH
IXB Node
PathManagerDomain
Measurem
entR
eporting
Resource
Availability
Reporting
Outage/
ThresholdR
eporting
Figure 10 Measurement reporting
Figure 10 shows an illustration of the different measurement and aggregation layers. Like th ded in 3 layers e other parts of the framework the monitoring architecture is divi
1. Host Level This layer collects all low level information from the real devices.
2. Node Level The Node level collects all measurement data from the host level and combine them to a Node specific measurement package.
3. Domain Level The Domain level aggregates all measurement data from different Node levels and generates a data set that matches the specifications of the monitoring data for a deployed VSN. It reports the VSN related measured data to the FS via a platform interface.

IRMOS IRMOS_WP7_D7_4_1_PU_ALUD_v1_0
Interactive Realtime Multimedia Applications on Service Oriented Infrastructures Created on 30/11/2009
D7.4.1 Initial version of Path supervision Architecture
Each of those layers requires an additional interface that will described in section
© ALUD and other partners of the IRMOS consortium 2008‐2009 page 41/57
6.1
6.1. Affected ISONI Components During the VSN lifetime the monitoring data traverse different entities of the ISONI architecture. Each of them has to be aware of these data and therefore needs to be enhanced by adding the monitoring functionality. The data will be captured at the owest level on the PHs and will be delivered through the ISONI Gateway towards the lFramework Services. Figure 11 shows an abstract overview of the dataflow. It starts with the low level measurement of the IXB which passes fine granular datasets to the PMN. The PMN maps the data to the corresponding Virtual Link (VL). Finally the Deployment Manager on the Domain level collects and combines those data for the final elivering to the ISONI Gateway. The ISONI SLA‐Manager takes a special role in this rocess because it only gets informed in case of an outage. dp
Figure 11 ISONI monitoring message flow
6.1.1. Clock synchronization architecture Each ISONI Node needs to have its own Stratum 0 clock. Redundant clocks per node are recommended as shown in Figure 12 as a possible solution to be carrier grade. It shows he case that the GPS stratum 0 clock is distributed via node internal NTP server owards inside the node located physical hosts. tt

IRMOS IRMOS_WP7_D7_4_1_PU_ALUD_v1_0
Interactive Realtime Multimedia Applications on Service Oriented Infrastructures Created on 30/11/2009
D7.4.1 Initial version of Path supervision Architecture
RMOS consortium 2008‐2009 page 42/57
GPSreceiver
PrimaryNTP server
PH PH PH
SecondaryNTP server
GPSreceiver
IXBN
~100nsec
<< 1 msec
50µsec
ISONI Node A
Clock accuracy
IXBPHIXBPH IXBPH
GPSreceiver
PrimaryNTP server
PH PH PH
SecondaryNTP server
GPSreceiver
IXBN
~100nsec
<< 1 msec
50µsec
ISONI Node B
Clock accuracy
IXBPHIXBPH IXBPH
© ALUD and other partners of the I
Figure 12 ISONI clock architecture ll the modules responsible for measurement creation must have synchronized clocks ith an accuracy << 1 msec.
Aw
6.1.2. IXB The IX nerating the low level measurements. This in
Bs (IXBN and IXBPH) are responsible for ge
• cludes: Delay (segmented inter‐node, intra‐node)
• Jitter (segmented inter‐node, intra‐node) • Bandwidth for each VL means related to individual VSN
he measurements may be integrated into the IXBs itself or done by collocated SW Tmodules. The inter‐node measurements are done for all configured ISONI paths of the ISONI omain. It is based on the same information, which is used for the correlation matrix dused on PMD as described in D7.2.1 [31]. In the case of the intra‐node measurements, these are established according to the node structure and intra‐node specials. A very simple node may just report fixed values by aking estimations from another time according to the performance measurement
o p mmeth dology (cha ter ). nd finally, the VL related measurements and bandwidth usage measurements
5.1
Arespectively are established in conjunction with the deployment of a VL. Each of the time interval reports are provided with an accurate time stamp. Inter‐node measurement is reported to the PMN using the ISONI path as reference. Intra‐node measurement is reported to the PMN using internal node references, if not fixed values are assumed as discussed above. And VL related bandwidth measurement is reported to the PMN using the VL as reference.

IRMOS IRMOS_WP7_D7_4_1_PU_ALUD_v1_0
Interactive Realtime Multimedia Applications on Service Oriented Infrastructures Created on 30/11/2009
D7.4.1 Initial version of Path supervision Architecture
© ALUD and other partners of the IRMOS consortium 2008‐2009 page 43/57
6.1.3. ath Manager Node The PM
PN is responsible for collecting all the network related measured data generated
ithin the node. PMw N has to correlate the measured data of intra‐node connections and yments. has to identify and map the data to corresponding individual VSN deplo
The PMNs reports the measured values to the VSN corresponding DMs. Any detected outages impact the availability report to the PMD by removing the related raction of failing network resources. The consequence is that for the next VSN eployment the outage is considered as decreased availability of network resources. fd
6.1.4. Deployment Manager During VSN Instantiation process the DM factory instantiates a VSN specific DM instance for the requested VSN. This request namely VSND contains the monitoring report ranularity (multiple of 1 sec) and enabling/disabling monitoring configuration in grespect to each VL. After the successful deployment of the VSN, this DM instance is responsible for the VSN over the lifetime of the T‐SLA. It receives the measured data from all involved ISONI nodes for this VSN and correlates them. Depending on the monitoring granularity requirements in the VSND the measured values are summed up for larger time intervals. After the processing is completed for certain time slices, a XML formatted monitoring report is sent via ISONI Gateway to the FS. An example for network monitoring is given n i Annex A, whereas the data measuring for the computation and storage is described in D6.1.2 [28]. n addition the DM is also responsible to inform the SLA Manager about degradation and utages. Io
6.1.5. ISONI SLA‐Manager The ISONI SLA Manager is the connection point to components from the Framework Services and the component inside ISONI that is treating SLA‐specific issues. Outages and long‐term degradations that are identified by the Deployment Manager are reported to the SLA Manager, which in turn reports the violations to the Monitoring Service of the Framework Services depending on the SLA contract. Not all outages or degradation leads directly to an SLA‐violation, since a contract usually does not ensure 100% availability. For example 99,999 % availability would allow up to about 5 Minutes outage per year. The five‐nines are usually required from carrier grade systems, means e.g. HW of an ISONI node. Table 8 gives some examples of availabilities. But such a high availably is not granted for application services. ISONI can give certain availability per VSN components, which means ISONI SC or VL. The availability of the entire application service depends on the amount of VSN elements and their VSN topology. Depending on

IRMOS IRMOS_WP7_D7_4_1_PU_ALUD_v1_0
Interactive Realtime Multimedia Applications on Service Oriented Infrastructures Created on 30/11/2009
D7.4.1 Initial version of Path supervision Architecture
he availability given by ISONI domain operator, an SLA violation is then raised, when he outage budget of the granted availability has been exceeded.
© ALUD and other partners of the IRMOS consortium 2008‐2009 page 44/57
tt
Table 8 Availability examples
Availability % Outage per year Outage per month Outage per day 95% 438 hours 36.5 hours 12 Minutes 98% 175.2 hours 14.6 hours 6 Minutes 99% 87.6 hours 7.3 hours 2.4 Minutes
99.5% 43.8 hours 3.65 hours 36 Seconds 99.8% 17.52 hours 1.46 hours 14.4 Seconds 99.9% 8.76 hours 43.8 Minutes 7.2 Seconds 99.95% 4.38 hours 21.9 Minutes 3.6 Seconds 99.99% 52.56 Minutes 4.38 Minutes 0.72 Seconds 99.999% 5.256 Minutes 0.438 Minutes 0.072 Seconds 99.9999% 0.526 Minutes 0.0438 Minutes 0.0072 Seconds
Typical for HW in telecom environment are system availability of five‐nines (99.999%). Assuming that ISONI nodes ensure five‐nine carrier grade availability, then an application distributed over several nodes cannot reach the five nines anymore. Discussing availability is not in the scope of this document. It shall be just noticed, that an SLA violation is first reported to FS, when the guaranteed availability of the entire VSN cannot be met. This means that application service without any SLA availability guarantees would not cause any SLA violation due to outages or degradations.

IRMOS IRMOS_WP7_D7_4_1_PU_ALUD_v1_0
Interactive Realtime Multimedia Applications on Service Oriented Infrastructures Created on 30/11/2009
D7.4.1 Initial version of Path supervision Architecture
© ALUD and other partners of the IRMOS consortium 2008‐2009 page 45/57
6.2. Measurement configuration 6.2.1. Inter‐node measurement Inter‐node delay and jitter measurements are performed permanently independent of any VSN deployments. Inter‐node measurements are based on the same information, which is used by IXB to setup VL connectivity between nods. As described in D7.2.1 this is done via using ISONI path configuration as used in correlation matrix on Path Manager Domain level. The correlation matrix represents the inter‐node connectivity considering the allowed QoS classes for an ISONI path. Depending on the used transport network delay and jitter measurements have to be done per each possible ISONI QoS class on this path as indicated in Figure 13 or by just one delay and jitter measurement per ISONI path. Leased lines for example do not need ISONI QoS class individual measurements, since after serialisation, the delay and jitter will not alter during ransfer. Just in cases whereas the transport network would cause different delay and itter for different ISONI QoS class traffic it has to be measured individually. tj
A B
CD
A1
A2
A3B1
B2
C2C1D1
D2
JitterDelayJitterDelayJitterDelayISONI paths
YYYYYYA3D1
YYNNNNA2D2
YYNNNNA2C2
NNYYYYA1B2
QoS class 3QoS class 2QoS class 1Node A
JitterDelayJitterDelayJitterDelayISONI paths
YYYYYYA3D1
YYNNNNA2D2
YYNNNNA2C2
NNYYYYA1B2
QoS class 3QoS class 2QoS class 1Node A
JitterDelayJitterDelayJitterDelayISONI paths
NNYYYYB2A1
YYYYYYB1C1
QoS class 3QoS class 2QoS class 1Node B
JitterDelayJitterDelayJitterDelayISONI paths
NNYYYYB2A1
YYYYYYB1C1
QoS class 3QoS class 2QoS class 1Node B
JitterDelayJitterDelayJitterDelayISONI paths
YYNNNNC2D2
YYNNNNC2A2
YYYYYYC1B1
QoS class 3QoS class 2QoS class 1Node C
JitterDelayJitterDelayJitterDelayISONI paths
YYNNNNC2D2
YYNNNNC2A2
YYYYYYC1B1
QoS class 3QoS class 2QoS class 1Node C
JitterDelayJitterDelayJitterDelayISONI paths
YYNNNND2C2
YYNNNND2A2
YYYYYYD1A3
QoS class 3QoS class 2QoS class 1Node D
JitterDelayJitterDelayJitterDelayISONI paths
YYNNNND2C2
YYNNNND2A2
YYYYYYD1A3
QoS class 3QoS class 2QoS class 1Node D
QoS‐C:1,2,3
QoS‐C:1,2
QoS‐C:3
QoS‐C:3
QoS‐C:1,2,3
Y: Yes - measuredN: No - Not measured
Figure 13 Internode measurements (example)
Figure 13 shows an ISONI node infrastructure example consisting of 4 ISONI nodes A‐D. Each of the nodes has some inter‐node interfaces (namely PathIDs) declared as Ax, Bx, Cx, Dx . Each node holds an ISONI path matrix indicating which network path needs to be measured. The tables indicate whether an inter‐node measurement is done (Y) or not N). Affiliated to the PathIDs of an ISONI Path are the addresses needed for inter‐node easurements.
(m

IRMOS IRMOS_WP7_D7_4_1_PU_ALUD_v1_0
Interactive Realtime Multimedia Applications on Service Oriented Infrastructures Created on 30/11/2009
D7.4.1 Initial version of Path supervision Architecture
ALUD and other partners of the IRMOS consortium 2008‐2009 page 46/57
6.2.2. Intra‐node measurement Intra‐node measurement depends on structure of the node internally. An ISONI node consisting of ATCA systems may organise the intra‐node measurements differently from an ISONI node consisting of individual systems. ISONI architecture leaves it up to the ISONI node manufacturer, how all the node‐internal measurement and supervision is realized. It is required that an ISONI node will provide diagnostically conclusive values for bandwidth, delay and jitter for intra‐node VL connections.
6.3. Measurement reference architecture 6.3.1. Inter‐node measurement architecture Figure 14 visualises the abstract inter‐node measurement architecture model following the ITU‐T G.800 syntax [13]. G.800 syntax has been specified for having a more generally applicable model for transport (infrastructure) networks covering connectionless, connection‐oriented and circuit switched network modes means a unified architecture model. (Figure 15 introduces some symbols, for detail refer the standard G.800 series) It consists of inter‐node OWD and OWJ bi‐directional measurements injecting at the ISONI path multiplexing level (means intrusive measurement). Besides that, it shows the VMU related bandwidth measurement. Abstract model is independent of realization or mplementation, but it pose as a good guideline for implementation and as a model for perational maintenance of an ISONI domain. io
©
Inter-NodemeasurementOWD, OWJ
Inter-Nodemeasurement
OWD, OWJ
ISONI QoS Overlay Adaption
Inter-nodeConnectivity
(tunnels)
Intra-node
IXB Node
IXB PH IXB PH
IXB Node
IXB PH IXB PH
ISONI path= (x,y)
AP AP
ISONI inter-node connectivity
VMU VMU VMUVMU VMU
Virtual Link (VL)
VMU
PathID=x PathID=y
OW
D,
OW
J
OW
D,
OW
J
VMU relatedmeasurementUsed outgoing
bandwidth per VL
Figure 14 Internode measurement (abstract view)

IRMOS IRMOS_WP7_D7_4_1_PU_ALUD_v1_0
Interactive Realtime Multimedia Applications on Service Oriented Infrastructures Created on 30/11/2009
D7.4.1 Initial version of Path supervision Architecture
© ALUD and other partners of the IRMOS consortium 2008‐2009 page 47/57
AP
CP
server layer connection
server trail
TCP
Adaptation functionSource function examples:•bit scrambling•encoding•framing•encapsulation•bit‐rate adaptation•multiplexing, inverse multiplexing•…Sink function examples:•Descrambling, decoding, deframing, decapsulation•bit‐rate adaptation•demultiplexing•timing recovery•…
Source Sink bi‐directional
Trail Termination functionssource termination function:•generates error check code •…sink termination function:•detects misconnections•detects loss of signal, loss of framing•detects code violations and/or bit errors•monitors performance•…
CP: Connection PointAP: Access PointTCP: Termination Connection Point
Figure 15 G.800 series unified model
6.3.2. Intra‐node measurement architecture If a node has to continuously make intra‐node measurements, it has to take the intrusive traffic overhead into account, which reduces the available bandwidth in the node. Figure 16 visualises the abstract inter‐node measurement architecture model following the ITU‐T G.800 [13] syntax. It consists of intra‐node OWD and OWJ bi‐directional easurements injecting at the node internal path multiplexing level (means intrusive easurement).
mm

IRMOS IRMOS_WP7_D7_4_1_PU_ALUD_v1_0
Interactive Realtime Multimedia Applications on Service Oriented Infrastructures Created on 30/11/2009
D7.4.1 Initial version of Path supervision Architecture
© ALUD and other partners of the IRMOS consortium 2008‐2009 page 48/57
Intra-Nodemeasurement-Delay- Jitter
Intra-Nodemeasurement
-Delay- Jitter
Intra-nodeConnectivity
IXB PH IXB PH
AP AP
ISONI intra-node connectivity
VMU VMU VMU
Virtual Link (VL)
VMU VMU VMUVMU related
measurementUsed outgoing
bandwidth per VL
Figure 16 Intranode Measurements (abstract view)
6.4. Outage detection (network) Figure 17 visualises the abstract health supervision architecture model following the TU‐T G.800 Ir
[13] syntax. It consists of outage detections of each trail termination epresented as a triangle (G.800 syntax).
Virtual IP
GRETunnel
Virtualized VMU network interface
IPIntra-node
and
Transport interface Supervision
-Loss of signal-Loss of framing-AIS, RDI signals-Dark fiber- …
Physical
Ethernet
IXB PHVMU IXB Node
ISONI path= (x,y)
Virtual Link
Protection switch(optional)
Intra-node measurementOutage detectionIXBPH - IXBN
Inter-node measurementOutage detectionIXBN - IXBN
optional

IRMOS IRMOS_WP7_D7_4_1_PU_ALUD_v1_0
Interactive Realtime Multimedia Applications on Service Oriented Infrastructures Created on 30/11/2009
D7.4.1 Initial version of Path supervision Architecture
© ALUD and other partners of the IRMOS consortium 2008‐2009 page 49/57
Figure 17 Outage measurement detailed (abstract view)
s to be supervised using an outage hierarchy to be able to Each topology level needlocalizeThe ou
the outage and to hide also node internals.
• paths tages are detected: Between ISONI Nodes by considering all possible network
• Between IXBs inside a node (between all IXBPH and IXBN) The ISONI network outage detection supervises the network inter‐node connectivity among IXBs within an ISONI domain. Any network outage or degradation is notified by Resource Availability Reporting to the PMD. The outage detection is supplemented by “vertical” outage recognition from lower layers of the transport interface wherever applicable (trail termination – represented as triangle in the model ‐ Figure 17). Outage etection between VMUs peer2peer is so far not required. This is up to the application dlevel inside the VMU, which means that it is transparent for ISONI. If for aescalat
ny reason a VL of a deployed running VSN is impacted, then the following ion procedure will be triggered:
• For VL with pre‐configured spare path, the traffic will be switched to spare path. (node internal mechanism)
• For longer outages, the related DMs of the impacted VL are informed. Then it is up to the DMs to initiate further recovery/failover processes as described in D6.2.1. [29].

IRMOS IRMOS_WP7_D7_4_1_PU_ALUD_v1_0
Interactive Realtime Multimedia Applications on Service Oriented Infrastructures Created on 30/11/2009
D7.4.1 Initial version of Path supervision Architecture
© ALUD and other partners of the IRMOS consortium 2008‐2009 page 50/57
7. Conclusion This document has shown the general IRMOS monitoring aspects and outage detection methods in relation to the networking infrastructure resources. In this first stage deliverable the main focus has been given to the monitoring architecture and the inter‐node measurements. Intra‐node measurements are node specific and their realization is part of the implementation of such an ISONI node. An ISONI node consisting of ATCA can realize the measurements differently than an ISONI node consisting of individual PCs connected via a LAN. Special attention has been given to create measurement and monitoring functions that fit the existing management middleware by sustaining the node level autonomy, further attention has been given to measurements causing as little intrusion as possible avoiding impact on deployed VLs and minimizing the measurement network resource overhead by doing measurements in a segmented fashion, this is important to create a scalable solution. In respect to outage detection the abstract architecture has been modelled and the mpact on the availability reporting of ISONI has been understood. Further details are iintended to be included in the next deliverable. The next stage deliverable D7.4.2 (05/2010) will add more details about intra‐node unctions in respect to monitoring and heath supervision and means for outage reatment. ft

IRMOS IRMOS_WP7_D7_4_1_PU_ALUD_v1_0
Interactive Realtime Multimedia Applications on Service Oriented Infrastructures Created on 30/11/2009
D7.4.1 Initial version of Path supervision Architecture
© ALUD 7 and other partners of the IRMOS consortium 2008‐2009 page 51/5
8. ferences cs. University College London, 2003
Re[1] QoS, Yee‐Ting Li. High Energy Physi
http://www.hep.ucl.ac.uk/~ytl/qos/index.html
w tching[2] Multi Protocol Label Switching (MPLS),
http://en.wikipedia.org/wiki/Multiprotocol_Label_S i [3] IETF ulti abe g Working GrM protocol L l Switchin oup,
http://tools.ietf.org/wg/mpls/ [4] MPLS Network Reliance and Recovery, Rick Gallaher,
http://www.convergedigest.com/tutorials/mpls4/page1.htm n[5] IETF, RFC3393, IP Packet Delay Variatio Metric for IP Performance Metrics
(IPPM), C. Demichelis, P. Chimento, November 2002 skas, [6] IETF, RFC2679, A One‐way Delay Metric for IPPM, S. Kalidindi, M. Zekau
bSeptember 1999
[7] IETF, RFC 1191, Path MTU Discovery, J. Mogul, S. Deering,Novem er 1990 S)‐based [8] RFC 3469: Framework for Multi‐Protocol Label Switching (MPL
y
Recover[9] IEEE Std 802.3‐2008, Local and metropolitan area networks (Ethernet)
dia article, [10] Simple Network Management Protocol, Wikipehttp://en.wikipedia.org/wiki/Simple_Network_Management_Protocol
[11] Netfow, Wikipedia article, http://en.wikipedia.org/wiki/Netflow ce
s [12] ITU‐T Y.1541 (02/2006) Network performance objectives for IP‐based servi[13] ITU‐T G.800(09/2007), Unified functional architecture of transport network
s
[14] http://www.ecse.rpi.edu/Homepages/shivkuma/teaching/sp2001/ip2001‐Lecture14‐6pp.pdf
_id=146364&page_number=2. [15] http://www.lightreading.com/document.asp?doc
A Guide to PBT/PBB‐TE
[16] http://en.wikipedia.org/wiki/Quality_of_service [17] http://www.pipelinepub.com/0607/pdf/NetScout_appnote_MPLS.pdf.
Monitoring Performance in MPLS Networks from the Service Provider Perspective
[18] A. Farrel, S. Abeck et al. Network Management, know it all. Morgan Kaufmann Publishers,2009
, [19] IBM redbook: IBM System Storage N series: An iSCSI Performance OverviewAlex Osuna, Gary R Nunn, Toby Creek, 2007, http://ibm.com/redbooks
[20] ITU‐T Y.1541(02/2006), Network performance objectives for IP‐based services T e M
e
[21] Sting: a CP‐based N twork easurement Tool, Stefan Savage, Department of
Computer Science and Engineering, University of Washington, Seattl Passive end p
A. [22] end‐to‐ acket loss estimation for GRID traffic monitoring,
A. Papadogiannakis, Kapravelos, M. Polychronakis, E. P. Markatos IRMOS D2.3.1
08 [23] Project, State of the Art on IRMOS technologies, NTUA and other
partners, July 20 IRMOS p[24] Project D3.1.2 IRMOS Overall Architecture, NTUA and other artners,
February 2009 [25] IRMOS Project D4.1.1, Definition and implementation of the three scenarios
and its real time requirements, TSG (GVG) and other partners, February 2009

IRMOS IRMOS_WP7_D7_4_1_PU_ALUD_v1_0
Interactive Realtime Multimedia Applications on Service Oriented Infrastructures Created on 30/11/2009
D7.4 ion of Path sion Architecture .1 Initial vers supervi
IRMOS .1, Int r IR G
© ALUD and other partners of the IRMOS consortium 2008‐2009 page 52/57
[26] Project D4.2 e face Definition to the MOS SOI, ILABS and other partners, June 2009
[27] IRMOS Project D6.1.1 Formal description language for application require f Exe Sments o cution Environment, U TUTT and other partners, November 2008
IRMOS D6.1.2[28] Project Prototype of Execution Environment (limited feature set), USTUTT and other partners, planned November 2009
IRMOS mce, U
[29] Project D6.2.1 Initial version of Life migration mechanis , Redundancy and Fault Toleran STUTT and other partners, May 2009
IRMOS [30] Project D7.1.1 ISONI addressing schemes, USTUTT and other partners, November 2008
IRMOS[31] Project, D7.2.1 Initial version of Path Manager: Architecture, ALUD and other partners, May 2009
P D [32] IRMOS roject, 7.3.1, Initial version of Flow Control Architecture, ALUD and other partners, August 2009
ber 2008, [33] IRMOS Project ISONI Whitepaper, ALUD and USTUTT, Septemhttp://www.irmosproject.eu/Publications/
.uk/support/ntp‐time‐serve[34] r‐accuracy.htmhttp://www.timetools.co [35] arters/ntp‐charter.htmlhttp://www.ietf.org/html.ch [36] http://www.ijs.si/time/ [37] http://www.timetools.co.uk [38] http://portal.acm.org/citation.cfm?id=1236736&coll=GUIDE&dl=GUIDE
y[39] http://en.wikipedia.org/wiki/Best_effort_deliver a /[40] Apache Synapse, The Apache Software Foundation, http://syn pse.apache.org ,
[41] http://www.linuxfoundation.org/en/Net:Netem 42] OASIS Web Services Notification, Organization for the Advancement of
Structured Information Standards [

IRMOS IRMOS_WP7_D7_4_1_PU_ALUD_v1_0
Interactive Realtime Multimedia Applications on Service Oriented Infrastructures Created on 30/11/2009
D7.4.1 Initial version of Path supervision Architecture
© ALUD and other partners of the IRMOS consortium 2008‐2009 page 53/57
Annex A. Monitoring example
A.1. Monitoring XML Schema
N
Figure 18 Monitoring XML Shema
ote: The Long Time Storage QoS monitoring parameter are not yet specified.
<?xml version="1.0" encoding="UTF-8"?> <xs:schema xmlns="http://irmos.rus.uni-stuttgart.de/Monitoring" xmlns:xs="http://www.w3.org/2001/XMLSchema" targetNamespace="http://irmos.rus.uni-stuttgart.de/Monitoring" elementFormDefault="qualified" attributeFormDefault="unqualified"> <xs:element name="ISONI_Domain_Monitoring_Report"> <xs:annotation> <xs:documentation>Monitoring report to IRMOS FS</xs:documentation> </xs:annotation> <xs:complexType> <xs:sequence> <xs:element name="T-SLA_reference" type="xs:string"/> <xs:element name="OWL_VSN_Individual_ID" type="xs:string"/> <xs:element name="Date" type="xs:date"/> <xs:element name="TimeGranularity_sec" type="xs:unsignedInt" default="1"/> <xs:element name="ReportIntervall" maxOccurs="unbounded"> <xs:complexType> <xs:sequence> <xs:element name="Timestamp" type="xs:time"/> <xs:element name="VL_report" minOccurs="0" maxOccurs="unbounded"> <xs:complexType> <xs:sequence> <xs:element name="OWL_edge_individual_ID" type="xs:string"/> <xs:element name="Forward"> <xs:complexType> <xs:sequence> <xs:element name="Avg_used_Bandwidth_kbps" type="xs:unsignedInt"/>

IRMOS IRMOS_WP7_D7_4_1_PU_ALUD_v1_0
Interactive Realtime Multimedia Applications on Service Oriented Infrastructures Created on 30/11/2009
D7.4.1 Initial version of Path supervision Architecture
© ALUD and other partners of the IRMOS consortium 2008‐2009 page 54/57
<xs:element name="Avg_Delay_msec" type="xs:unsignedInt"/> <xs:element name="Avg_Jitter_msec" type="xs:unsignedInt" minOccurs="0"/> </xs:sequence> </xs:complexType> </xs:element> <xs:element name="Backward"> <xs:complexType> <xs:sequence> <xs:element name="Avg_used_Bandwidth_kbps" type="xs:unsignedInt"/> <xs:element name="Avg_Delay_msec" type="xs:unsignedInt"/> <xs:element name="Avg_Jitter_msec" type="xs:unsignedInt" minOccurs="0"/> </xs:sequence> </xs:complexType> </xs:element> </xs:sequence> </xs:complexType> </xs:element> <xs:element name="SC_report" minOccurs="0" maxOccurs="unbounded"> <xs:complexType> <xs:sequence> <xs:element name="OWL_vertex_individual_ID" type="xs:string"/> <xs:choice> <xs:element name="EE"> <xs:complexType> <xs:sequence> <xs:element name="CPU_load"> <xs:simpleType> <xs:restriction base="xs:decimal"> <xs:minInclusive value="0"/> <xs:maxInclusive value="100"/> </xs:restriction> </xs:simpleType> </xs:element> <xs:element name="Phys_RAM"> <xs:simpleType> <xs:restriction base="xs:decimal"> <xs:minInclusive value="0"/> <xs:maxInclusive value="100"/> </xs:restriction> </xs:simpleType> </xs:element> <xs:element name="Used_volatile_storage"> <xs:simpleType> <xs:restriction base="xs:decimal"> <xs:minInclusive value="0"/> <xs:maxInclusive value="100"/> </xs:restriction> </xs:simpleType> </xs:element> </xs:sequence> </xs:complexType> </xs:element> <xs:element name="LTS"> <xs:complexType> <xs:sequence> <xs:element name="Used_LTS_storage"> <xs:simpleType> <xs:restriction base="xs:decimal"> <xs:minInclusive value="0"/> <xs:maxInclusive value="100"/> </xs:restriction> </xs:simpleType> </xs:element> <xs:any namespace="##other" minOccurs="0"/> </xs:sequence> </xs:complexType> </xs:element> </xs:choice> </xs:sequence> </xs:complexType> </xs:element> </xs:sequence> </xs:complexType> </xs:element>

IRMOS IRMOS_WP7_D7_4_1_PU_ALUD_v1_0
Interactive Realtime Multimedia Applications on Service Oriented Infrastructures Created on 30/11/2009
D7.4.1 Initial version of Path supervision Architecture
© ALUD and other partners of the IRMOS consortium 2008‐2009 page 55/57
</xs:sequence> </xs:complexType> </xs:element> </xs:schema>
A.2. Dust busting example As an example the following monitoring example has been generated based on a dust usting scenario generated during IRMOS project.
?xml version="1.0" encoding="UTF-8"?> >
b <<!-- edited Alcatel-Lucent (T. Voith)--<!-- one monitoring 1sec report--> <ISONI_Domain_Monitoring_Report xmlns="http://irmos.rus.uni-stuttgart.de/Monitoring"
N_Individual_ID>
mos.rus.uni-OWL_edge_individual_ID>
Bandwidth_kbps>65879</Avg_used_Bandwidth_kbps>
ndividual_ID>http://irmos.rus.uni-L_edge_individual_ID>
Bandwidth_kbps>45246</Avg_used_Bandwidth_kbps>
dividual_ID>http://irmos.rus.uni-ge_individual_ID>
Bandwidth_kbps>46987</Avg_used_Bandwidth_kbps>
ndividual_ID>http://irmos.rus.uni-_individual_ID>
xmlns:xsi="http://www.w3.org/2001/XMLSchema-instance" xsi:schemaLocation="http://irmos.rus.uni-stuttgart.de/Monitoring Isoni_monitoring_report.xsd"> <T-SLA_reference>T-SLA reference</T-SLA_reference> <OWL_VSN_Individual_ID>http://irmos.rus.uni-
</OWL_VSstuttgart.de/DustBustingVSN.owl#DustBustingVSN <Date>2009-07-13</Date>
imeGranularity_sec> <TimeGranularity_sec>1</T <ReportIntervall>
00.0Z</Timestamp> <Timestamp>14:20: <VL_report>
ndividual_ID>http://ir <OWL_edge_istuttgart.de/DustBustingVSN.owl#Controller2Gateway</ <Forward>
_Bandwidth_kbps>24798</Avg_used_Bandwidth_kbps> <Avg_used <Avg_Delay_msec>12</Avg_Delay_msec> </Forward> <Backward> <Avg_used_ <Avg_Delay_msec>15</Avg_Delay_msec> </Backward> </VL_report> <VL_report> <OWL_edge_istuttgart.de/DustBustingVSN.owl#Controller2Video</OW <Forward>
_Bandwidth_kbps>45678</Avg_used_Bandwidth_kbps> <Avg_used <Avg_Delay_msec>15</Avg_Delay_msec> </Forward> <Backward> <Avg_used_ <Avg_Delay_msec>20</Avg_Delay_msec> </Backward> </VL_report> <VL_report>
in <OWL_edge_stuttgart.de/DustBustingVSN.owl#Dust2Storage</OWL_ed <Forward>
d_Bandwidth_kbps>35678</Avg_used_Bandwidth_kbps> <Avg_use <Avg_Delay_msec>24</Avg_Delay_msec> </Forward> <Backward> <Avg_used_ <Avg_Delay_msec>26</Avg_Delay_msec> </Backward> </VL_report> <VL_report> <OWL_edge_istuttgart.de/DustBustingVSN.owl#Dust2Video</OWL_edge <Forward>
_Bandwidth_kbps>35879</Avg_used_Bandwidth_kbps> <Avg_used <Avg_Delay_msec>26</Avg_Delay_msec>

IRMOS IRMOS_WP7_D7_4_1_PU_ALUD_v1_0
Interactive Realtime Multimedia Applications on Service Oriented Infrastructures Created on 30/11/2009
D7.4.1 Initial version of Path supervision Architecture
© ALUD and other partners of the IRMOS consortium 2008‐2009 page 56/57
ndividual_ID>http://irmos.rus.uni-OWL_edge_individual_ID>
Bandwidth_kbps>6523</Avg_used_Bandwidth_kbps>
ndividual_ID>http://irmos.rus.uni-L_edge_individual_ID>
</Forward> <Backward> <Avg_used_Bandwidth_kbps>3467</Avg_used_Bandwidth_kbps> <Avg_Delay_msec>30</Avg_Delay_msec> </Backward> </VL_report> <VL_report> <OWL_edge_istuttgart.de/DustBustingVSN.owl#Gateway2Controller</ <Forward> <Avg_used_Bandwidth_kbps>35467</Avg_used_Bandwidth_kbps> <Avg_Delay_msec>45</Avg_Delay_msec> </Forward> <Backward> <Avg_used_Bandwidth_kbps>56342</Avg_used_Bandwidth_kbps> <Avg_Delay_msec>47</Avg_Delay_msec> </Backward> </VL_report> <VL_report> <OWL_edge_individual_ID>http://irmos.rus.uni-stuttgart.de/DustBustingVSN.owl#Gateway2Video</OWL_edge_individual_ID> <Forward>
_Bandwidth_kbps>25768</Avg_used_Bandwidth_kbps> <Avg_used <Avg_Delay_msec>21</Avg_Delay_msec> </Forward> <Backward> <Avg_used_Bandwidth_kbps>645</Avg_used_Bandwidth_kbps> <Avg_Delay_msec>23</Avg_Delay_msec> </Backward> </VL_report> <VL_report> <OWL_edge_individual_ID>http://irmos.rus.uni-stuttgart.de/DustBustingVSN.owl#Storage2Dust</OWL_edge_individual_ID> <Forward> <Avg_used_Bandwidth_kbps>34789</Avg_used_Bandwidth_kbps> <Avg_Delay_msec>23</Avg_Delay_msec> </Forward> <Backward> <Avg_used_ <Avg_Delay_msec>23</Avg_Delay_msec> </Backward> </VL_report> <VL_report> <OWL_edge_individual_ID>http://irmos.rus.uni-stuttgart.de/DustBustingVSN.owl#Video2Buster</OWL_edge_individual_ID> <Forward> <Avg_used_Bandwidth_kbps>98756</Avg_used_Bandwidth_kbps> <Avg_Delay_msec>25</Avg_Delay_msec> </Forward> <Backward> <Avg_used_Bandwidth_kbps>76345</Avg_used_Bandwidth_kbps> <Avg_Delay_msec>26</Avg_Delay_msec> </Backward> </VL_report> <VL_report> <OWL_edge_istuttgart.de/DustBustingVSN.owl#Video2Controller</OW <Forward> <Avg_used_Bandwidth_kbps>2367</Avg_used_Bandwidth_kbps> <Avg_Delay_msec>32</Avg_Delay_msec> </Forward> <Backward> <Avg_used_Bandwidth_kbps>465</Avg_used_Bandwidth_kbps> <Avg_Delay_msec>34</Avg_Delay_msec> </Backward> </VL_report> <VL_report> <OWL_edge_individual_ID>http://irmos.rus.uni-stuttgart.de/DustBustingVSN.owl#Video2Gateway</OWL_edge_individual_ID> <Forward>
_Bandwidth_kbps>98678</Avg_used_Bandwidth_kbps> <Avg_used <Avg_Delay_msec>24</Avg_Delay_msec> </Forward> <Backward>

IRMOS IRMOS_WP7_D7_4_1_PU_ALUD_v1_0
Interactive Realtime Multimedia Applications on Service Oriented Infrastructures Created on 30/11/2009
D7.4.1 Initial version of Path supervision Architecture
© ALUD and other partners of the IRMOS consortium 2008‐2009 page 57/57
_individual_ID>http://irmos.rus.uni-/OWL_vertex_individual_ID>
_individual_ID>http://irmos.rus.uni-rtex_individual_ID>
l> ing_Report>
<Avg_used_Bandwidth_kbps>87345</Avg_used_Bandwidth_kbps> <Avg_Delay_msec>26</Avg_Delay_msec> </Backward> </VL_report> <SC_report> <OWL_vertexstuttgart.de/DustBustingVSN.owl#ApplicationController< <EE>
_load>57</CPU_load> <CPU <Phys_RAM>100</Phys_RAM> <Used_volatile_storage>25</Used_volatile_storage> </EE> </SC_report> <SC_report> <OWL_vertex_individual_ID>http://irmos.rus.uni-stuttgart.de/DustBustingVSN.owl#DustBuster</OWL_vertex_individual_ID> <EE> <CPU_load>62</CPU_load> <Phys_RAM>100</Phys_RAM> <Used_volatile_storage>75</Used_volatile_storage> </EE>
rt> </SC_repo <SC_report> <OWL_vertexstuttgart.de/DustBustingVSN.owl#VideoIngestion</OWL_ve <EE> <CPU_load>88</CPU_load> <Phys_RAM>100</Phys_RAM> <Used_volatile_storage>66</Used_volatile_storage> </EE> </SC_report> <SC_report> <OWL_vertex_individual_ID>http://irmos.rus.uni-stuttgart.de/DustBustingVSN.owl#LongTermStorage</OWL_vertex_individual_ID> <LTS> <Used_LTS_storage>35</Used_LTS_storage> </LTS>
t> </SC_repor < </ReportInterval/ISONI_Domain_Monitor