Embed Size (px)
Citation preview

Studies on the Protein Content
of cowls milk.
By
E. Azarme,
lam. Agr. ( Ecole Nationale dT Agriculture, Grignon , France )
Dairy Chem. ( Institut National Agronomique, Paris , France )
Being a Thesis submitted for the Degree of Doctor of
Philosophy to the University of Edinburgh,
Iíarch,193R.
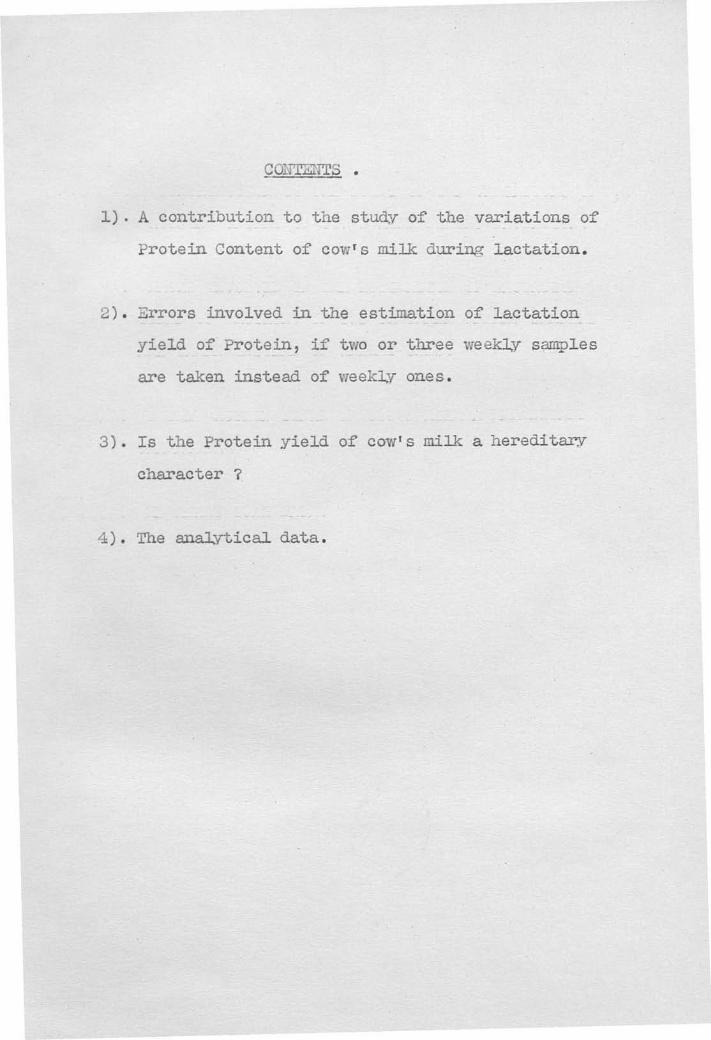
CON'l'iliITS .
1). A contribution to the study of the variations of
Protein Content of cow's milk during lactation.
2). Errors involved in the estimation of lactation
yield of Protein, if two or three weekly samples
are taken instead of weekly ones.
3). Is the Protein yield of cow's milk a hereditary
character ?
4). The analytical data.

A CONTRIBUTION TO THE STUDY OF TEE VARIATIONS
OF PROTEIN CONTENT OF COW'S MILK DURING LACTATION.
by
E. Azarme,
Institute of Animal Genetics,
University of Edinburgh.
000

Contents.
raze
Introduction 1
Animals
Methods á
Determination of Total Protein iitrozen 3
Determination of Casein Nitrogen 7
Determination of Albumin and Globulin nitrogen .. 8
Errors 3
Analysis and interpretation of the data 9
Total Protein Nitrozen 13
Casein Nitrogen 29
Albumin and Globulin Nitrogen 32
Discussions
summary û References 43
Appendix

Introduction.
The object of this investigation réas to study
the genetical aspect of the protein, and particularly' 1
the casein, content of the milk of dairy cattle.
Unless the whole lactation period be studied, it is
not possible to obtain an accurate figure for the
lactation yield. Since genetical research demands
the analysis of the yields of a large number of ani-
mals, and since the method of analysing the content
of the milk in respect of protein and casein is com-
plicated and time consuming, it was obvious, at the
outset, that detailed information was required on the
variation of the content of the milk in these respects]
according to the stage of lactation. In other words,
an answer was required to the question "How frequent-
ly during the lactation period is it necessary to
measure the protein and casein content of the milk
of a cow in order to obtain a reasonably accurate
figure for the lactation yield of that cow ?" To
answer this question detailed information was re-
quired/

-2-
quired concerning the week to ~week variation in the
lactation period. Two possible methods of doing
this appeared to be:-
(1) To analyse regularly at short intervals the
milk of several cors from the beginnir until the
end of their lactations and from the figures obtained
deduce the general trend and the extent of these
variations for the whole lactation time.
(2) To take a greater number of cors at differen
stages of lactation and analyse their milk at short
intervals during a fer: months only. Several co :s
bein` under examination at the same time for any
stage of lactation, the analysis of the figures
obtained would enable us to explore step by step
the w Ile lactation curve with regard to the varia-
tions in question.
The second method curtailed the time required
for the whole experiment and was adopted.
ANIIÂAIS
Twenty -seven cows were selected from the experi-
mental farms of the Instiute, where the animals are
kept under standard cdnditions. The s:-stem of
rationing is kept constant and the ,uantit- of the
feeding depends only u ̂ on the yields of the co,:s.
Differences in the composition of tLe :1u l :: ay
therefore be attributed to ase, stage of lactation,
and/

-ú-
and the individuality of the cow.
The particulars of these cows Which may be of
interest her:)
Table 1 _
1 oit in Table 1. Tabl
r vl Ji11
17
Zc
-cJ
Breed
Ferio. o lactation in Which the cow was under examination,
3eef/Dairy Shorthorn
eef Shorthorn
.,,yrshire
.yrshire
Shorthorn /Ayrshi
ecf Shorthorn
-ersey
Tersey
eef/Dairy Shortho_
k -rthorn /Àyrshire
fshire -)airy /Shorthorn
7airy /Beef Shorthor
tirshire 7riry/Beef Shorthor
frshire
' yrshire
%,yrshire
' yrshire
" yrshire
50
44
lst-llth week
lst-12 th
ist-llth
lst-14th
3rd-13th
3rd-lth
5th-71st
5th-21st
3th-22nd
3th-18th
:L1th-27th
7_7-".1-31st
1iJ lril-31st
30th-36th
20th-36th
21st-39th (dried off:
21st-37th
22nd-3Sth u
22nd-alth
23rd-30th rt

Table 1 (contd.)
25
Breed
lyrshire
.rrshire
Jersey
,eef Shorthorn
.yrshire
Ayrshire
eyrshire
Age in
mths.
40
75
33
3L
100
74
75
Period of lactatioñ in which the cow was under examination.
24th -40th week
25th -41st
21st -42nd 't (dried off)
40th -41st
40th -52nd
40th -51st " (dried off)
44th -40th " (dried off)
Within the periods given in this table the milk
of each cow was regularly analysed at intervals of
seven days. Occasionally, due to unavoidable circum
stances, this interval vac eight or nine days. The
work was carried on for the :1a.jority of the cows dur
eighteen weeks. This period was shorter for some of
them either because they dried off before the end of
the work, or they had not yet calved when it was
started, etc.
MEMOS.
SALIPLMTG. All the usual precautions were taken
in the collection of the samples, i.e.: -
(1) The bottles were clean and dry,
(2) The whole yield (including the strippings)
was well mixed just before sampling.
(3)/

t`
Before Sampling make certain - 1. The Bottles are CLEAN and DRY. 2. The whole yield including the
Strippings, is WELL MIXED just before Sampling.
Name of Cow
Date Morning yield in Lbs Evening yield in Lbs

-5-
(3) Each bottle was carefully labelled.
To facilitate this work and avoid errors,
special labels with these directions were printed for
the sample bottles, the words clean, dry and well
mixed bein printed in large capital letters.
The cows on the experimental farms are usually
milked twice daily at an interval of t ;.elve hours.
Variation in the interval rarely amounts to more
than 15 minutes . A few of the high yielding c ow s
are, for a portion of their lactation, milked three
times a day at eight -hour intervals. The amount of
milk collected from each cow was weighed to the near-
est auarter of a pound and samples taken from each
milking of each cow were placed in a refrigerator, and
sent on the following morning to the Institute.
In the laboratory representative samples for twenty -
four hours of each cow were then obtained by mixing
appropriate quantities of milk from each bottle.
CHEMICAL ANALYSIS. The total protein nitrogen
was determined by precipitation by trichloracetic
acid and a Kjeldahl digestion, as described by
Sanders (1).
In order to test the reliability of the methods
of determining casein, results obtained by the volu-
metric (Van Slyke) (2), colorimetric (Leroy) (3) and
official methods were compared. The first two,
though invaluable for practical purposes and cheese-
making/

-ó-
making on account of their rapidity, did not seem to
be accurate enough for this investigation. The
official method was therefore adopted with the improv.
;rent recently introduced by Líoir (4) , where the casein
is precipitated at its iso- electric point by the use
of a buffer so .ution of acetic acid and sodium ace-
tate.
From the well -mixed sample prepared as above,
ten ml. were pipetted into a tared weighing bottle
and weighed to the nearest centigram. Two other
ten ml. portions were pipetted into covered beakers.
The weight of the milk in the weighing bottle was
taken to be the same as that of the milk pipetted
into the beakers. This is generally true,
slight differences may be observed when the sample is
very cream and particles of the cream stic against
the side of the pipette. This point has been taken
into consideration when determining the standard
error.
DETE iINATION OF TOTAL PROTEIN NITROGEN. Ten
ml. of a 2.43N (approximately 10;x) tr ichlorac eti c
acid solution were added to one of the beakers
mentioned above; the protein was completely pre-
cipitated at once, and filtered through a 12.5 cm.
No. 12 Whatman filter paper. The Biuret test was
tried in the filtrate and negative results were al-
ways obtained. In order to remove the part of the
precipitate/
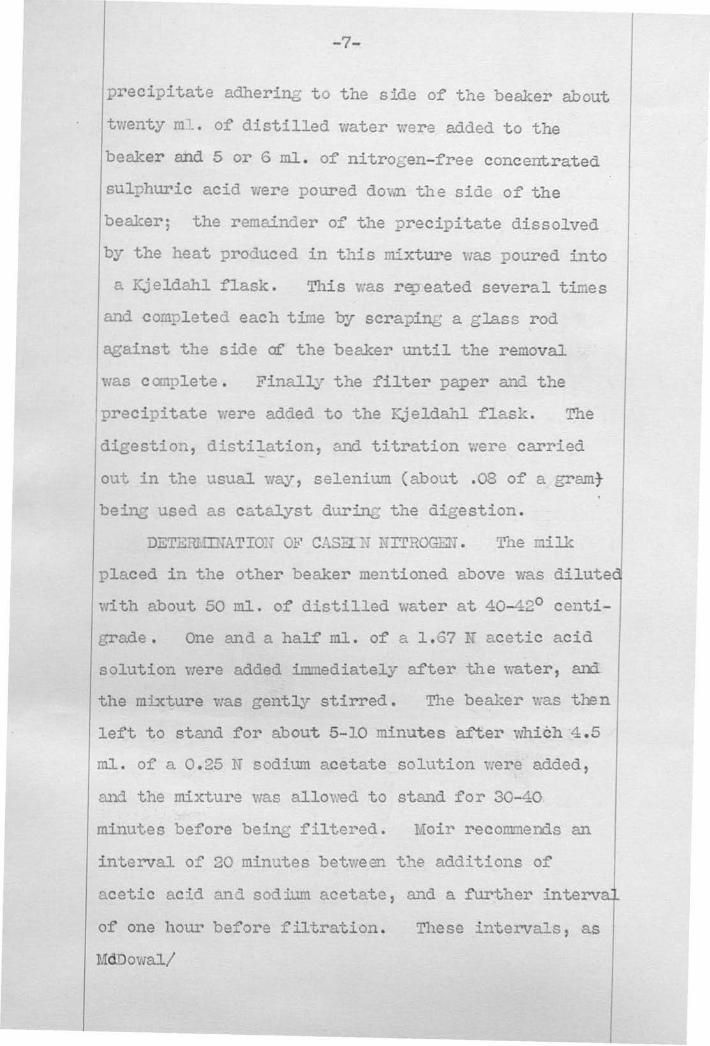
-7-
precipitate adhering to the side of the beaker about
twenty m:? . of distilled water were added to the
beaker and 5 or 6 ml. of nitrogen -free concentrated
sulphuric acid were poured down the side of the
beaker; the remainder of the precipitate dissolved
by the heat produced in this mixture was poured into
a Kjeldahl flask. This was repeated several times
and completed each time by scraping a glass rod
against the side of the beaker until the removal
was complete. Finally the filter paper and the
precipitate were added to the Kjeldahl flask. The
digestion, distilation, and titration were carried
out in the usual way, selenium (about .08 of a gram}
being used as catalyst during the digestion.
DETERItrn ATIO:T OF CASE< N NITROGEN . The milk
placed in the other beaker mentioned above was diluted
with about 50 ml. of distilled water at 40-42° centi-
grade . One and a half ml. of a 1.67 N acetic acid
solution were added immediately after the water, and
the mixture was gently stirred. The beaker was then
left to stand for about 5 -10 minutes after which 4.5
m1. of a 0.25 N sodium acetate solution were added,
and the mixture was allowed to stand for 30-40
minutes before being filtered. Moir recommends an
interval of 20 minutes between the additions of
acetic acid and sodium acetate, and a further interval
of one hour before filtration. These intervals, as
MdDowal/

-8-
McDowal and McDowelle have pointed out "seem
unnecessarily long, as neither the final PHI nor
the casein result is affected by adopting much
shorter intervals 5 and 15 minutes respective-
ly." (5) After the precipitate had settled, it
was washed three times by decantation and trans-
ferred to the filter -paper by two further washings.
The rest of the experiment was carried out as for
the total protein.
DETEi .ïl ì íAT IOY OF ALBUM N+GLOBULIN NITROGEN'.
This was done for each sample by subtracting the
casein nitrogen from the total protein nitrogen.
Blank experiments ware carried out from time
to time and the proper correction applied to the
results.
ERRORS. None of these determinations was made
in duplicate. The systematic errors were reduced
to a minimum by always using the same pipette,
starting each measurement with burettes at the same
graduation mark, using the same quantities of
indicator, and so on. But even so, no reliable
information could be drawn from the figures obtaine
if we had not an exact idea of the magnitude of
these errors. This was determined by analyses
carried out on a sample of milk, from cow No. 3,
a Jersey cow whose milk was generally very creamy
and/

r^.
and left particles on the side of the pipette.
ten determinations of the total protein nitrogen,
and ten determinations of the casein nitrogen were
carried out on this sample; the albimín +globulin
nitrogen was calculated each time by difference.
The mean and the standard error of the results
obtained are set out below for each case : -
Itean of ten determinations made on the same sample.
Standard error.
Total protein nitrogen 0.5921 ± 0.0043
Casein nitrogen 0.4783 0.0047
Albamin +globulin nitrogen 0.1133 ± 0.0056
Thus the standard error for casein nitrogen is
higher than for total protein nitrogen. In tie case
of A.+ G.N. the standard error was also determined
theoretically by using the formulae
d A + G =16p2 + óc2
and the result ± 0.0064 was close to the figure
given above.
For a less creamy sample which would leave the
pipette clearer these errors would probably be
smaller.
ANALYSIS AND INTERPRETATION OF T.rsiE DATA.
The statistical analysis of the figures was
made by "methode des couples" (3) or the method of
"pairing " /

-10-
"pair" This method has been used in many
fields of biological investigations, but as far as
the writer knows, it has not been used for the study
of variations of the kind under examination. Its
application to these data was considered not only
legitimate, but as being the best means of securing
reliable information from such a small number of
observations.
All it was hoped to get from these data was
the answer to the uestion: Does the protein -
content of milk vary during the lactation period,
and if so, how ?
A positive answer to the first part of the
question was obtained from the examination
of the figures of individual cows, as the variations
observed in the milk of some of teem were sometides
far beyond the limits ± 2d which could be ascribed
to the systematic errors of the experiment.
To get the answer to the second part of the
question was somewhat more difficult and much more
laborious. The differences observed in the compo-
sition of the milk of the cows under examination
could be ascribed as mentioned above, to the inter-
action of the breed, age, stage of lactation,
heredity, individuality of the cow, and probably
to some other unknown causes. By the use of the
method/

method known as "factorial arrangement" by modern
statisticians, and the analysis of the arrangement
obtained, it is possible, though not always easy,
to deduce the way in which each single factor inter-
acts with the others, in other words to find what
would be the influence of one definite factor if all
the others were eliminated. Hence to study the
influence of lactation -factor, with which this paper
is concerned, we classified our data according to the
weeks of lactation as shown in tables 2, 3, and 4;
and the method of "pairing" was applied to this
arrant,ement.
Owing to the fact that the length of lactations`
is different for different cars, and that only data
for parts of lactation were available, the "factori-
al arrangement" was carried out separately for the
first thirty and the last sixteen weeks of lactation.

TAMER
14:illigrama of total protein nitrogen in 100 grams of milk
.:eeke in lactation ;eeka before the end of lactation
0Dw
1 2 3 4 5 6 7 8 9 10 11 12 13 14 15 16 17 18 19 20 21 22 23 24 25 26 27 28 29 30 16 15 14 13 12 11 10 9 8 7 6 5 4 3 2 1
Cow No.1 612 486 42? 421 42? 459 436 464 471 463
2 592 512 437 433 409 405 422 442 482 453 470 457 3 672 563 480 465 410 426 435 468 460 523 510 4 580 476 453 440 420 430 408 440 464 460 462 451 462 5 455 425 442 420 450 404 433 503 451 464 452 6 475 445 488 476 471 477 482 480 461 468 482 491 509 528 514 52? 506 ..
7 487 493 484 478 457 460 469 462 469 455 484 505 498 552 550 555 570 8 549 517 489 531 546 52? 572 530 481 511 484 496 519 521 543 539 9 425 431 432 448 448 447 441 452 467 463 442 452 476 503 509 504
10 496 45'2 424 436 448 449 453 509 460 492 494 11 535 415 417 450 431 452 446 430 445 440 418 449 445 489 467 468 481 12 47U 484 508 526 499 514 532 510 486 508 502 492 537 547 525 535 13 493 477 500 492 513 472 493 482 45? 460 513 504 500 536 14 .. 556 679 585 607 589 608 595 590 582 516 545 409 405 422 442 482 453 470 457 2 15 16
17
503 498 483 516
465 540 523
492 54? 540
480 498 537
466 504 514
500 496 508
468 489 524
495 480 505
496 473 509
489
500 469
436 532
421 448 510
427
449
486
459
453
508
436
509
502
464
460
492
471
492
537
463
494
547 525 535 542
1
10 12
18 19 ...
462 651
443 545
571 558
448 545
460
555
459
555 475 542
443
548
438
543 441
537
452 514
467
508
463
524
442 505
452
509
476
469 500
503
507
509
516
504
509 531 528 9
17 20 525 513 517 554 538 534 527 522 526 562 540 483 507 496 506 50) 526 551 537 499 24 21 487 552 484 518 511 495 493 477 500 492 513 472 493 482 457 460 513 504 500 536 13 22 573 480 551 608 572 644 457 486 480 467 515 530 541 584 571 573 561 25
627 628 626 540 644 601 630 647 637 654 652 655 23
644.614 661 26
511 634 27

Table
w1lli.grams of casein nitrogen in 100 grame of :silk.
Weeks in lactation Weeks before the end of lactation
1 2 3 4 5 6 7 8 9 10 11 12 13 14 15 16 17 18 19 20 21 22 23 24 25 26 27 28 29 3C lE :.4 13 12 11 10 9 8 7 6 5 4 3 2 1 Jo* Dow No. 1 452 392 346 319 324 338 367 345 374 362 351 No. 2 469 409 354 341 309 318 336 352 388 359 365 341
3 569 474 394 384 368 373 365 403 384 431 429 4 486 388 386 370 362 337 383 403 4014 380 394 5 391 357 372 359 373 334 369 400 380 368 6 400 394 388 385 398 393 399 404 397 390 403 405 42? 440.418 431 7 391 409 410 386 354 381 318 388 382 347 392 386 407 458 44? 456 467 8 406 416 416 425 427 445 428 435 441 396 471 43G 409 420 440 437 446 9 343 336 340 348 353 346 336 343 345 359 321 341 370 375 38? 354
10 366 364 346 336 356 361 358 414 358 411 406 11 429 344 353 351 356 377 356 36? 355 350 325 353 348 464 372 36? 12 393 404 418 426 413 443 414 405 412 403 390 442 454 430... 13 412 415 359 422 406 413 426 383 409 399 385 394 416 409 409 41? 14 488 473 483 481 488 505 493 477 478 451 309 318 336 352 388 359 365 341 2 15 393 399 402 400 378 385 392 372 392 392 356 319 324 338 367 345 374 362 351 1 16 399 395 344 40? 413 388 404 402 380 409 336 356 361 358 414 358 441 406 10 17 419 423 470 442 416 424 439 381 418 380 443 414 405 412 403 390 442 454 430 12 18 396 362 382 376 403 394 369 366 360 336 343 345 359 321 341 370 375 387 354 9 19 X73 418 434 424 424 426 425 430 415 442 416 424 439 381 418 380 394 411 398 387 406 418 17 20
. 440 416 432 441 431 438 436 423 404 448 427 405 418 388 398 389 414 423 387 357.... 24 21 418 461 430 446 436 434 412 415 359 422 406 413 426 383 409 399 385 394 416 409 409 417 13 22 501 474 479 528 444 524 334 381 362 340 378 394 405 402 391 407 403 25
524 516 524 481 507 501 530 538 519 530 537 548 23
517 519 542 26
356 458 27

TAK,E 4
Mi11i4cams of albumin and r._lobulin nitroi-en in 100 vrwme of milk
Weeks in lactation ;seeks before the end of lactation
1 2 3 4 5 6 7 8 9 10 11 12 13 14 15 18 17 18 19 2U 21 22 23 ..4 25 2u 27 29 30 16 15 14 13 12 11 1C 9 8 7 6 5 _ 3 2 1
Coe w ;30 .1 16U 94 81 97 89 9 2 A. 89 108 111 Io I.
2 123 102 83 92 100 87 86 90 94 93 105 117
3 102 90 86 81 72 54 70 65 76 91 81
4 94 87 ö8 70 58 71 81 57 58 71 úts
5 63 68 70 til 76 70 64 103 84 85... ,
6 75 5110C 91 73 84 82 76 64 78 8t) 86 82 88 96 96
7 97 84 74 92 102 79 150 74 88 168 92 119 91 94 103 99 104
8 . 144 101 73 105 1U1 99 92 89 84 40 55 88 99 81 106 93 102. 9 81 95 92 101 95 101 105 108 122 104 120 110 106 128 122 150
10 130 87 77 101 91 88 95 94 102 82 88
11 ... 106 71 63 99 75 75 90 63 90 90 93 96 97 25 96 113 12 76 81 90 100 86 89 96 82 96 99 102 95 93 95
13 ... 81 118 78 86 86 90 84 84 72 66 97 96 91 119 14 68 87 102 126 101 103 102 113 38 94 100 8? 86 90 94 93 105 117 2
15 ..... ... 110 99 62 92 102 81 ltr8 95 103 104 133 9? 89 92 91 69 1G8 111 1
16 84 145 200 90 91 108 85 78 93 91 101 91 88 95 94 102 82 88 10
17 97 100 70 95 98 84 85 123 92 89 89 96 82 96 99 1U2 95 93 95 12
18 ..... 67 81 189 72 56 65 105 7? 78 105 108 122 1()4 lá) 110 106 128 122 150 9
19 77 127 124 121 131 129 117 118 128 95 98 84 85 123 92 89 106 96 117 121 110 17
20 85 97 85 113 107 96 91 100 122 114 114 79 88 108 108 111 112 126 149 141 24
21 68 91 54 ? 2 75 61 81 118 78 86 86 90 84 84 72 66 97 96 91 119 13
22 72 6 ? 2 128 120 122 105 118 127 137 136 135 182 181 166 158 25
103 112 102 60 136 1.00 100 109 117 124 115 107 23
126 96 119 26
155 176 27

In each of the abov3 tables the fi -ures corresponding
to any week of lactation (vertical columns) were
compared with those of the week immediately preceding
as follows:
A "couple" or a "pair of figures" being defined
here as two figures obtained from the milk of the
same c= in two consecutive weeks, ever;; figure in
one column which could not be paired with a figure of
the adjoining column was discarded from the compGrlso..
Then each figure of the column ri 2T
as subtracted
from the corres -)onding figure of tìß column IT and the
following statistics were determined:
The mean of the differences obtained,
The variance of these differences,
The variance of the mean of these differences,
The standard error of the mean of these differ
onces, and the value:
mean standard error of the mean
which was used to test the significance of the
result by the "Student " "s table (7).
The two examples given below illustrate the
dot-11- of the method.
Ex-: -,le 1. Con arison of the tenth v th the
eleventh we:,k of lactation regardirg the total pro-
tein content of milk (See table 2).
Cow No./

-16-
Cotg Pío. 10th week 11th week d
+
d 71
.: ( ^ +:J,
53 =!C' -17 ZAJ
ú vú3 510 +13 lv n¡
'IX v . -..7..r, - 2 -_
5 451 +52 27C4
v 430 401 +10 301
; _3C 430 - 9 31
3 543 527 +10 331
:i ysa , . ! + 1
1C 424 53 -12 144
11
Totals
Lie ans
r_ ^_. 5 (discsrded)
T717- :0 4173
+ 72
L30.3 +n.G 417.3
Variance of the differences = md2 -(md) 2 = 17.3 -51.
335.95. Variance of the mean of the differences
365.06 = 40.66. Standard error of the, mean of the
- i+ n - n r1 . n 1 n differences - TO.JJ - 3.373. t - 1.13. In 3.373
consulting the "Student"'s table we will see that for
n = 9 (n is the number of degrees of freedom or the
number of independ3nt comparisons) and t = 1.13, r
(the probability of falling outside t t) is between
.3 and .2 and consequently the differe: e observed
bet. een the means of the two weeks is not significant
since/

-17-
since the statisticians do not recognize as signifi-
cant any difference for t.hich P is greater than .05.
Differences of this kind are considered to be due to
random sampling.
Example 2. Comparison of the third with the
fourth week of lactation regarding the casein content
of milk (See table 3).
Cow Nb. 3rd 1r;eeIç 4t11 1 ;e d
1 346 319 +27 729
2 354 341 +13 139
3 394 384 +10 100
4 386 370 +16 256
5 391 357 +34 1153
6 400 394 + 6 36
Totals 2271 2165 +106 2446
Mb ans 378.5 360.3 + 17.3 407.36
Variance of the differences 07.9
Variance of the mean of the differences 19.58
Standard error of the mean of the differences 4.4
t A
number of degrees of freedom. 5
P ..smaller than .02
and consequently the di ference observed between the
means of the two weeks is highly significant.
This arithmetical procedure was carried out for
each of the above tables, with the following results:

A) Total Protein nitro-en.
(1) A regular silá highly significant de-
crease in the r of T.P.U. was observed from the
beginnir until the fourth reek of lactation.
(2) From the fourth we e ti towards the end
of lactation the mean differe_ices of the t,::a co- se-
cutive weo:-.S ;:ere ç omoti..c o metimes
' o ativo . Ttsted by V,ie "S': - _t ' r
.ere or :oro not s,nif cent, in such a way as one
could not drag, any legitimate cors lesion.
o_ -.:ere a re-ular trend fouit
week but one which was Loo ue readily
detected ti;ith the number of degrees of freedom
present ana ;,i th of consocutoiv_
valued, it --1if.t nevertheless lo-
it tl 11 .' Ç f or o v yo_ w
second
Ll:
r
? " n 7r n 'ln. v .". ^ 'v±! C. -1-1"".".,! "11`
Could necessarily be cumulative. The adoption of
this process led to the conclusion that there is a
small and regular increase in the .7 oreenta o of
T.P.N. from the fou th v'eo.: until the end of the
lactation, this increase be in,; more ronoune ed to-
yards the end of lactation.
Owi to the fact that "tests of significance,
in so far as they aro accurately carried out, are
bound to acree" (3) whatever process of statistical
analysis is emlployed, we attacked the noble from
mother/

another angle. The mean end the standard error of tige mean
standard
corresa
of each col,unn were computed; and ± double
error s taken as a critical ro e was w7 ..: wlr; i nd values being plotted on graph paper.
By this means, a "band" (i.e. the estimated 5 probability rat ge of tip means of columns) Iras ob-
tained for the vdiole lactation -tie . The traid of
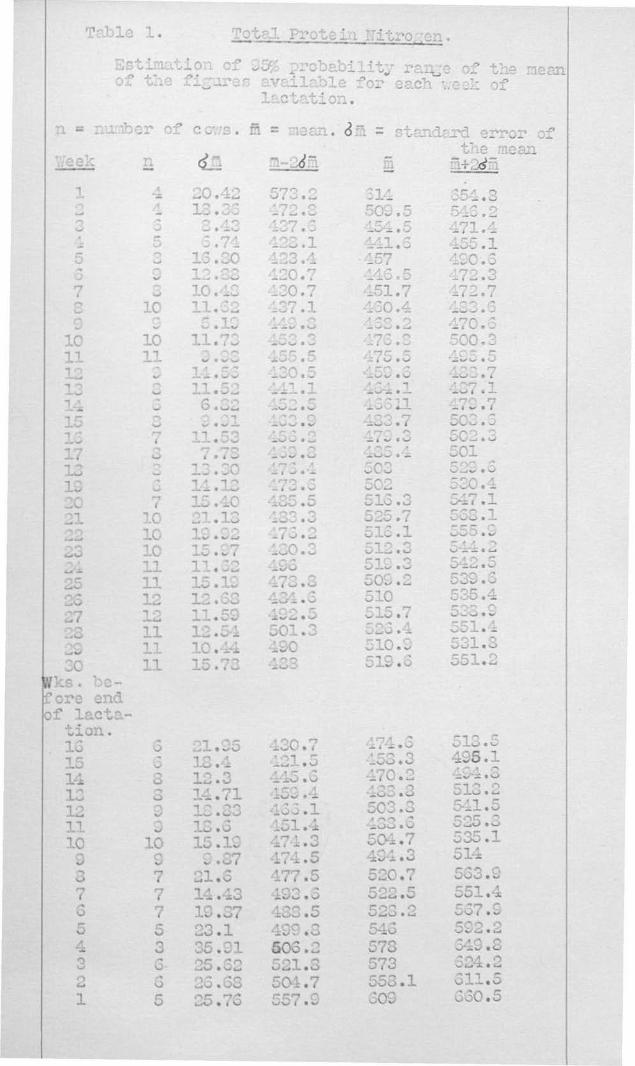
this "band" at different regions was in perfect agreement t': ith the above conclusion. Table I of the
appendix o story ins the number of entries, mean,
standard error of the mean, and the values m - 2d m
and n + 2d r for each column, and the "band" is shown
in Fi _ure 1.
. (3) In c ariig e lactation curves for the
percentage of total protein nitrogen and for the viel of milk we observed that the variations of the set o
curves were generally in opposite directions (Fig. 2).
This suggested that a study of the correlation betwee
the yield and the percentage of T.P.N. and also of th=
variations of the amount of total prote in nitrogen p.
duced during the lactation time would be war ti while.
The correlation coefficient between the yield
and the percentage of T.P.N. determined for 368
samp]e s of milk was:
r = -0.A54 ± 0.028 (1)
which is clearl;,r significant. Figure 3 shows the acorrespond.iii correlation
table/

660
650
640
630
.620
610
-600
590
580
570
-560
3 i50 .5',0
-530
7t1
520
510
C -500
400
480
470
400
450
440
430
-420
-410
400 1 2 1 4 5 6 7 8 9 0 II Q 13 N 15 18 17 18 19 20 21 22 23 24 25 26 27 2 8 29 30 16 15 N C i R 0 D 9 8' 6 5 4 3 _
Nola La Lac... Meta 1Tt i ald lactastaza
Fig. 1.
ShoWing the lactation curve for the ercenta_ _ of total protein nitrogen. Each dot represent:: the mean value of the figures available for the corresponding week of lactation. The "band" shows the limits of m ±pia, i.e. the estimated 05 2cr cent. nrobability rame of the mean values. The length of- lactation being different for .differ- ent cows, the lactation curve is studied in two sections correspondis; to the first thirt; and the last sixteen wechs of lactation.

tYY er TJJ.
't
Fig. 2.
Shoring lactation curves for the -field of milk (1) , _percentage (2) and the amount (3) of total protein nitrogen in 363 samples of milk taken from 27 individual cors at different stages of lactation. Ordinates of graphs (1) and (2)
relpresent the mean values of the figures for all samples taken in each reek of lactation. Ordi-
nates of graph (3) are obtained by multi-Dlyin the corresponding ordin tes of graphs (1) and C2).

-22-
table aid regression lines. In this table the mean,
the standard deviation* and the coefficient of varia-
tion are given for each variate.
The probable errors given in this table and all
others are computed from Karl Pearson's tables (9) .
It will be se ?n from this table:
(1) that the distribution is not normal for the
two variates.
C ) that if th? c c.n : is a -:Door -:-tilker, an in-
crease of one hound in yield of milk corresponds to
a relatively high decrease in the ti of i .P . . ,
whereas this decrease is much smaller if the co :: is
good milker.
The amount of total prote ln nitrogen pro: eac
case wa:s the '3ro uct of milk : field and the correspond
in,g % of T.P.N. The curve No. 3 (Figure 2) *rich
represents the variations of ths_e pro3ucts shows a
c oast -rt r. arr1 elism with the lactation curve for
the :dell in milk. This means that *.sri th . 7re ̂ ter
pro ctio.. f :._'L'_ there is a greater : red ,Ictia. of
proteins: ..nd tris i sait' 32 _,
:hen the roteins are expressed in terns of cr.
The result* of the stud,:- o2 ne c crrel ati o-: between
the yield and the amount of total -2rotei_i nitrogen
produced is in perf _c` v '.c- n
elusion. The correlation coefficient fo :: t`:c 333
samples of milk examined is:
r/

-n
IM . aw .Y .N at Yt !M Ja at f w at+ 4168 4411 ole sn .t.t t .t ,
.. +tt w wt a ao .tr .w .rat .. a. ut .,t wr
1r.o~ K to 141 i.etafa ofVel. á0wíaüs.a 11s tlt eel
Fi'. 3.
Showily; the correlation between the yield of milk ana the percentage of total protein nitrogen in 333 sangles of milk
taken fro:. 27 individual cows at different stages of lacta-
tion. The arrows indicate the direction in which each variate increases. The curve represents the regression line of the ^ercenta e of total protein nitrogen on the yield of m; lk. The curve represents the
re`res ion li n : of the yield of milk on the percentage of total protein nitrogen. The followin;_ statistics indicate
the details eoncernin,.: each variate: yield of mil] (l'ts.)
Me-11 35.35 0.3C Standard deviation 10.3 ± 0.37 Coefficient of van;_ ̂ tion '_3.3
± 1.33
0.302 * 0.0010 0.035 ± 0.0011 10.3 ± 0.3
Correlation coefficient r 0.0:C
r = 0..;C~ t 0.0CC
y, .L ..^. ver,- :.aîC.l l
71:2
'i' . _ __ t+ ri- l' ' ' a the of _ - - - la c :, .P.-1
0.051 X 10.00 0.207
4111.er!resor of tTh .--^our.t of o_ T. .. r yield: P
rrttl
{iv
0.051 50." X 10. ,,.ln --ris
_- " y " .
: .
_ . _ ., "...1.t th-r_!2 -- - _
.0 milli2rans i__ the amc;ü.t of total -protein
nitrogen.
Further e yllati o-- s,a;: s that _ r t_.n a?_Lo unt
of T.P.N. rises by o,s - ;11?`rm, -tare be an
increase of about 4.35 ïo;nds in the :'eld o.f -111k.
The fact that an increase in ;Lela of milk
means an increase in the amount of total ; r otei_-,,
c-ad also that an incre a se in the latter oo rrespon,s
to an increase in the yiald of milk, is of ÿ?:; sio-
loüical and economical importance. ?'t sl o;: s that
the synthesis of proteins in rlilk is not an inde-
pendent process, but is clo sel- related to the s;,n-
the sis of the milk itself. In other ords it %.oald
be impossible to ;et c ow s to pro d.ic ea %: ith a
These two regression lines are assumed to be linear This assumption is not very far from the truth for practical r urposes, for all the dots are placed within a narrow band.

-R -u -N
-
7.7.r.T.T.T.i.w.T.T.T.'.7 .r,i`.Y,T,i,Ë.i.7.1',1','.T,'. , i.i,T.i,i,T.T.i,',
.n.ut of ',slat }stia a,Vqao(,a.6ç.:av ^m aac,
¿1..' . . .
Srio,.i.n; ti e correlation b c . Ji s l _ 2 2 7211::
iand n Y_ -
of total nitrogen in v+L sa. :,:les ^2 _il'_ JW. +_ t -
co.: s at different stages °_ti,. s of The indicate ti-.e 3irsction i,2 1':hic_l eac_-i variate i__ :. eases ne curve ro,.resents the regression _f on the-7-77-of total -rotei n nitrogen. The ai 7 -r =
sents the regression line of the yield of total n_ t, e,;en on the ;,-iel.1 of These two carves are not linear:: .,. Ln the section indicated on the graph they are very- near to straight line and 'n?;,r be as2..ned to be so for -2ra.ctical plar2osns.
The follov:in4 statistics indicate the details co ricer : i'. :-
each variate .
1Iean Standard deviation Coefficient of vari
Yield of -1i L_ (lbs.)
25.35 ± 0.20
10.:;3 + 0.27 ation '12.3 - 1.23
Correlation coefficient r=0.051 ± 0.000
(1/1000th : _ _ _b . : 123.3 50.3 30.3
± 1.3 ± 1.2
1.1=_

very 1o« or a very high protein content.
Morris c7. aright have studied the biological
value of various protein-foods for milk production
and have come to the conclusion that those containing
a rele tivel y high content of lysine and triptophane
are more ade juaté for milk production than others,
since trie milk itself oe ntains a large amount df
these amino-acids and the animal organism cannot
produce them (10) .
From the conclusion reached above it ap-,ears
that if the amount of protein in the ration is
diminished to such extent as to exhaust the body
protein reserve, the result would be not a milk
poorer` in protein, but a smaller quantity of milk
(equation 2) , richer in protein (equation 1) .
On the other hand, an increase in the amount of
protein in the food would increase the yield if the
production of milk were below its maximum level,
otherwise it would not make any difference either in
the yield or in the % of protein in milk.
Perkins (11) , Morris (12) , and Turner (13)
have studied in carefully designed experiments the
influence of the amount of protein in food on the
yields and on the chemical composition Df milk, and
their results are in perfect agreement with the abov
conclusions. Of special interest in this respect
is/

550
540
'530
520
510
500
400
480
470
6 460
ä450
s 440
2 430
470
410
E 400
t .390
350
370
360
350
.310
330
320
3D
1 t 3 4 3 6 7 8 ' 9 q 11 Q ü M IS 16 17 6 10 20 21 22 23 24 25 26 27 28 29 30 16 6 11 6 ¢ 11 g 3 b 7 6 5 4 3 2 1
iMt. L 1ettfm FeL xflT the at d 1,414tim
,7 r . aJ
Showing the lactation curve for the percentage of casein nitrogen. Each dot represents the mean v'1ue of all figures available for the corresponding weal: of lactation. The "band" shows the limits of ri - 33a, i.e. the estimated 9:f,ß probability rance of the : ean values.

Fi,. J.
Sho\:inc lactation carves for the yield of milk (1): percentage (2) ^,nd the amount (3) of casein nitrogen (333 samples) . Ordinates of `nraphs (1) and (:]) represent the mean values of all the figures corresnon:lin-- to samples taken in each v :eek of lactation. Ordinates of graph (3) are obtained by multiIllyrinv the corresl,onding ordinates of grap:as (1) anf, (.:).

-29-
is the work of Gowen et al. (14) . They studied the
variations which occurred in the yield and in the
composition of the milk of cows receiving no food
but having access to as much water as they wished.
They observed a progressive and marked decrease in
the yield and in the % of lactose, and an increase
in fat, ash, and protein.
During the present investigation, the writer has
also observed an increase in the % of T.P.M. in the
milk of cows whose yield fell during sexual excite-
ment. It is noteworthy that from the anal ers is of
the results of this investigation, which was not
concerned tdth rationing, it has been possible to
arrive at the same conclusions as those reached by
other investigators who have carried out experiments
on the feeding of cattle.
B) Casein nitrogen. The C.N. forms about 77%
of the T.P.N. in milk (15) and the above discussion
on T.P.N. was found to be applicable to the C.N.
The sare methods of statistical analysis and tests
of significance were used and the following results
were obtained :
(1) Lactation curve for the percentage of C.N.
(Fig. 5) with the corresponding table (No. 2 appen-
dix) containing details of 95% probability range of
the estimation of meansof columns.
(2)/

-30-
t i t - .
t?tt;
..
. ..
ttt
.. .
.?!'tP. -0. «. r W a a. r -w tt .. . 441 g as. i ,. . .3.3 + ... .. ....e.w .t ....a .ttaIVIN (.a.11.1. en. Us arm) F 7.
> the correlation between vrield of milk and r ercertt age - san nitro,:;e. n. in 333 sales of milk. The arrors cate the di:.-ectio_s in which each variate incre?.ses . The
re_lresents t1.? re::res^ion line of th:,. . nitro,_;ez the yield of milk. The curve ------ s?ntG re:'resF:ion of the ''iel of milk o-? the
rr.- of tot-.1 ,,. ; ,; +, , -1'z.., o o .1 r, _. _ _ _ . ._ _ ~:. The for ot-; r_ statistics t-,, d ls . ,ach variate:
,.
C.1.0 , i7 ._ '.ci:cnt of v.,,-' .,-Lion
C c rr el . n.t ion c o^ t' t:`. c lout.
(,lbs.;
.15 `1,0 .;'. 11.0 ± 0.'"3 r, + 1
_ -0.313
of C.N.
0.111C 0.0511 , .3 1
± 0.0013 ± 0.0013 ± 0..,
0.031

II
- ¡I
it
.I
/
M
u -» -M
U
/1
14
-36 11
- ,r r lar W gI ». iM W _,1" i11 .1. .n . I .. . . 1 . ! . 1 . 1 . i p M P .r± ,. á.° á. T ° ° 1... Y 3 at{rYa ( L'm Iva 1..17 s¢
-1 -
1. -__ ..1 .._ 1_ d J-_. - 1 1 ShoI:in corrolat _o . ìC I. : ;,ho = ,^ 1 .
- ° - -- of c,.: > ' : ,..: 1:; les~.. --,
indivia.-' .,,- . '"' _-_'10.,.:^ n3c _ _ - .. __'-- each vc~ì..'1i. _ .Lil'2. c-2rve
_=_= rezsoiol '-- -)2 the ;; el csi1 rtro ;oz o_ _--_- _3 ofy milk. f,, f v1 C e
. c 40,-
p i ^ . - 11.1e V ^ The C V. Y,.-.' i .. j..+ TÁ'v ..Va .y.'v. 'i
the Lrield of .liL on the _1. of csi ;1 nitro *en. The t.:o curves aro not ?.' cor b; arc ver;.r near to stl,a i`.It line. The follovir.-- ^t-y._ `.,cs indicate d-tai_ls co__corn_ ` eadh variate. _
r. , 1-,
r,-.)l..r;,'^-,7C1 . .7.`
., \ J
yield of C.N. , 1,/1000ths of lü . j
7_01.0 ± 1.5 '-1.3 ± 1.0-1 1.1 ± l.a-,
± 0.00 ..

-32-
(2) Lactation curve for the amount of C.N.
(Fig. 6) .
(3) Correlation coefficient between yield and
the % of C.N. vas : r = -0.313 ± 0.031.
Tocher (16) working with a different material
(474 samples from one milking of 474 cows scattered
over the whole area of Scotland, and over a whole
year) , and with a different method of ai emical
analysis has fbund a higher value, i.e. -.4219.
(4) Correlation coefficient between the yield
of milk and the yield of C.N. was:
r = 0.927 ± .0049
and the regression equations:
OR yield of milk 0.927 x 11.03 0.244 yield of C.N. - 41.9
R yield of C.N. 0.927 x 41.9 3.521 yield of milk 11.03
The Figs. (7) and (8) show the corresponding corre-
lation tables with the details concerning each
variate.
C) Albumin and globulin nitro, en.
(1) The lactation curve (Fig. 9) for the %
of A.+ G.N. is of the same general trend as for the
C.N., although the trend for the fo rner is much
smaller the for the latter.
*See note at foot of page 24.

00 -J
-70
"
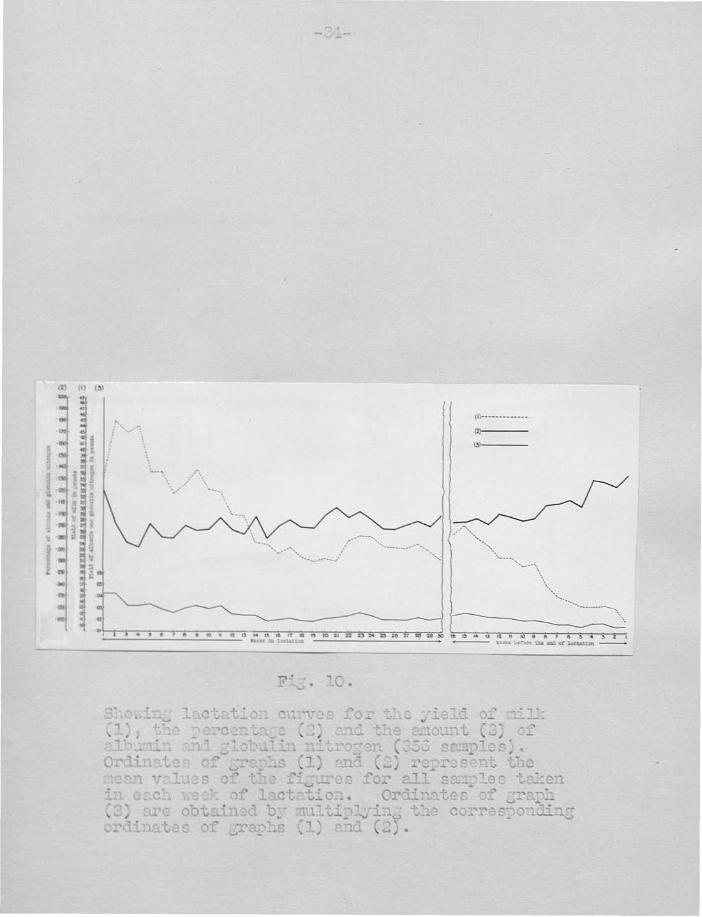
+ Fi ;,. 10.
,,...., +_ati r curves t -i e - J' i.c 'v«t _. Ct.t.. VL for i L_Z ̀ v J .,.ld i .,_. _...
(1) _'erc ,'e (3) and the 2ount (î) of lobulin nitro-:on (353 samples).
Ordinat 7 as of a2hs (1) nnd( ) rep rasent the -loan v"1uas of the fi ires for all serles teen in each e T: of lactatio,i. Ordinates of graph (3) are obtained by mu1tiplr-inc; the corresponding ordinates of ;trap hs (1) and (2) .
-35-
(2) The lactation curve for the amount of
albumin and globulin nitron is given in Fig. 10.
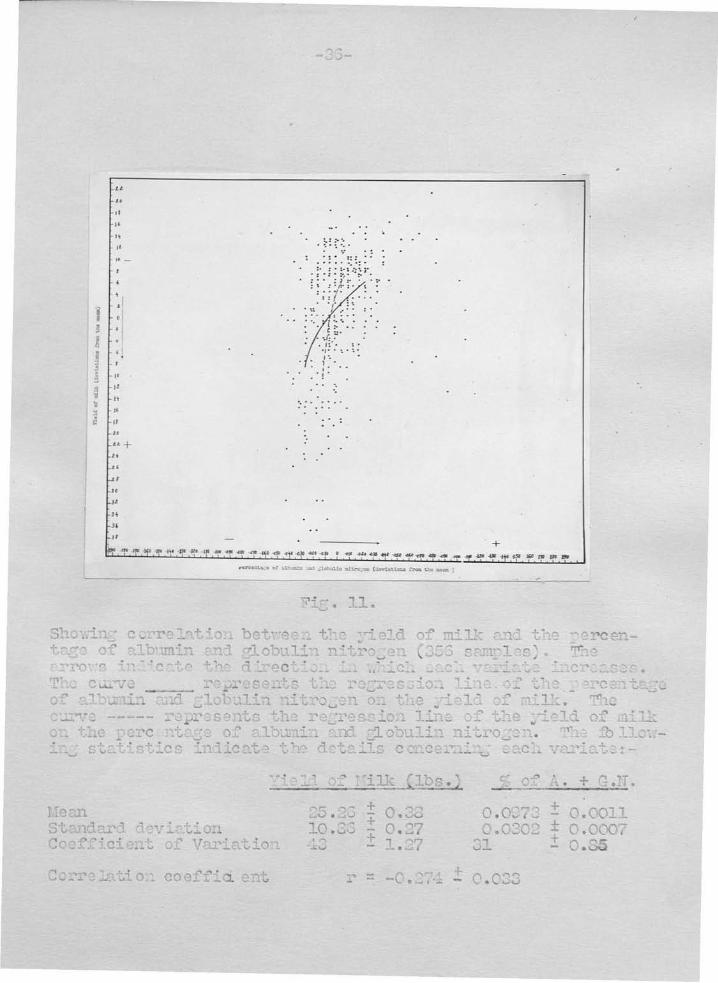
(3) The correlation table (Fig. 11) between
the yield of milk and the 5 of A.+ G.N. shows that
the distribution is very different from that af the
C.N. The coefficient of variability is also much
larger than for the Cal'. The correlation coeffic-
ient is:
r -.274 ± .033
Tocher, with the same :,uteri al as mentioned above,
found r = -.2948.
(4) The correlation table (Fig. 12) for
the yield of milk and the yield of A.+ G.N. shows
a much more scattered distribution than in the case
of C.N. The correlation coefficient is:
r = 0.707 ± 0.013
Discussions.
1) Bartlett (17) in a study of the "Variations
in the Solids -not -Fat Content of Milk" states in
referring to "about 40 dayrs after calving" that
"for several months after this time the comno sition
of the milk tends to be remarkably constant". The
conclusions drawn from the present work do no
support however the above statement. Tocher (16)
has shown that there exists a positive and significa
correlation between the yield of milk and the ; of
1 ̂.dose/
14
14
o
It
-16
- it
/4
-31
34
36
t
ITzr .T 1?.4T 4- ?' !` 1' 41' .41` 'f` T.'1"
7 7
(-' - - ' - - -
6 -
.7). 7 1_7. _n_ _ _ -
--7,117, of 17ilk (lbs.) c :,: (` . ÷ 171_ .TT. -:, -- -
Mean ''-' '-'-' + 0 '- ,3,_) ....... ..) .. - . 0.0073 ± 0.0011 ,- + Standard dcviation 10.J.D 7 0.27 0.0302 i 0.0007
-T- 1 , , - ± Coefficient or Variatio71 - - _....-i _1. - 0.85
o co effici. ent r = -0.374 0.033

: .y s ̂; i:
...: .
-.l NI ..II 44 +31 .t. .I O . +.1:.M Y J M ..f ... ..1 N . ..
./f .of .449.13 N f ir J. .tli M % +A .N .1.1.1.1,1.1.1.1.1.1.1..1.1. .I.1.1. .I. Ì,1.1.1.1.1.1.1.1.1,1.1.1.1.1.1,1, il1S of ellWa ._. la:.iL,
s _ r ?r ,jii(X: .+_ . 'i .: t "_...
.
_ ., .. .. . _.. 'v_..:, J- ^.1 .-Q of mil:: and ,.,_,.
of alb",um.:... and j_ obulin :.it2 ot;e'i, (353 sam:212 s) . The 2r7.'oscTs
Znlicate direction in which each va-l'iate i_1Ci'Ca SOS The e 0+, q. -1 the n _,.n . _ of the ;ield curve r .,_n,s t= e r;;i,.ssion li: ol i.ld of
=Ilk on the of c1bami:_ and ,:lobuli_, :.itro,;en. The re.w ..y.sO_Ztr n? r '?zi'41.5s1oï: 1i1îs of the of
albumin nitro,;e2, on the ,;-ie l_d of milk. The foll ,in statistics ln'13Caf ~ details oo nc,rlï=g each variato.
Mean Standard d^viation Conf"^icisn'l-, of vaI'irlti0i1
CocrPl at ion coe_f".+. i cient
Yield o:i (lbs., Yield of A. + G.N.
n .uJ .,- 10.
r
f . cJC
± 0.7 i- 1. ,7
0.7J7 } 0.01
(1/100thB- lb.) 23.3 - 0.33 10.14± 0.27 42.:)3± 1..7

-33-
lactose. Since the yield of milk decreases
regularly "from about 40 days after calving" towards
the end of lactation: one must conclude that the %
of lactose decreases also in the same direction.
The fact observed by Bartlett that the Solids -not-
Fat content of milk remains constant during several
months does not mean necessarily- that the colposition
of the mill: is also "remarkably constant " during t a
tii e . All tyre can c oncl sde,is that the decrease in
the r_ of lactose is .counterbalanced by the increase
in the of Wrote L s, and ash (Tocher) in s-uch a 1..a-
that the ;; of Soli:'s- not -Fat re iains constant.
(J; It is neces -r;,- to bear in -rind that the
frets observed and t, conclusions drayn in th,e
present investi =ation are of relative value and b-
no means strictlçç applicable to individual cors. In
f - ct, thi 1-or:: like most of the inv e stilt art _ons in
biolo 4- fences, is br-ed upon principles t:h_Ch
t'nems 1,7_ -_: j = a -2ela.t c ti-aluo . Co nc. _,' roal_ s ,_J,
_ ,. 7 '. .01 acceso=_%; represent t7.1e
absolute truth -_s i_. ì:t e scieno::s .
7117,,? 2-sont statC of ',o',:lad`? about the
c'.1o_?1 _,^ t''./
of Ca.1 .i ii
J. , . 13 .
* i -'t s 1, it n n.,r-,t ? l.0_1 _ .it,od 1 _ ,_ . .S .d i l n + . -!- ' -t TY o :.zil:ti lavo e sie initial F_.
is not true: since variability is one of the -dost
all
^^ ti //L L -a= ..{}.. f' of the 1 ' T ' 1 _ Important li,l.:lt Y1 L.r .e uez ._ `j.;.0 _ -.y l.'- .. 1` +L:
and/

"':. -..-
and c.s a.ic10 ux i-;oínto out: "Il n'ya 2as "du 1 zi t"
mais bi en "des 17.it""" (13) .
Further it iRuÚt t=1t t`2?
rincil? les of statistics are based upon the "Ir..-
la'e , opulati ons which "suivant 1' ex ,ression d'un
grand mathernaticien est toujours vraie en général
et fausse en art c_lier" (19) . For instance just
as the length of lactation is different t:ith various
cows, the time in which the r of various proteins in
milk decreases may be different flora cow to cow and
last from 3 to S t.eeks a ccordi to the bresd of the
cot: and other factors.
3) Actually from a purely scientific stand-
point, this worh is no encre than a record of a num-
ber of measurements from which certain conclusions
are drawn. It does not tell us anything about the
real causes of the variations observed. It would
have been more interesting if it had explained their
causes and established their relations ,Ath the
whole harmonic set of nhenomsi a which contribute to
form the unity of life.
Owing to the exceptional conditions under which
the experimental herds are kept, it is probable that
the average herd would th ot: somewhat greater varia-
tion, ond studies of the comparisons of yields of
animals from several herds would show still greater
variation/

-40-
variation owing to differences in nitrition and
other environmaztal factors.
Suri: y .
(1) It .ras planned to study the variations
of the protein content of milk during the lactation
period.
(2) The total protein nitrogen and the casein
nitrogen were determined by apl'roved methods in
about 330 weekly samples of milk taken from 27
individual cors of different breeds and at differen
stages of lactation, from February to July, 137. r+
The albamin plus glbbulin iras calculated in each
case by difference.
(3) The statistical analysis of the figures
was na de by the methods of "factorial arrangement",
and "pairing" and also by the esti..ation of the 9
probability range of the mean of the figures avail-
able for each week of lactation.
(4) It was found that the % of T.P.N.
decreases very significantly from the beginning
until the 4th week of lactation, and then rises
slowly until the read of lactation, the rise being
more pronounced towards the end. The sane tas
true for C.N. and for A. + G.N., but in the case
of the latter only the decrease at the beginning
and/

--41-
and the rise at the end were sharp. The rise for th
rest of the lactation curve, although it did exist,
was very slow.
(5) The lactation c:nves for the yield of T. X.,
C.N. and A. + G.II. were 1ractically parallel with the
lactation curve for the yield of milk.
(6) The correlations between the yield of milk
and the percentages of T.P.N., C.N., and A. +
are studied and the correlation tables with all de- are
tails" úi ÿ en for each case. It is noteworthy that
the regression lines are not linear and that with a
poor milker an increase of one pound in yield of
milk corresBonds to a relatively high decrease in
the 5 of P.N., %.hereas with a high milker this
decrease is relatively much smaller.
(7) The correlations between the yield of milk
and the yield of T.P.T:., ÿ.r., and A. + G.N. are
examined and the correlation tables are given. It
is shown that there is a close correlation between
the yield of milk and its protein content, from
which the conclusion is drawn that a very low pro -
tein food does not decrease the 4 of protein in milk
as oneliht expect, but decreases the yield of milk
and increases the r of protein in milk. On the other
hand an increase of adequate protein in the ration
may raise the yield of milk if it is not at its
maximum/
e
maximum level.
(3) It is e.irphasised that the above conclusions
are dra,:n fro i study carried out on a group of
cows: -la: not be strictly applicable to
individ_:-1 co-s.
Acknowledvemts.
The triter ishes to --_ckno-A.edge his gratitude
to Professor Crey fol the hosnitalit;,- and
facilities received at the Institute of Animal
Genetics darin this i=2:tigation. He also ':ishes
to ex:res: his ihdebtedncs: to Er X. D. 75:.cha1
Smith and Dr X. U. SLIith for their wl..iable
encourt,ceiont and criticisn t-irr)i-:hout the orL
Ris sincere also due to Professor R.
Fisher and Dr A. C. as--:s-
tance and advice d_irin,; the sttXc the

-43-
?c -°c,
_. s
nce..
1)
(, .n .
v 1
*n )
,
r -,
_rL,
V_
'u: i,, L
.L.
1
á ;
T-.
. ',
- -?
- -
- --
1
- -
' , -
^ -
1
^`' ,
17 7
. 1'
-0,
Ell G
J ̂ .' --Tr
,O.-
-;
- ?
-_-:__
-
1,-1
1 .1
e.
.
-
""-.
^
'1.
,-r i-
-
^
y_+
.--.,
-.._
.. -.
. J'--
:. _..Jr. _
_ V
_..
^.7
.
,-
I.IcDC..7,T,T4, F.77.;
c:'rl... i:_cDCJ..E:.aL
_.L
.-
i
^ Ti
?_
îi,.
.L _
r%.,
formol titra-
- . ,_
^r
,,,
,, ..
_ .c
-d.
_ r.
-
- "
i ._
..'i
r,
:AA
T
An=
-ld S
t
711
rn
':-'tr
1 t
Jvvl
.i.l:.
.l V
¡.
v.
v ë.
r C
Q_i
_- :J
.i+,
dC _:
1C
L '
7)
"3T
UD
:1 7
" =
(7' ° L
o d
bV 7.
o.
u .
1233.
Les
., -
a bas,,.
ry
...
also
___
i 1antés.
Lec'
-r' _ ,
r...__r. ,so (3
)
.
FIJ :
..1
researc',
)
3..
Sta
ti_tic
a . _ï.et,ods for
. .1
-i- 1
" +r
r -
r:_.`,,
Bord,
`7
_,dirbLU_..
PEARSCU, K. 1L30.
Tables for Statisticiens and
T
-y .
Bißmetricianv .
Jr_vs ;
:,;- Collvze, London.
10) MOM'S, S. and. ';;RlGì'T ,
value of proteins
J. Dairy Res., =s
N.C.
1'2 33 .
The nutritiv
for milk production.
. 177 and 5 ,
1.71 . 1.
11) PEtRk`TITá, A.L.
1;32.
The chemical co ._;osition
and nutritive properties of milk as affected
bv the level of protein fee3in,;.
Pt. 1.
Chemical c wlp ositlon.
Odio
Ex p. Sta
12) II0n21S, S.
1233.
The protein re
;;_re
ient
s of
lactation.
Nutr. Abst. Rev. 3
1 ì. 372
13) T-D1`?'LR, C .
';; .
1:33.
Factors affectïr,:; the coIn-_o-
sition of
.'î:ills.
Missouri A,s.ric. Ex;. Sta.
GUTEN, J.W. oild TOBEir, E.R.
1031.
Studies on
r.'lilk secretion;
the influence of inanition.
J. Gen Phrsiol. ,
15, p. 45
15/

15) DAVIES, 1:36. The Chemistry of milk. Ch:pri Z and 'T_all, London.
1ô) TOCTE?, J.P. 1::,5. Variations in the campo- sition of r1'll:. His Eajesty's Stationer; Office.
17) B RTLETT, S. 134. Variations in Solids- not -Fat Content of Ei k. J. Dairy Res., 5, 118.
13) DJCLP UX, reported by Pouriau et r ..ann (1935) Laitrie, Librairie de la maison rusticue, Paris.
19) BERNARD, Claude. 1320. Introduction à 1' étude de la medicine experirentale. Delagrave Paris.
000

` 1 1
mot^1. P
rOt^`'.
1Ti h7,,n:1.
the
-..J rc_ï° of
,
mean
or each
., e
__ of
lactation.
G._
1__.20
i I
7
'11
10
10
4.00m)
..4 11
25
11
26
12
27
12
11
11
30
11
KS. be-
ore end
f lacta-
tion.
13
15
J
14 3
1,
1"-
.;.., ̂ 1
12
11
10
10
15.1G
1
0i
7
r71 -
_ :
:. . 87. - standard error of
the mean
ñ
a+ag:7i
573.3
314
509.5
54C.3
454.5
471.4
133.1
111.3
455.1
493.4
457
^-90 . 6
_00.7
451.7
n r+
n. -
-, r.
_i .1
-l. _.J.v
_ - v U
_ .. ._ . .
_ .
V .
..+
........- - _-
e _
L_s..
15:`
1G. .. 17-.
15.7_
112.33
11.59
_ V
V
:-_ 3_i 5J
. 5
133. 3
.C.3
_ , ._
e ._
12.51
¡ 01 .3 10.44
490
15.73
rC.1
1:30.7
15.1
12.3
_ .. . \%
0i
3
7
7 7 J
:i .87
21.5
14.43
10.37
.'3 .1 ,
35 ..;
"
. 2
474.5
477.5
493.3
432.5
499.2
503.2
r ,
J1.3
504.7
557.9 . A
._ _.
.. _
_"_ _
vl- w
r1/1
V ."4A
-70.2
-
_._, -
e%
_....i __
- ._.. v
_0
513.3
525 . 7
V1L.1
_- -
51:.^ .3
-- n
-
.
51` . _ .5
5a..2
a:.. J
510
535.4
515.7
5r. ..,
0[1
c.%cli .
=
_)10.9
519.3
551.4
531.3
551..°r
.1/4..
_i `
..
n
_.-.J -,
55.0
535.1
514
520.7
533.9
502.
551.4
523.2
537.S
543
5çc`l. 573
.cJ.i 573
j,, _.t.2
553.1
115 309
;:`.05
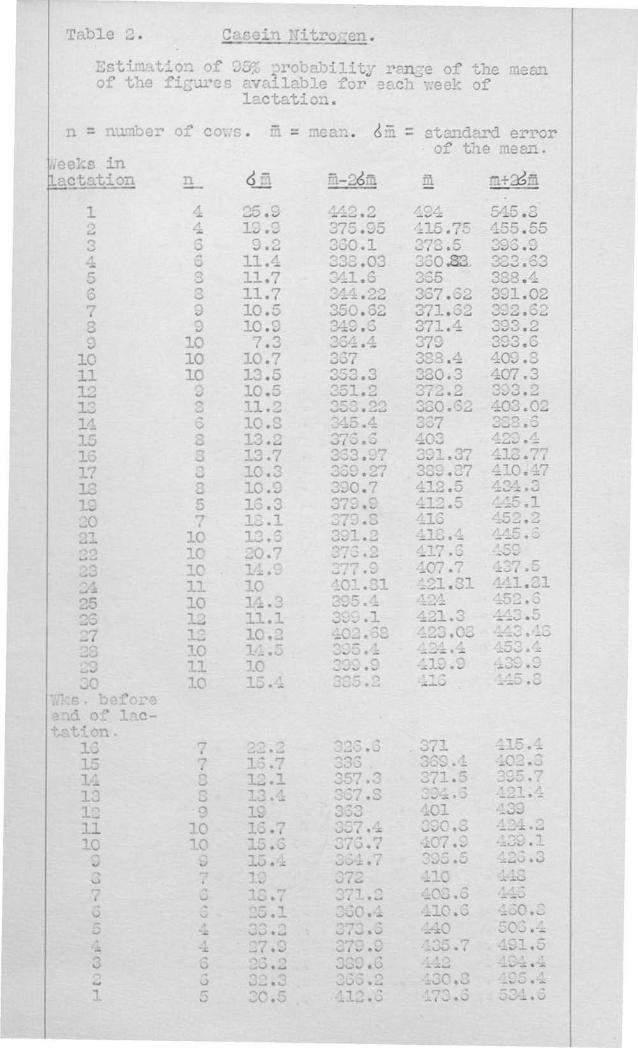
Table 2. Casein Nitro;;en.
Estimation of O5w probability ran3e of the mean of the figures available for each week of
lactation.
n = number of cows. Th = mean. 8a = standard error of the mean.
reeks in actation n
1 4 s
J
5
7 n n
0 10 10 10 11 10 12
14 15 16 3 17 13 19 5 20 7 21 10
10 23 10 24 11
10 1Z
27 12 10 11
30 10 before
end of lzc- tatl on
13 15 14 1.7
c.
n v A -x
13
.le)
...I r.
25 20
r-,
l m m -2Èia í3i
A94 415.75 373.5 350.1:13..
355 367.62 371.32 371.4 370 333.4 330.3 3722 330.62 357 403 301.37 300.37 412.5 412.5 416 410.4 417.3 407.7 421.31 ,1 a
421.3 4 2^ .00
^ -.,;.--S. ._.-x
L 1 Z . 9
a5.9 n 19 .2,
, .J . 2
11.-^_-
11.7 11.7 10.5
. :. 10 7.3
10.7 13.5 10.5 11.2 10.2 132 13.7 10.3 10.9 13.3 1=.1 10.5 0.?
10 14.3 11.1 10.2 11.3 10
442.2 375.95 330.1 332.03 341.6 344.22 350.82 349.6 334.4 357 333.3 351.`) 350.22 345.4 375.5 333.07 360.27 390.7
9 379.p ^ v7! t 8 ( J
301.2 2 .
A01.31 3°5 305.4 ,.
402.30 ,-....r.,
..)./5.'a
..: a J . ..
7
13.7 1Z.1
., 1n A `a
12 10 11 10 13.7 10 10 15.3
c. 9 15.:1
7
J
3 ,-,
1
rig 2;ßi
545.3 455.55 L9n o. 333.63 338.4 391.02 392.62 393.2 393.6 409.3 407.3 333.2 403.02 303.6 ^9.4 r.
410.77 410.47 434.3
4 .1 145.1
n
ÿ __ 437.5 441.01 453 452.3 ,3 ..
, _L . 10
-:..:.'_ rl . ¡`.
S.J . .ï , . _ ,,-
_....5 .. 'Y.a_./ _ J .v

`D3,
--
++
c+ W
to
c t
C
HQ
)WC
CnC
)JC
)cO
(Ñf W
í~U
i¿ó
o Ö
CC
G-J
GiC
,Wf:
ÑÓ
)-
JCIII
,. G
'[);ñ
c")C
)-]
H) 0
I-''J
p
o od
t:( )I
h( )L
)
J
J J
cnG
,G)C
);G
ti-at
OÓ
t7c7
cAC
aO)
ÓÑ
Ó jó
NÓ
t-4ó
()u,
C)C
»C3
r) t,
0 O
C
:
H 1-
+
I-+
L)
F-'
H
G)D
)CJU
1Gn
H-]
-JC
,C)
G,C
)W
. ; CJ
WC
, G
A t)
(n G
, H
H
er)
tt> c
a G
FJ
J I
J -J
-JG
i() U
(J,
)( )f
)C
;>ti.
)G)G
I G
}C)C
ri r
( .
IG\-
-
. j
WH
t)C
)C,1
.-C
)f;.
-1[J
-.7t
aG)
]G)t
0Wt)
G,
O1f
i
( 1C
-]
ÓÓ
ÓC
) -]
rl)t.)
cO C
f) to
tOtO
G)G
)t-)
C)
Co-
.]f)O
)ú)-
J-J-
JC)Ó
CJC
)C)C
)-JG
)U-l-
1C)-
7-(-
?-1(
)-]C
iC.C
)(
CO
F-G
)I--
+G
)t;)
GsG
,U)0
1-1W
GyG
,0-J
G
Gt3
10tO
0Wt.O
[JO
WN
O-3
W-.
]-Jt
,1
-1 (
O
17 H
CJ
Ul -]
WO
Co
P C
o C
:] C
o C
O
. 17
W0
F-)
WN
-1 tO
0 -1
W-1
O
I--,
EN
) i[,
C!l
I:[
( <
:)i;J
O
CO
G
H
O
t)
C)
1;6\
f-j F
-' F
-+ I-
, I-
1 H
H H
H
H
F-'
H
F-'
H
Wto
G)W
O I
-, H
HcO
t000
SE
oCO
CO
0 O
C)c
rT)c
OC
)C)C
)Qr?
OO
CJr
)cn(
oWC
o( .
C)<
(E
(.;(
;C
,C,(
-
!( ;
-,
a.,G
,-Jt
.)t.^
aG1I
-,0t
OG
)OtJ
>C
OG
)G
HH
GC
)CcO
-J ti
, C
7-JO
t)O
C)H
Otw
-J-1
(.)c
)1O
L I
( i,
o .
r ri
t ,
1
Co
to
(il H
GJG
7 O
H O
to C
o H
H
W O
W f
i1 U
) P
Co
-J C
o I H
C)
(Si
G)
;> C
fl G
I (,
) C
J [.:
r (;
- C
D
G,
H
O
o to
to
U
I (
i -.
l 11
ri,
O c+
I-.
H H
1-'
H I
-a H
H H
I-' H
H H
I-' F
-' H
1-+
I-'
H H
H
F-'
1-1
j-'
H H
I-1
H
I-'
1--1
#
! t+
j, ,
G),
G
) 1.
G)
CJC
7HO
OI-
JOI-
'OO
O
OQ
O7t
3[,
C
, I
( ;-
+C
)C
i _f
1'.'
v C
J C
J 0l
I. O
- G
)C
rJ G
) I1
[J
F J
H L
) C
1G)1
>-J
Cr,
OC
U1h
G>
G)0
''*tS
) G 10
(-11
,
CJ
I J
( >
(
' '
IA
D
a.
e e
.
a
á G
()
G
Co
G
G
O
[,). G
(7
t G
) tO
CO
t!"
' C)
-.] t')
-J
(;)
t') ü
()
C)
U1
(n (E
.) 0;
= c'
) G
1i
' (,
, i
( ,
E
p L
I .
( :
t ;.;
;:;
0
C
H
(E)
to C J
[J
( 1
(D
(D
(1)
(--4
:j 11
o

- _ _
...a.
by
E. zarme,
Institute of Animal :aaaLics,
University of Edinburgh.
.00

Introduction
Contents.
,.áaterial and ..le c,izod
Discussion and conclusion .
Aeferences 1-
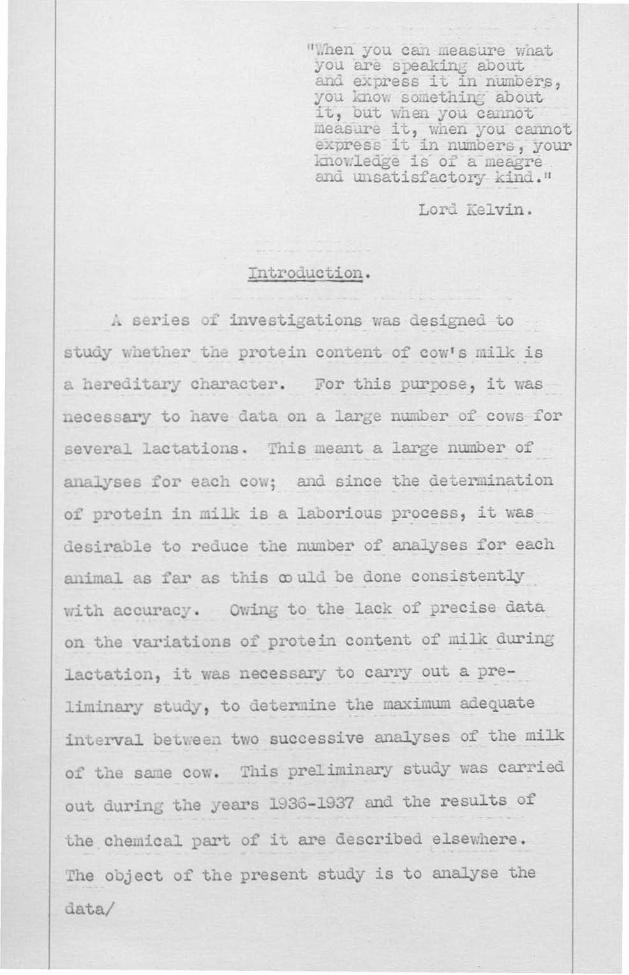
"'lien you can measure what you are speaking about and express it in numbers, you slot something about it, but when you cannot measure it, when you cannot express it in numbers, your knowledge is of a meagre and unsatisfactory kind.«
Lord Kelvin.
Introduction.
A series of investigations was designed to
study whether the protein content of cowls milk is
a hereditary character. For this purpose, it was
necessary to have data on a large number of cows for
several lactations. This :.leant a large number of
cow; since the determination
of protein in milk is a laborious process, it was
desirable to reduce the number of analyses for each
animal as far as this o)uld be done consistently
with accuracy. Owing to the lack of precise data
on the variations of protein content of milk during
lactation, it was necessary to carry out a pre-
liminary study, to determine the maximum adequate
interval between two successive analyses of the milk
of the sage cow. This preliminary study was carried
out during the years l)33 -1)37 and the results of
the chemical part of it are described elsewhere.
The object of the present study is to analyse the
data/

-2-
data statistically and to determine whether it is
possible to take fortnightly or three weekly samples
instead of weekly ones without disturbing unduly the
accuracy of the results.
Material and method.
Variations in protein yield of a cow are due to
changes both in her yield of milk and in the percen-
tage of protein in her milk.
If it were possible to have for each day of
lactation, figures for the yield of milk and its
percentage of protein, the estimation of lactation
yield of protein would be easy, but in practice this
is not possible since the determination of protein
in milk is a long and laborious process.
In measuring the yield and the protein content
of milk at intervals and taking the figures obtained
each time as averages for a whole interval, errors
will necessarily be introduced in the estimation of
lactation yield of protein. These errors will be
due partly to changes in the yield of milk and
partly to changes in its protein content. Those
due to the former cause may be eliminated if the dai
yields of milk are measured, and the results used in
the calculation of protein yield.
The present investigation (which is to be used
as a basis in a series of experiments on cows whose
milks/
-3-
milks are weighed daily) is concerned only with
errors due to variations in the protein content.
The material used in this investigation :gas
already been described (1). It is based on the
results of ana]ysesof 380 daily samples of milk
taken from 27 cows in different stages of lactation
at intervals of 7 days. Tocher (2) has shown that
in milk the coefficient of variation for casein is
much smaller than that for albumin which, in turn,
is similar to that for fat. As weekly samples are
considered sufficiently reliable for the est; .elation
of total yield of fat, the same was assumed to be
true in the case of total protein nitrogen.
method adopted in this investigation for
testing the accuracy of fortnightly, as against
weekly measurement, is based on the degree of error
involved in a single test compared with the mean of
two consecutive tests, one of which is the figure
used for the single test. Likewise, the accuracy
of determinationsnaïe at intervals of three weeks
is obtained by examination of the degree of error
involved in a single test coip ared with the mean
of three consecutive tests, one of which is the
figure used for the single test. If the mean is
taken as equal to 100, then the error of the single
figure can be expressed as a percentage of the mean.
:,lien a large number of consecutive figures are
treated/

treated in this manner, a "population" of errors is
obtained. The mean of this "population" is zero,
and its standard deviation gives the limits within
which 68% of the "population" is found.
For the test of the fortnightly determinations,
50 pairs of two consecutive determinations were
taken at random from the data, at least one being
Inc -uded from each of the cows whose milk had been
tested (except cow No. 27 whose milk was tested only
two times). To test the accuracy of three weekly
determinations, 34 groups of three consecutive
figures were taken again at random, including all
the cows, except cols ilos. 26 and 27. Tabled (1)
and (2) show the results and the details of calcula-
tion of the standard deviation in each set. For
fortnightly determinations, the standard deviation is
= t 2.92. This means that, by taking weekly samples
as the basis of comparison, the use of fortnightly
samples will involve errors which will be found
within the limits of t 2.92% 68 times out of 100,
and 95 times out of 100 they will be found Lithin
the limits of ± 5.34. In the case of three weekly
samples, the standard deviation is slightly greater,
i.e. 2.99% , and 95% of errors will fall within the
limits of ± 5.96%.

TABLE 1.
Estimation of the errors involved in the determination of lactation yield of protein when two weekly samples are taken instead of weekly ones, and when the true yields of milk are used in the calculation of protein yield.
Cow No.
1
2
3
4
5
6
7
hilligrams of total protein nitrogen in 100 grams of
milk.
me ans
d
(Absolute values of the
differences from the means.)
D (d expressed
LLB le of mean.)
421 424 3 .71 .5041 427 3 .71 same
471 467 4 .Ca .0081 463 s.
512 474.5 37.5 7.91 62.5681 437 s.
453 461.5 8.5 1.84 3.3856 470 s.
563 521.5 41.5 7.97 63.5209 480 s.
468 464 4 .86 .7396 460 s.
464 462 2 .43 .1849 460 s.
462 456.5 5.5 1.2 1.44 451 s.
420 435 15 3.45 11.9025 450 s.
433 468 35 7.49 56.1001 503 s.
488 482 6 1.24 1.5376 476 s.
480 470.5 9.5 2.01 4.0401 461 s.
509 518.5 9.5 1.83 3.3489 528 s.
457 458.5 1.5 .33 .1089 460 s.
484 494.5 10.5 2.12 4.499 505 8.

Table 1 (contd.)
Cow No.
killigrams of total protein nitrogen in 100 grams of
milk.
:Leans
d
(absolute values of the
differences from the means.)
(d expressed as
of inean.)
_.
8 572 551 21 3.8 14.44 530 s.
496 507.5 11.5 2.26 5.1076 519 s.
9 432 440 8 1.81 3.2761 448 s.
10 436 442 6 1.36 1.8496 448 s.
492 493 1 .20 .04 494 s.
11 417 433.5 16.5 3.81 14.5161 450 s.
12 486 497 11 2.20 4.84 508 s.
470 477 7 1.46 2.1316 484 s.
13 513 492.5 20.5 4.16 17.3056 472
457 458.5 1.5 .33 .1089 460 s.
14 679 632 47 7.43 55.2049 585 s.
545 545 0 0 0 545 s.
15 468 481.5 13.5 2.79 7.7841 495 s.
479 506 27 5.35 28.6225 533 s.
465 478.5 13.5 2.82 7.9524 492 s.
16 496 492.5 3.5 .71 .5041 489 s.
500 514.5 14.5 2.81 7.8961 529 s.

Table 1 (contd.)
Dow No.
L lligranis of total protein nitrogen in 100 grams of
milk.
Me ans
d
(Absolute values of the
differences from the means.)
D (d expressed
as
of mean.)
17 524 514.5 9.5 1.84 3.3856
505 s.
500 503.5 3.5 .70 .49
507 s.
18 448 454 6 1.32 1.7424 480 s.
438 436.5 1.5 .34 .1156
435 s.
19 555 548.5 6.5 1.18 1.3924
542 s.
547 556.5 9.5 1.7 2.89
566 S.
20 527 524.5 2.5 .47 .2209
522 s.
538 541.5 3.5 .65 .4225
545 s.
21 493 504.5 11.5 2.28 5.1984
516 s.
533 537.5 4.5 .84 .7056
542 s.
22 592 599 7 1.17 1.3689 606 s.
632 632.5 .5 .08 .0064 b33 s.
23 652 653.5 1.5 .23 .0529 655 s.
601 615.5 14.5 2.35 5.5225 630 S.
24 526 538.5 12.5 2.32 5.3824 551 s.
515 522.5 7.5 1.43 2.0449 530 S.
530 535.5 5.5 1.03 1.0609 541 s.
26 644 629 15 2.38 5.6644 614 s.
Total number of degrees of freedom = 99. x172 = 846.26
d 1846.26 = ± 2.92 99

TABLE 2.
Estimation of the errors involved in the determination of
lactation yield of ;protein when three weekly samples are taken
instead of weekly ones and when the true yields of milk are used in the calculation of protein yield.
Cow No.
Milligrams of P.Y.N. in 100 grams of milk.
Lie ans
d
(Absolute values of the
differences from the mean.)
D ( d expressed
as j1 o
of mean.) D 2
2
3
4
5
6
7
8
459 436 464
453 470 457
465 440 426
460
523 510
440 420 430
430 406 440
503
451 464
468 482 491
552 550 555
546
527 572
530 481
511
453
460
443.66
497.66
430
426
472.66
480.33
552.33
548.33
507.33
6
17
11
7
10
3
21.34 3.66
17.66
37.66
25.34 12.34
10
10 0
1
18 14
30.34 21.66 8.66
12.33 1.67
10.67
.33
2.33 2.67
2.33 21.33 23.67
22.67 26.33
3.67
1.33 1.7689 3.76 14.1376 2.43 5.9049
1.52 2.3104 2.17 4.7089 .65 .4225
4.80 23.04 .82 .6724
3.93 15.4449
7.53 56.7
5.07 25.7049 2.47 I 6.1009
2.32 5.362 2.32 5.38 0 0
.94 .8836 4.23 17.8929 3.29 10.8241
6.4 40.96 4.57 20.8849 1.83 3.3489
2.56 6.5536 .35 .1225
2.22 4.9284
.06 .0036
.42 .1764
.48 .2304_
.42 .1764,
3.88 15.0544 4.31 18.57611
4.47 19.9809 5.19 26.9361
.72 .5184

Table 2 (contd.)
Cbw No.
Milligrams of T.V.N. in 100 grams of nri.lk.
:e ans
d D (ibsolute values (d expressed
of the as D2
differences from of mean.) the mean.)
9 448 445.33 2.67 .60 .36001
447 1.67 .37 .1369 441 4.33 .97 .9609
452 460.66 8.66 1.88 3.5344 1.9044 467 6.34 1.38 .2601 463 2.34 .51
503 505.33 2.33 .46 .2116 509 3.67 .73 .5329 504 1.33 .26 .0676
1.0 453 474 21 4.43 19.6249 509 35 7.38 54.4644 460 14 2.95 8.7025
11 446 440.33 5.67 1.29 1.6641 430 10.33 2.34 5.4756 445 4.67 1.06 1.1236
440 435.66 4.34 .99 .9801 418 17.66 4.04 16.3216 449 13.34 3.05 9.3025
450 444.33 5.67 1.27 1.6129 431 13.33 3 9.0000 452 7.67 1.72 2.9584
12 526 513 13 2.53 6.4009 499 14 2.73 7.4529 514 1 .19 .0361
13 477 489.66 12.66 2.58 6.6564 500 10.34 2.11 4.4521 492 2.34 .48 .2304
14 607 601.33 5.67 .94 .8836
589 12.33 2.04 4.1616 608 6.67 1.11 1.2321
15 492 479.33 12.67 2.65 7.0225 480 .67 .14 .0196 466 13.33 2.79 7.7841
16 557 559.33 2.33 .42 .1764 561 1.67 .30 .09
560 .67 .12 .0144
17 523 533.33 10.33 1.93 3.7249 540 6.67 1.25 1.5625 537 3.67 .69 .4761

Table 2 (contd.)
Cow No.
Milligrams of T.P.N. in 100 grams of milk
Means
d (Absolute values
of the differences from
the mean.)
(d expressed as %
of mean.) 1_T
18 506 534.33 28.33 5.30 28.09 562 27.67 5.17 26.7289 535 .67 .12 .0144
19 542 544.33 2.33 .43 .18491
548 3.67 .68 .4624 543 1.33 .24 .0576
20 513 528 15 2.83 8.0089 517 11 2.08 4.3264 554 26 4.91 24.1081
21 511 488.66 22.34 4.58 20.97641
495 6.34 1.30 1.69 460 28.66 5.88 34.57411
22 644 614.66 29.34 4.75 22.5625 606 8.66 1.40 1.96 594 20.66 3.35 11.2225
606 623.66 17.66 2.83 8.0089 632 8.34 1.33 1.7689 633 9.34 1.49 2.201
23 647 646 1 .15 .0240 637 9 1.39 1.9321 654 8 1.24 1.5376
24 526 542.66 16.66 3.06 9.3636 562 19.34 3.56 12.6736 540 2.66 .49 .2401
562 528.33 33.67 6.36 40.4496 540 11.67 2.20 4.84 483 45.33 8.57 73.4129
25 515 528.66 13.66 2.58 6.6564 530 1.34 .25 .0625 541 12.34 2.33 5.4289
Total number of degrees of freedom = 101.
.D2 = 900.9274
`_1 900.9274 = ± 2.99 V 101

Discussion and Concl asion.
The present writer (1) has shown that the
total -ároteín nitrogen decreases very rapidly
during the first six weeks of lactation, and there-
after increases slightly till towards the end of
the lactation, when the increase becomes more pro-
nounced. If, in the randomized groups of two or
three core ecstive weeks, those corresponding to the
two periods of rapid change are eliminated,
relatively sm2;11er limits of errors are obtained.
Thus it is suggested that weekly saìies, taken
during the first six and she last four weeks of lac-
tation, with fortnightly samples for the remainder,
should give results which would not deviate
seriously from those for weekly sails throughout
the lactation. r1/4.)r practical purposes, however, a
sufficient degree of accuracy would be obtained by
fortnightly samples during the periods of rapid
change, and samples taken at intervals of three
weeks during the remainder of the lactation.
It is emphasized that these results are valid
only when the daily yields of milk are mown for th
whole lactation and used for the calculation of pro
tein yield; if this is not the case, i.e., if
the milk is recorded only at intervals, the limits
of errors will obviously be greater.
Acknowledpiement/
-12-
Acknowled e.aent.
The author desires to express his gratitude to
Mr A. D. Buchanan Smith and Dr A. M. Smith for
t.eir valuable help, advice and criticism.
References.
(1) AZAI , E. 1938. A contribution to the study of the variations of protein content of cow's milk during lactation.
(2) TOC-R, J.F. 1925. Variations in the compo- sition of milk. Ais Majesty's Stationery Office.

IS THp PROTEIN' YIELD OF COW'S ;:iILK A HEREDITARY CHARACTER?
BY
E. Azarnie
Institute of Animal Genetics,
University of Edinburgh.

Contents. rage
Introduction 1
Material of work
Method of work 5
Analysis and interpretation of the data 5
Summary
Aef erenc e s 11
Introduction
Many enquiries have been made into the mode of
inheritance of total yield, fat content, and the fat
yield of the milk of dairy cows. Owing to the
complexity of the problem, many different methods
have been employed by various investigators and at
the present day there exists a huge and confuting
literature upon the subject. Smith and Robison
have done a critical survey of all the literature
existing up to 1933(1) . Smith has completed this
work in 1905 (2), (3), and more recently in 1937 (4).
Leroy has done a similar work in l:; 33 (3) . From a
carefull examination of these sources,it appears that
the present state of knowledge about the precise
mode of the inheritance _ ' milk and fat producing capacity is limited and may be sumviarised as follows:
A) bilk production.
(1) she capacity for milk production
is transmited from the parents to the of f springy.
(2) The capacity for milk production
is a complex/
-2-
plex character and cannot be considered as a simyle
Mendelian one.
This is all we know as -scientifically sand sound about the subject. ",;e know little of the
mechanism of this transmission. Llany bens of
different nature (dominant, homomeric, heterosis,
modifying, etc.) and of different number (3 pairs,
4 pairs, etc....) have bean thought to be involved
in the process by various investigators, but none of
the proposed hypotheses can explain the fact in its
entirety. The truth is that the problem is an
extremely complex one, the yield of milk being great-
ly influenced by environmental conditions, as Leroy
has pointed out "If is it possible to increase by
adequate nutrition the ;Meld of a single cow from
5,000 to 15,000 litres of milk, what is the figure
which may be taken as an index of the genetic value
of the animal 71 (5)
B) Butter-Fat.
Our knowledge about the heredity of butter -fat
production is even 1 ?oorer than for the heredity of
the milk itself. The greater part of the investi-
gations have been concerned not with the yield of
butter produced by cows, but with the percentage of
fat in their milk. It seems that the percentage of
fat in milk is also a hereditary character arñ is
transmitted/

transmitted independently from milk producing
capacity. It appears also that within certain
limits fat production is inherited independently
of total yield of milk. There is however a high
positive eo rre lati on between the two. Here again
we are ignorant of the mechanism of its trans-
mission and the various investigators do not agree
on the number of factors involved.
Smith (6) , in dealing with c uantitative characters
in plants, states that "They present particular
difficulty because heritable variations are masked
by larger non -heritable variations which make it
difficult to determine the genotypic values of
individual plants..." He also stresses that in
plant breeding the use of arbitrary ratios "are
likely to be ineffici_nt as indices to the genetic
value of either of the characters whose ratio is
observed. The same is true for quantitative
characters in animals, and the use of percentages
of fat in milk may not be as efficient as a separate
study of fat yield and milk yield would be. The
efforts of the investigators in this direction may
prove to be more fruitful in future than it has been
up to nog\:.
Hitherto no work has been accomplished
concerning/

-4-
concerning the heredity of the proteins of milk,
probably because the work in this direction is more
laborious than for the fat and less important
economically. nevertheless the proteins of milk
beside their body -building properties are used as
raw material in a great number of industries.
Accordingly it was thought worth while to study
whether the protein -production in cova s milk was
influenced by genetical factors. Hence a series
of investigations for this purpose was planned in
1936 and 1937. Owing to the extreme complexity of
the problem and the fact that the protein content of
milk is influenced by a great number of factors as
breed, age, stage of lactation, individuality of the
cow, etc....., it is not possible to analyse thorough-
ly the problem unless the investigation is carried on
for several lactations. But with the data already
available, it has been possible to draw some general
conclusions, not as results of a genetic experihient,
but only by inference.
L aterial of work.
Twenty seven cows were chose" at the fans of the
Institute. These oows were of different ages, and
at different stages of lactation. They were of the
following breeds:
3 Beef Shorthorn/

-5-
3 Beef Shorthorn
1 Dairy Shorthorn
2 Beef Dairy Shorthorn
2 Dairy Beef Shorthorn
2 Shorthorn A,Tthire
14 Ayrshire
3 Jersey
L ethod of work.
All the usual precautions were taken in the
collection of samples which were representative of
twenty four hours yield of individual cows and were
taken at intervals of seven days fmom each cow.
The percentage of total protein nitrogen was-de-
termined by precipitation by trichloracetic acid and
a K djeldahl digestion as described by Sanders (V >j.
The systematic errors of the experiment were
deter :fined by ten analyses carried out on the sai:e
sample of milk. The mean and the standard error of
these ten determinations were:
= 0.5921
= 0.0043
Analysis and interpretation of the data.
About 380 samples of milk were analysed: and
examined to find whether there were any relation
between/

-6-
between the yield of milk and the yield of protein.
A positive correlation of 0.951 was found between the
two variates. A priori a positive and high corre-
lation was to be expected between the two variates,
since the protein is part of milk and there is no
milk without protein. But such a high figure was no
anticipated owing; to the fact that with the same
data there was previously obtained a negative corre-
lation of 0.454 between the yield of milk and the
percentage of total protein nitrogen.
Figures 1 and 2 show the corresponding correla-
tion tables with all details concerning the tv.o
variates.
A careful examination of the Figure 1 suggests
two ideas:
(1) The yield of milk being so closely corre-
lated to the protein yield, one can le;;itiiately
think that they are both affected by the same cause
or causes. It is known that the yield of milk is
influenced by heredity, and this indicates that the
yield of protein is also influenced by heredity.
But this is only a hypothesis suggested by observa-
tion, and should not be considered as a proof.
(2) Further, Figure 1 shows that in the region
correspondin , to the high yields of milk (which is
called/

1
-A - tt
-. fI I . t. r . 1 . . . r r . t r + w r w ,itîli.i..`.T.i.i1'IT I,i i.i
Amraan of total ;retain .I.avpe cd.vt.tim. tram tL. ..m)
llü 1.
-4
_J
_t
-t
M
Jt
It M
.( IIf .t I.fr.1I
f t1 l
ile .
.11/ t
1 e IIM. e (1 .
Y ,afte
"Le .I
+13 !J ?1
e .-.t .af .ae. .NI.I .
aR are AN iM I
ilf .
a1f .!.' .:171t .471 aN
roreentage of total protein nitratera (deviations tram the .ew)
Fig. ú

-3-
called region 1) , the dots are rauch more scattered
than in region 2 corresponding to the low yields.
It means that if there were samples of milk corres-
ponding to the first region only, the correlation
coefficient would have been & aller than 0.951. Whereas with samples correspondu,; to the second
region only, the correlation coefficient would have
been greater than 0.951.
Considering that the samples in the region 1
belong generally to high milkers, that is to say
to genetically improved breads, and those in the
region 2 to poorer breeds, one feels inclined to
think that through the improvement of breads there
has a change in correlation. In
other words, the production of proteins sees to be
less closely dependent on the production of the milk
itself with advanced breeds than with poorer breeds.
Considering that through ages man has been selecting
cows only in respect of their yield of milk, without
any consideration as to the protein content of this
milk, it is reasonable to think that this dhange in
correlation is due to the effect of selection; and
this would mean that besides the causes mentioned
above, there are others of less importai ce which may
influence yield of milk without affecting protein
yield/

-9-
yield. Furthermore attention should be drawn to
the parallel relationship of fat and protein to total
yield of milk. Both fat yield and protein yield
show a high correlation with the yield of milk.
The majority of investigations on fat percentage show
a nul or negative correlation to the yield of milk.
The present study and the previous figures of Todaer
(81 both show a significantly negative correlation
bet% een protein nitrogen and the field of milk.
Now, both fat yield and percentage have been dno 1 to be heritable characters. It is therefore not un-
likely that the same may apply to the protein of milk.
With the present data it is not possible to go
further, but the work is being co nt i nae d and we may
hope it will throw some more light upon this complex
problem.
Summary
1) The present state of knowledge about the
inheritance of milk yield and fat is summarised.
2) The design of the present investigation with
material and method of work are briefly described.
3) From the analysis of 330 samples of milk and
examination of the correlation table between the
yield of milk and the yield of protein it is sugges-
ted: (1) that the yield of protein is inherited with
the yield of milk. (2) that there are caases which
may affect the yield of milk, without affecting the
yield/

-k0-
yield of protein.
It is emphasized that the above hypothesis are
suggested by obsrvation and should not be considered
as proof.
Acknowledgement s
The writer wishes to acknowledge his gratitude
to Professor F. A. E. Crew for the facilities re-
ceiveu at the Institute of Animal Genetics. He is
also indebted to Ur A. D. Buchanan Smith and to
Dr A. M. Smith for their valuable help and advice
throughout the work.

References.
(1) SMITH, A.D.B. and ROBISON, O.J. 1933. The Genetics of Cattle. Bibliogr. Genet. X.
(2) SMITH? A.D.B. 1935. The Inheritance of Produc- tivity in Farm Live Stock. II . Milk. Emp. J. exp. Agric.
(3) SMITH, A.D.B. 1935. Biennal Review of the pro- gress . of Dairy Science. III. Genetics. J. Dairy Res., 6, p. 272.
(4) SMITH, A.D.B. 1937. Biennal Review of the pro- gress . of Dairy Science. III. Genetics. J. Dairy Res., 8, p. 131.
(5) LEROY, A. 1936. Compte -renda des Travaux du Congrés de la Sélection An-imále.
(G) SLu.TH, H.F. 1936. A Discriminant Function for Plant Selection. Ann Eugen., 7, p. 240.
(7) SANDERS, G.P.T. 1933. The precipitation of ma proteins by means of trichloro- acetic acid. Jour. Assoc. Offic. AL.rie. Chem. 16 -140.
(8) TOCHER, J.F. 1925. Variations in the comnositio of milk. His Majesty's Stationery Office.

q4'' i ,l;y f
a

Results of analyses of o80 samples of milk
taken from 27 individuai cows at different stages
of lactation. Each sample is representative of the
whole milk given by each cow in 24 hours The
interval between two successive analyses of the
milk or the same cow is seven days. the methods
adopted for the analyses were:
Sanders's method for the total protein nitrogen
L :oir' s method for the casein nitrogen,
rilüumin + Globulin nitrogen was determined by
the difference.
ohe Gerber method was used for the detern.ination
of but .er -fat . This was done at the farm by
LIT T. Stoddart, . Sc . , the manager of the farm. Re
carried out his analyses not on samples representin
the 24 hours yield, but on samples taken. from each
milking of each cow during the eperiment.
writer converted his results by the f o_lowin, method
of computation into results for daily samples.
If A, ii, C are set respectively for the number
of pdunds of milk given by a cow in lier first,
second, and third milking; in a day, and a, b, c
respectively for the percentage of butler fat as
determined by la' T. S-coddart, tAD n the amount of
butter fat produced during the time in question,
expressed in pounds will be: F = tia + hb + Cc
100 and/

-l-
and the percentage of fat in a single sample repre- 100 F
seiiting the 24 hours ¡lets will be: + B + C.
The butter fat was determined in the same milk as
protein for the following purpose:
Knowing the percentage of fat and the specific
gravity of each sample, the use of Tocher's prediction
formulae (1) would make it possible to determine the
percentage of solids -not -fat in each sample, and
knowing this, it would be possible to have the per -
centage of lactose + ash by subtracting the percen-
tage of protein from that of solids -not -fat . The
use of Veith's Ratio and Sherman's formulae (2)
would then make it possible to determine the percen-
tage of ash and the percentage of lactose, and thus
to stady all the principal components of milk from
different angles as variations, heredity, etc
The writer did not have time to carry out this work.
It was also thought that it :night be possible
to determine whether pregnancy had any influence on
the composition of milk; the amont of the data so
far collected, however, was not judged to be
sufficient to permit of a statistical analysis i z
this respect.
Each one of the following pages contains the
information available for one cow. The particulars
concerning each cow are taken from the herd books
of the Institute. Observations on each cow are
given by &ír Stoddart, the farm manager.

aei erence s .
(1) l'vC:ILA, J.F. 1925. Variations in tha corlîpositio
of milk. -Jis :.:a<jestyTs 3tationary Office.
(2) DAVIS, (aeported by) . 1533. The chem-
istry of milk. Chapman Hal, London.

Proud Lustre
Breed: Beef/Dairy Shorthorn
Date of birth: 30/6/32
Date of last calving: 29 /3/37
Sire: Royal Airman
Observations:
Was not pregnant during the experiment
Was out to the grass from the 27/4
Was dried off on the 7/8
Date Líilk yield (lbs)
T.P.N . C.N. .I; .+G.N . Fat % y(lb) % y(lb) % y(lb) % y(lb)
1/4/37 33 .312 .202 .452 .149 .160 .053 2.5 .82
8/4 40 .486 .194 .392 .157 .094 .038 3.5 1.40
15/4 39.5 .427 .169 .346 .137 .031 .032 3.5 1.37
22/4 36 .319 .115. 3.6 1.30
29/4 31.5 .421 .133 .324 .102 .097 .030 2.8 .88
6/5 35.5 .427 .152 .338 .120 .089 .031 3.4 1.22
13/5 27 .459 .124 .367 .099 .092 .025 3.3 .89
20/5 32.5 .436 .142 .345 .112 .091 .029 2.6 .84
27/5 30.5 .464 .142 .374 .114 .089 .027 2.7 .84
3/6 23.5 .471 .111 .362 .085 .108 .025 2.5 .60
10/6 31.5 .463 .146 .351 .110 .111 .035 2.6 .82

Rothes Belle
Breed: Beef /Shorthorn
Date of birth: 5/2/32
Date of last calving: 21/3/37
Sire: Collynie Royal Autocrat
Observations:
Was not pregnant daring the experiment
Was out to the grass from tie 27/4
Was dried off on the 7/8
Date ialk yield Clbs),
T.P.N. C.N. A.N.+G.Ii. Fat % y(lb) % y(lb) % y(lb) w y(lb)
25/3/37 43.5 .592 .258 .469 .204 .123 .053 3.7 1.53
1/4 48 .512 .246 .409 .196 .102 .049 3.2 1.53
8/4 49.5 .437 .216 .354 .175 .083 .041 3.1 1.54
15/4 46.5 .433 .201 .341 .158 .092 .042 2.7 1.28
22/4 43 .409 .176 .309 .133 .100 .043 2.7 1.18
29/4 40 .405 .162 .318 .123 .087 .035 3.4 1.36
6/5 37 .422 .156 .336 .124 .086 .032 3.1 1.15
13/5 40 .442 .177 .352 .141 .090 .036 3 1.21
20/5 37.5 .482 .181 .388 .145 .094 .035 2.3 .88
27/5 38.5 .453 .174 .359 .138 .093 .036 3.3 1.25
3/6 34.5 .470 .162 .365 .126 .105 .036 2.7 .94
10/6 31.5 .457 .141 .341 .107 .117 .037 3.9 1.22
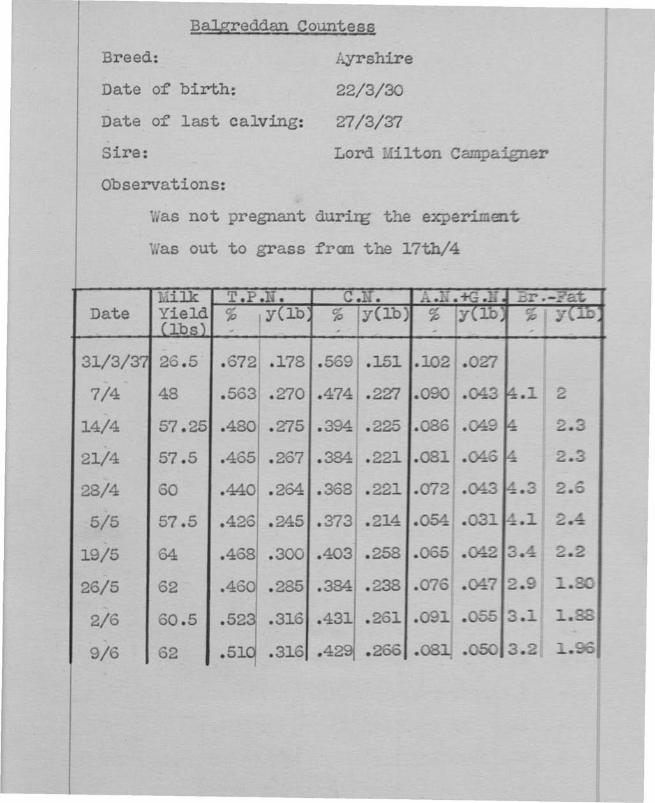
Ba],greddan Coantess
Breed: Ayrshire
Date of birth: 22/3/30
Date of last calving: 27/3/37
Sire: Lord ililton Campaigner
Observations:
',ias not pregnant during the experiment
',;as out to grass fron the 17th /4
;.i1k T.P.N. C.ïï. , ..+.. _ = .-_W
Date Yield % y(lb; % y(lb) %;¡(lb) z Y.--) . Clbs),
31/3/37 L].:. .372 .178 .569 .151 .1021.027
7/4 48 .563 .270 .474 .227 .090!.043 4.1 2
14/4 57.25 .480 .275 .394 .225 .086 .34 4 2.3
21/4 57.5 .465 .267 .384 .221 .081 .C46 4 2.3
28/4 ô0 .440 .264 .368 .221 .072 ¡ .043 4.3 2.6
5/5 57.5 .426 .245 .373 .214 .054 .031 4.1 2.4
19/5 64 .468 .300 .403 .258 .065 .042 3.4 2.2
26/5 62 .46 .235 .384 .238 .076 .047 2.9 1.30
2/6 60.5 .523 .316 .431 .261 .091 .055 3.1 1.88
9/6 62 .510 .316 .429 .266 .081 .050 3.2;, 1.96

Auchenbrain Bunty 66
Breed: Ayrshire
Date of birth: 3/11/30
Date of last calving: 9/3/37
Sire: Lyonston Douglas 25768
Observations:
t, "as not pregnant during the experiment
out to grass from the 17/4
Takes milk fever each year after calving
Was in heat in the 25/5
Date :.:ilk
Yield sibs)
T.P.I. C.N. A.N.+G.AF Fat >;
-
,r(lb) % y(lb) % y(lb) -
y(lb)
13/3/3" 37.25 .580 .216 .486 .181 .094 .035
24/3 43.5 .476 .207 .388 .169 .087 .038
30/3 47 .453 .213 .336 .181 .068 .032 4.3 2.33
6/4 50 .440 .220 .370 .185 .070 .035 3.5 1.75
13/4 51 .420 .214 .362 .185 .058 .029 3.5 1.78
20/4 43.5 .430 .209 3.3 1.60
27/4 49.5 .403 .202 .330 .167 .071 .035 3.? 1.84
4/5 47.5 .440 .209 3.8 1.83
11/5 49.75 .464 .231 .383 .190 .081 .040 3.9 1.94
18/5 48 .460 .221 .403 .193 .057 .027 3.5 1.70
25/5 33 .462 .163 .404 .145 .058 .021 2.1 .76
1/6 45 .451 .203 .380 .171 .071 .032 4.4 .20
8/6 46.5 .462 .215 .394 .183 .068 .0324.1 1.93

P ejr
Breed: Shorthorn /yrshire
Date of birth: 1/1/32
Date of last calving: 15/3/37
Sire:
Observations:
'.:as out to the grass from the 27/4
',;as not pregnant during the experiment
';aterloo Hero
Date lii1k' yield (1bs).
T.P.N. C.N. ñ.Iï.+Gx. Fat % -
y(lb) % y(lb; % y(lb) % y(lb)
2/4/37 40.5 .455 .184 .391 .158 .063 .025 3.7 1.5
9/4 41.0 .425 .176 .357 .148 .068 .028 3.6 1.49
16/4 42 .442 .186 .372 .156 .070 .029 2.9 1.
;3/4 37.5 .420 .157 .350 .135 .061 .023 3.4 1.26
30/4 33.5 .450 .151 .373 .125 .076 .025 2.9 .0E
7/5 33.5 .404 .135 .334 .112 .070 .023 3.6 1. 21
14/5 41.5 .433 .130 .369 .153 .064 .026 3.5 1.45
.1/5 41 .503 .206 .400 .164 .103 .042 2.1 .38
28/5 42.5 .451 .192 4.2 1.77
4/6 44.5 .464 .206 .380 .164 .084 .037 3.6 1.J-
11/6 41 .452 .185 .368 .151 .085 .035 3.6 1.5C

Meg Ramsay
Breed: Beef Shorthorn
Date of birth: 26/5/34
Date of last calving: 23/1/37
Sire: Royal airman
Observations:
as out to the grass from the 27/4
gas not pregnant during the experiment
Date I ïilk ielr
(lb-
T.P.N. ;:
.
y(lb) C.N.
% .
y(lb) A.N.+G.N. % .
y(lb) Fat
% -
f(lb;
18/2/37 -- . , .475 .113 .400 .095 .075 .018 L.7 .90
25/2 25 .145 .111 .394 .092 .051 .C13 2 . 2 .24
d/3 .463 .117 .388 .093 .100 .024 3.7 .90
11/3 2_ .473 .105 .385 .085 .091 .020 4. .S5
18/3 20 .--/171 .094 .398 .080 6073 .015 3.o .86
25/3 L... .477 .0:3 . 393 .077 r 084 .016 3.4 .69
1/4 20 .482 .006 .399 .080 .082 .016 3.5 .62
8/4 20 .480 .096 .404 .081 .076 .015 3.8 .71
15/4 lá . L .461 .090 .397 .077 .064 .012 4.2 .74
/4- 17 .468 .030 .390 .C- .078 .013 4.2 .72
_/4 17 .482 .082 .403 .035 .080 .014 4.3 .71
/5 17-3 .491 .091 .405 .075 .086 .016 4.0 .30
13/, 18.L .500 .094 .427 .070 . 082 .015 4.2 .75
20/, 15.3 .525 .082 .440 .06S .088 .014 2.9 .66
27/5 10 .514 .093 .418 .0W. .0S6 .O1S 3.9 .56
3/3 1:,.3 .527 .100 .431 .034 .096 .019 0.9 .77
10/6 17 .505 .033 1.01

Dreaming Lass
Breed: Jersey
Date of birth: 27/10/33
Date of last calving: 19/1/37
Sire:
Observations:
' as served on the 25/4/37, is pregnant
',ias out to the grass froh 1/5
Sybil's Crown Prince
Date i.ilk yield los)
T.P.N. C N. A'' rat y ; y lb cp y 1 p y
17/2/37 12 .487 .058 .391 .047 .097 .012 2.8 .34
24/2 29.5 .493 .145 .409 .120 .084 .025 3.7 1. 09
3/3 26 .484 .126 .410 .106 .074 .019 4 1.03
10/3 26.25 .478 .125 .386 .101 .092 .024 3.8 1.01
17/3 24 .457 .110 .354 .085 .102 .024 4.6 1.1C
24/3 21.5 .460 .099 .381 .082 .079 .017 3.6 .78
31/3 21.5 .469 .101 .318 .068 .150 .032 3.9 .84
7/4 18.5 .462 .085 .388 .072 .074 .014 3.8 .71
14/4 18 .469 .084 .382 .069 .088 .016 3.7 .67
21/4 17.5 .455 .080 .347 .061 .108 .019 3.8 .67
28/4 15.5 .484 .075 .392 .061 .092 .014 4.2 .65
5/5 17 .505 .086 .386 .066 .119 .020 4.3 .74
12/5 17.25 .498 .086 .407 .070 .091 .016 4.5 .77
19/5 17.5 .552 .097 .458 .080 .094 .016 4.3 .75
26/5 15 .550 .082 .447 .067 .103 .015 4.3 .64
2/6 12.5 .555 .069 .456 .057 .099 .012
9/6 13.25 .570 .075 .467' .062 . .104 .014, 4.4 .58

Breed:
Caldaria
Jersey
Date of birth: 5/4/33
Date of last calving: 16/1/37
Sire: Seymour Royal Lad
Observations:
Was not pregnant during the experiment
Was out to grass fron the 1/5
One of the quarters is useless, mastitis
setting in.
Date Milk yield (lbs)
T.P.N. C.R. b.X.+ Y.' Eat ; y(lb) p y(lb) p ylb) % y(2);
L7/2/37 27 .549 .148 .406 .110 .144 .039 1.7 1. 27
14/2 25.5 .517 .132 .416 .106 .101 .026 1.1 1.06
3/3 . ; .439 .120 .416 .102 .073 .018 3.6 .89
0/3 . .531 .099 .425 .098 .105 .024 3.7 .86
17/3 -1.5 .427 .092 4.0 .87
34/3 18.75 .546 .102 .445 .083 .101 .019 4.7 . ôó
1/3 20 .527 .105 .428 .086 .099 .020 4.2 .85
li .372 .040 .435 .030 .092 .010 7.8 .55
14/4 !,.- .530 .056 .441 .046 .089 .009 4.3 .45
21/4 12 : . 4 81 .088 .396 .047 . 084 .010 5.8 . 70
28/4 11.3 .311 .059 .471 .054 .040 .005 4.3 .50
5/5 10 .184 .048 .430 .043 .055 .005 5.1 .51
12/5 12.73 .496 .063 .409 .052 .088 .011 4.9 ."7.,':
19/5 13 .519 .067 .420 .055 .099 .013 5.1 . _ ;
26/5 13 .521 .068 .440 .057 .081 .010 3.5 ._5
2/6 15 .543 .081 .437 .065 .106 .016 4.3 .65
i
9/6 11.5 .539 .078 .446 .064 .093 .014 4.9 .7l.

Gay Lustre
Breed: Beef /Dairy Shorthorn
Date of birth: 24/6/32
Date of last calving: 12/1/37
Sire: Royal Airman
Observations:
Was served on the 1/6/37
'.as out to the grass from 27/4
Was dried off on the 17/7
Date Líilk yield CIbs)
T.P.N. C_ .N. A.N.+G.N. Fat 5; Alb,' w y(Ib) 5; y(lb) % y(lb)
18/2/37 42.5 .425 .181 .343 .146 .081 .034 3.4 1.47
25/2 44 .431 .190 .336 .148 .095 .042 2.7 1.20
4/3 43.5 .432 .13S .340 .148 .092 .040 3.0 1.33
11/3 40 .443 .170 .348 .139 .101 .040 3.5 1.40
18/3 38.5 .442 .17: .353 .136 .095 .036 3.2 1.23
25/3 34 .447 .152 .346 .118 .101 .034 3.3 1.12
1/4 31 .441 .137 .336 .104 .105 .032 3.5 1.10
8/4 31 .452 .140 .343 .106 .108 .033 3.4 1.00
15/4 29.5 .467 .13S .345 .102 .122 .036 3.2 .86
22/4 27.5 .463 .127 .359 .09: .104 .029 3.3 .91
29/4 22 .442 .097 .321 .071 .120 .026 3.6 .80
6/5 22.5 .452 .102 .341 .077 .110 .025 3.4 .76
13/5 22 .476 .105 .370 .381 .106 .023 3.5 .77
27/5 23 .503 .113 .375 .086 .128 .029 3.0 .3 :.
3/6 17.5 .509 .089 .387 .063 .122 .021 2.S .30
10/6 14.5 .504 .073 .354 .051 _.150 .022 2.3 .41

Mrs Liollison
Breed: Shorthorn /;rshire
Date of birth: 4/7/32
Date of last calving: 7/2/37
Sire: Royal Airman
Observations:
Was out to the grass from the 27th/4
Was not pregnant during the experiment
Was dried off on the 7/8
Date Liilk Yield (lbs)
T.P.N. C.N. a.iti.+G.I±. _Fat % -
y(lb) ; -
y(lb) % y( lb) 5, y(lb)
2/4/37 27.5 .496 .136 .366 .100 .130 .036 3 .84
9/4 25.5 . 45 2 .115 .364 .093 . 087 .022 3 . 4 .87
13/4 24 .424 .102 .346 .083 .077 .018 3.3 .79
23/4 :23.5 .436 .10'2 .336 .079 .101 .024 3.4 .79
30/4 20.5 .448 .092 .356 .073 .091 .019 3.7 .76
7/5 22.5 .449 .101 .361 .081 .088 .020 3.6 .82
14/5 :25.5 .453 .156 .358 .091 .095 .024 3.6 . 92
21/5 _:3.5 .509 .12C .414 .097 .094 .022 2.8 .37
28/5 17.5 .460 .08C .358 .063 .102 .019 4 .70
4/6 33.5 .492 .116 .411 .096 .082 .01,-; 3.3 .S4
11/6 20.5 .494 .101 .406 .083 .088 .018 3.2 .35

Auchenbrain Bloomer
Breed: Ayrshire
Date of birth: 6 /11/31
Date of last calvirg: 3/12/36
Sire: Lyonston Douglas 25768
Observations:
Was served on the 2/4/37, is pregnant
',;as out to grass from the 17/4
i)ate 121ík Yield (lbs)
T % y01)
G.1í. y(lb)
G 'y(lb)
. Br.-rat p y(lb;
16/2/37
23/2
2/3
9/3
16/3
23/3 U
30/3
6/4
13/4
20/4
27/4
4/5
11/5
18/5
25/5
1/6
8/6
46.5
46.5
44.5
43.5
36.5
34.5
34.5
35.C;
32
26.2b
28
27
32
29
28.3
31
. 535 .249
. 415 .193
. 417 .186
. 450 .19E
.431 .166
.452 .156
.446 .154
.430 .153
.445 .142
.440 .124
.418
.449
. 445
.489
.467
.468
.481
.117
.121
.130
.156
.135
.133
.149
.429
.344
.353
.351
.356
.377
.356
.367
. 355
.325
. 353
.348
.464
.372
.367
.199
.160
.157
.153
.137
.130
.123
.130
.114
.099
.091
.095
.102
.148
.106
.114
.106
.071
.063
»099
.075
.075
.090
.063
.090
.090
.093
.096
.097
.025
.096
.113
.04
.033
.028
.043
.029
.026
.031
.022
.029
.025
.026
.026
.028
.008
.0 n7
.035
3.4
3.4
3.9
4.5
3.4
3.6
3.9
2.8
3.5
3.1
3.1
3.3
3.3
3.4
3
3.6
4.4
1.58
1.59
1.72
1.95
1.32
1.24
1.36
1.00
1.12
.89
.88
.89
.96
1.08
.S7
1.02
1.36

ROSEBUD
Breed: Dairy Shorthorn
Date of birth: 31/10/31
Date of last calving: 8/11/36
Sire: Ruby Prince
Observations:
;as served on the 19/1
;as out to the grass from the 27/4
'. ;as dried off on the 17/7
Date Milk yield lbs
T.P.N. C.11. ti.N.+G.N. Fat p y(lb) y (lb, %
-
y(lb; % y(lb)
18/2/37 40 .470 .183 .393 .157 .076 .030 3 1.20
25/2 41 .484 .198 .404 .166 .081 .033 1
2.9 1.19
4/3 41 .508 .208 .418 .171 .090 .037 3 1.25
11/3 31 ,526 .163 .426 .132 .100 .031 3 .94
18/3 36 .499 .18C .413 .149 .086 .031 3.2 1.15
25/3 31 .514 .159 3.5 1.09
1/4 29 .532 .154 .443 .128 .089 .026 3.5 1.03
8/4 30.5 .510 .155 .414 .126 .096 .029 3.4 1.04
5/4 30.5 .486 .148 .405 .123 .082 .025 3.3 1.01
'2/4 28 .508 .142 .412 .115 .096 .027 3.5 .99
5/4 23 .502 .117 .403 .093 .099 .023 3.3 .76
6/5 18 .492 .089 .390 .070 .102 .018 3.8 .69
13/5 22 .537 .118 .442 .097 )95 .021 3.6 .79
)0/5 27 .547 .148 .454 .122 .093 .025 2.6 .70
7/5 25.5 .525 .134 .430 .110 .095 .024 3.6 .93
3/6 22 .535 .118 3.9 .85
10/6 19 .542 .103 3.7 .70

Mary Ramsay
Breed: Dairy/Beef Shorthorn
Date of birth: 26/6/33
Date of last calving: 10/11/36
Sire: Waterloo Hero
Observations:
Was served on the 19/4/37
Was out to grass from 27/4
Was dried off on the 5/6
-Li lk Date ;,yield
albs)
19/2/7 17
26/2 17.5
5/2 17.5
12/3 16
19/3 14
26/3 15
2/4 13.5
9/4 16.5
13
3/4 12
30/4 12
7/5 11
14/5 12
21/5 13.5
28/5 12.5
4/6 12
.P :IT . C.N. ti.11-.+Gar, Fat
.493
477
.500
.492
.513
.472
.493
. 482
.457
.460
.513
.504
. 500
.536
y(lb,
.034
.083
.080
.069
.069
. 078
.Oû4
.055
.055
.051
.062
. 068
.062
.063
.412
. 415
.359
.422
.406
.413
,-, . s['.O
.383
.409
.399
. 385
.394
.413
. 409
.400
.417
y(lb) y(lb)
.070 .081 .014
.073
.063 .118 .021
.067 .078 .012
.057 .086 .012
.062
.057 .086 .012
.063 .090 .01
.053 .084 .011
.048 .034 .010
.046 .072 .009
.043 .066 .007
.050 .097 .O151
.055 .096 .013
.051 .091 .011
.050 .119 .014
3.3
3.5
3.7
3.7
5.8
3.9
3.7
3.7
3.7
4
4.1
3.4
3.7
2.4
4.3
3.1
YC, .56
.61
. 65
. 59
.81
.58
.50
.62
.48
.48
.49
.38
. 44
.32
.30
.37

Cockburn Bunny
Breed: Ayrshire
Date of birth: 7/11/33
Date cf last calvi n: 4/10/36
Sire: Carnell Selection
Observations:
;ras served on the 11/1/37
and on the 26/2/37
Was out to grass from the 17/4
Date yielc (lbs;
T_P_rI_ C . A.N.+G.1F Fat Y(lb] % Y(-b % y(lb % Y(7b)
17/2/37 :5 .556 .139 .488 .122 .O'B .017 4.1 1.03
24/2 34 .679 .163 .473 .113 .207 .050 3.9 .94
3/3 25.75 .585 .151 .483 .124 .102,.026 .7 .90
10/3 22.5 .607 .137 .481 .1Cá .126 .028 6.2 1.41
17/3 20.5 .539 .121 .488 .100 .101 .021 4.9 1.01
24/3 10.75 .608 .120 .505 .100 .103 .020 4.3 .85
31/3 19 .595 .113 .493 .094 .102 .019 4.5 .86
7/4 1::.5 .590 .115 .477 .093 .113 .022 4.2 .83
14/4 19.75 .582 .115 4.6 4.0 ..,1
21/4 19.5 .516 .101 .478 .093 .035 .008 4.6 .L,0
28/4 .545 .087 .451 .072 .094 .015 5 .80
5/5 16.5 .545 .000 .461 .076 .085 .014 4.7 .78
12/5 18.25 .553 .101 .455 .033 .098 .018 4 .73
19/5 17.5 .585 .102 .485 .085 .100 .017 4.2 .73
26/5 20 .547 .109 .451 .090 .096 .019 4 .81
2/6 20.5 .574 .118 .471 .097 .103 .021 4 .82
9/6 19.5 .594 .116 .391 .076 .202 .039 4.2 .82

Consolation
Breed: Dairy /Beef Shorthorn
Date of birth: 25 /2/33
Date of last calving: 4/10/36
Sire: ;aterloo Hero
Observations:
'kas served on the 3/7/37
; ;as out to the grass on the 27/4/37
Had abortion during her first calving.
Date Liilk yield (lbs)
T.P.N. C.N. - A.iti.+G.11T. Fat % y(lb) y(lb) á y(lb) * To Y(lb)
19/2/37 26 .503 .131 .393 .102 .110 .029 3.3
I
.86
26/2 23 .498 .139 .399 .112 .099 .028 3.2 .91
5/3 24 .465 .112 .402 .096 .062 .015 3.3 .80
12/3 21 .492 .103 .400 .084 .092 .019 3.6 .75
19/3 21.5 .480 .103 .378 .081 .102 .022 5.8 1.24
26/3 19.5 .466 . 091 .385 .075 .081 .016 3.6 . 71
2/4 20.5 .500 .102 .392 .080 .108 .022 3.4 .70
9/4 21.5 .468 .101 .372 .080 .095 .020 3.5 .76
16/4 19.5 .495 .097 .392 .076 .103 .020 3.5 .69
23/4 19 .496 .094 .392 .074 .104 .020 3.7 .70
30/4 16.5 .489 .081 .356 .059 .133 .022 4.2 .69
7/5 17.5 .470 .084 .363 .063 .115 .020 3.7 .65
14/5 20 .533 .107 .432 .086 .101 .020 3.8 .76
21/5 23 .504 .116 .394 .090 .110 .025 3.6 .84
28/5 18 .485 .087 .371 .067 .114 .020 3.5 .63
4/6 16.5 .524 .086 .403 .066 .121 .020 3.6 .59
11/6 17 .502 .035 2.8 .48
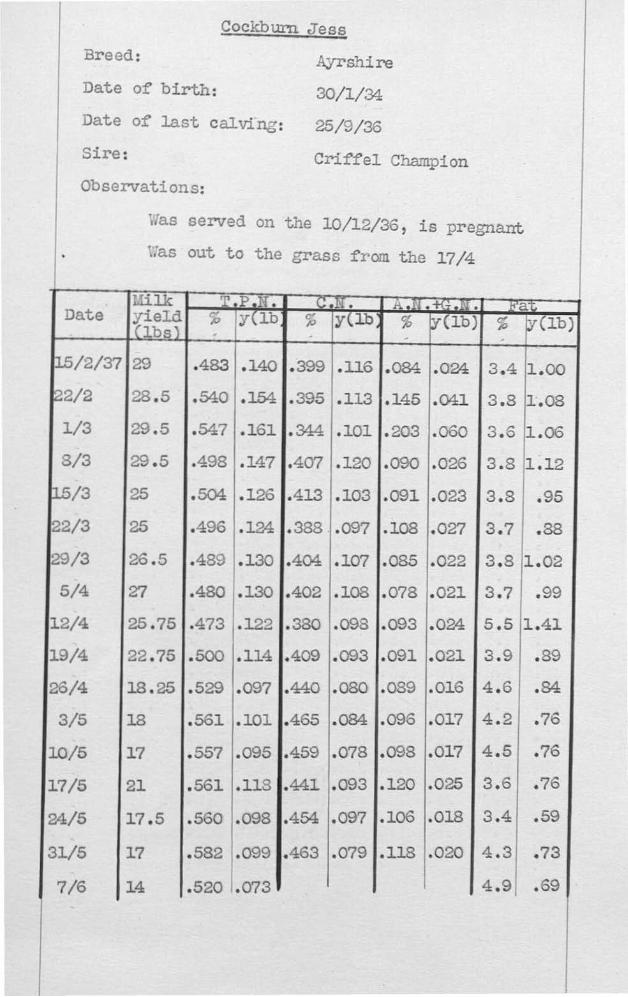
Cockburn Jess
Breed: Ayrshire
Date of birth: 30/1/34
Date of last calving: 25/9/36
Sire: Criffel Champion
Observations:
',gas served on the 10/12/36, is pregnant
;as out to the grass from the 17/4
Date Líills
;jield (lbs)
T1P`1`i. CS. ,..11.+(11. ;'at % Jrl(1b, Ñ y(lb; w y(lb) % y(lb)
15/2/37 29 .483 .140 .399 .116 .084 .024 3.4 1.00
22/2 28.5 .540 .154 .395 .113 .145 .041 3.8 1.08
1/3 29.5 .547 .161 .344 .101 .203 .060 3.6 1.06
3/3 29.5 .498 .147 .407 .120 .090 .026 3.8 1.12
15/3 25 .504 .126 .413 .103 .091 .023 3.3 .95
22/3 25 .496 .124 .383 .097 .108 .027 3.7 .38
29/3 26.5 .489 .130 .404 .107 .085 .022 3.8 1.02
5/4 27 .480 .130 .402 .108 .078 .021 3.7 .99
12/4 25.75 .473 .122 .380 .098 .093 .024 5.5 1.41
19/4 22.75 .500 .114 .409 .093 .091 .021 3.9 .89
26/4 18.25 .529 .097 .440 .080 .039 .016 4.6 .84
3/5 18 .561 .101 .465 .084 .095 .017 4.2 .76
10/5 17 .557 .095 .459 .078 .098 .017 4.5 .76
17/5 21 .561 .113 .441 .093 .120 .025 3.6 .76
24/5 17.5 .560 .098 .454 .097 .106 .018 3.4 .59
31/5 17 .582 .099 .463 .079 .118 .020 4.3 .73
7/6 14 .520 .073 , 4.9 69

Cockburn Bloomer
Breed: Ayrshire
1 Date of birth: 18/6/34
Date of last calving: 24/9/36
Sire: Carnell Selection
Observations:
Was not pregnant during the experiment
Was out to grass from 17/4
Had two teats out of use as a result of
mastitis.
Date bilk yield Clbs)
p Y(lb; c' Y(lb y(lb) p y(lb)
16/2/37 15.5 .516 .080 .419 .065 .097 .015 4.1 .63
23/2 14 .523 .073 .423 .059 .100 .014 4.3 .60
2/3 15.5 .540 .084 .470 .073 .070 .011 4.1 .64
9/3 11.75 .537 .063 .442 .052 .095 .011 4.7 .55
16/3 12.25 .514 .063 .416 .051 .098 .012 4.6 .56
23/3 15 .508 .079 .424 .066 .084 .013 3.7 .58
30/3 12.5 .524 .065 .439 .055 .085 .011 4.2 .52
6/4 14 .505 .071 .381 .053 .123 .017 4.5 .63
13/4 12 .509 .061 .418 .050 .092 .011 3.4 .41
20/4 10.5 .469 .049 .380 .040 .089 .009 4.4 .46
27/4 8 .500 .040 .394 .031 .106 .008 ,.
6.7 .54
4/5 10 .507 .051 .411 .041 .096 .010 6.6 .66
11/5 10 .516 .052 .398 .040 .117 .012 5.2 .52
18/5 11 .509 .056 .387 .043 .121 .013 3.8 .42
25/5 12 .531 .064 3.7 .44
1/6 10 .406 .041 3.3 .33
8/6 10.75 .528 .057 .418 .045 .1101.012 3.8 .41

Balgreddan Jess
Breed: Ayrshire
Date of birth: 10/4/31
Date of last Calvin :16 /9/36
Sire: Chapelhill Emperor
Observations:
;as served on the 22/12/36, is pregnant
' as out to grass from the 17th/4/37
Date Liilk
Yield lb
' T.p.py,
Ñ C.N. A.+ G.Id, Br.-Fat
y(lb) % y(lb) % y(lb) % y(lb
15/2/2,7 40 .462 .185 .396 .158 .067 .027 3.5 1.41
í2/2 37.5 .443 .13 .362 .136 .081 .030 3.2 1. 21
1/2 38.25 .571 .218 6382 .146 6189 .072 2.9 1.11
8/3 40 .448 .179 .376 .150 072 .C29 3.3 1.34
15/L; ,35 .460 .161 .403 .141 .056 .02C 3.5 1.22
22/3 33.5 .459 .154 .394 .131 .065 .022 4 1.34
29/3 33 .475 .171 .369 .133 .105 .038 3.4 1.21
5/4 33 .443 .150 ,366 .132 .077 .028 3.4 1.24
13/4 35 .438 .153 .360 .126 .078 .027 3.6 1.28
19/4 32.5 .435 .141 .366 .119 .069 .022 2.7 0.88
26/4 28.5 .454 .129 .335 .104 .089 .025 3.9 1.12
3/5 29.5 .478 .141 .390 .115 .038 .026 4.4 1.31
10/5 31.5 .506 .159 .416 .131 .090 .028 3.2 1.01
L7/5 33.6 .562 .138 ax 1.26
24/5 23.5 .535 .14,, .415 .110 .120 .032 3.6 .96
31/5 28 .559 .157 .440 .123 .119 .033 4.4 1.24
7/6 24.5 .573 .140 .460 .113 .112 .0274 .98
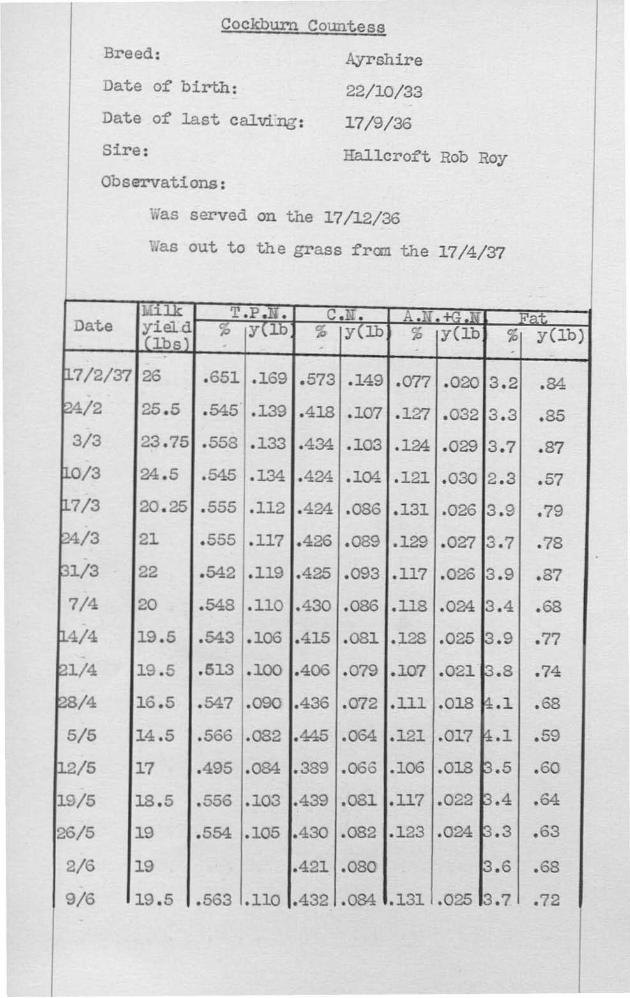
Cockburn Countess
Breed: i rshire
hate of birth: 22/10/33
Date of last calving: 17/9/36
Sire: lcroft Rob Roy
Observations:
Vas served on the 17/12/36
',ias out to the grass from the 17/4/37
Date I.1 ilk yield (lbs)
T.P.N. C.N. ti.T1.-Ks.Id Fat cA; y(lb; 5,, y(lb % y(lb % y(lb)
7/2/37 26 .651 .169 .573 .149 .077 .020 3.2 .34
4/2 25.5 .545 .139 .418 .107 .127 .032 3.3 .85
3/3 23.75 .558 .133 .434 .103 .124 .029 3.7 .87
0/3 24.5 .545 .134 .424 .104 .121 .030 2.3 .57
7/3 20.25 .555 .112 .424 .086 .131 .026 3.9 .79
"4/3 21 .555 .117 .426 .089 .129 .027 3.7 .78
1/3 22 .542 .119 .425 .093 .117 .026 3.9 .87
7/4 20 .548 .110 .430 .086 .113 .024 3.4 .68
14/4 19.5 .543 .106 .415 .081 .128 .025 3 . 9 .77
21/4 19.5 .513 .100 .406 .079 .107 .021 3 . 8 .74
28/4 16.5 .547 .090 .436 .072 .111 .018 4.1 .68
5/5 14.5 .566 .082 .445 .064 .121 .017 4.1 .59
12/5 17 .495 .084 .389 .066 .106 .018 3.5 .60
19/5 13.5 .556 .103 .439 .081 .117 .022 3.4 . 64
26/5 19 .554 .105 .430 .082 .123 .024 3.3 .63
2/6 19 .421 .080 3.6 .68
9/6 19.5 .563 .110 ,.432 .084 ..131 .025 ,3.7 .72

Cockburn Gladys
Breed: Ayrshire
Date of birth: 19/12/33
Date of last calving: 14/9/36
Sire: Hallcroft Rob Roy
Observations:
rias served on the 12/1/37, is pregnant
' as out to the grass from the 17/4
Date lalk
t1-351 ield
T.P. . C.1í . A.1r.+G.ir.- Pat ; -
ylb) y
`.; y(Ib) -
x -
y(ib) y(lb)
16/2/2" 31.25 .525 .134 .440 .137 .035 .026 3.5 1.00
23/2 32.5 .513 .171 .416 .130 .097 .032 3.6 1.21
2/3 33 .517 .171 .432 .142 .035 .028 3.5 1.15
9/3 32 .554 .17 7 .441 .141 .113 .036 2 . 5 .801
13/3 IL .538 .081 .431 .065 .107 .016 3.7 .55 Ch L4
23/3 28.25 .534 .151 .438 .124 .096 .027 3.7 1.04
30/3 30.5 .527 .161 .436 .133 .091,.028 3.7 1.13
6/4 31 .522 .162 .423 .131 .100 .031 4 1.2-_;
13/4 29.75 .560 .167 .444 .132 .116 .034 3.7 1.11
20/4 29 .432 .125 3.0 1.12
27/cl 25 .533 .134 .433,.108 .105 .026 4.1 1.02
4/5 27.5 .545 .150 .448i.123 .096 .027 3.9 1.07
11/5 27 3 .560 .154 .451 .124 .110 .030 3.6 1. 00
13/5 32.5 .573 .186 .394 .128 .179 .058 3.4 1.12
25/5 30.5 .562 .171 .452 .138 .110 .033 3.5 1.07
1/6 24.5 .545 .134 .440 .108 .105 .026 3.7 .92
3/6 30.5 .569 .174 .459 .140 .109 .033, 3.6 1.10

Cockburn Líagpie
Breed: Ayrshire
Date of birth: 3/2/34
Date of last calving: 3/9/36
Sire: Criffel Champion
Observations:
Was served on the 25/1/37, was pregnant during the experiment
Was out to the grass from the 17/4
Date J .P N.
y(1b1 C . A . . r, .lú . zat
y( ) y(lb) y(lb)
15/2/37 29 .487 .141 .418 .121 .068 .020 4.2 1.21
1/3
3/3
15/3 26.00 .518 .135 .446
22/3 25.5 .511 .130 .436
29/3 23.75 .495 .127 .434
3/4 25.25 .460 .116 .427
12/4 24 .477 .114 .406
10/4 19.5 .133 .096 .416
26/4 18.75 .516 .097 .443
3/5 17 .506 .086 .443
10/5 21 .528 .111 .413
17/5 21.5 .533 .115 .448
24/5 25 .542 .135 .461
31/5 24 .560 .134 .434
7/6 22.5 .544 .122 .461
27.50 .552 .152 .461 .127 .091 .025 4.3 1.12 26.25 .484 .127 .480 .113 .054 .014 4.2 1.11
.116 .072 .019 4.4 1.14
.111 .075 .019 4.4 1.12
.111 .061 .016 4.4 1.13
. 107 .033 .008 1.2 1.07
.097 .071 .017 4.2 1.02
. 031 .077 .015 3.3 .75
. 033 .073 .014 4.6 .36
.075 .033 .011 -LS .32
.094 .030 .017 4.7 .03
.096 .085 .013 3.3 .73
.115 .080 .020 4.0 .99
. 116 .076 .018 4.5 1.0S
.104 .034 .019 3.3 .35

Ba1,greddan LIa pie
Breed: Ayrshire
Date of birth: 16/3/31
Date of last calvir: 28/3/36
Sire: Chapelhill Emperor
Observations:
Was served on the 18th/5/37
and 12th /6/37
.as out to grass from 17/4/37
This cow has always had a tendency to a delay in
howin oestrus period, and is already one lactation
behind cows of the saTm age. Injection of prolan
and wheat germ oil had no effect. Good health.
Date bíilk 'ï i e ld
T. .1;. C. i. -A.N.+G.N. Fat Ú (lb '. :" f Cib ) á ; ì
15/2/37 30 .573 .172 .501 .150
_y(lb)
.072 .022 3.8
,Alb
1.15
22/2 31 .480 .149 .474 .147 .005 .020 3.5 1.06
1/3 28.5 .551 .124 .479 .136 .072 .020 4.4 1.27
3/3 29 .608 .176 .528 .153 .080 .023 4.4 1.28
17/3 '6.5 .572 .152 .444 .118 .128 .034 6.5 1.80
22/3 27.5 .644 .177 .524 .144 .120 .033 4.4 1.20
29/3 25.73 .606 .156 .511 .132 .095 .024 4.2 1.08
5/4 26.5 .594 .157 .510 .135 .084 .022 4 . 4 1.17
12/4 ''0 .592 .113 .510 .102 .082 .016 3.8 .77
19/4 20.25 .605 .123 .493 .100 .113 .023 4 .81
26/4 18.25 .632 .115 .525 .096 .107 .019 4.8 .88
3/5 15.5 .633 .098 .564 .087 .069 .026 5.2 .80
10/5 18.5 .621 .115 .521 .096 .100 .018 4.6 .86
'M/5 _7 .541 .145 .462 .124 .079 .021 2.9 .78
31/5 22 .521 .115 .436 .096 .085 .019 2.9 .63
7/6 22.75 .525 .119 .421 .096 .104 .024, 4.2 .95

Wonderful Standards s Carrie
Breed: Jersey
Date of birth: 20/3/32
Date of last calving: 20/8/36
Sire: Wonderful Standard
Observations:
Was served on the 29/10/36
Was out to grass fron the 1/5/37
Date Líilk T.P I, C.N. A.P.+G.N. Fat yield (lbs
; -
y(lb) % -
y(lb) p -
y(lb) % -
y(lb)
22/3/37 14.75 .627 .092 .524 .077 .103 .015 6.2 .91
29/3 17 .628 .107 .516 .088 .112 .019 5.9 1.00
5/4 16 .626 .100 .524 .084 .102 .016 5.6 .89
12/4 16 .540 .086 .481 .077 .060 .010 5.9 . 94
19/4 15 .644 .097 .507 .076 .136 .020 6.5 . °7
26/4 13 .601 .078 .501 .065 .100 .013 5.9 .77
3/5 14.25 .630 .090 .530 .075 .100 .014 4.8 .70
10/5 15 .647 .097 .538 .081 .109 .016 6.3 .95
17/5 16.5 .637 .105 .519 .085 .117 .019 4.8 . 80
f1.4/5 15.5 .654 .101 .530 . 08 2 .124 .019 5.2 . 81
31/5 18 .652 .117 .537 .097 .115 .021 4.9 .89
7/6 16 .655 .105 , .548 .088 .107 .017 5.6 .90
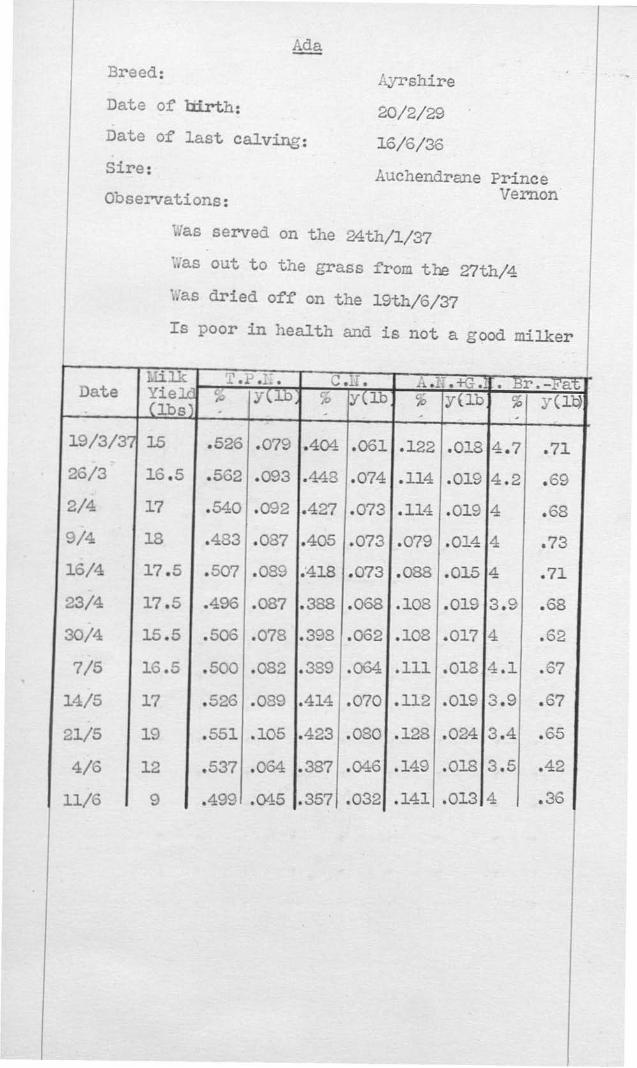
Ada
Breed: Ayrshire
Date of birth: 20/2/29
Date of last calving: 16/6/36
Sire: Auchendrane Prince
Observations: Vernon
Was served on the 24th/1/37
Was out to the grass from the 27th/4
Was dried off on the 19th/6/37
Is poor in health and is not a good milker
Date Milk Yield (lbs1
_., .1 .: V .11 . A .Ia .+-, i . Dr.-Fat ;,"(-w; ;-,, y(lb `,0 y Elb, % ;;-(lb)
19/3/37 15 .526 .079 .404 .061 .122 .01a 4.7 .71
26/3 1u . _ .562 .093 .443 .074 .114 .019 4.2 .69
2/4 17 .540 .092 .427 .073 .114 .019 4 .68
9/4 .433 .087 .405 .073 .079 .014 4 .73
16/4 17.- .507 .0a, .418 .073 .088 .015 4 .71
23P. 17.5 .496 .087 .388 .068 .108 .010 3.9 . 68
3v/,L 13.5 .506 .075 .398 .062 .108 .017 4 .62
7/5 13.5 .500 .082 .389 .064 .111 .018 4.1 .07
14/5 17 .526 .082 .414 .070 .112 .019 3.9 .67
21/5 19 .551 .105 .423 .080 .128 .024 3.4 .05
4/6 12 .537 .064 .387 .046 .149 .018 3.5 .42
11/6 . .492 .043 .357 .032 .141 .013 4 .36
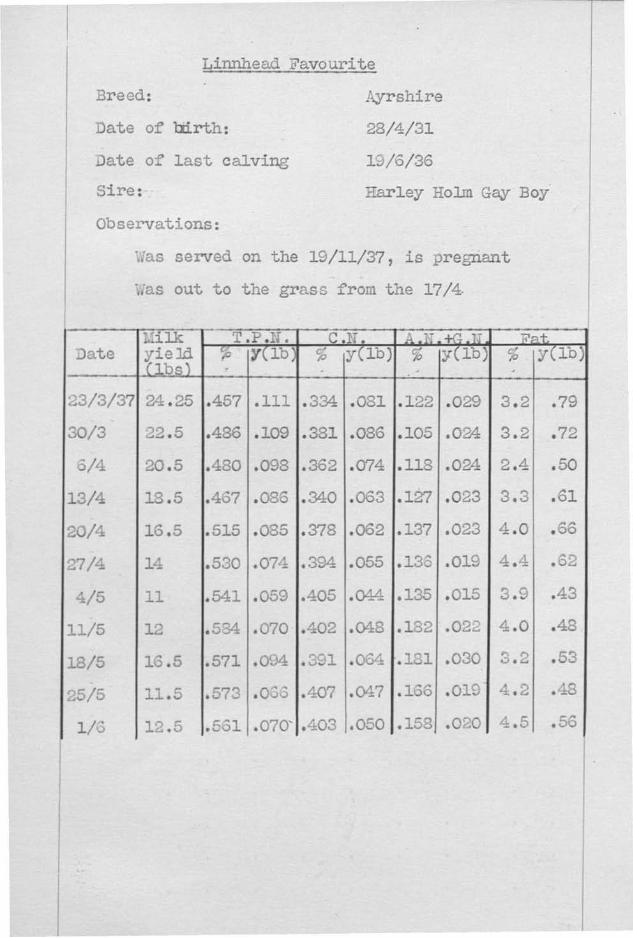
Linnhead Favourite
Breed: yrshire
Date of lairth: 28/4/31
Date of last calving 19/6/36
Sire: Harley Holm Gay Boy
Observations:
Was served on the 19/11/37, is pregnant
Was out to the grass from the 17/4.
Date Talk yield C1b s )
2.P.14. C.IIs .i .I1, Pat ; y(lb) y(1 ) % y(lb)
23/3/37 24.25 .457 .111 .334 .031 .122 .029 3.2 .79
30/3 32.5 .486 .109 .331 .036 .105 .024 3.2 . 72
5/4 20.5 .480 .098 .362 .074 .118 .024 2.4 .50
13/4 13.5 .437 .086 .340 .063 .127 .023 3.3 .61
20/4 16.5 .515 .085 .378 .062 .137 .023 4.0 .66
27/4 14 .530 .074 .394 .055 .13:; .01 4.4 .3:
4/5 11 .541 .059 .405 .04/1 .135 .015 3.9 .43
11/5 12 .534 .070 .402 .048 .132 .022 4.0 .43
13/5 16.5 .571 .04 .3G1 .064 .121 .030 3.2 . 33
25/5 11.5 .573 .03 .407 .047 .136 .010 4.2 . -
1/3 12.5 .531 .070'.403 .050 .153 .020 4.5 .__

Bat reddan Gladys
Breed: Ayrshire
Late of birth: 12/3/31
Date of last calving: 15/4/36
Sire: Chapel hill Emperor
La e Líilk "'e d
T.P.N. C.N. A.+ G.N. Fat ; 0.117MO .1 hr7IRMI
16/2/37 14 .644 .090 .517 .072 .126 .018 3.9 .55
23/2/37 13.5 .614 .083 .519 .070 .096 .013 3.6 .49
2/3/ 10 .661 .066 .542 .054 .119 .012 4 .40

Keepsake
Breed: Beef Shorthorn
Date of birth: 26/2/30
Date of last calving: 17/6/36
Sire: Cairossie Achilles
field (lbs)
T.P.N. I
Ñ
19/3/37
26/3
8
4
.511
.634
.041
.025
/0
C.17 .
y(lbf A.Id.+G.1V .
/0 y(lbs Fat J'\Ib5
358 .028 .155 .012 3.9 .31
.458 .018 .176 .007 4.7 .19