Embed Size (px)
Citation preview

On Analysis and Forecastingof Skills Demand and Supply,on Real Local Labour Markets
· Approaches and Rationale· Effective and Affordable Tools
May 2014
JobTown Learning Module n. 3 August 2014

This document has been written by Ian Goldring,Lead Expert of the JobTown URBACT network anddirector of ProjectWorks association and:
Kieran Ferran, City Data Manager, OxfordEconomics, UK
Antonina Michalska-Sabal, Research specialist,Regional Labour Office in Krakow - Labour Marketand Education Observatory of Małopolska, Poland
CODESPAR, Conseil de Dévelopment Économiqueet Sociale du Pays et de l’Agglomération de Rennes,France
Anke Heckmann, Association ZukunftsregionWestpfalz (Future West Palatinate), Germany
Dr. Anna-Elisabeth Thum, Associate ResearchFellow at the Centre for European Policy Studies(CEPS) in Brussels, Belgium
And the partners of the JobTown URBACT network
2
About this Learning Module p. 4
Oxford Economics Skills Forecasting Tool 6
Two Polish Initiatives: Adapting the Occupational Barometer, and Monitoring Youth on the Labour Market 8
Rennes’ CODESPAR: development and forecasting, through diversity and involvement 16
Demographic challenges in Germany and the use of the Labour Market Monitor/ Arbeitsmarktmonitor 18
Web crawling to Analyse Labour Markets, Using online Job Vacancies – A Growing Practice 22
Concluding remarks 26
Table of contents 3
JobTown is a network of 11 localities across Europe, co-financed bythe European URBACT programme for promoting sustainable urbandevelopment.The JobTown network believes that youth unemployment, pooremployment and inactivity need to be understood as structuralproblems pre-dating the economic crisis (though severely worsenedby it), and as such must be treated by systemic approaches.The network understands efforts for the creation of youthemployment and opportunities, and local development strategies, asultimately two sides of the same coin.In keeping with the URBACT approach, each JobTown locality hasestablished a Local Support Group, as a basis for developingsustainable Local Partnerships.http://urbact.eu/ http://urbact.eu/en/projects/active-inclusion/jobtown/homepage/

About this Learning Module4
This publication is about what local authoritiescan do to better understand their local labourmarkets, so as to better serve their residents andto guarantee that their own policymaking besoundly knowledge-based.
It stems from and builds on JobTown’s 3rd
Transnational Workshop, held in Rennes inFebruary 2014 and dedicated to building thecapacity of attending towns, to carry out theirown labour market analysis and forecasting.
What’s a ‘local’ labour market?
When discussing ‘local labour markets’ in thispublication, we are referring not to the specificconfines of an administrative area (e.g. theboundaries of municipality, borough, county etc.),but rather a functional definition – i.e. thegeneral area in which their residents move aboutfor work or job seeking.
A local authority, and its partners need tounderstand this local labour market – i.e. analysisof current skills demands, job profiles etc. – andwhere things are going – i.e. forecasting skillsdemand and identifying trends.
Why are skills so important?
In of itself, the term ‘skills’ can refer to a range ofthings, from the more formal (e.g. qualificationsas a medical doctor, electrician etc.), to what aretermed ‘soft’ or ‘generic’ skills (e.g. teamwork,time management, so-called ‘people skills’, etc.).
Kieran Ferran, of Oxford economics provided uswith this definition of ‘skills’, in the trainingsession he led in the Rennes Workshop (seeabove):
“Attributes that make employees effective andproductive in their roles… an ability andcapacity acquired through deliberate,systematic, and sustained effort to smoothlyand adaptively carry out complex activities orjob functions involving ideas (cognitive skills),things (technical skills), and/or people(interpersonal skills).”
The available skill supply in any given locality isfundamental to making an advanced economypossible in that place and to making that placecompetitive. Globalisation only meanscompetition is growing – coming not just fromother EU cities, regions and mobile labour, butpotentially from anywhere in the world.
A low wage ‘race to the bottom’, is one in whichEuropean communities can only lose, in varioussenses. Skills are key to escaping any suchdownward spiral and thus to Europeans enjoyingthe kinds of lives and places they want.
Productive, high value added economies – i.e.that are attractive to investment, competitiveexporters and/or strong in sectors with highgrowth potential – all depend on adequate supplyof the right skills. There are no strategies basedon innovation and R&D without thecorresponding skills. Places and people with theright skills earn more and experience lessunemployment.
What do you use labour market analysis for?
Local authorities and the partners – employers,employment-related bodies and organisations,other levels of government or neighbouringcommunities – use the results of labour marketanalysis and skills demand forecasting for a rangeof inter-related purposes.
Having complete and reliable information, allowsan administration to provide useful careersadvice to young (and not so young) people. Itallows a public administration, and providers oftraining and education, to decide what sort oftraining and education mix to offer or plan for,and what investments to make. All this allows forskills shortages and mismatches (people withskills and qualifications unrelated to the jobs thatare actually on offer) to be reduced or avoidedaltogether.

Having the tools at their own disposal,allows local authorities to be independentof other providers of information, and toseek out the kind of information within thekind of timeframe that best suits their ownneeds.
All too often, local actors depend on informationfrom a regional or national body, which is ofteninexact regarding their specific local situation(the data being aggregated to a larger area,and/or the questions asked not being quite thesame ones the local authority would wantanswered) and delayed in reaching them,possibly to the point of being outdated.
Without access to the right information, on time,and without the ability to conduct their own locallabour market analysis, an administration isunable to provide guidance to others or make itsown decisions and planning in full light of thefacts.
The publication
The following publication does not set out toprovide an exhaustive inventory of possible toolsand approaches to labour market analysis andforecasting or make any blanketrecommendations (other than the obvious ‘doanalysis and forecasting’) for all localities.
Rather, it presents a range of tools andapproaches – requiring different degrees oftechnical capacity, covering different timeframesand suitable for different purposes. Some ofthem are tools that are ready to be adopted andused right away by other administrations, andothers are more narratives of a given city’sexperience that can serve to help other placesform a view of what’s best for them.
The endgame is to support and encourage cities,and their stakeholders, to take action to buildtheir own capacities – leading to betterunderstanding and more effective actions andpolicies in favour of employment, growth andyoung people.
5

Oxford Economics Skills Forecasting Tool
Summary: A labour market analysis and forecasting tooldesigned specifically for use by localauthorities, to focus on local/sub-regional labourmarkets, and provide long-term projections onthat level.It’s a free ‘off-the-rack’ tool, flexible and easilyadaptable, and not requiring significant technicalskills.
Background OxfordEconomics1 – aninternational, UK-based, advisory servicescompany, specialised in economic forecasting andmodeling – has produced this tool for analysinglocal labour markets. Initially commissioned for thepurposes of ESIMeC, a now wound up URBACTnetwork; the tool has been made freely availableto any local administration that wishes to makeuse of it.
The Skills Forecasting Tool:How it works:The computer tool comes in the form of atemplate Excel file, accompanied by a User Guidewhich walks the user through the various steps,explaining what type of data to plug in where, andso forth. Only moderate computer proficiency isneeded.However, the execution of the digital tool comeswrapped in a larger process, involvingstakeholders, exchange, revision, and
communication actions. This larger picture is thecomplete tool.The process around the tool:• Effective collaboration is key. The process
includes a broad range of stakeholders – i.e.employers, education & training institutions,employment agencies, students and theunemployed.
• Results are shared via ongoing discussion, withsaid stakeholders, and their feedback iscontinually incorporated. This iterative processhones the forecasting and strengthenscredibility.
• The answers produced in response to keyquestions are communicated – e.g. Will therebe skill shortages or surpluses in future? If so, inwhich sectors? What will the impact be? Inwhat timeframe? What would need to be donedifferently?
• Forecasting results are regularly updated – aneconomic environment, especially at city level,can change quickly, making forecasts outdated.
• Outcomes are continually contrasted withtheir forecasts, so as to make improvements inthe methodology.
Why pick this tool:• It’s user friendly• It’s open, transparent and adaptable• It complements other analyses and models of
future skill needs – using it is not an ‘either/or’choice
6
1 http://www.oxfordeconomics.com/about-us

• It improves understanding of the forecastingprocess
• Fundamentally: It helps the city administrationwork and plan more effectively
Uses of forecasting outputs:• Fundamentally: Understanding and balancing
future skills supply and demand• Determining long-term skill needs in quite
specific labour markets• Reducing education and training mismatch with
labour market needs• Collaborating with education providers and
helping them respond to future skills needs• Coordinating skill actions and efforts towards
the same skill goals• Better matching the skills of the unemployed
with labour market needs• Material to share with stakeholders, to drive
discussion etc.Limitations and risks:By using such a tool, a city administration shouldbe able to know more rather than less – and thusbe better equipped to act and plan – however it isimportant to manage expectations by makinglimitations clear to participants and users.• Data quality and availability – results are
limited by the accuracy and detail of the datautilised.
• Missed linkages and contextualisation – e.g.detailed sector studies may be done in isolationfrom the rest of the economy, thus not takinginto consideration pertinent factors.
• Claims and perception may differ from truth– e.g. Employer surveys may produce biased
responses; it can be difficult to distinguishbetween what employers want and need.
• The non-quantifiable – it can be difficult toquantify or ensure representativeness, inqualitative consultations with employers andsector experts.
• The unknowable – you may need to consultwith tomorrow’s employers not just today’s.
• Margin of error – forecasts are not predictions;they are about probabilities and the direction oftrends, not certainties.
How to begin using the tool:A blank template of the forecasting tool, with aUser Guide at the end, is available here:https://projectworks.files.wordpress.com/2015/01/template.xlsxA sample output from the tool – based on the UKcity of Basingstoke, in Excel format – is availablehere:https://projectworks.files.wordpress.com/2015/01/example.xlsx ESIMEC skills forecasting manual:http://urbact.eu/uploads/tx_projectsresultsdocuments/Skills_forecasting_manual_01.pdf
Kieran Ferran, the tool’screator (this chapter isbased on material providedby him) and City DataManager at OxfordEconomics’ London office, ishappy to help cities withusing the tool and can becontacted here:kferran@oxforde conomics.com
7
Past and likely future trends in employee jobs by sector, UK city of Basingstoke
Kieran Ferran, CityData Manager, OxfordEconomics

Two Polish Initiatives: Adapting theOccupational Barometer, and MonitoringYouth on the Labour MarketExecutive summaryThis article presents two youth-related labourmarket monitoring good practices, implementedin the Małopolska region (Poland).The first is the successful adaptation of theOccupational Barometer – a short-term (one-year) forecast of demand for occupations – tothe needs of this Polish region.The Barometer offers a qualitative method forgathering information on workforce demand byoccupations, is suitable for analysing local labourmarket, and is a flexible system that can usevarious types of indicators and be used by peoplewith different profiles and levels of expertise.The second –“Model for monitoring thesituation of young people on the labourmarket” – is a statistical tool, describing acomposite of key factors – e.g. demography,unemployment/employment, education,family or living conditions, allowing forcomparisons of position and careerprospects of youth in different Polishregions.The tool provides a holistic view andintroduces qualitative factors.The author presents background,methodology and results of these twostudies and considers if and how theycould be transferred to other Europeanregions.
1) Adapting theOccupational Barometer in Poland
1.1. Background
The Occupational Barometer originates inSweden. Its methodology was developedin the 1990s as an element of a broadersystem for forecasting changes in thelabour market. The forecasting wasintended to provide information toemployment policymakers andinstitutions offering services toemployers and the unemployed. In 2007,
the OccupationalBarometer was adapted bythe public employmentservice in south-westernFinland. Since then, theFinnish have managed toextend the survey andapply it with successthroughout the country. In2009, the staff of theLabour Market andEducation Observatory ofMałopolska learnt aboutthe Barometer during astudy visit to Turku. In thatsame year, a pilot surveywas carried out in theMałopolska Region, in
8
BALA
NCE
DDE
FICI
TSU
RPLU
S
Administration and offi ce clerksAgricultural workersAgriculture and forestry engineersBricklayersCaretakersChemical engineers and chemistsCleaners and room serviceConfectionersConstruction techniciansConstruction workersCooksEconomistsEducational counsellorsElectric trades techniciansEnvironmental engineering engineersEnvironmental protection professionalsFinance professionals
Food and nutrition technology professionalsGardenersGeologists, geographers and geophysicistsHandicraft workers in leather and related materialsIT techniciansKitchen helpersLandscape architectsMachinery mechanics and repairersManual workersMechanical engineering techniciansMotor vehicle mechanics and repairersPainters and related building trades workersPassenger car driversPolitical scientists, historians and philosophersPostal clerksPotters and glaziersPre-school teachers
Primary education teachersPublic administration professionalsReceptionistsSalespeople and pos operatorsShoemakersSociologists and social/economic surveys professionalsStationary plant and machine operatorsStock clerksTailors and clothing manufacturersTeachers of general subjectsToolmakersTravel consultants and clerksVisual and related artistsWaiters and bartenders
Occupational Barometer 2014Małopolska
“The Occupational Barometer” is a survey coordinated by the Labour Market and Education Observatory of Małopolska – a project of the Regional Labour Offi ce in Kraków. The survey was done by staff of local labour offi ces in Małopolska in the 4th quarter of 2013. It is a forecast of the demand for labour in 2014. The situation in certain occupations may change due to unforeseeable developments.
Accounting and bookkeeping clerksApplied IT professionalsArchitects and urban plannersArchivists and curatorsAutomation and robotics engineersBackhoe loader operatorsBakersBeauticiansBiologists, biotechnologists, biochemistsBoiler operatorsBus driversButchersCar body paintersCement and stone machine operatorsChemical products plant and machine operatorsChildmindersClearing and forwarding agentsComputer system administratorsConcrete placers, concrete fi nishers and related workersConstruction engineersConstruction installation assemblersConstruction joiners and carpentersConstruction managersConstruction supervision inspectorsCrane, hoist and related plant operatorsCultural organisersDance and eurhythmics instructorsDatabase designers and administratorsDentistry assistants and techniciansDentistsDriving instructorsEarthmoving and related plant operatorsEducators in educational and care institutionsElectric arc weldersElectrical engineersElectrical mechanics and electrical assemblersElectronic and telecommunications techniciansElectronic assemblersEU project coordinators
Financial and investment advisersFinishing work technologists in building tradesFloor layersFloristsFood production plant and machine operatorsForeign language teachersGas weldersGlaziers and window fi ttersGraphic and multimedia designersHairdressersHandicraft workers in wood and joinersHuman resources and recruitment professionalsICT system analysts and operatorsInsurance agentsInvoicing clerksJournalists and editorsLaundry workersLawyersLibrarians and related information professionalsLifting truck operatorsManagersMarketing and sales professionalsMechanical engineersMedical doctorsMedical imaging and therapeutic equipment techniciansMetal processing plant operatorsMetal working machine tool setters and operatorsMidwivesMIG/MAG weldersNursesOccupational therapistsPanel beatersPapermaking plant operatorsParamedical practitionersPaversPharmacistsPhotographersPhysiotherapy technicians and assistantsPlant and machine operators and assemblers
PlasterersPlumbers and pipe fi ttersPostmen and package deliverersPrinting trades workersProduct and garment designersProduction workersProtective service workersPsychologists and psychotherapistsPublic procurement professionalsPublic relations and advertising professionalsReal estate professionalsRoofers and sheet metal workers in building tradesRubber and plastic machine operatorsSafety and quality professionalsSales managersSecretariesSocial work professionals caring for the elderly and disabledSocial workersSoftware developers and website designersSpecial school teachersSport and recreation instructorsStall and market salespersonsStonemasonsStructural-metal preparers and erectorsSurvey and market research interviewers and telemarketersSurveyors and cartographersTeachers for practical vocational trainingTeachers of vocational subjectsTIG weldersTrade representativesTranslators, interpreters and other linguistsTravel guidesUpholsterersVan driversVehicle cleanersVeterinariansWood and metal painters and varnishers
Automotive diagnosis techniciansChefs
Finance and accounting staff with knowledge of foreign languages
HGV driversIndependent accountants
The publication cofi nanced by the European Union from the European Social Fund
Article contributed byAntonina Michalska-Sabal, Researchspecialist, RegionalLabour Office inKrakow - LabourMarket and EducationObservatory ofMałopolska, Poland.
(All photos andgraphics in the articlecourtesy of Ms.Michalska-Sabal)

collaboration with six local labour offices. Since2010, the “Occupational Barometer” has beenutilised throughout Małopolska – the only Polishregion using this tool to date.
1.2. Methodology
The Occupational Barometer is a short-term(one-year) forecast of demand for occupationsin the Małopolska Region. It is done through thecooperation of Regional Labour Office andlocal labour offices in Małopolska2. The forecastis developed for each county by local labouroffice staff in the form of expert panels. Thepanel members are: placement officers, career
four to eight people. One meeting usually takesup to 3 hours. The deliberations of the panelmembers on the situation in each of theoccupational fields provide answers to thefollowing questions:• How is the demand for employees in the
occupation concerned going to change in thecoming year? Is it going to grow or decrease?Or maybe it will remain unchanged?
• What is the relationship going to be betweenthe labour force and the demand foremployees in the occupation concerned? Willthere be a deficit or a surplus of job seekers?Or will demand and supply balance out?
On the basis of these deliberations, the panelexperts qualify jobs into three groups:Deficit occupations, in which it should not bedifficult to find a job in the coming year since thedemand from employers will be high, combinedwith a low supply of labour willing to take upemployment and having the right qualifications,Balanced occupations, in which the number ofvacancies will be close to the number of peoplecapable of, and interested in taking upemployment in the occupation concerned (thesupply and demand sides will be balanced),Surplus occupations, in which it might be moredifficult to find a job because of the low demandand numerous candidates willing to take upemployment and meeting the employers’requirements.In their assessment, the experts use data on thenumbers of vacancies and people registered as
9
2 The region is divided into 22 counties, where 21 local labour offices operate.
counsellors, people in charge of relations withemployers or the organisation of training events,as well as EURES (European EmploymentServices) assistants and job club leaders.In Krakow, the forecast is compiled byemployees of the Labour Office for the City ofKraków and representatives of privateemployment agencies. Engagement of privatesector representatives in the region’s capital wasnecessary, as they play a quite significant role inthe market for job placement services. In smallercounties local labour offices are main actors whooffer this kind of service and have the mostextensive knowledge of supply and demand forworkers.The forecasts are made for each countyindividually and for the whole of Małopolska.They are formed in late autumn, by groups of

unemployed in the particular occupation. Theyalso take account of situations where, in anoccupation, most vacancies will be forinternships. This data, however, is only auxiliaryin its nature. Statistical data does not provide a completepicture of the situation in the labour market.Indeed, it does not answer questions as whethera person who declares having skills in a particularoccupation is actually capable of doing the job tothe required standard, and if so, on the terms andconditions offered by the employer. Neither doesit indicate whether the employer is willing to hiresuch a person and if not, why (problem ofqualifications, job experience, expectations as tothe pay, etc.).Local labour office statistics will not answer suchquestions. Rarely are these issues touched uponin classical questionnaires either. As such,information gathered by labour office staff,which goes beyond statistics, is of greatimportance. Staff knows, for instance, which ofthe vacancies are notified repeatedly, wherethere is high turnover of employees and whatthe reasons are. They are also aware of theseasonality of employment, and the impact ofthis factor on the labour market statistics.However, the greatest advantage of theBarometer is that it can take into accountemployees’ qualifications and their actualpreparedness to perform the occupation. Havingonly information about the number ofunemployed registered in the occupation, one isunable to establish whether they are reallycapable of taking up employment – i.e. whetherthey have the right qualifications and thesupporting certificates, whether they areexperienced enough and willing to take up thejob.The Barometer incorporates all these factors anduses them to describe a supply and demandrelationship that is much closer and truer to thereality of a given local labour market. The expertssupplement basic data with their own localknowledge, as to whether the unemployed arecapable of, and willing to take up employment –whether they are equipped with the right skills,qualifications and certificates validating it,whether they have the relevant occupationalexperience, etc.
The panel members assess only thoseoccupations that are present in the local labourmarket. If there is no such occupation locally orthey lack awareness of it, they leave it out – thatis why the list of occupations included in theforecast for a county may be shorter than themaximum (of approximately 170 items). The fulllist of occupations for assessment was developedon the basis of statistical data (vacanciesreported to the local labour offices) and expertopinion.The occupational categories differ slightly fromthose of the current Polish Classification ofOccupations and Specializations3. The names ofprofessions have been adapted to the commonlanguage used by employers and job seekers,with a view to being more accessible for bothgroups.The expert panel work in each of the counties isthen followed up by the creation of theOccupational Barometer for the Małopolskaregion, which is compiled by aggregating theinformation gathered within the different countypanels.
1.3. Utility
The Occupational Barometer has been employedin various contexts in Małopolska. The results ofthe forecast are used above all by the staff oflocal labour offices – career counsellors andplacement officers. They are useful in their dailywork with the unemployed and job seekers,when they need to explain local labour market jobprospects.The Barometer also serves as basic orientationfor choosing training courses for theunemployed in local labour offices. It is popularamong job seekers and young graduates, who aresearching for employment on their own, anduseful for those employed considering reskilling.As a means to compare a given local situationwith that of neighbouring counties, theBarometer can facilitate the mobility of workers(cross-county and cross-border).Likewise, in the context of limited resources,officials have to choose which training coursesto finance each year, and the OccupationalBarometer guides that decision, towards coursesfor deficit professions with more chances ofresulting in employment.
10
3 The Polish Classification of Occupations and Specializations is based on ISCO standard.

Employers, for their part, are interested in theinformation it produces, as a means tounderstanding what the available resources in thelocal labour market are (i.e. with whatoccupations they might have recruitmentproblems).The Regional Labour Office, being an institutionimplementing the European Social Fund, usesthe Occupational Barometer as a criterion forproject assessment, which in turn influencestraining policy in the region4.It’s also worth mentioning that the OccupationalBarometer has proved to be an attractiveproduct for external users, particularly the media,as it provides information that is clear, coherent,up-to-date and easy to understand, regardingthe circumstances of a given local labour market.
1.4. Concluding remarks
The Occupational Barometer can be easilytransferred, regardless of the structure of alabour market-related administration. Itsmethodology is easy and the study itself costslittle money and time. The main success factor isselection of appropriate experts, who areknowledgeable about supply and demand issuesin the labour market in question. The “Occupational Barometer – Małopolska”website was launched in 2013, for informationaland promotional purposes. The portal presentsthe results of the Occupational Barometer surveyin graphic form, contributing to ease ofunderstanding and analysis. It was designed as auser-friendly tool, easy to use and consult what
skills profiles are in demand in a given county inthe year concerned.The website provides all occupational demandforecasts from 2010 to 2014. Different sectionspresent data differently – e.g. the “Maps”section provides forecasts of demand for oneselected occupation, presented on maps of theMałopolska Region. One can thus compare howthe situation differs county to county, andcompare forecasts over a two-year period. Thewebsite enables easy download of data instandard PDF and excel files, as well as theprinting of survey results directly from the site.The site also facilitates forecast preparation; theLogin panel, used by the experts, allows them toupdate data by filling in a form. An administratorcan also make accessible the statistical data onjob offers and the unemployed, which serves asbackground information during a clientassessment.
For more information
On the Polish use:http://barometr.obserwatorium.malopolska.pl/en/cms/showpage/3 Regarding the original Finnish Barometer, onwhich the Polish one was based, contact:Jouni Marttinen, Senior Foresight Advisor atCentre for Economic Development, Transportand the Environment (ELY Centre) for SouthwestFinland, whose organisation is willing to helpother countries adopt the system. [email protected]
http://www.ely-keskus.fi/en/web/ely-en/ Documents: Creating Finland’s Occupational Barometershttps://projectworks.files.wordpress.com/2014/10/finish-occupational-barometer2010214.docx Interview with Marttinenhttps://projectworks.files.wordpress.com/2014/10/interview_marttinen_2012-05-23.docx Observatory Workshop outcome:https://projectworks.files.wordpress.com/2014/10/ob_workshop_outcome_-15102014-2.docx Recent Observatory results posterhttps://projectworks.files.wordpress.com/2014/10/ob_workshop_outcome_-15102014-2.docx
11Limitations:It’s limitations all have to do with the quality,types and availability of data to feed into the tool– e.g. problems like:• Different reporting periods• Different levels of data aggregation• Delays in the publication of data• Availability of data segmented by age groups, orby region and locality
• Information gaps• Reliability of data concerning migration (e.g.emigration is frequently less documented thanimmigration)
• Continuity – e.g. where you have ‘one off’ ESFfinancing to conduct a survey.
4 Those projects offering training courses in deficit occupations were given additional points and had greater opportunitiesfor coofinancing.

2. Model for Monitoring the Situation of young people on the Labour Market
group had to check the accessibility of data frompublic statistics. Then, the concepts involvedwere worked on in a set of workshops, resultingin six fields for analysis being selected:
Core (key) indicators:• Unemployment• Youth employment
Context indicators:• Education• Demography• Family and living conditions • Social activity
Then for each field of study, descriptiveindicators were chosen. The original set wascomposed of more than sixty indicators, selectedon the basis of the statistical data available andworking group members’ opinion.
Next, a set of potential indicators was submittedto experts for evaluation, in the form of anInternet questionnaire, and the final list waslimited to the most crucial measures.
The final list of indicators included:• Employment rate of young people• Average total monthly gross salary• Unemployment rate of young people• Share of long-term unemployed young people
in total population of the same age• Early leavers from educational system• Average monthly disposable income per
person in the household and more7.
The next step in the analysis was to reduce thecomplexity of the model, by limiting the numberof indicators to the most relevant ones, and bycreating one synthetic (composite) indicatordescribing the overall situation of young people.
12
5 The working group leader is Regional Labour Office in Białystok.6 The European Network on Regional Labour Market Monitoring (ENRLMM), based in Frankfurt, Germany, is the main
referent at European level, for regional and local labour market analysis. It brings together institutes, organisations andcompanies from 26 countries all over Europe – i.e. research institutes, university departments, state/regional agenciesand ministries, etc. The idea for this tool arose from a 2011 ENRLMM conference, and was then developed and implemented in Malopolska,Poland, by the Regional Labour Office in Cracow (a member of ENRLMM).For more information visit: http://www.regionallabourmarketmonitoring.net/
7 Dąbrowska Edyta, „Model for the monitoring of young people’s situation in the labour market”; Regional Labour Office inBiałystok; 2014, p. 26.The report is available at:http://www.obserwatorium.up.podlasie.pl/uploads/upload/Monitoring_YOUTH/2014PL/Model_for_the_monitoring.pdf
2.1. BackgroundThe Model for monitoring the situation of youngpeople on the labour market was developed incooperation with seven Regional Labour Officesin Poland, among these the Regional LabourOffice in Krakow5. The idea of such a workinggroup, established in 2011, arose during one ofthe meetings of the European Network onRegional Labour Market Monitoring6.
With the labour market situation for youthworsening throughout the EU, there is/was aneed for information of good quality, with whichto design effective policies and interventions. Afundamental problem is that the data on youngpeople’s situation is generally diverse anddispersed, coming from different sources. Assuch, it is often incomparable – not onlybetween countries but also on the regional levelin one country.
Accordingly, there is the need to unify theindicators for monitoring the situation of youth,in the regional, national and European contexts.The role of the working group of Polish labourmarket institutions was thus to identifypossibilities for indicators comparable across thePolish regions, as well as across Europe. The latterobjective has proven elusive. The group’s workwas mainly concentrated on the statistical modelfor Polish regions. An effort was also made todevelop a transnational model in partnership withthe German Federal Employment Agency inBerlin, however the transnational model ran intoconsiderable limitations (see chapter 2.3.).
2.2. MethodologyThe first step in the development of the modelwas data overview. Each member of the working

13The working group agreed that such a syntheticmeasure was easier to interpret and more useful– enabling:
• Comparative interregional analysis • Quick identification of fields in which the
situation of youth is worsening – i.e. awarning function.
• Decision makers to better direct EU regionalpolicy financial instruments in support ofyoung people.
To create a synthetic indicator, two approacheswere chosen for monitoring young people’ssituation on the labour market: statisticalanalysis based on the standardized sumsmethod, and analysis based on soft modellingmethodology (see below). The working groupengaged experts in the field of statistics at thisstage of work.
First approach: For the ‘statistical analysis based on thestandardized sums method’ approach, successivesteps were taken:• For each of the variables it was decided
whether its impact on the situation of youngpeople in the labour market is positive(stimulant) or negative (depressant).
• The accuracy and reliability of proposedindicators were verified with respect to thecorrelation of individual measures8.
• Then, for each field of analysis, a syntheticindicator was constructed, describing thesituation in a given field (employment,unemployment, demography etc.).
• Finally, the general aggregated indicator ofthe youth situation was formed, as aweighted average of synthetic measures ofeach field. Weights for each field weredeveloped on the basis of expert assessmentof the impact of particular fields on the overallsituation of young people in the labourmarket9.
This approach was criticized for its combinationof statistical methods and expert evaluation; theassigned definite weights to particular fieldsbecame controversial. Nonetheless, the syntheticindicator proved to be useful. Expressed instandardized values, it showed how thesituation in the region differed from theaverage, and Polish regions were ranked on thisbasis. The territorial units were divided into fourgroups (the best, above average, below averageand the worst conditions for young peoples’activity).
Second approach:Based on the so-called soft modelling method,some restrictions from the standardized sumsmethod (#1, above) were eliminated. Primarily,this enabled mathematical evaluation of theimpact of one or another specific context field,on the labour market situation of young people10.The theoretical background of this method isdescribed in a summary report: “According tothe theoretical basis of soft modelling, each suchmodel consists of two parts: the internal modeland external model. The internal model showsthe relationship between studied areas, in
particular the impact ofrespective ‘context areas’ on‘key areas’11”.That is, in this type of modelthere is the key area (e.g.employment/unemployment ofyouth) and the context areasthat affect it (e.g. education orfamily background). What themodel measures is the impactof said context areas, on thekey area, producing responsesto questions like ‘how much (to
18 When two indicators showed a strong correlation, the indicator that could more differentiate the regions was chosen (i.e.had a higher coefficient of variation).
19 Ibid. p. 34-36.10 Ibid. p. 69.11 Ibid. p. 72.

what extent) is the situation of youth determinedby education, or by the general economicsituation?“The external model elucidates the impact ofdetailed indicators on specific areas12”, which arealso defined by said indicators.That is, each area is defined, on the basis of a setof indicators that describe it – e.g. the“education” area was defined on the basis ofindicators like: Early leavers from educationalsystem; Vocational examination passing rate;Matriculation examination passing rate etc.
people search more actively for other fields ofactivity, like membership in different associationsetc. With demography, the better thedemographic structure, the more young peoplewho are on the labour market searching for jobs,thus having less success because of thecompetition.This analysis also led to the categorisation ofPolish regions by better or worse situation foryouth.
2.3. Results on an international levelThe Polish model was constructed on the basis ofPolish public statistics and it cannot be simplyreproduced in other conditions. An overview ofinternational data found that it is difficult toobtain more than the basic EUROSTAT data fromthe Labour Force Survey.Nevertheless, the working group decided tosearch for some other data from nationalstatistics that could be compared on aninternational level. In 2013 the group leadersigned the transnational partnership agreementwith German Federal Employment Agency inBerlin (Bundesagentur für ArbeitRegionaldirektion Berlin Brandenburg) to seek outpossibilities for a transnational model.The collective work resulted in 15 indicatorschosen, to be monitored both in Germany and inPoland14. The scope for statistical modelling wasnevertheless limited, not only due to shortage ofdata. The work goes beyond the currentpartnership arrangements, and adequatefunding is required. Currently the Germanpartner has made their Internet tool15 available(see later chapter on Labour Market Monitor inGermany), which generates graphic presentationof data and comparison of values, for indicatorsin a given year, between Polish and Germanregions.
14Analysis showed that the biggest determinant wasthe economic development of the region.Education is the next field highly affecting youth,followed by family and living conditions. All thesefields have positive impact – i.e. with moreeconomic development, better levels of educationand living conditions, the situation of youngpeople in the labour market is better.
Soft model scheme
12 Ibid. p. 72.13 Ibid. p. 75.14 Ibid., p. 58.15 Arbeitsmarktmonitor System, https://arbeitsmarktmonitor.arbeitsagentur.de
Some important changes in the previousassumptions were made at this stage. Forexample, economic condition of a region wasadded to the model as another important contextarea, in addition to education, demography, livingconditions and social activity. The number ofindicators was again limited only for thosestatistically proven to have an impact on thelabour market situation of young people.The other two fields – demography and socialactivity – proved to have small and negativeeffect13, i.e. higher indications of social activitycorrelate with less labour market activity,presumably because when there’s no work, young

2.4. Concluding remarksAs mentioned previously, the biggest challenge –which arose while working on the model formonitoring the youth situation – was how to dealwith limitations concerning data availability.There were problems making youth situation datadifficult to compare, e.g. diversity of reportingperiods, and age groups for which data ispresented. Age group was particularly difficult todefine for the analysis; some of the indicatorswere reported for those 15-24 years old, othersfor 18-24.Limiting analysis of youth to the youngest agesets proved ill advised, given issues like extendedperiods of education, and lengthening periods ofintegration into professional life. The agecategory finally chosen for analysis was quitebroad – 25-34 years.
Another limitation was the absence of reliabledata concerning important fields of activity ofyoung people – e.g. in/out migration numbers.
Other important information gaps concernedpublic regional labour demand statistics. In eachcountry, databases with job offers are organizeddifferently. In Poland job offers are collected bylocal labour offices – but these databases are
incomplete because many employers do not usepublic placement services, as they advertisetheir posts in the internet or hire byrecommendation.
Such data is also obtained through an Employers’Survey. However, such surveys are usually donead hoc (there are problems with continuity ofaccess to data) and they use differentmethodologies, which frustrates comparabilityof indicators.
All that said, the Polish model can serve as areference for using statistical methods tomonitoring the situation of youth on the labourmarket. Some concepts used in this approach canbe transferred to other contexts – such as, thefields and indicators used.
Contact information
For more information on either of these twopractices contact Antonina Michalska-Sabal,Research specialist, Regional Labour Office inKrakow - Labour Market and EducationObservatory of Małopolska, at:[email protected] [email protected] .
15

Rennes’ CODESPAR: development andforecasting, through diversity and involvement– This chapter is an edited and translated versionof a text kindly provided by the CODESPARorganisation.The ‘Conseil de Dévelopment Économique etSociale du Pays et de l’Agglomération de Rennes’– or ‘CODESPAR’, as it’s commonly referred to –is an organisation dedicated to the economic,social and environmental development of theFrench city of Rennes, and its larger surroundingarea. It carries out labour market analysis andforecasting, and also implements projects largelyconceived as a response to said analysis andforecasting.
The body’s Development Council is gearedtowards collective work and reflection; itmonitors developments throughout the territory,and provides a reliable knowledge base to localstakeholders and political decision makers.Members are representatives from the privatesector, trade unions, associations and localpoliticians – the idea being to involve a full rangeof viewpoints.
CODESPAR seeks to anticipate shifts in theterritory’s development – serving as a ‘detector’of innovation and change, and, effectively, as asort of support tool for change management.Accordingly, it can choose to examine a giventrend or issue, of its own initiative.
Additionally, CODESPAR is recognised by centralgovernment as the ‘Labour Market Committee’for its territory; meaning it plays the role of akind of designated platform for social dialogue,on which decision-making is also meant to bebased.
The Council describes itself according to 4 basic‘Missions’:
• Monitor: Monitor the current situation,changes, emerging issues, and problem signs.
• Anticipate: Build understanding of the region’sfuture possibilities.
• Facilitate: Provide a space for consultationand debate, the sharing of knowledgeregarding the territory and its trends, and forsocial dialogue.
• Foster: Try out innovative projects, andaccompany them towards sustainability.
The Set Up: CODESPAR is an autonomous body,organised upon associative principles withvoluntary participants, supported by a fulltimestaff of five. There are 120 members, drawnfrom 4 ‘colleges’, of 30 members each:
• Business and economic activities
• Unions
• Associations
• Local elected politicians and their associates
16
Timeline:CODESPAR was created some 30 years ago bylocal elected officials, who wanted to establish astable structure for dialogue among social andeconomic actors, associations (third sector), andlocal government. Cross-sector exchange andcooperation was to support and develop adevelopmental project for the territory. In 1984CODESPAR was accorded the role of ‘LabourMarket Committee’, with a mission to facilitatesocial dialogue within the territory, on matters ofemployment, training and economic development.

17
CODESPAR is guided by an annual workprogramme structured around priority projects,initiated by CODESPAR itself, or one of itspartners – i.e. Rennes Métropole, Pays deRennes, or ‘Maison de l’emploi de l’insertion et dela formation’ (a key local employment andtraining body). These projects are meant toidentify a given problem, and, as a means totackling it, assemble the relevant expertise fromcivil society.
Strategic axesThe development and promotional projectsCODESPAR pursues are oriented by the multi-year strategies that the members define. i.e.:
• Climate and energy: transition to new and/ormore efficient energy uses
• Forecasting: detecting economic trends andtheir impact on jobs and skills demand
• Social cohesion: Stakeholder involvement andstrengthening social fabric
For project examples, see:http://www.codespar.org/nos-projets/
An added value – of the way CODESPAR conductslabour market analysis and skills demandforecasting – is that it puts in place consultationand cooperation processes, facilitating exchange,buy in and support for the resulting initiatives.While each project has its specificities, they are allbased on a diagnostic carried out throughexchange of views and insights from multiplestakeholders, many of these from the CODESPARmembership itself.
! ! !
"$ $ $$
$) ) ) ) ) ) ) ) ) ) ) ) ) )
) ) ) ) ) ) ) ) ) ) ) ) ) ))) ) ) ) ) ) ) ) ) ) ) ))
) ) ) )) ) )) )) ) ) ) ) )))
"
!
$
! ! !
"$$
$) ) ) ) ) ) ) ) )
) ) ))) ) ))
)) ) ) ) ) ) )))
"
!
! ! !
"$$
$) ) ) ) ) ) ) ) )
) ) ))) ) ))
)) ) ) ) ) ) )))
"
!
! ! !
"$$
$) ) ) ) ) ) ) ) )
) ) ))) ) ))
)) ) ) ) ) ) )))
"
!
))
! ! !
"$$
$) ) ) ) ) ) ) ) )
) ) ))) ) ))
)) ) ) ) ) ) )))
"
!
))))
) ))
)))))))
! ! !
"$$
$) ) ) ) ) ) ) ) )
) ) ))) ) ))
)) ) ) ) ) ) )))
"
!
))) )))
)) ))
! ! !
"$$
$) ) ) ) ) ) ) ) )
) ) ))) ) ))
)) ) ) ) ) ) )))
"
!
) )))
) ))
! ! !
"$$
$) ) ) ) ) ) ) ) )
) ) ))) ) ))
)) ) ) ) ) ) )))
"
!
)
! ! !
"$$
$) ) ) ) ) ) ) ) )
) ) ))) ) ))
)) ) ) ) ) ) )))
"
!
! ! !
"$$
$) ) ) ) ) ) ) ) )
) ) ))) ) ))
)) ) ) ) ) ) )))
"
!
! ! !
"$$
$) ) ) ) ) ) ) ) )
) ) ))) ) ))
)) ) ) ) ) ) )))
"
!
! ! !
"$$
$) ) ) ) ) ) ) ) )
) ) ))) ) ))
)) ) ) ) ) ) )))
"
!
! ! !
"$$
$) ) ) ) ) ) ) ) )
) ) ))) ) ))
)) ) ) ) ) ) )))
"
!
! ! !
"$$
$) ) ) ) ) ) ) ) )
) ) ))) ) ))
)) ) ) ) ) ) )))
"
!
! ! !
"$$
$) ) ) ) ) ) ) ) )
) ) ))) ) ))
)) ) ) ) ) ) )))
"
!
! ! !
"$$
$) ) ) ) ) ) ) ) )
) ) ))) ) ))
)) ) ) ) ) ) )))
"
!
! ! !
"$$
$) ) ) ) ) ) ) ) )
) ) ))) ) ))
)) ) ) ) ) ) )))
"
!
! ! !
"$$
$) ) ) ) ) ) ) ) )
) ) ))) ) ))
)) ) ) ) ) ) )))
"
!
! ! !
"$$
$) ) ) ) ) ) ) ) )
) ) ))) ) ))
)) ) ) ) ) ) )))
"
!The StructureOuter circle = General Assembly, 120 members, 30 per collegeMiddle circle = Board, 48 members, 12 per collegeInner circle = Bureau, 16 members, 4 per collegeGreen = AssociationsRed = BusinessBlue = Trade unionsBlack = Elected politicians
LimitationsA sense of crisis and a quickening pace of changestimulate, understandably, public appetite forimmediate solutions. However, CODESPAR ismore geared for relatively longer-term work;with projects being typically two, or at least one,year timeframes, they are not suitable vehiclesfor immediate action or tackling challenges of aparticularly conjectural nature.
Where to now?New legislation coming through at the time ofwriting, will give new powers to France’smetropolitan administrations. Accordingly,CODESPAR will become a ‘Council forMetropolitan Development’, in 2015 – meaningit will have new competences and a strongerrole in designing public policy for RennesMétropole.
Requirements for transferEstablishing a similar Development Council for agiven territory requires local political will andappetite; creating such a Council is pointless ifno use is made of what it produces.Elected officials must be ready to involve civilsociety in setting public policy, and ready to buildprogrammes in partnership with socio-economicstakeholders and civil society representativesfrom the area. Likewise, political independence is essential; anyco-opting of the Council by narrower political orsectoral interests is a risk to be avoided – for, theautonomy of the Council is directly linked to howwhat it says is valued.
Final remarksCODESPAR is about collective work and a sharedculture of dialogue. It was built out of diversityand respect for difference – i.e. divergence – ofopinion.CODESPAR is a means of looking ahead, toanticipate, to the degree possible, theimplications of emerging trends for Rennes –economically, socially and environmentally.
For more information: www.codespar.org

Demographic challenges in Germany and the use of the Labour Market Monitor/Arbeitsmarktmonitor
18
Key points:
• The Labour Market Monitor is an IT tool forthe in-depth analysis of the Labour Market.
• Awarded ‘Most Innovative eGovernmentProject’
• Data generated specific to national, regionaland local levels, as well as some neighbouringEuropean regions.
• Context of major demographic shifts andlooming skills shortages.
The Setting and the ChallengeMajor demographic shifts are currently unfoldingthroughout Germany, though the impact ondifferent regions will vary notably. WesternPalatine is one of the regions facing particularlysignificant demographic ramifications. Aselsewhere, the region has to manage itsresources and adapt to deal with new problemsemerging on the horizon – in their case, a largeprojected deficit in skilled labour.
Western Palatine is a sparsely populated region,with just over half a million inhabitants (e.g.about half of the population of the city ofCologne) in an area of 7,990 km². The area’smunicipalities are among the smallest in Germanyand are scattered throughout the region. Thesupply of skilled labour is already limited, as is theability of the municipality to affect said supplyand other location factors that attractinvestment and business.
Furthermore, Western Palatine is affected by along-term structural crisis resulting in arelatively high unemployment rate. The region istransitioning from a predominance of oldindustries, to a focus on research anddevelopment and the IT-sector in the area ofKaiserslautern, the region’s main city.
This tenuous initial position will come under morepressure as the effects of demographic changesreveal themselves in the area; by 2060 (atcurrent rates), the population is projected todecline by 30% to 40%, vis-à-vis 2010. This
striking development will beaccompanied by a shift inage pattern; the medianage for the region isprojected to be 48 years in2020 and 51 years in 2050.
For some time a range ofstakeholders from business,science and politics havebeen seeking to combineforces and coordinate alreadyexisting approaches tocooperation, in WesternPalatinate. The shared goal ofthis network building is todevelop the region to itsfullest potential.
Article contributed byAnke Heckmann, of the‘Western Palatine – aregion with a future’association, Germany-
(All photos andgraphics in the articlecourtesy of Ms.Heckmann and theassociation)
Western Palatine (Westpfalz) is a southwesternGerman region, in the State of Rhineland-Palatinate (Rheinland-Pfalz).Kaiserslautern is the main city of the area and oneof the JobTown partner localities.

The Association and How it WorksTo the above end, the association: “WesternPalatine – a region with afuture/Zukunftsregion Westpfalz”(http://www.zukunftsregion-westpfalz.de/) wasfounded in April 2012, with the mission ofestablishing and safeguarding the kind of workforce the region needs. The membership is multi-sectoral and made up of companies, Chambers ofCommerce, research facilities (e.g. universities),ministries, municipalities and certain individuals.
Tiny HR footprint gets a lot done – how?The association stands out for having only twoemployed staff members (one project leaderand one secretary, both part time), plus onehonorary director – yet managing, nonetheless,to be highly productive. How? Some of its over170 members are strongly integrated intoregional networks – e.g. the honorary director,the board of directors and the board of trustees.Many members actively support and involvethemselves in achieving the association’s goalsand shouldering its distributed task load; theydon’t just kick in funds, they contribute work.
The Tool and its FindingsTo equip regions like Western Palatine to dealwith this sort of challenge successfully, accurateregional labour market data is of fundamentalimportance. Accordingly, the GermanEmployment Agency has developed the ‘LabourMarket Monitor’ (Arbeitsmarktmonitor), whichis designed to support all players in the labourmarket in their networking and decision-making.In 2009 the Federal Republic of Germanysuffered the worst crash in its post-war history,with national economic output falling 5%, from2008 to 2009. The development of the tool bythe German Employment Agency, was in partmotivated by that crisis situation, the intentionbeing to provide an improved understanding ofthe dynamics of regional labour markets andto support better coordination andcommunication among employees of theEmployment Agency and active players inregional labour markets.
Innovative e Government AwardThe Labour Market Monitor (‘LMM’) wasintroduced in 2010 as an IT-platform for
regional labour markets. It produces data on thestructural conditions of labour markets, to beused in assessing different industrial sectors, andin evaluating the supply and demand of skilledlabour on a regional level. Its data is based onemployment data gathered by the Agency itself,as well as on data generated by the FederalStatistical Office. In 2011 it was awarded “MostInnovative eGovernment Project”.One of the ‘Western Palatine – a region with afuture’ association’s key projects is to determineand classify the needs for skilled labour that willdevelop in Western Palatine over a 10 to 15year timeframe – and to ensure that thecorresponding training offer is in place, as andwhen needed. One of the main tools this projectdepends on is precisely the Federal EmploymentAgency’s ‘Labour Market Monitor’.
Broadly, Germany faces one of Europe’s moresevere dynamics of aging population, and theLMM is a tool for analysis and prognosis, to helpidentify impending imbalances in skills supplyand demand and to assess employment-relatedrisks – on federal, regional and local levels.
The information the LMM offers is classified intothree areas:1. Structural conditions• Labour market• Education• Social Indicators, i.e. rates of:
- Pre-school children in care [Kindergarten,day nanny etc.]
- Able-to-work people aged 15-65, andtheir dependents, receiving support andbenefits
- Minors under 15 years of age dependenton people in the above category.
• Demographic indicators
2. Occupational opportunities and risks• Assessment of industrial sectors at the federal
level• Review of said assessment at the local level
3. Skilled Labour Force ‘Radar’• Analysis of the regional situation, regarding
skilled labour forces• Visualisation of coming or emerging skills
shortages, right down to the local level
19
Looking closely at articulated structural conditions– particularly through comparison withneighbouring regions and/or the overall Germansituation – contributes significantly to getting abetter grasp of a given region’s situation.
The ‘Skilled Labour Forces Radar’ helpsunderstand the present and coming availability ofa skilled labour force. The relevant occupationaldata is based on three indicators – derived fromopen job vacancies reported to the LabourAgency by companies, persons registered asunemployed, and time it takes to fill the reportedvacancy – and compiled by the FederalEmployment Agency.
The indicators are:
1. Deviation of time of vacancy from federalaverage, over all professions
2. Shift in vacancy time length compared withprevious year (measured in days)
3. Ratio of unemployed to vacancies.
The ‘Radar’s’ data outputs depict the relationbetween the unemployed and open jobvacancies, mapping how long a given vacancygoes unfilled and contrasting this timespan withprevious cases (i.e. is the wait growing, shrinkingor similar?). This data is available for professionsand occupational categories, in many cases downto a county level.
Caveat: The Federal Agency’s is the broadest andmost complete such database available, howeverit reflects only part of the labour market; manyhigh-skilled, less standardised positions arenot included – e.g. academics, executives and soforth.
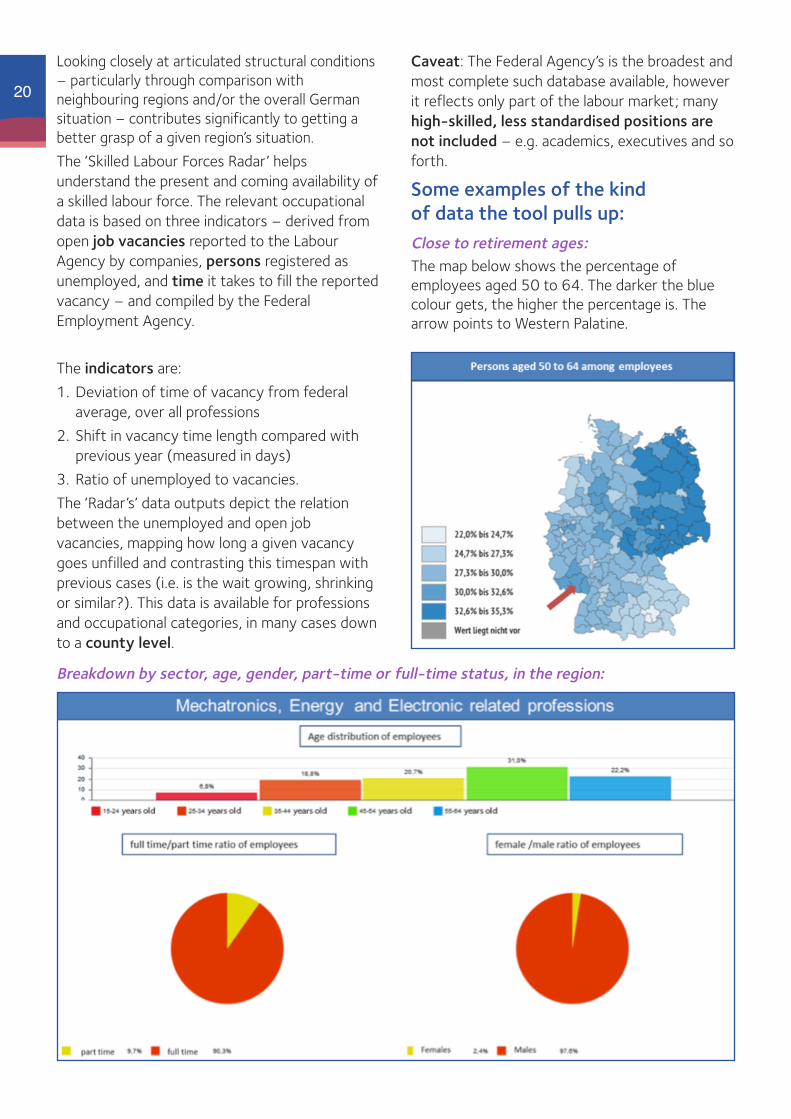
Some examples of the kind of data the tool pulls up:Close to retirement ages:The map below shows the percentage ofemployees aged 50 to 64. The darker the bluecolour gets, the higher the percentage is. Thearrow points to Western Palatine.
20
Breakdown by sector, age, gender, part-time or full-time status, in the region:

21Other Advantages to Working with the ToolAside from the obvious function of providinghighly tailored quality data on local and regionallabour markets, and the value of such data forplanning and so forth, the tool has other benefitsworth pointing out.
For instance, it helps networking processes tobecome more effective, as it provides regionalshareholders with easy access to the same,shared information. Some networks actually usethe communication platform built into the LMMto coordinate their projects, conduct paneldiscussions on related topics, and schedule theirnetwork meetings.
A rather interesting aspect of the LMM is that itproduces data on certain regions neighbouringGermany – in Austria, Belgium, Denmark, France,Italy, Luxembourg, the Netherlands, Poland andSwitzerland. For instance, structural indicatorsare available for Alsace-Lorraine in France, orWallonia and Flanders in Belgium.
Editor’s note: In the context of a networklike JobTown, concerned withtransnational and cross-border Europeancooperation and exchange onemployment issues, this aspect of thetool’s functioning stands out particularly,and stimulates one to speculate on howsuch a tool could eventually be takenfurther, with a view to enhancing EUlabour market performance as a whole.
Contact and Further Info
The Labour Market Monitor is available here:https://arbeitsmarktmonitor.arbeitsagentur.de
To pursue any further enquiries about the tool orthe association ‘Western Palatine – a region witha future’, please contact Ms Anke Heckmann:[email protected]
!
! ! ! ! ! ! ! ! ! ! ! ! ! ! !! ! ! ! ! ! ! ! !! ! ! ! ! ! ! ! !
* * * * * * * * * * * *
!!
* * * * * *
!
! ! ! ! ! ! ! ! ! ! !! ! ! ! ! ! ! ! ! ! ! !! ! ! ! ! ! ! ! ! !
! ! ! ! ! ! ! ! ! ! ! ! ! ! !! ! ! ! ! ! ! ! ! ! !
! ! ! ! ! !! ! ! ! ! ! ! ! ! ! ! !! ! ! ! ! ! ! ! ! !
! ! ! ! ! ! ! ! ! ! ! !
!"#$"%&'()*)$+&"
,"%-)&.
/"-01%)23+4'+&5+4)$0%#!"!#$%&'"( )*+,-.. /*,+*+,)0/!"!#$%&'"(12343$"!53(&16'(731*+++ 8)9/ 8+9:!"!#$%&'"(1;"#(<3=1&>%(1*)1;3%=6 *?9@ *?!"!#$%&'"(1)+1;%3=61%(21"$23= ??9* ?@9/A"#&>181B$23=$;181C3$%&'"( )?9. )09?D3=73(&%<31"E1F55'<=%(&6 .9) -9?
At a glance, one sees Western Palatine does nothave the highest numbers in the country forclose-to-retirement-age population, but doesfollow these regions (mostly in the East) with‘runner up’ level figures.
The Emerging Problem and its Implications:Regarding the development of the generalGerman population compared to that of WesternPalatine, the region is demonstrably losing morepopulation than can be explained by birth-deathratios; Western Palatine suffers from out-movement. Given that the lack or loss of skilledlabour is a vital threat to any competitivenessstrategy based on R&D and high value addedproduction, this demographic ‘bleeding´ is a redflag.
Analysis of supply and demand for skilled labourshows that certain occupational categories – e.g.healthcare professionals and technicaloccupations, including IT – are already sufferingfrom skills shortages and, unless somethinghappens to alter the projection, demand for suchskilled labour is set to outstrip supply evenfurther in the coming years.
This trend is a direct threat to the region’sambitions and strategy for economiccompetitiveness. The obvious implication is thatWestern Palatine will have to either compensatewith a significant influx of skilled migrants, orsomehow alter the approach to territorialdevelopment it currently relies on.
Population development in the last decade:

22Web crawling to Analyse Labour Markets,Using online Job Vacancies – A Growing PracticeExecutive summaryA web crawler is a free computer programmethat pulls data from the Internet – e.g. job-related sites. It is cheap to use, provides real-time data, is easily customisable, and is one ofthe directions labour market analysis is going in.It is particularly of interest for administrations ororganisations with budget restraints, and/orlooking for an independent access to currentdata; optimised according to their own specificneeds.
Web Crawlers as Tools for LabourMarket AnalysisA Web Crawler (other common synonyms: WebSpider, Web Scraper) is a kind of software thattrawls the Internet for information. Variousparameters are set for its search and examinationfunctions; generally the application isprogrammed to visit a list of URLs (webaddresses) and identify further hyperlinks (i.e.setting the ‘crawl frontier’) – e.g. links to jobdescriptions. The programme then retrieves thisinformation as an automated task, and said datais compiled and analysed as required.To understand a given labour market (ofwhatever geographical dimension), on top of theWeb Crawler (which gathers the job data fromthe web) an algorithm can be programmed (orsimple text analysis software can be used) toanalyse the job vacancy advertisements ofpublic or private organisations, like Eures,Randstad, Monster and so forth. The analysis isconducted in terms of whatever parameters areof concern – i.e. the jobs that are in demand, theskills and requirements that are being sought,gaps in supply, length of time posts go unfilled,wage trends and dynamics, and so forth.The application can be set to drill down intothese questions as deeply as possible – cross-referencing, sub-compartmentalising andbreaking them down into as many sub questionsas desired.This data obtained can then be extrapolated andhandled in any number of ways, using standardtools for data analysis, such as Excel or Access.
Why pick this tool:• Frugal factor: It is
cheap – i.e. the softwareis free; the only expenseis the staff time using it.Obviously, beinginexpensive is goodanywhere anytime,however being a lowcost option isparticularly importantfor smaller and moreresource stretchedadministrations.
• Ease of Use: The tool isrelatively easy to use,requiring somecomputer proficiency and a manageablelearning curve.
• Data from now: A Web Crawler can supplyreal time data fast. As such, the tool ispotentially a response to the serious need, onthe part of numerous local administrations, foraccess to up-to-date data.
• Limitless tailoring and follow up. Withtraditional survey techniques – conductedthrough filling out questionnaires, verbalquestioning etc. – there is a limit to how muchthe queried person’s time can reasonably beoccupied, and thus to the number of questionsand follow up questions that can be posed.With a Web Crawler – a computer/internetprocess – this is not an issue, as there are nopeople being questioned.
• It’s the way things are going: In the field andamong specialists, the use of this IT andinternet-based approach is steadily on the riseand is widely expected to grow into the future(see for instance Jackson 2001 and 2007,Dörfler and van de Werfhorst 2009, Kuhn andShen 2013 or Kurekova et al 2012 a,b,c).
What can be done with this tool?Below is an example of what can be generatedfrom data obtained via Web Crawling (Kurekovaet al 2012b). It is a spider graph showing theimportance of each type of skill analysed for
Dr. Anna-ElisabethThum, AssociateResearch Fellow at theCentre for EuropeanPolicy Studies (CEPS)in Brussels, is co-author of this chapter.
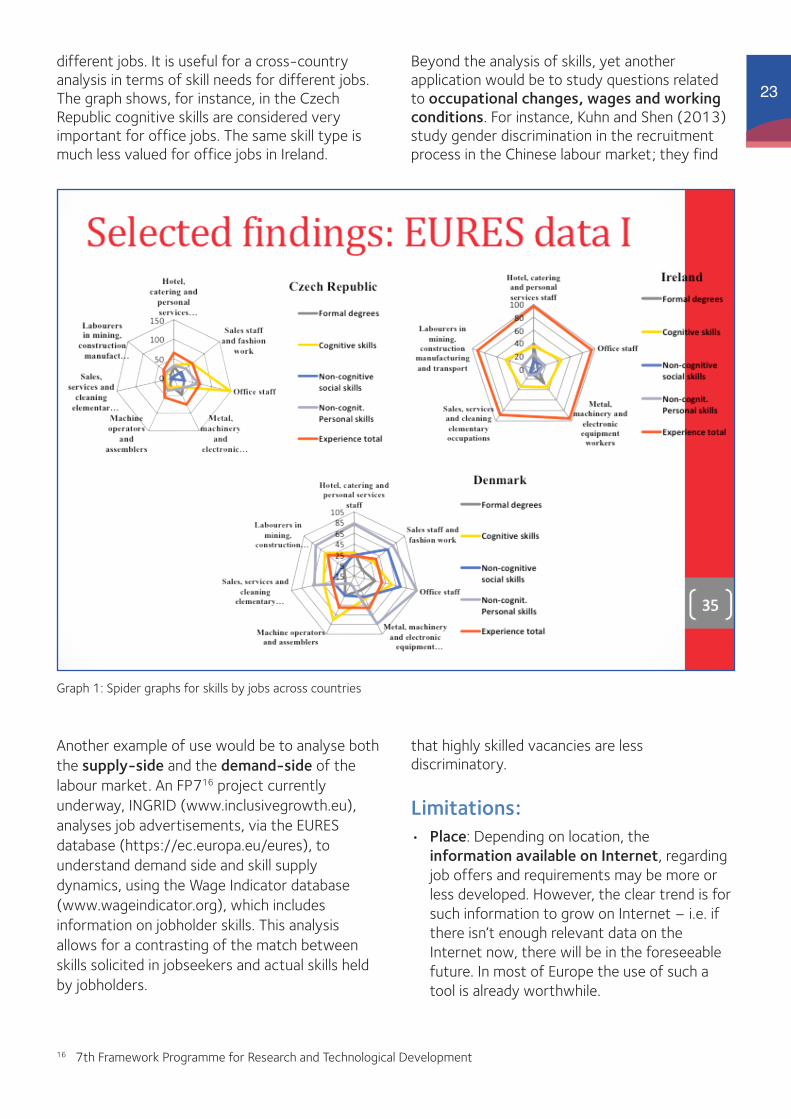
23different jobs. It is useful for a cross-countryanalysis in terms of skill needs for different jobs.The graph shows, for instance, in the CzechRepublic cognitive skills are considered veryimportant for office jobs. The same skill type ismuch less valued for office jobs in Ireland.
Beyond the analysis of skills, yet anotherapplication would be to study questions relatedto occupational changes, wages and workingconditions. For instance, Kuhn and Shen (2013)study gender discrimination in the recruitmentprocess in the Chinese labour market; they find
Graph 1: Spider graphs for skills by jobs across countries
16 7th Framework Programme for Research and Technological Development
Another example of use would be to analyse boththe supply-side and the demand-side of thelabour market. An FP716 project currentlyunderway, INGRID (www.inclusivegrowth.eu),analyses job advertisements, via the EURESdatabase (https://ec.europa.eu/eures), tounderstand demand side and skill supplydynamics, using the Wage Indicator database(www.wageindicator.org), which includesinformation on jobholder skills. This analysisallows for a contrasting of the match betweenskills solicited in jobseekers and actual skills heldby jobholders.
that highly skilled vacancies are lessdiscriminatory.
Limitations:• Place: Depending on location, theinformation available on Internet, regardingjob offers and requirements may be more orless developed. However, the clear trend is forsuch information to grow on Internet – i.e. ifthere isn’t enough relevant data on theInternet now, there will be in the foreseeablefuture. In most of Europe the use of such atool is already worthwhile.

24• Private channels: Not all job market
information is public; many posts are filledthrough informal channels. This is a limitationfor most formal approaches to Labour Marketanalysis. Incomplete knowledge is presumablyinevitable, the operative question is whetheran organisation benefits from using a giventool or not – i.e. if it is able to know more andunderstand better, and is thus more enabled.
• Etiquette: Web Crawlers can overloadwebsites and flood servers making theminoperative for others. In some cases they caneven crash a server altogether. Hence theneed to follow certain protocols and what iscalled ‘politeness policy’ or ‘crawleretiquette’; these are technical measuresregarding when to carry out the search (i.e. offhours of peak use), speed of data mining, andso forth.
• Representativeness of the sample: A‘representative sample’ is one that accuratelyreflects the characteristics of the underlyingpopulation, and this is not always the casewith internet-based data (see for instanceGosling et al. 2004 or Pedraza, Tijdens, andMuñoz de Bustillo 2007)
Where to begin?At JobTown’s third Transnational Workshop inRennes (France), February 2014, a trainingsession – based on work by Dr. Anna-ElisabethThum – was given on how local authorities canuse Web Crawlers to supply themselves withknowledge about their local/regional labourmarkets. If you’d like to see what such training islike, have a look at the PowerPoint used in thesession, available here:https://projectworks.files.wordpress.com/2015/01/presentation-web-crawling.pptx
The JobTown Web Crawling training opted to use‘R’, a free software and coding environment,suited to building one’s own tailored Web Crawler.‘R’ and information on ‘R’ and its uses areavailable here: http://www.r-project.org/ Co-author Dr. Thum has prepared an R-basedWeb Crawler application ready for use, withaccompanying step-by-step instructions, andoffers it freely. It’s an excellent starting point forany ‘newbie’, and is available here: https://projectworks.files.wordpress.com/2014/07/instructions-for-writing-a-small-computer-programme-for-web-crawling.pdf
Also, see Spector (2011a and 2011b) andJockers (2013) for a comprehensive tutorial onweb-crawling and text analysis in R.Moreover, a plethora of tutorials andinstructional videos, on how to use the ‘R’software, can easily be found on the Internet;searching on sites like Google or YouTube, usingterms like ‘R tutorial’ or ‘R programming’,produces plenty of material. Of course, a lot isavailable in other languages than English, andthere are R User Groups (RUGs)17 throughout theworld, providing peer-based support.Likewise, there are other free Web Crawleroptions out there, e.g.:http://en.wikipedia.org/wiki/Category:Free_web_crawlers
And finally, where DIY is not the best option,there are commercial purveyors of customisedWeb Crawlers, e.g.18: http://www.ficstar.com/ http://80legs.com/ https://www.mozenda.com/ Myriad local administration and other territorialor employment-related bodies, hampered by alack of resources and knowledge relevant to theirspecific needs, can a use a free or inexpensivetool like a Web Crawler to greatly empowerthemselves – becoming more independent andequipped to make knowledge-based choices. More and more are doing so.
17 Some can be found here: http://rwiki.sciviews.org/doku.php?id=rugs:r_user_groups18 Orientational purposes only, this constitutes no commercial endorsement

References
Dörfler, L. and H. G. van de Werfhorst. 2009.“Employers’ Demand for Qualifications andSkills.” European Societies 11 (5): 697–721.
Gosling, Samuel D., Simine Vazire, SanjaySrivastava, and Oliver P. John. 2004. “ShouldWe Trust Web-Based Studies.” AmericanPsychologist 59 (2): 93–104.
Jackson, M. (2001): “Non-Meritocratic JobRequirements and the Reproduction of ClassInequality: An Investigation.” Work,Employment & Society 15 (3): 619 –630.doi:10.1177/09500170122119020.
Jackson, M. (2007): “How Far Merit Selection?Social Stratification and the Labour Market”The British Journal of Sociology 58: 367–90.doi:10.1111/j.14684446.2007.00156.x.
Jockers, M. (2013): Text Analysis with R, underreview with Springer
Kuhn, Peter, and Kailing Shen. 2013. “GenderDiscrimination in Job Ads: Evidence fromChina.” The Quarterly Journal of Economics128 (1): 287–336. doi:10.1093/qje/qjs046
Kurekova, L., M. Beblavy and C. Haita (2012a):Qualifications or soft skills? Studying job
advertisements for demand for low-skilledstaff in Slovakia, NEUJOBS Working Paper D4.3.3., www.neujobs.eu
Kurekova, L., M. Beblavy and C. Haita , Thum, A.-E. (2012b): Employers’ skill preferencesacross Europe: Between formal qualificationsand soft skills, NEUJOBS Working Paper D4.3.4., www.neujobs.eu
Kurekova, L., M. Beblavy and A.-E. Thum(2012c): Internet data as a source for labormarket analysis. A methodological enquiry,unpublished manuscript.
Spector, P. (2011a): Reading Data from WebPages with R, University of Berkeley, ClassNotes s133.
Spector, P. (2011b): Stat 133 Class Notes –Spring, 2011; pp 70-88
Pedraza, Pablo de, Kea Tijdens, and Rafael Muñozde Bustillo. 2007. “WP 60-Sample Bias,Weights and Efficiency of Weights in aContinuous Web Voluntary Survey”. AIAS,Amsterdam Institute for Advanced LabourStudies.http://ideas.repec.org/p/aia/aiaswp/wp60.html.
25

Concluding remarks
This publication has been a look at some of theoptions, for labour market analysis and skillsdemand forecasting, available to the more locallevel of action – in favour of youth employmentand opportunity, and economic development.They all have strengths and weaknesses, involvechoices and trade-offs.For instance, Web Crawlers are great tools andhave a promising future, but there is informationnot on the web or that will fall outside of anysuch search for one reason or another. WesternPalatinate (Germany) may be using the awardwinning Labour Market Monitor, but they are alsodeveloping another tool for longer-term – i.e. 10to 15 years ahead – forecasting of skills that willbe required in their region.Ultimately, local and regional authorities andother employment-related bodies andorganisations will need to depend on a ‘mixedsalad’ of tools and approaches. They will usedifferent tools for different purposes andcombine them, according to need.The point is to have a strategy for equipping acity, region or local community, with the typeand quality of information needed for realknowledge-based policy, decisions, actions andplanning.
Local authorities, even small ones, don’t have toaccept to operate ‘in the dark’, taking decisions
and setting policy without the support ofadequately reliable and complete information.Towns don’t have to wait around for someoneelse to provide them with what they need.
The next point to take away is that – with a littleinitiative – there are tools suitable to all degreesof technical know how, and available resources.
Furthermore, making analytical and forecastingprocesses effective is about more than the rightmix of tools; it’s about a good mix of participants.Most of these tools work best when supportedby extensive stakeholder support andcontribution.
Likewise, the analytical tools and their processescan, themselves, be a means to building andobtaining greater stakeholder involvement – ameans to achieving ‘buy in’.
In some cases local innovation, in labour marketanalysis, is happening more in terms of buildingpartnership and inclusive participatory processeswith stakeholders, rather than in the form of a‘number crunching’ technical breakthrough –though there’s that too.
Ian Goldring, Lead Expert for JobTown, Brussels,2014
26

URBACT is a European exchange and learning programmepromoting sustainable urban development.
It enables cities to work together to develop solutions tomajor urban challenges, reaffirming the key role they playin facing increasingly complex societal challenges. It helpsthem to develop pragmatic solutions that are new and su-stainable, and that integrate economic, social and environ-mental dimensions. It enables cities to share goodpractices and lessons learned with all professionals invol-ved in urban policy throughout Europe. URBACT is 300 ci-ties, 29 countries, and 5,000 active participants.
www.urbact.eu/jobtown