Embed Size (px)
Citation preview
Proceedings of 31st International Conference on Ocean, Off shore and Arctic EngineeringOMAE 2012
July 1-6, 2012, Rio de Janeiro, Brazil
OMAE 2012-83388
EXPERIMENTAL INVESTIGATION OF IRREGULAR WAVE CANCELLATIO N USINGA CYCLOIDAL WAVE ENERGY CONVERTER
Stefan G. Siegel ∗
Department of AeronauticsUnited States Air Force Academy
Air Force Academy, Colorado, 80840USA
Email: [email protected]
Casey Fagley
Department of AeronauticsUnited States Air Force Academy
Air Force Academy, Colorado, 80840,USA
Marcus R omer
Department of AeronauticsUnited States Air Force Academy
Air Force Academy, Colorado, 80840,USA
Thomas McLaughlin
Department of AeronauticsUnited States Air Force Academy
Air Force Academy, Colorado, 80840,USA
ABSTRACTThe ability of a Cycloidal Wave Energy Converter (Cy-
cWEC) to cancel irregular deep ocean waves is investigated in a1:300 scale wave tunnel experiment. A CycWEC consists of oneor more hydrofoils attached equidistant to a shaft that is alignedparallel to the incoming waves. The entire device is fully sub-merged in operation. Wave cancellation requires synchroniza-tion of the rotation of the CycWEC with the incoming waves, aswell as adjustment of the pitch angle of the blades in propor-tion to the wave height. The performance of a state estimatorand controller that achieve this objective were investigated, us-ing the signal from a resistive wave gage located up–wave ofthe CycWEC as input. The CycWEC model used for the presentinvestigations features two blades that are adjustable in pitch inreal time. The performance of the CycWEC for both a superposi-tion of two harmonic waves, as well as irregular waves followinga Bretschneider spectrum is shown. Wave cancellation efficien-
∗Address all correspondence to this author.
cies as determined by wave measurements of about 80% for themajority of the cases are achieved, with wave periods varyingfrom 0.4s to 0.75s and significant wave heights of Hs ≈ 20mm.This demonstrates that the CycWEC can efficiently interact withirregular waves, which is in good agreement with earlier resultsobtained from numerical simulations.
NOMENCLATURET Wave Period [s]D Water Depth [m]Hs Significant Wave Height [m]W Wave, index indicates type of waveC Wave Travel Velocity (Celerity) [m/s]Cg Wave Group Velocity [m/s]
Cr Beach Reflection CoefficientCr =Hre f lectedHincoming
ρ Fluid Density [kg/m3]k Wave Number [1/m]
1

Report Documentation Page Form ApprovedOMB No. 0704-0188
Public reporting burden for the collection of information is estimated to average 1 hour per response, including the time for reviewing instructions, searching existing data sources, gathering andmaintaining the data needed, and completing and reviewing the collection of information. Send comments regarding this burden estimate or any other aspect of this collection of information,including suggestions for reducing this burden, to Washington Headquarters Services, Directorate for Information Operations and Reports, 1215 Jefferson Davis Highway, Suite 1204, ArlingtonVA 22202-4302. Respondents should be aware that notwithstanding any other provision of law, no person shall be subject to a penalty for failing to comply with a collection of information if itdoes not display a currently valid OMB control number.
1. REPORT DATE JUL 2012 2. REPORT TYPE
3. DATES COVERED 00-00-2012 to 00-00-2012
4. TITLE AND SUBTITLE Experimental Investigation Of Irregular Wave Cancellation Using ACycloidal Wave Energy Converter
5a. CONTRACT NUMBER
5b. GRANT NUMBER
5c. PROGRAM ELEMENT NUMBER
6. AUTHOR(S) 5d. PROJECT NUMBER
5e. TASK NUMBER
5f. WORK UNIT NUMBER
7. PERFORMING ORGANIZATION NAME(S) AND ADDRESS(ES) United States Air Force Academy,Department of Aeronautics,Air Force Academy,CO,80840
8. PERFORMING ORGANIZATIONREPORT NUMBER
9. SPONSORING/MONITORING AGENCY NAME(S) AND ADDRESS(ES) 10. SPONSOR/MONITOR’S ACRONYM(S)
11. SPONSOR/MONITOR’S REPORT NUMBER(S)
12. DISTRIBUTION/AVAILABILITY STATEMENT Approved for public release; distribution unlimited
13. SUPPLEMENTARY NOTES Proceedings of 31st International Conference on Ocean, Offshore and Arctic Engineering July 1-6, 2012,Rio de Janeiro, Brazil
14. ABSTRACT The ability of a Cycloidal Wave Energy Converter (CycWEC) to cancel irregular deep ocean waves isinvestigated in a 1:300 scale wave tunnel experiment. A CycWEC consists of one or more hydrofoilsattached equidistant to a shaft that is aligned parallel to the incoming waves. The entire device is fullysubmerged in operation. Wave cancellation requires synchronization of the rotation of the CycWEC withthe incoming waves, as well as adjustment of the pitch angle of the blades in proportion to the wave height.The performance of a state estimator and controller that achieve this objective were investigated, using thesignal from a resistive wave gage located up?wave of the CycWEC as input. The CycWEC model used forthe present investigations features two blades that are adjustable in pitch in real time. The performance ofthe CycWEC for both a superposition of two harmonic waves, as well as irregular waves following aBretschneider spectrum is shown. Wave cancellation efficiencies as determined by wave measurements ofabout 80% for the majority of the cases are achieved, with wave periods varying from 0.4s to 0.75s andsignificant wave heights of Hs 20mm. This demonstrates that the CycWEC can efficiently interact withirregular waves, which is in good agreement with earlier results obtained from numerical simulations.
15. SUBJECT TERMS
16. SECURITY CLASSIFICATION OF: 17. LIMITATION OF ABSTRACT Same as
Report (SAR)
18. NUMBEROF PAGES
13
19a. NAME OFRESPONSIBLE PERSON
a. REPORT unclassified
b. ABSTRACT unclassified
c. THIS PAGE unclassified

Standard Form 298 (Rev. 8-98) Prescribed by ANSI Std Z39-18

g Gravity constant, 9.81[m/s2]t Time [s]λ Wavelength [m]R= 60mm Wave Energy Converter Radius [m]c= 50mm Hydrofoil Chord [m]s= 550mm Hydrofoil Span [m]xc,yc Wave Energy Converter Shaft location [m]η Water Surface [m]α Hydrofoil pitch angle relative to tangential direction [◦]γ Flap wave maker angle [◦]TF Wave maker period [s]δ(t) Main Shaft rotational angle [◦]θ Phase [◦] between wave maker and WEC main shaft
1 IntroductionAmong alternative energy sources, wave power is one of the
most abundant sources on earth. The World Energy Council ac-cording to [1] has estimated the world wide annual amount ofwave power energy at 17.5 PWh (Peta Watt hours = 1012kWh).This amount of power is actually comparable to the annual worldwide electric energy consumption, which is currently estimatedat 16 PWh. Thus, wave power has the potential to provide a largeportion of the worlds electric energy needs, if it can be harnessedefficiently. In addition to the energy availability, wave power hasother advantages. Since a large portion of the worlds populationlives close to the ocean shores, the distance between energypro-duction and consumption is small, which reduces transmissionlosses and necessary investments in transmission lines. Asop-posed to other alternative energy sources like wind, streamandsolar energy, the installation of wave power devices does not re-quire use of already precious real estate. This makes wave poweran ideal energy source for efficiently providing renewable en-ergy to densely populated coastal areas. Ocean waves have atremendous potential to provide clean renewable energy. Furtherengineering aspects of wave power as an energy source are ap-pealing as well. While the power density of both solar and windin typical favorable sites is in the order of 1kWm−2 [2], wavepower in a typical North Atlantic wave that was considered inarelated paper [3] (wave height ofH = 3.5mand period ofT = 9s)yields 108kWm−1 of wave crest. As shown there, a device ex-tending about 40m in the vertical direction can extract almost allof this wave power, yielding a power density of about 2.7kWm−2
or more than two and a half times that of wind or solar power. Ifone considers the theoretical inviscid conversion limits for wavesand wind, which are 100% for waves [4] and 59% for wind [5],the accessible power density of waves is more than four timesaslarge as that of wind. Furthermore, wave energy is availableona more consistent basis and can be better predicted in advance,therefore mitigating the need to back up a wave power plant withother conventional power sources, such as solar and wind en-ergy.
2 Motivation and ObjectivesAnalysis of the different wave energy conversion devices
that have been investigated or proposed reveals a number of com-monalities in design. The first is that all devices require a connec-tion to the sea bed in order to extract energy, which has two maindrawbacks. First, a seabed connection makes the device vulnera-ble in rough seas and storms, in the same way as an anchored shipis vulnerable in a storm (and will likely break the anchor line).According to [1], storm survivability has been a major problemfor many wave energy converters, with some being destroyed bythe elements as early as during deployment. Also, for most ofthe devices, the load imposed onto the seabed connection is pro-portional to the power which the device can extract. This meansthat the anchor point needs to be stronger and thus more costlyas more energy is being extracted. Therefore, many of these de-vices cannot easily be scaled up to industrial power plant levelsof energy conversion. In addition, since the devices need tobeanchored to the sea floor, they are not well suited to operationin deep water waves, where the ocean floor may be hundreds ofmeters away from the surface. However, most wave energy iscontained in deep water waves, and the energy density of a wavedecreases as it approaches shallow water. Thus, most devicescannot operate in the most promising locations for wave powerextraction.
Beyond survivability, efficiency has been a major issue formany WEC designs. While wave energy as a resource may befree, the construction effort to harness it is a major expense andto a large degree determines the cost of energy being produced.As a less efficient WEC will need to be larger in size to extractthe same amount of energy as a more efficient one, cost of en-ergy is directly related to efficiency. Arguably, the most efficientWEC is one that can extract all of the energy from an incom-ing wave, and the class of wave energy converters that is abletoachieve this is commonly referred to in literature as wave termi-nation devices. There have been various wave termination de-signs reported in literature, with the most well known devicesbeing the Salter Duck [6] and the Bristol or Evans Cylinder [7].Both consist of a series of elements which are aligned parallelto the wave crests, in the case of the Salter Duck these are cam–shaped and floating on the surface, while the Bristol Cylinderis fully submerged. Both have been shown to be able to absorban incoming wave completely. The wave energy is converted toelectric power by means of a power–take–off system that is hy-draulic in both cases. As both devices move at approximatelythe wave induced water velocity, the devices need to featurealarge surface area to convert appreciable amounts of power.Thisincreases construction cost, reduces storm survival odds and hasultimately motivated the investigation of the Cycloidal WEC de-scribed here. The fact that both devices require mooring to theocean floor also hampers storm survival odds and precludes in-stallation in very deep water.
A typical cycloidal wave energy converter (CycWEC) as
2
ω
Γ1
Γ2
R
W1
W2
W3
W-1
W-2
W-3
D
x
(xc,yc)
y
H
Ocean Floor
Water Surface
WAiryη(x,t)
Φ(x,y,t)
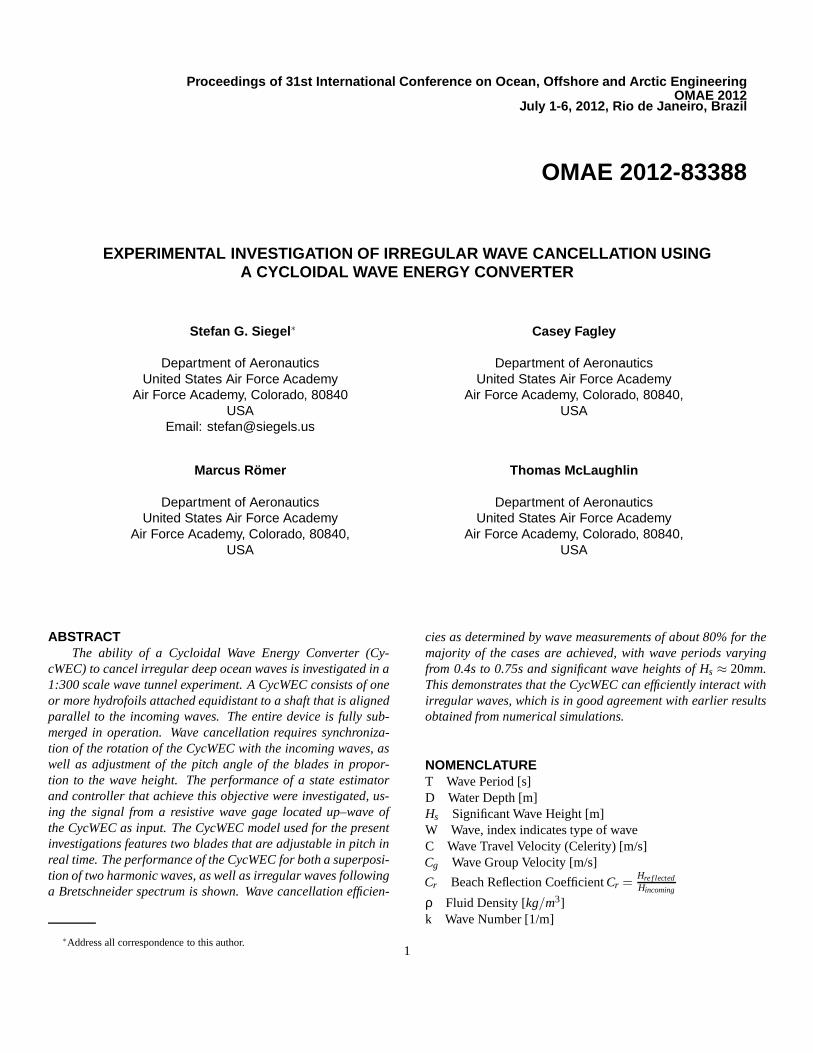
Figure 1. Cycloidal wave energy converter geometry and generated
waves
considered in this paper is shown in figure 1. It features oneor more hydrofoils attached eccentrically to a main shaft ata ra-diusR. While the shaft rotates, the pitch angle of the blades maybe adjusted. This device operates at a rotational speed of thehydrofoil that is typically an order of magnitude larger than thewave induced water velocity, and employs the lift force at thehydrofoil to generate shaft torque directly. Using lift allows fora much smaller hydrofoil plan form area to be employed com-pared to the cross sectional areas of Duck and Cylinder, and gen-erating shaft torque directly eliminates the need for a costly andinefficient hydraulic power take off system. In addition, itis con-ceptually possible to join several CycWECs into a cluster wherethe reactive forces at the shaft can be made to cancel, which re-duces or negates entirely the need for mooring and thus enablesdeep water deployment while improving storm survival odds (seeSiegel [8] for sketches). The fact that the reactive force changesdirection though 360◦ with each wave passage enables force can-cellation if the individual WECs are spaced half a wavelengthapart, thus causing reactive forces of same magnitude but oppo-site direction.
A single rotating hydrofoil was first investigated by Her-mans et al. [9] both numerically and experimentally. While Her-mans et al. reported very low wave energy conversion efficien-cies (on the order of a few percent), Siegel et al. [3] were ableto show in simulations that with improved sizing of the WEC aswell as by using synchronization of the rotation of the foil withthe incoming wave, wave termination with better than 99% invis-cid efficiency was possible. These numerical findings were con-firmed by 1:300 scale experiments in 2011, as reported by Siegelet al. [10] where invisicid conversion efficiencies of greater than95% were achieved in the same facility employed in this study.Both of these initial studies performed synchronization oftheWEC with a numerically generated harmonic wave, or a paddlewave maker, respectively. Thus they did not require a feedbackcontroller and estimator to succeed. A controller and estima-tor were for the first time successfully implemented by Jeansetal. [11] for irregular waves in a numerical simulation. Typical
conversion efficiencies in this study were beyond 90% for a su-perposition of two harmonic waves, and around 80% for irreg-ular waves following a Bretschneider distribution. At the sametime, the controller and estimator were successfully tested in anexperiment as reported in [12] where harmonic waves with dif-ferent wave heights and frequencies were successfully cancelled,achieving efficiencies comparable to the earlier synchronizationexperiments that had a priori knowledge of the incoming wave.The performance of the feedback controller and estimator couldthus be experimentally verified for the first time.
In the present study, the CycWEC investigations are ad-vanced by experimentally canceling both a superposition oftwo harmonic waves, as well as irregular waves following aBretschneider distribution. While this has been done in simula-tions reported by Jeans et al. [11], so far no experimental valida-tion for these types of waves interacting with a CycWEC exists.By first investigating the interaction of the CycWEC with twoharmonic waves, the performance of the pitch control mecha-nism is established first, since the resulting wave pattern exhibitsa strong amplitude modulation with the frequency difference ofboth waves. An incoming wave field following a Bretschneiderdistribution then adds variations in frequency to the wave field ina way that is typically encountered in deep ocean waves. The per-formance of the CycWEC in cancelling this wave field can thusbe considered representative for the performance of the device ina deep ocean setting at full scale.
3 Experimental SetupThe tunnel used for testing the cycloidal WEC was a 2D
wave tunnel designed to provide a 1:300 scale model of a deepocean wave. The full scale design deep ocean wave, which wasinvestigated numerically in [3] had a period of 9s, a wave lengthof 126.5m and a wave height of 3.5m, and it carried about 105kWof power per meter of wave crest. It was represented in thepresent setup by a wave with a period of 0.5s and wave lengthof 0.39m; at a typical wave height of 20mm the scaled wavecarried approximately 192mW of wave power per meter. Theexperiment consisted of four subparts: Wave tunnel, CycWECmodel, wave gages and Data Acquisition (DAQ) and process-ing system. In addition, a feedback controller and state estimatorwere employed to operate the CycWEC. All of these componentsare described in detail in the following subsections.
3.1 Wave TunnelThe wave tunnel is shown as conceptual sketch in figure 3.
It allowed for the generation of waves with a period between 0.2and 1.15 seconds, and consisted of the following three parts:
3.1.1 The wave tank The tank had an overall length of5m, where 4.50 meter were usable for wave experiments between
3

the flap wave maker and the beach, a width of 0.55m and a designwater depth of 0.3m. The width of the tunnel was increased by50mm on each side in the center test section, which allowed thedrive system of the CycWEC to be placed outside of the wavetesting area by means of false walls. The Eigenfrequency of thewave tunnel, which corresponds to a standing wave spanning thelength of the tunnel with an integer multiple of wave lengths, hada period of 5.5-6 seconds, which was determined by exciting thetunnel resonance using a step input at the wave maker.
3.1.2 The beach The beach, located at the right end ofthe tunnel, was a linear beach with a 1:4 slope. The main pur-pose was to prevent reflection of waves travelling left to right. Inorder to evaluate the wave reflections from the beach, the reflec-tion coefficient was measured experimentally and also comparedto predictions based on a well established numerical model.Atthe design wave ofT = 0.5s,H = 20mm the reflection coeffi-cient was measured by traversing two wave gages using the ap-proach described in [7] and found to beCr = 0.106. This was lessthan the estimate from the numerical model described in [13],which for the design wave estimated the reflection coefficient tobeCr = 0.17 which is the ratio between reflected and incidentwave. We thus considered the numerical model a worst case es-timate, and given textbook statements that consider it difficult toachieve less thanCr = 0.1 [14] the beach was found to performsufficiently well for the measurements at hand. No wave reflec-tion prevention (e.g. wave cancelling wave maker) was avail-able at the left end of the tunnel for waves travelling right to left,where the flap wave maker was located. This did not cause anysignificant impact on the results, though, since the wave heightson the up–wave side of the WEC model were minimal for all datapresented.
3.1.3 Irregular Wave Synthesis The irregular inci-dent wave field is created using a linear superposition of a finitenumber of linear Airy wave components. The resulting surfaceelevation for a unidirectional deep ocean wave propagatinginthex-direction and satisfying the linearized free surface bound-ary conditions is given in [15] to be,
ηI (x, t) =NI
∑i=1
Hi
2cos(kix−ωit +θi) , (1)
whereNI is the number of regular wave components used to rep-resent the irregular wave field, andHi , ki , ωi andθi are the waveheight, number, frequency and phase for componenti, respec-tively. The wave phase componentsθi are obtained using a ran-dom number generator based on a uniform distribution between0 and 2π. The fidelity of the irregular wave field will increase as
the number of wave components is increased. According to [16],a minimum of 20 wave components are required for modelling aunidirectional irregular seaway.
The amplitude for componenti is based on a specified wavespectrum according to,
ai =Hi
2=√
2SI (ωi)∆ωi , (2)
whereSI is the spectral density and∆ωi is the wave frequencyinterval for componenti.
For the current study the the incident wave field is modelledusing the Bretschneider wave spectrum, which is a commonlyused two parameter model for wave spectra in the open ocean.The 15th International Towing Tank Conference [17] defines theBretschneider spectrum as,
SI (ω) =486.0H2
s
T4p ω5 exp
−1948.2T4
p ω4 , (3)
whereHs is the significant wave height andTp is the wave periodassociated with the peak energy. The Bretschneider wave spec-trum forHs= 3.25 m andTp = 9.7 s (i.e. sea-state 5) is shown inFig. 2(a). Also shown are the resulting wave components whenthe spectrum is divided into 21 wave components withωmin= 0.4rad/s,ωmax= 2.0 rad/s, and∆ωi = 0.08 rad/s. Each wave com-ponent is identified numerically in Fig. 2(a) and is referredto asWI1−WI21 throughout the remainder of the paper. The amplitudeof each wave is determined from Equation 2.
With the period and amplitude of each component wave de-fined, the associated wave length and power can be determinedfrom Airy wave theory. The wave length is determined from thedispersion relationship,
λi =T2
i g2π
, (4)
whereλi andTi are the wavelength and period of componenti.The wave power per unit length,Pi , associated with each compo-nent is related to the wave height and period,
Pi =1
32πρg2H2
i Ti , (5)
whereρ is the density of water (assumed to beρ = 1000 kg/m3
for this study). Since the wave power scales linearly with thewave period, higher harmonic waves of the same wave heightwill contain less energy in proportion to their period. Alsonotethe quadratic relationship between wave energy and wave height.
4

0.5 1 1.5 20
0.5
1
1.5
ω (rad/s)
SI(ω
), m
2 s/ra
d
1
2
3
4 (std)
5
6
7
8
9
10
11
16151413
12
18 1917 20 21
(a) Bretschneider energy spectrum forHs = 3.25 m andTp = 9.7 s (i.e. sea-state5).
1 2 3 4 5 6 7 8 9 10 11 12 13 14 15 16 17 18 19 20 210
1
2
3
4
5
6
7
8
9
Wave Component, WIi
Pow
er (
kW/m
)
Wstd
(b) Associated power of each of the 21 discrete wave components.
Figure 2. Incident wave field modelled using the Bretschneider wave
spectrum and 21 discrete wave components based on Airy wave theory.
For the full scale ocean wave, the power associated with eachcomponent wave in Fig. 2(a) is shown in Fig. 2(b). The totalpower of all 21 components is 41.79 kW/m andWI4 has the peakpower of all individual components with 8.75 kW/m.
The wave spectra with different amounts of componentwaves were scaled from full scale to tunnel scale, where the waveperiod for the most dominant componentI4 wasT4 = 0.5s. Thecorresponding significant wave height wasHs = 15mm.
3.1.4 The flap wave maker The flap wave maker wasa plain flap hinged at the bottom of the tunnel. It was driven bya
ω
R=6cm
D=
0.3
m
xy
Tunnel Floor
Paddle
Wave Maker
Cycloidal
Wave Energy
Converter
4.5 m
1.17 m
Linear Beach (1:4 Slope)
Water Surfaceη(x,t)
yc
Up-Wave
Wave Gauge
Down-Wave
Wave Gauge
1.17 m
Figure 3. Wave tunnel schematic - not to scale
brush type servo motor driving two sprockets attached to a shaftspanning the tunnel, which engaged in two arc gear segments lo-cated at both sides of the tunnel attached to the top of the flap.This setup provided gearing to match the torque characteristicsof the servo motor to the torque requirements of the wave maker.It also ensured pure rotational motion of the flap without torsion.The servo motor was connected to a motion controller operatingin position mode allowing for arbitrary motion wave forms withan update rate of 10ms. In the present investigations, either aBretschneider spectrum superposition of harmonic waves asde-scribed in the previous section, or a double sinusoidal motion
γ(t) = δ1 sin(2πt/T1)+ δ2sin(2πt/T2) (6)
was prescribed using a deterministic hardware timed LabVIEWloop. This setup had the advantage that both wave height andperiod could be computer controlled without any hardware ad-justments. It did not provide any incoming wave cancellationsince no force feedback was available. Given the resolutionof2000 pulses per revolution of the servo motor shaft mounted en-coder, and the gear ratio of 10:1 an angular resolution of 0.018degrees was achieved.
Figure 3 shows a sketch of the overall test setup. The flapwave maker generated waves at the left side of the tunnel, whichtraveled past the first wave gage (up–wave wave gage). In thecenter of the test section the wave reached the CycWEC. Theremaining waves were measured by the second wave gage, whichwas located at an equal distance from the CycWEC. After a shortdistance the waves dissipated their energy at the beach.
3.2 Wave Energy Converter ModelBased on the sketch in figure 1, a number of non–
dimensional quantities emerged. The basic size of the wave en-ergy converter was denoted by 2R/λ, where the wave lengthλwas the fundamental length scale. Consequently, the vertical po-sition of the main shaft was denoted byyc, and the wave heightby H. It was also convenient for parameter studies to comparedifferent size wave energy converters while keeping the distancebetween the water surface and the topmost point of the cycloidalwave energy converter path fixed, that is|yc| −R= const. Thedirection of travel of an incoming ocean waveWAiry was assumed
5
to be left to right. Waves generated by the cycloidal wave energyconverter that travelled in the direction of the incoming wave re-ceived a positive index and were considered travelling down–wave; while waves in the opposite direction were consideredup–wave travelling and received a negative index number.
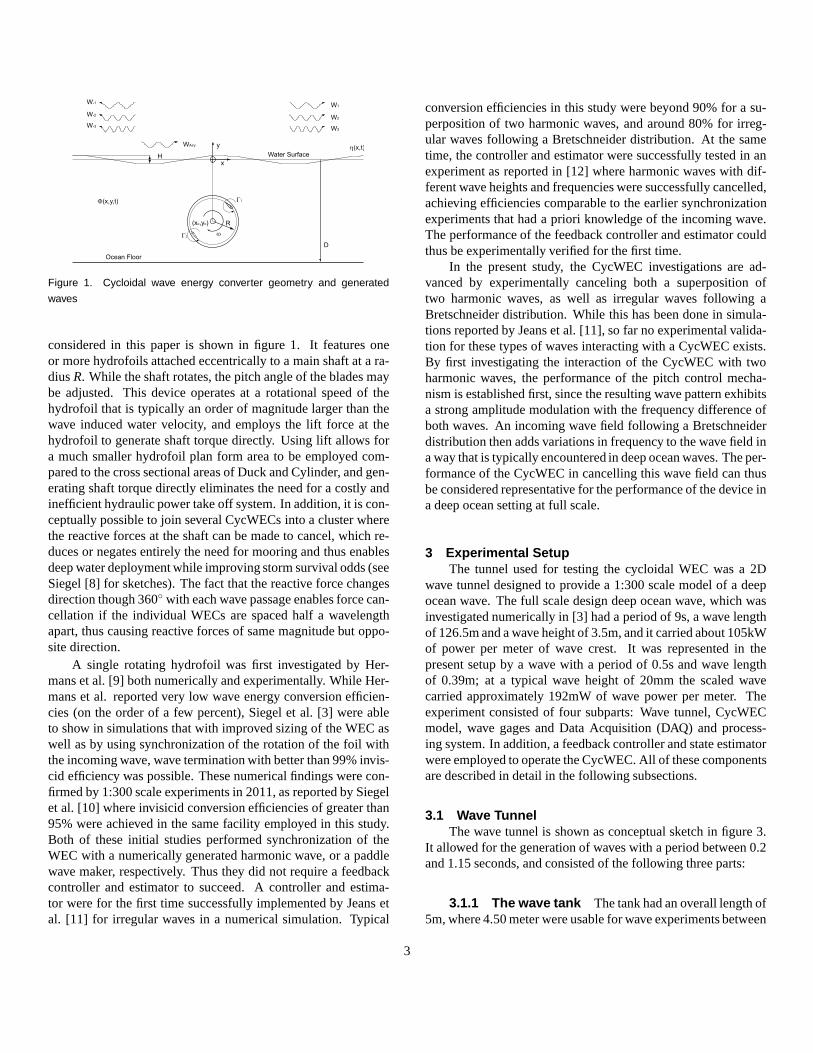
The CycWEC device was designed to convert energy fromwaves to shaft power by wave cancellation. Figure 4 shows aCAD model, while the definition of the main geometry parame-ters is shown in figure 1. The only component interaction withthe flow were two hydrofoils spanning the tunnel. These hydro-foils were attached eccentrically at a radiusR= 60mm, and had aNACA 4 series hydrofoil ofc= 50mmchord length, with a cam-ber line curvature to match the radius of the circle on which itrotated. The hydrofoil had a resulting camber line displacementof 11 percent, and the maximum thickness of 15% was located at50% chord. This setup provided a zero–lift pitch angle of approx-imately 0◦ and was expected to behave like the familiar NACA0015 in straight flow, when rotating around a shaft.
The CycWEC was installed in the center of the wave tunnelsuch that the waves travelling the length of the tunnel were un-obstructed but for the interaction with the CycWEC blades. TheCycWEC could be operated with one or two blades, however allresults presented in this paper were obtained with two blades.The main shaft motor was located outside the water well abovethe tunnel, and connected directly to two timing belt sprockets.The timing belts engaged in individual larger sprockets belowthe water line with a 5:1 gear ratio, which in turn held the blades.The main shaft motor (Pittman model 4442 S012) was a brush-less servo motor with a 500 lines/rev incremental encoder driv-ing the main shaft directly, and connected to a closed loop servomotor controller (Copley Motion Accelnet ACJ-090-12) allow-ing the motor to operate both as motor or generator dependingon the torque applied to the shaft. Together with the 5:1 gearratio as well as edge detection of the encoder signals, an overallresolution of 10000 counts/revolution was achieved. The motorcontroller was operated in position mode, with position updatestransmitted every 10ms to the controller over the CAN bus sys-tem (see below).
The pitch angle of each blade was adjustable under com-puter control in real time. This was achieved by means of twodigital model aircraft servos, which were attached to the mainshaft located outside the water. The servos turned a second tim-ing belt sprocket by means of a gear attached to the servo shaft.The sprocket then adjusted the pitch of the blade by means of asecond set of timing belts and 5:1 larger sprocket arranged con-centrically with the drive sprocket, which connected to a push rodthat was attached to the blade. The servos had a range of motionof ±60◦, and with an overall gear ratio of 3:1 the blades could beadjusted over a range of approximately±20◦. The transmissionalso improved the positioning accuracy of the servos, whichwasmeasured to be±0.5◦, to one third of that, or±0.17◦.
The sign convention for the pitch angle was chosen such that
Figure 4. Picture of wave energy converter with a two blades and pitch
control.
a rotation of the blade’s leading edge towards the rotation centerwas negative, a rotation outward positive. For the present investi-gation, the blades were pitched in opposite direction at alltimes,which was found to provide the best performance in previousnumerical studies. The pitch angle magnitude was kept equalforboth foils.
The depth to which the rotational center of the WEC wassubmerged below the mean water surface,yc, could be adjustedfrom the surface toyc =−0.1m. This was achieved by adjustingthe supports on both sides of the WEC model, and was estimatedto be accurate to±0.5mm. In accordance with findings from pre-vious experimental investigations performed in the same facility,the submergence was kept constant in the present study at theoptimal value of|yc|−R= 15mm.
3.3 Wave GaugesTwo wire type wave gages for wave height measurements
were placed at a distance of 1.17m up- and down-stream of theWEC main shaft. The measurement of water level was by elec-trical resistance measurement. The wave gages were operatedwith 2.5 V, 5kHz AC and consisted of two stainless steel wiresand a ground electrode. The signal from the wave gages wasfirst filtered by a high-pass analog filter to remove any DC offset,then rectified and again low-pass filtered with a corner frequencyof 200Hz before it was amplified and digitized by a 10 bit A/Dconverter. The resulting measurements were transmitted over thesame CAN bus system that the main shaft controller employed,using CANOpen as the data protocol. The wave gages were cal-ibrated for a measurement range ofym = ±50mmbefore eachmeasurement session, and the calibration was repeated after the
6

η(xs,t)
Sensor
ωϕ αι
ω
α1
ϕ
α2
CycWEC
Wave Height H
Wave Travel Direction
Wave Period T
Wave Phase φ
Wave
State
Estimator
Controller
Figure 5. Block diagram of sensing and feedback control approach
last measurement run to verify that no drift in calibration had oc-curred. The overall accuracy and repeatability of the wave gagemeasurements was estimated to be better than±0.1mm basedon the repeat calibration results, or±0.5% of the design waveheight.
3.4 DAQ and Post ProcessingThe entire experiment was controlled by a WINDOWS XP
PC, using software written in LABView to transmit data over theCAN bus (Controller Area Network) to operate the wave maker,the wave gauges and the CycWEC. The received data was storedin Matlab files for post-processing. The sample rate of the sys-tem was 100 Hz for both position control as well as data acqui-sition, where all transmitted messages where synchronizedusingthe CANOpen sync messages. Every measurement lasted 61 sec-onds, but only the last 40 seconds when the flow had reached aperiodic state were used for data analysis by means of Fouriertransform to determine wave heights.
3.5 Feedback ControlA sketch of the overall control and estimation scheme is
shown in figure 5. The signal from the up-wave wave gage isused for feedback control, and processed first by the state esti-mator. The results of the state estimation algorithm are thein-stantaneous wave heightH, wave periodT, and wave phaseφ.These quantities are then used by the controller to prescribe themain shaft angleφ as well as the pitch of the blades. The fol-lowing subsections describe the estimator and controller in moredetail.
For the successful cancellation of an unknown, incomingharmonic wave, feedback control and wave state estimation were
necessary. Algorithms to interpret and estimate the wave statein real time fashion were needed to adequately control and effi-ciently extract energy. The wave state for a single airy wavewasdefined as phaseφ, frequencyω, and wave heightH. While dif-ferent types of sensors which measure the water elevation overtime may be employed, the wave gage that was placed upstreamof the CycWEC was used in this study. This measurement wasdefined asη(t) and displayed a periodic signal with unknown fre-quency and amplitude and was also corrupted by a small amountof high frequency noise. Given a time history of the upstreammeasurement a relation was sought such that[ω(t)φ(t)H(t)]T =f ([η(t),η(t −1), . . . ,η(t −n)]) + e(t) with minimal estimationerror,e(t). A typical Fourier analysis fell short because instan-taneous phase information was lost in the decomposition. Otherdigital signal processing methods needed to be implemented.
Because the upstream wave height measurement containedno negative frequency components, the signal could be expressedas an analytic signal such that
η(t) =12π
∫ ∞
0η(ω)ejωtdω (7)
A complex representation of a periodic signal isejωt = η(t) +iη(t). The complex component of the analytic signal, whichwas unknown at this point, was analogous to the Hilberttransformation,H [•], of the real component; that isη(t) =H [η(t)]. The Hilbert transformation was a linear filter whichproduced a phase shift of± π
2 over all frequencies present in thesignal,η(t). In the time domain the transformation for this linearfilter was identically the convolution with1πt which is shown as,
H [η(t)] =1πt
∗η(t) =1π
∫ ∞
−∞
η(t − τ)τ
dτ. (8)
In the frequency domain the transform of the signalf = 1πt is
− jsgn( f ) =
− j f > 00 f = 0j f < 0
(9)
The transfer function of this ideal filter did have a magnitude ofone and a phase of± π
2 for ±ω, respectively. Because the Fouriertransform was a non-causal transformation (dependent on previ-ous, current and future measurements), an approximation tothistransformation was necessary. Typical filters such as finiteim-pulse response (FIR) and infinite impulse response (IIR) filterscould be designed to simulate the response of1
πt . For the pur-poses of this paper, a three-stage cascading IIR filter was usedto estimate the complex component of the Hilbert transformation
7
with minimal (although non-linear) phase delays at the designfrequency.
Now that the real and complex components of the analyticsignal were known to within some degree of error, the instanta-neous amplitude was estimated from theL2 norm of the signals,i.e. H(t) = ‖η(t)+ ˆη(t)‖2. The instantaneous phase was thencomputed as the angle between the real and complex estimate as,φ(t) = arctan( η(t)
η(t) ), and the instantaneous frequency was calcu-lated by the time derivative of the phase estimate.
As seen in figure 5, the wave state is now fully estimated.The control scheme is very basic for the purposes of this pa-per. Proportional control is used for the blade pitch, such thatαi(t) = Pg
ˆH(t). This is a reasonable assumption since the openloop wave generation results shown in Siegel et al. [18] displaya very linear relationship between the circulationΓ and waveheightH. In order to implement rotary control for the wave en-ergy converter the group velocityCg needs to be estimated andcompensated for as a phase delay. The frequency of the pass-ing wave obtained from the estimator and water properties makethis a simple calculation. The time delays are then superimposedto control the rotational velocity of the main shaft in a stepwisefashion, such thatφ(t) = Φ(t)+ ηλ
Cg+ θ f , whereCg is the group
velocity of the wave, andθ f is the phase compensation of theHilbert transformation filter.
4 ResultsThe experiments in this study were conducted in two stages.
First, experimental runs were performed where the WEC was ex-posed to a superposition of two harmonic waves. The first wavewas at the design point of the wave energy converter and a mod-erate amplitude, i.e. a wave period ofT = 0.5s and a wave flapmaker deflection ofδ = 1.5◦. The second wave period was var-ied, which results in a modulated wave that exhibits an amplitudemodulation with the frequency difference between both waves.The results from these initial experiments are detailed in the nextsection. In a second testing campaign, the incoming wave wassynthesized from a larger number of harmonic waves whose am-plitudes followed a Bretschneider power distribution as outlinedin the experimental setup section. Here, the center frequencywas again at the design point of the WEC, and the number ofharmonic wave components was varied.
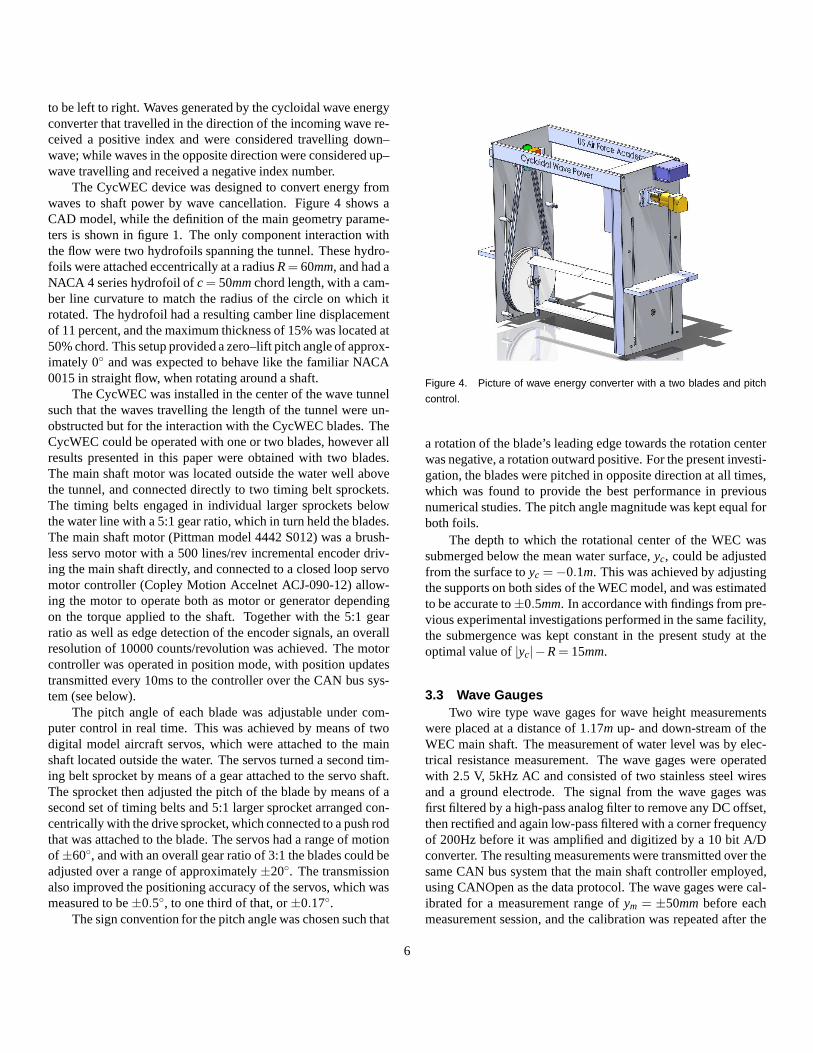
4.1 Wave Cancellation of Two Component WavesIn figures 6 and 8 a portion of the time signal, and a Fourier
Analysis of it are shown, respectively. The flap wave maker isoperated to produce a superposition of two waves, with wave pe-riodsT1 = 0.5sandT2 = 0.4swhich produces an incoming wavethat is modulated in amplitude with the frequency difference be-tween both. In order to efficiently cancel this wave, the estimatorneeds to correctly determine the instantaneous wave height. The
20 22 24 26 28 30−0.015
−0.01
−0.005
0
0.005
0.01
0.015
0.02
Time [s]
η [m
]
−1 λ+1 λ
Figure 6. Water surface during feedback controlled wave cancellation
of a two component wave system. Incoming wave periods T1 = 0.5s,
T2 = 0.4s, wave heights H1 = 17mmand H2 = 10mm. WEC has
two blades, feedback phase θ = 197◦, blade pitch gain Gp = 400◦/m,
submergence |yc|−R= 15mm.
estimated wave height at the wave energy converter is shown infigure 8. This estimate is used to change the blade pitch as out-lined in the section detailing the feedback control setup. As a re-sult of the wave energy conversion, all wave heights down-waveof the WEC are reduced in amplitude, for the first wave compo-nent fromH−1 = 16mmto H1 = 4mm, and for the second wavecomponent fromH−2 = 10mmto H2 = 5mm. The efficiency ofwave cancellation in this case is 77% accounting for power inallwaves.
In figures 9 and 10 a portion of the time signal, and aFourier Analysis of it are shown, respectively. The flap wavemaker is again operated to produce a superposition of two waves,this time with wave periodsT1 = 0.5s and T2 = 0.364s whichproduces an incoming wave that is modulated in amplitude withthe frequency difference between both that is larger than intheprevious case, causing a faster modulation of the wave height.The WEC is able to follow this modulation, resulting in an over-all cancellation efficiency of about 80%, which is comparable tothe data shown in the previous case. While not shown, differentcombinations of two harmonic waves were tested and producedsimilar results in terms of efficiency. This indicates that feedbackcontrol of the blade pitch angle is effective in cancelling incom-ing waves consisting of multiple plain wave components. Whilenot shown, experiments with different combinations of two plainwaves all showed results similar to those in presented in this sec-tion, with similar overall cancellation efficiencies.
8

1 1.5 2 2.5 3 3.5 40
0.005
0.01
0.015
Frequency [Hz]
Hsi
g [m
]
−1 λ+1 λ
Figure 7. Power Spectral Density of the surface elevation at the up-wave
and down-wave wave gage. For experimental parameters see caption of
figure 6
20 22 24 26 28 300
0.002
0.004
0.006
0.008
0.01
0.012
0.014
0.016
Time [s]
Est
imat
ed W
ave
Hei
ght [
m]
Figure 8. Estimated Wave Height at the WEC based on the up-wave
gage signal. For experimental parameters see caption of figure 6
4.2 Wave Cancellation of Irregular WavesIn this section, first pictures followed by data from typical
feedback controlled wave cancellation runs are presented.A sideview as well as a view of the experiment from above are shownin figures 11 and 12, respectively. The incoming wave, which istravelling left to right in both pictures, can be observed tobe oflarge wave height up-wave of the CycWEC, and greatly reducedwave height down-wave of the CycWEC.
Wave gage data from a typical feedback controlled exper-iment run, as observed by the up-wave and down-wave wave
30 32 34 36 38 40−0.015
−0.01
−0.005
0
0.005
0.01
0.015
0.02
Time [s]
η [m
]
−1 λ+1 λ
Figure 9. Water surface during feedback controlled wave cancellation
of a two component wave system. Incoming wave periods T1 = 0.5s,
T2 = 0.364s, wave heights H1 = 12mmand H2 = 10mm. WEC has
two blades, feedback phase θ = 197◦, blade pitch gain Gp = 400◦/m,
submergence |yc|−R= 15mm.
1 1.5 2 2.5 3 3.5 40
0.002
0.004
0.006
0.008
0.01
0.012
0.014
Frequency [Hz]
Hsi
g [m
]
−1 λ+1 λ
η = 0.79724
Figure 10. Power Spectral Density of the surface elevation at the up-
wave and down-wave wave gage. For experimental parameters see cap-
tion of figure 9
gages, is shown in figure 13. It can be observed that the waveheight down-wave is greatly reduced in amplitude, indicating en-ergy extraction by the CycWEC.
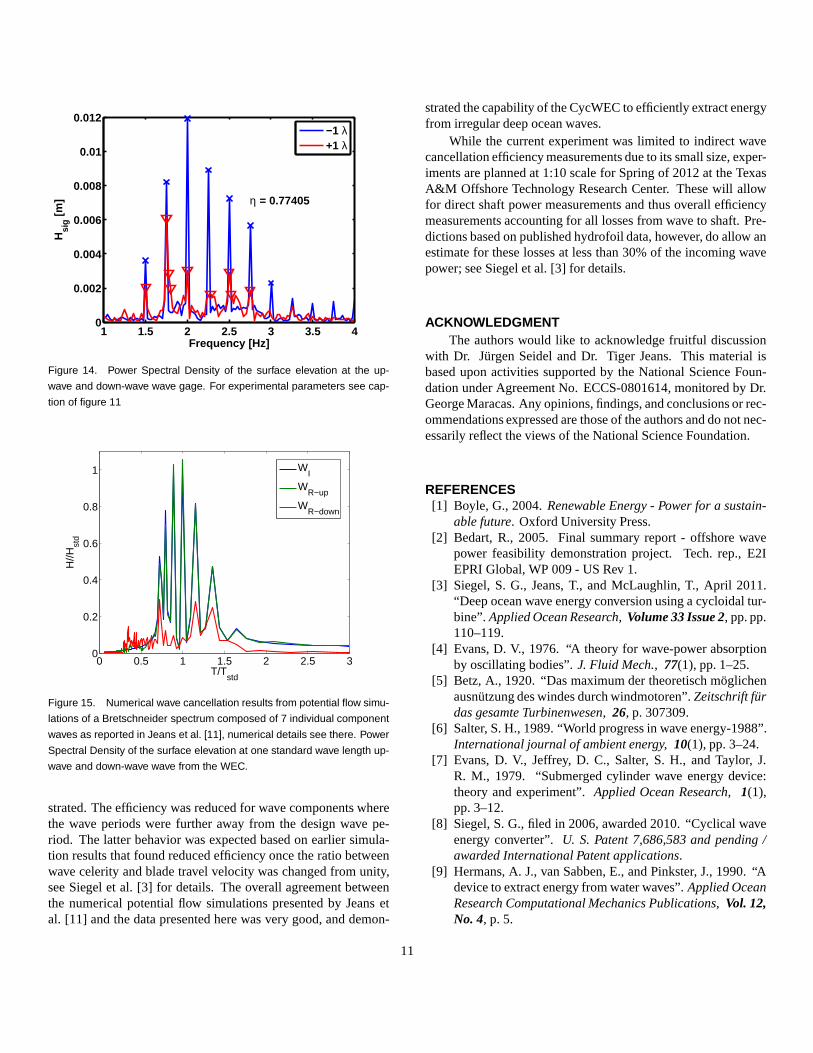
Analysis of data acquired after the system had reached a pe-riodic state, i.e. aftert = 20s, was performed using a Fouriertransform. The results for both wave gages are shown in fig-ure 14. The wave components of the incoming wave follow in
9

Figure 12. Picture of wave cancellation from side. For experimental parameters see caption figure 11
Figure 11. Picture of wave cancellation from down-wave above. Incom-
ing wave follows a Bretschneider spectrum with center period T = 0.5s,
significant wave height Hs = 15mm,and seven individual wave compo-
nents. WEC has two blades, feedback phase θ = 197◦, blade pitch gain
Gp = 400◦/m, submergence |yc|−R= 15mm.
their wave height a Bretschneider distribution, while the down-wave wave heights have been reduced for all wave components.Consequently, an overall inviscid efficiency of 77% was achievedin extracting energy from the incoming wave system.
For comparison to the present experimental results shownin figure 14, numerical simulation results for a 7 componentBretschneider wave are shown in figure 15. These results havebeen presented earlier in Jeans et al. [11], where the numericaldetails of the simulation along with other pertinent results canbe found. The numerical simulation achieved at 85% a slightlyhigher overall efficiency for the 7 component Bretschneiderwavecancellation. However, both spectra show similar reduction inwave heights for all waves, as can be seen by comparing fig-ures 14 and 15.
20 22 24 26 28 30−0.015
−0.01
−0.005
0
0.005
0.01
0.015
0.02
Time [s]
η [m
]
−1 λ+1 λ
Figure 13. Up-wave and down-wave water surface during feedback con-
trolled wave cancellation. For experimental parameters see caption fig-
ure 11
5 ConclusionWave cancellation results for a Cycloidal Wave Energy Con-
verter (CycWEC) model in a 1:300 scale wave tunnel experimentare presented. The wave energy converter was operated underfeedback control using a wave gage signal as input for a wave es-timator and CycWEC controller. The CycWEC was exposed towaves either consisting of two sinusoidal Airy waves, or a largernumber of Airy waves following a Bretschneider distribution inwave power. The latter is a good representation of a deep oceanwave field.
Based on the data presented in the preceding section, it isconcluded that the CycWEC under feedback control is able toefficiently cancel incoming irregular waves. Inviscid conversionefficiencies around 80% for a range of wave heights and waveperiods around the design wave of the CycWEC were demon-
10
1 1.5 2 2.5 3 3.5 40
0.002
0.004
0.006
0.008
0.01
0.012
Frequency [Hz]
Hsi
g [m
]
−1 λ+1 λ
η = 0.77405
Figure 14. Power Spectral Density of the surface elevation at the up-
wave and down-wave wave gage. For experimental parameters see cap-
tion of figure 11
0 0.5 1 1.5 2 2.5 30
0.2
0.4
0.6
0.8
1
T/Tstd
H//H
std
WI
WR−up
WR−down
Figure 15. Numerical wave cancellation results from potential flow simu-
lations of a Bretschneider spectrum composed of 7 individual component
waves as reported in Jeans et al. [11], numerical details see there. Power
Spectral Density of the surface elevation at one standard wave length up-
wave and down-wave wave from the WEC.
strated. The efficiency was reduced for wave components wherethe wave periods were further away from the design wave pe-riod. The latter behavior was expected based on earlier simula-tion results that found reduced efficiency once the ratio betweenwave celerity and blade travel velocity was changed from unity,see Siegel et al. [3] for details. The overall agreement betweenthe numerical potential flow simulations presented by Jeansetal. [11] and the data presented here was very good, and demon-
strated the capability of the CycWEC to efficiently extract energyfrom irregular deep ocean waves.
While the current experiment was limited to indirect wavecancellation efficiency measurements due to its small size,exper-iments are planned at 1:10 scale for Spring of 2012 at the TexasA&M Offshore Technology Research Center. These will allowfor direct shaft power measurements and thus overall efficiencymeasurements accounting for all losses from wave to shaft. Pre-dictions based on published hydrofoil data, however, do allow anestimate for these losses at less than 30% of the incoming wavepower; see Siegel et al. [3] for details.
ACKNOWLEDGMENTThe authors would like to acknowledge fruitful discussion
with Dr. Jurgen Seidel and Dr. Tiger Jeans. This material isbased upon activities supported by the National Science Foun-dation under Agreement No. ECCS-0801614, monitored by Dr.George Maracas. Any opinions, findings, and conclusions or rec-ommendations expressed are those of the authors and do not nec-essarily reflect the views of the National Science Foundation.
REFERENCES[1] Boyle, G., 2004.Renewable Energy - Power for a sustain-
able future. Oxford University Press.[2] Bedart, R., 2005. Final summary report - offshore wave
power feasibility demonstration project. Tech. rep., E2IEPRI Global, WP 009 - US Rev 1.
[3] Siegel, S. G., Jeans, T., and McLaughlin, T., April 2011.“Deep ocean wave energy conversion using a cycloidal tur-bine”.Applied Ocean Research,Volume 33 Issue 2, pp. pp.110–119.
[4] Evans, D. V., 1976. “A theory for wave-power absorptionby oscillating bodies”.J. Fluid Mech.,77(1), pp. 1–25.
[5] Betz, A., 1920. “Das maximum der theoretisch moglichenausnutzung des windes durch windmotoren”.Zeitschrift furdas gesamte Turbinenwesen,26, p. 307309.
[6] Salter, S. H., 1989. “World progress in wave energy-1988”.International journal of ambient energy,10(1), pp. 3–24.
[7] Evans, D. V., Jeffrey, D. C., Salter, S. H., and Taylor, J.R. M., 1979. “Submerged cylinder wave energy device:theory and experiment”.Applied Ocean Research,1(1),pp. 3–12.
[8] Siegel, S. G., filed in 2006, awarded 2010. “Cyclical waveenergy converter”.U. S. Patent 7,686,583 and pending /awarded International Patent applications.
[9] Hermans, A. J., van Sabben, E., and Pinkster, J., 1990. “Adevice to extract energy from water waves”.Applied OceanResearch Computational Mechanics Publications,Vol. 12,No. 4, p. 5.
11

[10] Siegel, S., Roemer, M., Imamura, J., Fagley, C., andMclaughlin, T., 2011. “Experimental wave generation andcancellation with a cycloidal wave energy converter”. In30th International Conference on Ocean, Offshore and Arc-tic Engineering (OMAE), no. OMAE2011-49212.
[11] Jeans, T., Siegel, S. G., Fagley, C., and Seidel, J., 2011.“Irregular deep ocean wave energy conversion using a cy-cloidal wave energy converter”. In 9th European Wave andTidal Energy Conference (EWTEC),Southampton, UK,September 5th 9th.
[12] Siegel, S., Fagley, C., Roemer, M., and McLaughlin, T.,2011. “Experimental wave cancellation using a cycloidalwave energy converter”. In 9th European Wave and TidalEnergy Conference (EWTEC),Southampton, UK, Septem-ber 5th 9th.
[13] Seelig, W., 1983. “Wave reflection from coastal structures”.In Proceedings of Coastal Structures, American Society ofCivil Engineers (ASCE), pp. 961–973.
[14] Cruz, J., 2008. Ocean wave energy: current status andfuture prepectives. Springer-Verlag.
[15] Newman, J. N., 1977.Marine Hydrodynamics. MIT Press.[16] McTaggart, K., September 2003. Modelling and simulation
of seaways in deep water for simulation of ship motions.Tech. Rep. Tech. Rep. DRDC Atlantic TM 2003-190, De-fence R&D Canada - Atlantic.
[17] , 1978. “Ittc seakeeping committee report”. In 15th Inter-national Towing Tank Conference, The Hauge, The Nether-lands.
[18] Siegel, S., Seidel, J., and McLaughlin, T., 2009. “Ex-perimental study of aero-optical distortions in a free shearlayer”. In AIAA Paper 2009-0361.
12


![[Krytyk] Omae Wo Onii-chan Ni Shiteyarouka! - Volume 03](https://img.dokumen.tips/doc/110x75/577c85821a28abe054bd77f2/krytyk-omae-wo-onii-chan-ni-shiteyarouka-volume-03.jpg)


![[Krytyk] Omae Wo Onii-chan Ni Shiteyarouka! - Volume 02](https://img.dokumen.tips/doc/110x75/577c85821a28abe054bd77cf/krytyk-omae-wo-onii-chan-ni-shiteyarouka-volume-02.jpg)
