Embed Size (px)
Citation preview

Department of Data Analysis Ghent University
Old and new approaches for the analysis ofcategorical data in a SEM framework
Yves RosseelDepartment of Data Analysis – Ghent University – Belgium
Myrsini KatsikatsouDepartment of Statistics – London Scool of Economics – UK
Meeting of the Working Group Structural Equation Modeling26 February 2015 – Freie Universitat Berlin
Yves Rosseel Old and new approaches for the analysis of categorical data in a SEM framework 1 / 32

Department of Data Analysis Ghent University
two approaches for handling categorical data in a SEM framework
• limited information approach
– only univariate and bivariate information is used– mainly developed in the SEM literature– perhaps the best known method: three-stage least squares (in Mplus:
estimator WLSMV)– new approach: pairwise likelihood estimation
• full information approach
– all information is used– frequentist approach: marginal maximum likelihood estimation∗ requires numerical integration (number of dimensions = number
of latent variables)∗ mainly developed in the IRT literature (and GLMM literature)∗ only recently incorporated in modern SEM software
– Bayesian approach
Yves Rosseel Old and new approaches for the analysis of categorical data in a SEM framework 2 / 32
Department of Data Analysis Ghent University
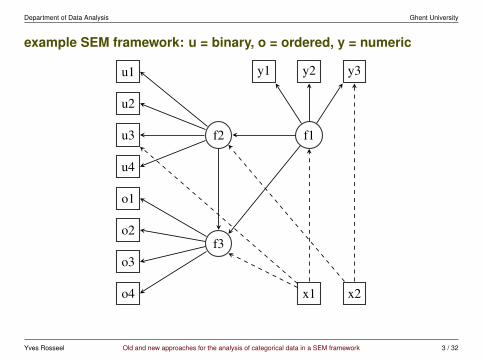
example SEM framework: u = binary, o = ordered, y = numeric
u1
u2
u3
u4
o1
o2
o3
o4
y1 y2 y3
f2
f3
f1
x1 x2
Yves Rosseel Old and new approaches for the analysis of categorical data in a SEM framework 3 / 32

Department of Data Analysis Ghent University
full information approach
• three approaches:
1. marginal maximum likelihood (MML)
2. latent response approach
3. (Bayesian estimation)
Yves Rosseel Old and new approaches for the analysis of categorical data in a SEM framework 4 / 32

Department of Data Analysis Ghent University
full information approach: marginal maximum likelihood
• origins: IRT models (eg Bock & Lieberman, 1970) and GLMMs
• the marginal likelihood for the response vector yi can be written as
Li(θ) = f(yi|xi;θ) =
∫D(η)
f(yi|η,xi;θ)f(η|xi;θ)dη
where yi are observed endogenous variables, xi are observed exogenouscovariates, and η are latent variables; D(η) is the domain of integration; θis the parameter vector
• numerical integration
– Gauss-Hermite quadrature– adaptive quadrature– Laplace approximation– Monte Carlo integration
• some clever ‘dimension reduction’ techniques exist for special cases
Yves Rosseel Old and new approaches for the analysis of categorical data in a SEM framework 5 / 32

Department of Data Analysis Ghent University
available software for the marginal maximum likelihood approach
• commercial software:
– SEM software: Mplus, . . .
– IRT software: BILOG-MG, MUTLILOG, PARSCALE, TESTFACT,EQSIRT, IRTPRO, flexMIRT, . . .
• non-commercial, open-source software
– the Stata module ‘gllamm’
– R packages for IRT: TAM, mirt, . . . (see the CRAN Task View: Psy-chometric Models and Methods) and lme4
– R packages for SEM: OpenMx, lavaan (since 0.5-16, but slow)
Yves Rosseel Old and new approaches for the analysis of categorical data in a SEM framework 6 / 32

Department of Data Analysis Ghent University
full information approach: latent response approach (1)
• an observed variable y can often be viewed as a partial observation of a latentcontinuous response y?; eg ordinal variable withK = 4 response categories:
latent continuous response y*
−1.4 0.8 1.8
0.0
0.1
0.2
0.3
0.4
y=1 y=2 y=3 y=4
t1
t2
t3
Yves Rosseel Old and new approaches for the analysis of categorical data in a SEM framework 7 / 32

Department of Data Analysis Ghent University
full information approach: latent response approach (2)
• assumption: both latent continuous responses (y?) and latent variables (η)are multivariate normal
• the likelihood contribution for observation i is given by
Li(θ) = f(yi|xi;θ) =
∫T(y?
i)
N [y?i |µi(θ),Σi(θ)] dy?i
where yi are observed endogenous variables, xi are observed exogenouscovariates; T (y?i ) is the integration region (defined by the thresholds)
• the order of integration equals the number of (non-continuous) observedvariables
• some examples in the literature exist, up to 4 variables
Yves Rosseel Old and new approaches for the analysis of categorical data in a SEM framework 8 / 32

Department of Data Analysis Ghent University
available software for the full information latent response approach
• commercial software:
– none?
• non-commercial, open-source software
– R package lavaan (since version 0.5-15)
– estimator="FML"
– integration is done by the sadmvn() function in the R package mnormt– no analytical gradient (for now)
– just for fun
Yves Rosseel Old and new approaches for the analysis of categorical data in a SEM framework 9 / 32

Department of Data Analysis Ghent University
limited information approaches
1. three stage least squares (Mplus WLSMV)
2. pairwise likelihood estimation
Yves Rosseel Old and new approaches for the analysis of categorical data in a SEM framework 10 / 32

Department of Data Analysis Ghent University
the three stage least squares estimator
• developed by Bengt Muthen, in a series of papers; the seminal paper is
Muthen, B. (1984). A general structural equation model withdichotomous, ordered categorical, and continuous latent variableindicators. Psychometrika, 49, 115–132
• this approach has been the ‘golden standard’ in the SEM literature for almostthree decades
• first available in LISCOMP (Linear Structural Equations using a Compre-hensive Measurement Model), distributed by SSI, 1987 – 1997
• follow up program: Mplus (Version 1: 1998), currently version 7.3
• other authors (Joreskog 1994; Lee, Poon, Bentler 1992) have proposed sim-ilar approaches (implemented in LISREL and EQS respectively)
• another great program: MECOSA (Arminger, G., Wittenberg, J., Schepers,A.) written in the GAUSS language (mid 90’s)
Yves Rosseel Old and new approaches for the analysis of categorical data in a SEM framework 11 / 32

Department of Data Analysis Ghent University
stage 1 – estimating the thresholds
• estimating the thresholds: maximum likelihood using univariate data
– if no exogenous variables, this is just# generate ‘ordered’ data with 4 categoriesY <- sample(1:4, size = 100, replace = TRUE)
prop <- table(Y)/sum(table(Y))cprop <- c(0, cumsum(prop))
th <- qnorm(cprop)
– in the presence of exogenous covariates, this is just ordered probit re-gressionlibrary(MASS)X1 <- rnorm(100); X2 <- rnorm(100); X3 <- rnorm(100)
fit <- polr(ordered(Y) ˜ X1 + X2 + X3, method = "probit")fit$zeta
Yves Rosseel Old and new approaches for the analysis of categorical data in a SEM framework 12 / 32

Department of Data Analysis Ghent University
stage 2 – estimating tetrachoric, polychoric, . . . , correlations
• estimate tetrachoric/polychoric/. . . correlation from bivariate data:
– tetrachoric (binary – binary)
– polychoric (ordered – ordered)
– polyserial (ordered – numeric)
– biserial (binary – numeric)
– pearson (numeric – numeric)
• ML estimation is available (see eg. Olsson 1979 and 1982)
– two-step: first estimate thresholds using univariate information only;then, keeping the thresholds fixed, estimate the correlation
– one-step: estimate thresholds and correlation simultaneously
• if exogenous covariates are involved, the correlations are based on the resid-ual values of y? (eg bivariate probit regression)
Yves Rosseel Old and new approaches for the analysis of categorical data in a SEM framework 13 / 32
Department of Data Analysis Ghent University
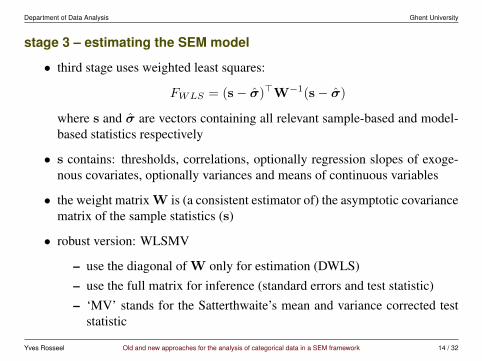
stage 3 – estimating the SEM model
• third stage uses weighted least squares:
FWLS = (s− σ)>W−1(s− σ)
where s and σ are vectors containing all relevant sample-based and model-based statistics respectively
• s contains: thresholds, correlations, optionally regression slopes of exoge-nous covariates, optionally variances and means of continuous variables
• the weight matrix W is (a consistent estimator of) the asymptotic covariancematrix of the sample statistics (s)
• robust version: WLSMV
– use the diagonal of W only for estimation (DWLS)– use the full matrix for inference (standard errors and test statistic)– ‘MV’ stands for the Satterthwaite’s mean and variance corrected test
statistic
Yves Rosseel Old and new approaches for the analysis of categorical data in a SEM framework 14 / 32

Department of Data Analysis Ghent University
available software for the WLSMV estimator
• commercial software:
– golden standard: Mplus (since 1998)
– LISREL and EQS have similar capabilities (but less general)
– MECOSA (mid ’90s, not available anymore)
• non-commercial, open-source software
– R package lavaan (since version 0.5)
– estimator="WLSMV" is the default estimator if some of the ob-served (endogenous) variables are categorical
– full implementation including ‘delta’ and ‘theta’ parameterization formultiple groups and/or longitudinal data
Yves Rosseel Old and new approaches for the analysis of categorical data in a SEM framework 15 / 32

Department of Data Analysis Ghent University
pairwise likelihood (PL) estimation
• special case of the broader framework of ‘composite’ likelihood estimation
– key idea: the complex likelihood is broken down as a (weighted) prod-uct of component likelihoods which are easier to handle (computation-ally)
– composite ML estimators are asymptotically unbiased, consistent, andnormally distributed
– key references:Lindsay, B. (1998). Composite likelihood methods. Contem-porary Mathematics, 80, 221–239Varin, C. (2008). On composite marginal likelihoods. Ad-vances in Statistical Analysis, 92(1), 1–28.
• introduced in the SEM literature by Joreskog & Moustaki (2001), De Leon(2005), Liu (2007), Xi (2011), Katsikatsou et al. (2012)
• computational complexity can be kept low regardless the number of ob-served and latent variables
Yves Rosseel Old and new approaches for the analysis of categorical data in a SEM framework 16 / 32
Department of Data Analysis Ghent University
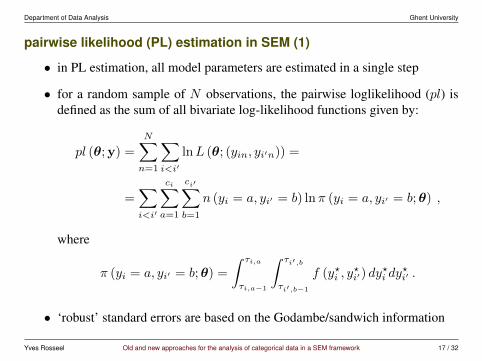
pairwise likelihood (PL) estimation in SEM (1)
• in PL estimation, all model parameters are estimated in a single step
• for a random sample of N observations, the pairwise loglikelihood (pl) isdefined as the sum of all bivariate log-likelihood functions given by:
pl (θ;y) =
N∑n=1
∑i<i′
lnL (θ; (yin, yi′n)) =
=∑i<i′
ci∑a=1
ci′∑b=1
n (yi = a, yi′ = b) lnπ (yi = a, yi′ = b;θ) ,
where
π (yi = a, yi′ = b;θ) =
∫ τi,a
τi,a−1
∫ τi′,b
τi′,b−1
f (y?i , y?i′) dy
?i dy
?i′ .
• ‘robust’ standard errors are based on the Godambe/sandwich information
Yves Rosseel Old and new approaches for the analysis of categorical data in a SEM framework 17 / 32
Department of Data Analysis Ghent University
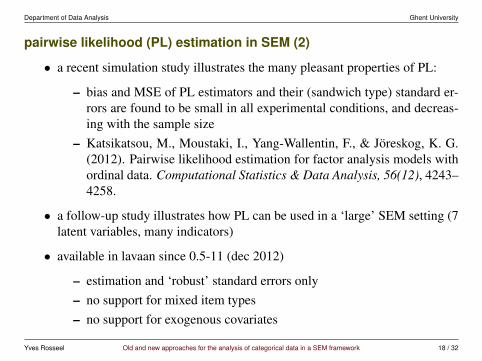
pairwise likelihood (PL) estimation in SEM (2)
• a recent simulation study illustrates the many pleasant properties of PL:
– bias and MSE of PL estimators and their (sandwich type) standard er-rors are found to be small in all experimental conditions, and decreas-ing with the sample size
– Katsikatsou, M., Moustaki, I., Yang-Wallentin, F., & Joreskog, K. G.(2012). Pairwise likelihood estimation for factor analysis models withordinal data. Computational Statistics & Data Analysis, 56(12), 4243–4258.
• a follow-up study illustrates how PL can be used in a ‘large’ SEM setting (7latent variables, many indicators)
• available in lavaan since 0.5-11 (dec 2012)
– estimation and ‘robust’ standard errors only– no support for mixed item types– no support for exogenous covariates
Yves Rosseel Old and new approaches for the analysis of categorical data in a SEM framework 18 / 32

Department of Data Analysis Ghent University
inference under PL in a SEM framework
• reference:
Katsikatsou, M., Moustaki, I. (under revision). Inference underpairwise likelihood for structural equation models with ordinalvariables.
• inference:
– Wald test
– Pairwise Likelihood Ratio Test (PLRT) for overall fit
– PL-AIC and PL-BIC
– PLRT for comparing nested models
• available in the development version of lavaan (0.5-18)
Yves Rosseel Old and new approaches for the analysis of categorical data in a SEM framework 19 / 32

Department of Data Analysis Ghent University
lavaan example
• simulated dataset (N = 500)
– 7 latent variables (2 endogenous, 5 exogenous)
– 45 ordinal indicators (4 response categories)
– structural part:
ξ6 ∼ ξ1 + ξ2 + ξ3 + ξ4 + ξ5
ξ7 ∼ ξ5 + ξ6
• timings:
– lavaan estimator = “PML”: currently takes about 36 minutes (3 minestimation, 17min standard errors, 16min test statistic)
– lavaan estimator = “WLSMV” about 3 minutes
– Mplus estimator = “ML”, integration = montecarlo (700), default set-tings: 1h 17min, but failed with THE MODEL ESTIMATION DID NOT TERMINATE NORMALLY
Yves Rosseel Old and new approaches for the analysis of categorical data in a SEM framework 20 / 32

Department of Data Analysis Ghent University
lavaan inputlibrary(lavaan)
Data <- read.csv("rx.ord")Data[,] <- lapply(Data[,], ordered)
simModel <- ’# exogenous lvksi1 =˜ V1 + V2 + V3 + V4 + V5ksi2 =˜ V6 + V7 + V8ksi3 =˜ V9 + V10 + V11 + V12 + V13ksi4 =˜ V14 + V15 + V16ksi5 =˜ V17 + V18 + V19 + V20 + V21
# endogenous lvksi6 =˜ V22 + V23 + V24 + V25 + V26 + V27 + V28 + V29 +
V30 + V31 + V32 + V33 + V34 + V35 + V36 + V37 + V38ksi7 =˜ V39 + V40 + V41 + V42 + V43 + V44 + V45
# structural modelksi6 ˜ ksi1 + ksi2 + ksi3 + ksi4 + ksi5ksi7 ˜ ksi5 +ksi6
’
fit <- sem(model = simModel, data = Data, estimator = "PML")
Yves Rosseel Old and new approaches for the analysis of categorical data in a SEM framework 21 / 32
Department of Data Analysis Ghent University
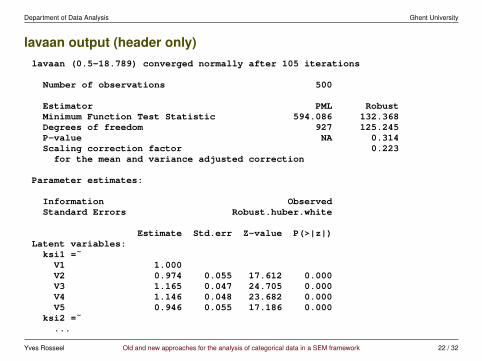
lavaan output (header only)lavaan (0.5-18.789) converged normally after 105 iterations
Number of observations 500
Estimator PML RobustMinimum Function Test Statistic 594.086 132.368Degrees of freedom 927 125.245P-value NA 0.314Scaling correction factor 0.223for the mean and variance adjusted correction
Parameter estimates:
Information ObservedStandard Errors Robust.huber.white
Estimate Std.err Z-value P(>|z|)Latent variables:ksi1 =˜V1 1.000V2 0.974 0.055 17.612 0.000V3 1.165 0.047 24.705 0.000V4 1.146 0.048 23.682 0.000V5 0.946 0.055 17.186 0.000
ksi2 =˜...
Yves Rosseel Old and new approaches for the analysis of categorical data in a SEM framework 22 / 32

Department of Data Analysis Ghent University
last slide
• PL estimation is a (relatively) new approach for handling categorical data ina SEM framework
– PL can handle a large number of observed and latent variables
– PL has many attractive statistical properties
– support for the ‘full’ SEM framework
• the R package lavaan:
– still catching-up in the ‘full information ML’ area (but wait for 0.6!)
– full support for WLSMV (and friends)
– PL is currently only implemented in lavaan∗ no support for inference in multiple groups yet!∗ complete data only (PL with missing values is ongoing research)
Yves Rosseel Old and new approaches for the analysis of categorical data in a SEM framework 23 / 32

Department of Data Analysis Ghent University
Thank you!
(questions?)
http://lavaan.org
Yves Rosseel Old and new approaches for the analysis of categorical data in a SEM framework 24 / 32

Department of Data Analysis Ghent University
PL estimation: likelihood
• basic assumption:(y?iy?i′
)∼ N2
((0
0
),
(1
ρi′i 1
))
• the pl for N independent observations:
pl (θ;y) =
N∑n=1
∑i<i′
lnL (θ; (yin, yi′n)) =
=∑i<i′
ci∑a=1
ci′∑b=1
n (yi = a, yi′ = b) lnπ (yi = a, yi′ = b;θ) ,
where
π (yi = a, yi′ = b;θ) =
∫ τi,a
τi,a−1
∫ τi′,b
τi′,b−1
f (y?i , y?i′) dy
?i dy
?i′ .
Yves Rosseel Old and new approaches for the analysis of categorical data in a SEM framework 25 / 32

Department of Data Analysis Ghent University
properties of the pairwise likelihood estimator
• θPL = maxθpl (θ;y)
• under regularity conditions upon the component likelihoods,
√N(θPL − θ
)→ N
(0, G−1(θ)
)where
G(θ) = H(θ)J−1(θ)H(θ)
and
H(θ) = E
{− ∂2
∂θ′∂θpl(θ;y)
}J(θ) = V ar
{∂
∂θ′pl(θ;y)
}
Yves Rosseel Old and new approaches for the analysis of categorical data in a SEM framework 26 / 32

Department of Data Analysis Ghent University
PLRT for nested models (1)
• let θ be partitioned as θ = (ψ′,ω′)′, whereψ : vector of parameters of interest of dimension d,ω : vector of nuisance parameters.
• consider the hypothesis:
H0 : ψ = ψ0 vs H1 : ψ 6= ψ0
• Pace et al. (2011),
PLRT (ψ0) = 2(pl(θ)− pl
(θ))
,
where θ = (ψ′, ω′)′ and θ = (ψ′0, ω′ψ0
)′ are the PL estimators under H1
and H0, respectively.
• the standard asymptotic result that, under H0, PLRT → χ2diff cannot be
used.
Yves Rosseel Old and new approaches for the analysis of categorical data in a SEM framework 27 / 32

Department of Data Analysis Ghent University
PLRT for nested models (2)
• instead, we use a Satterthwaite approximation; under H0,
E (PLRT (ψ0))12 ∗ V ar (PLRT (ψ0))
PLRT (ψ0)→ χ2v
where v = [E(PLRT (ψ0))]2
12∗V ar(PLRT (ψ0))
,
E (PLRT (ψ0))→ tr(Gψψ
[Hψψ
]−1),
V ar (PLRT (ψ0))→ 2 ∗ tr(Gψψ
[Hψψ
]−1Gψψ
[Hψψ
]−1),
• Gψψ and Hψψ are the parts of G−1 and H−1 that refer to ψ.
Yves Rosseel Old and new approaches for the analysis of categorical data in a SEM framework 28 / 32

Department of Data Analysis Ghent University
PL version of AIC and BIC
• AICPL based on Varin & Vidoni (2005):
AICPL = −2 ∗ pl(θPL;y
)+ 2 ∗ tr(J(θPL)H−1(θPL))
• BICPL based on Gao and Song (2009):
BICPL = −2 ∗ pl(θPL;y
)+ logN ∗ tr(J(θPL)H−1(θPL))
Yves Rosseel Old and new approaches for the analysis of categorical data in a SEM framework 29 / 32

Department of Data Analysis Ghent University
PLRT for overall fit (1)
• let θ be partitioned as θ = (ϕ′, τ ′)′, where τ : the vector of thresholds,ϕ : the vector of the rest SEM parameters, dimension d.
• recall P ≡ Corr (y?); let ρ = vech (P ), dimension p
• consider the hypothesis:
H0 : ρ = g(ϕ) versus H1 : ρ unconstrained
where g : Rd → Rp
• under H1, the parameter vector ϑ is partitioned as ϑ = (ρ′, τ ′)′
• τ : nuisance parameter
Yves Rosseel Old and new approaches for the analysis of categorical data in a SEM framework 30 / 32

Department of Data Analysis Ghent University
PLRT for overall fit (2)
• letPLRTSEM = 2
(pl(ϑ)− pl
(θ))
,
where ϑ = (ρ′, τ ′)′ and θ = (ϕ′, τ ′)′ are the PL estimates under H1 andH0, respectively
• under H0,E (PLRTSEM )
12 ∗ V ar (PLRTSEM )
PLRTSEM → χ2v
where
v =[E (PLRTSEM )]
2
12 ∗ V ar (PLRTSEM )
Yves Rosseel Old and new approaches for the analysis of categorical data in a SEM framework 31 / 32

Department of Data Analysis Ghent University
PLRT for overall fit (3)
• mean:
E (PLRTSEM )→ tr(Gρρ [Hρρ]
−1)− tr
(Gϕϕ [Hϕϕ]
−1)
• variance:
V ar (PLRTSEM )→ 2 ∗ tr(Gρρ [Hρρ]
−1Gρρ [Hρρ]
−1)
+ 2 ∗ tr(Gϕϕ [Hϕϕ]
−1Gϕϕ [Hϕϕ]
−1)
− 4 ∗ tr(M ′ [Hρρ]
−1MGϕϕ [Hϕϕ]
−1Gϕϕ
)where
M =∂
∂ϕg (ϕ)
∣∣∣∣ϕ=ϕ0
Yves Rosseel Old and new approaches for the analysis of categorical data in a SEM framework 32 / 32