Embed Size (px)
Citation preview
Oklahoma Virtual Charter School Funding Study COMMISSIONED BY THE STATEWIDE VIRTUAL CHARTER SCHOOL BOARD
Prepared by: NACSA and Afton Partners
Authors: Elisa Westapher, NACSA
Jason Zwara, NACSA
Scott Milam, Afton
Mitch Mraz, Afton
June 2021

Contents
Executive Summary ........................................................................................................... 1
Section 1: Introduction ...................................................................................................... 6
Section 2: How States Fund Virtual Charter Schools .................................................... 11
Count Day States .......................................................................................................... 13
Average Daily Membership States .............................................................................. 15
Average Daily Attendance States ................................................................................ 20
Section 3: Existing Research on Virtual Charter School Funding ................................. 23
Section 4: Real Costs Analysis ......................................................................................... 34
Section 5: Discussion and Recommendations .............................................................. 60
Approaches and Recommendations for Funding Virtual Charter Schools ............. 61
Fiscal and Operational Transparency Recommendations ....................................... 68
www.qualitycharters.org
1
Oklahoma Virtual Charter School Funding Study COMMISSIONED BY THE STATEWIDE VIRTUAL CHARTER SCHOOL BOARD
Executive Summary
Background
In response to the Solicitation issued by the Statewide Virtual Charter School Board (SVCSB), the
National Association of Charter School Authorizers (NACSA) and Afton Partners (Afton) researched:
• How Oklahoma and other states fund virtual charter schools;
• Existing research and recommendations on virtual charter school funding;
• The “real costs” of educating a student in Oklahoma’s virtual charter school learning
environment; and
• How other states’ funding methods could translate to Oklahoma’s school funding and
taxation structure (collectively, the “Research”).
Context
Oklahoma has a large and rapidly growing virtual charter school sector. Virtual charter schools in
Oklahoma currently serve more than 40,000 students. While the pandemic has led to a recent surge
in virtual charter school enrollment in Oklahoma and across the United States, Oklahoma’s virtual
charter school sector has been steadily growing for years, with enrollment increasing more than 62
percent from FY17 to FY20.1
Despite this growth, virtual charter schools in Oklahoma underperform academically compared to
non-virtual charter schools and traditional public schools. Based on Oklahoma School Report Card
data, virtual charter schools significantly lag both brick-and-mortar charter and traditional public
schools on multiple measures, including overall performance, student achievement, and student
growth. Most significantly, the average virtual charter school Growth Composite Indicator,
Oklahoma’s academic metric of student growth, for FY19 was 34 percentage points below the
average non-virtual charter school score and 24 percentage points below the average traditional
school score.2
The virtual charter school sector is also associated with a student mobility rate that is twice that of
non-virtual school students nationally.3 While short-term enrollment can be intentional or
unintentional, this high rate of student mobility disrupts learning, makes it harder to capture
accurate student counts for funding, and decreases the number of students included for
accountability purposes. One other critical characteristic of Oklahoma’s virtual charter school sector
is the prevalence of for-profit management companies, which contract with the majority of virtual
charter schools in Oklahoma. Since for-profit management companies are private entities, they are
not required by law to provide the same level of fiscal and operational transparency as traditional
public and brick-and-mortar charter schools.
1 Virtual charter LEA enrollment, based on October 1 enrollment counts. 2 Oklahoma School Report Card data for FY19, https://escmatrix.com/ok/#matrix. 3 Online Charter School Study: 2015, CREDO, https://credo.stanford.edu/sites/g/files/sbiybj6481/f/online_charter_study_final.pdf.

www.qualitycharters.org
2
Oklahoma Virtual Charter School Funding Study COMMISSIONED BY THE STATEWIDE VIRTUAL CHARTER SCHOOL BOARD
Findings
How Oklahoma and Other States Fund Virtual Charter Schools
In Oklahoma, virtual charter schools are funded through the same primary formulas as brick-and-
mortar charter schools, with a few minor modifications. First, virtual charter schools are limited as to
when a prior year’s average daily membership (ADM) count may be used for aid calculations: if the
school’s current year ADM count has fallen more than 15 percent from the prior year, the current
year must be used.4 Second, virtual charter schools are generally not eligible for transportation aid.
Third, virtual charter schools must comply with additional requirements regarding enrollment,
including when a student is deemed “in attendance,” which impacts state aid calculations.5
Despite the unique characteristics of virtual charter schools, there has been minimal innovation and
differentiation regarding how virtual charter schools are funded across the country. The few states
that do modify how virtual charter schools are funded do so in primarily one of three ways:
• Cap on share of per-pupil aid virtual charter schools receive: Some states cap the share of
state per-pupil aid, typically at 85-95 percent of the base amount, a virtual charter school
receives.
• Conditional funding on dedicated expenditures or performance: A few states make a portion
of state aid conditional on either the school providing specific services (such as providing
students necessary computer hardware), meeting certain spending thresholds (such as
spending a specific portion of revenue on direct instructional costs), or meeting academic
performance benchmarks.
• Completion-based funding: A handful of states make a portion or all per-pupil funding
contingent on a student’s successful completion of a course. Two states (New Hampshire
and Florida) apply this model to all full-time virtual charter schools.
Summary of Existing Research and Recommendations on Virtual Charter School Funding
Most research on full-time virtual charter schools has not focused on the funding of virtual charter
schools. Instead, it has focused primarily on the growth of the sector, the characteristics of students
who attend virtual charter schools, and the corresponding academic performance of virtual charter
schools. Of the research on virtual charter school funding, most focuses on how states fund virtual
charter schools, grouping states according to various approaches and highlighting examples of
these approaches in action. Far less attention has been paid to questions related to the cost of
educating a student in a full-time virtual environment in comparison to the cost of educating a
student in a traditional brick-and-mortar school environment.
Our review and summary of the existing body of research in this area aligned with our findings in
other sections of the report, including, but not limited to:
• States largely fund virtual charter schools in the same manner as brick-and-mortar charter
schools, primarily relying on the same methods of counting students and applying the same
per-pupil weights and funding rates.
4 70 O.S. §18-201.1(B). 5 70 O.S. §3-145.8.

www.qualitycharters.org
3
Oklahoma Virtual Charter School Funding Study COMMISSIONED BY THE STATEWIDE VIRTUAL CHARTER SCHOOL BOARD
• There has been minimal innovation regarding how states fund virtual charter schools (with
the typical exception being those states that use a completion-based funding model).
• Very little research has been done on the impact of completion-based funding on schools
and students from a financial or academic perspective.
• In most states funding for virtual charter schools is on par with funding for brick-and-mortar
charter schools.
• In assessing the cost of educating a student in a virtual learning environment, it is important
to differentiate between studies that look at the “actual” costs and those that analyze the
amount needed to “adequately” educate a virtual charter school student.
It is important to note that the relevant findings and recommendations highlighted in the summary
of the existing research are as of the publication date of the research and that we did not
independently fact check these research reports.
The “Real Costs” of Educating a Student in Oklahoma’s Virtual Charter School Learning Environment
To assess the “real costs” for educating a student in Oklahoma’s virtual charter school learning
environment, we evaluated actual historical local education agency-level (LEA) expenditure data as
published in the Oklahoma Cost Accounting System (OCAS)6 along with student enrollment, ADM,
and student needs data. By focusing on the reported actual historical expenditure data to analyze
real costs, this analysis intentionally does not quantify, propose, or prescribe the costs that a virtual
charter LEA should incur or the resources a virtual LEA should allocate to provide an adequate level
of education to its students.
Oklahoma’s virtual charter LEAs report a wide variation of per-pupil expenditures. Depending on the
model employed and student needs, virtual LEAs spent between $6,044 to $8,419 per pupil in FY20.7
While variability exists in total and functional area per-pupil spend, each operator’s highest
functional area of spend is on instruction and instructional staff, with an average virtual charter LEA
spend of $4,952 per pupil or 70 percent of total expenditures. The next highest functional area of
spend is on student support services, with average spend of $789 per pupil or 11 percent of total
expenditures.
While Oklahoma’s virtual charter LEAs are funded through the same State Foundation Aid funding
formula, with no “virtual discount” as applied in some other states, data shows that, on average,
virtual charter LEAs received slightly lower levels of state and local funding per pupil and reported
lower per-pupil expenditure levels than both non-virtual charter LEAs and traditional LEAs in the
state.8 This is, in part, attributable to differences in school size and location, non-state foundation
funding formula revenues, the state’s use of “high year weighted ADM” to calculate Foundation Aid
funding, differences in student needs, and differences in reported levels of net surplus and loss at
individual LEAs. Data confirms that virtual LEAs do not have to spend on many non-instructional,
“brick and mortar”-related expenditures such as building maintenance and operations,
transportation, and food services. Some of these expenditures (such as food services and student
6 OCAS is available through the Oklahoma State Department of Education’s website at https://sdeweb01.sde.ok.gov/OCAS_Reporting/. 7 Using full-year ADM; this analysis includes the largest virtual charter LEA, Epic One-on-One Charter School. However, some other analyses exclude Epic One-on-One
Charter School. When Epic One-on-One Charter School is excluded, it is noted. 8 Given the discretionary nature of funding sources, LEAs (regardless of school type) report substantial variation in the way they spend funds. This report shares
comparisons of virtual charter LEAs to non-virtual charter LEAs and traditional LEAs, but it is important to keep in mind the variability in spend within each of these
groups – on total expenditures, and on types of expenditures as well.

www.qualitycharters.org
4
Oklahoma Virtual Charter School Funding Study COMMISSIONED BY THE STATEWIDE VIRTUAL CHARTER SCHOOL BOARD
transportation) can be funded in part with incremental state and federal funding streams.
Additionally, data shows that virtual charter LEAs also spent more per pupil than non-virtual charter
and traditional LEAs on student support services and less per pupil on instruction, on average.
Approaches and Recommendations for Funding Virtual Charter Schools
Based on the Research, we examined the primary ways that states differ in how they fund virtual
charter schools and analyzed how those approaches could translate to Oklahoma’s local context. For
each approach, we offer recommendations for Oklahoma and an assessment of implementation
considerations. However, it is important to note that while a funding approach may incent improved
student outcomes, a funding approach does not and should not replace the need for strong
accountability systems that set a high bar for entry, proactively monitor for compliance with existing
law, and close low-performing schools.
Adjusting How Students Are Counted for School Funding Purposes
Recommendations. To provide a more accurate pupil count for virtual charter schools, Oklahoma
should:
• Consider counting ADM throughout the entire year for virtual charter schools, which have high
levels of student mobility.
• Develop a system to effectively monitor and track schools’ adherence to the attendance policy
requirements adopted in 20209, ensuring that students not actively engaged in instructional
activities are removed from the enrollment count.10
• Define “recurrent enrollment” as set forth in Section 135 of Oklahoma’s charter school law to
develop a better and more formalized means of tracking student mobility in Oklahoma virtual
charter schools.
Key Implementation Considerations. Modifying how ADM is calculated for virtual charter schools
would not require the creation of new data and reporting system since it would only extend the
range of school days included in the aid count. However, using two different methods to count
pupils – one for virtual charter schools and the other for traditional public and brick-and-mortar
charter schools – may pose certain challenges if they are interrelated or rely on each other for final
aid calculations.
Capping the Percentage of State Aid a Virtual Charter School May Receive
Recommendation. We do not recommend capping the amount of funding virtual charter schools in
Oklahoma receive at this time for two reasons. First, Oklahoma’s current average per-pupil spend on
education is already one of the lowest in the country. Second, any cap on funding should be
preconditioned on the completion of an adequacy study, which has not yet been done in Oklahoma.
An “adequacy” study, in contrast to the “Real Costs” study done for this report, would determine
whether the current level of funding is sufficient for virtual charter schools to provide an “adequate
level of education” for its students.
9 New attendance policy requirements for virtual charter schools were passed in 2020 as part of Oklahoma HB2905. See 70 OS §3-145.8. 10 In doing so, Oklahoma should also further examine the impact and potential unintended consequences of this new attendance policy on those virtual charter schools
serving alternative education student populations.

www.qualitycharters.org
5
Oklahoma Virtual Charter School Funding Study COMMISSIONED BY THE STATEWIDE VIRTUAL CHARTER SCHOOL BOARD
Conditional Funding or Incentives for Virtual Charter Schools
Recommendation. Oklahoma should further explore a funding approach for its virtual charter
schools that would tie a portion of state funding to meeting certain academic thresholds or
spending in certain categories associated with student instruction and learning. This approach could
promote student learning by aligning funding with student outcomes. It could also increase
transparency and promote student learning by aligning funding with spending in certain student-
and instructional-focused areas.
Key Implementation Considerations. To implement this type of funding model, Oklahoma should
further study similar approaches in other states and what impact, if any, these incentives or
conditions have had on student outcomes. To implement such a model, Oklahoma would also need
to consider the nature of the academic or spending incentives, the amount of the holdback, and a
verification process. Oklahoma would also need to consider what happens to any remaining funds
(if such incentive funding is not distributed).
Completion-based Funding Formulas
Recommendation. To promote student learning by aligning funding with student outcomes,
Oklahoma should further explore using a completion-based approach to fund its virtual charter
schools. We recognize that this model is not yet supported with robust research on the impact of
this funding approach on student outcomes, and therefore recommend Oklahoma undertake
further research in this area in partnership with other states and key stakeholders.11
Key Implementation Considerations. Given that completion-based funding represents an entirely
new approach for virtual charter school funding in Oklahoma, the implementation considerations
are complex and numerous. Some critical ones include how to define completion, time limits on
completion, per-course funding rates, timing of payments, oversight, the transition period, and
possible surplus funding. See Discussion and Recommendations, Section 5 of this report, for a more
detailed description of each of these implementation considerations.
Fiscal and Operational Transparency Recommendations
Our Real Costs Analysis highlighted a lack of fiscal and operational transparency among those virtual
charter schools that contract with for-profit management companies. As a result, we offer the
following recommendations.
Recommendations. To increase transparency and provide greater insight into actual resource
allocation and how public funds are being spent to support student learning, Oklahoma should:
• Publish staffing and compensation data received from virtual charters schools on the
Accountability Reports, like the information reported for non-virtual LEAs.
• Adjust OCAS and/or confirm LEA compliance to require annual expenditure data that only
represents virtual charter school payments to their respective for-profit management
company.
11 Other states could include those that have implemented some form of completion-based funding for virtual charter schools or states interested in doing so. Other
stakeholders could include virtual charter schools, school funding experts, and research organizations.

www.qualitycharters.org
6
Oklahoma Virtual Charter School Funding Study COMMISSIONED BY THE STATEWIDE VIRTUAL CHARTER SCHOOL BOARD
• Ensure that virtual charter LEAs only report expenditures associated with their virtual
charter LEA and that staff and students from a given virtual charter LEA are coded to the
appropriate reported entity.
These collective recommendations are aligned with and support the goals of Oklahoma’s charter
school law, whose purpose, among others, is to improve student learning and establish new forms
of accountability. They also support the goals of Oklahoma’s state aid law, which seeks to provide
the best possible educational opportunities for every child in Oklahoma, to have a more beneficial
use of public funds expended for education, and to continually improve the public schools of
Oklahoma.12
Section 1: Introduction
Background
The SVCSB has engaged NACSA and Afton to provide research and recommendations related to the
funding of full-time virtual charter schools in Oklahoma. These research services include:
• Explaining how Oklahoma and other states fund virtual charter schools;
• Summarizing existing research and recommendations on virtual charter school funding;
• Identifying the “real costs” of educating a student in Oklahoma’s virtual charter school
learning environment; and
• Explaining how other states’ funding methods could translate to Oklahoma’s school funding
and taxation structure (collectively, the “Research”).
Based on this Research, NACSA and Afton will present recommendations related to virtual charter
school funding for Oklahoma’s consideration.
Context
Virtual charter school enrollment is growing rapidly in Oklahoma. Virtual charter schools in
Oklahoma served 43,324 students in FY21. This represents an increase of more than 100 percent in
the number of students served from FY20. Prior to the impact of COVID-19, virtual charter schools
grew from 13,225 students in FY17 to 21,532 students in FY20, an increase of more than 62 percent
over four years.13
Figure 1: Oklahoma virtual charter school total enrollment
12 70 O.S. §3-130 and 70 O.S. §18-101 13 Virtual charter LEA enrollment, based on October 1 enrollment counts.
13,225 12,08917,952
21,532
43,324
FY17 FY18 FY19 FY20 FY21
Total Enrollment (October 1)

www.qualitycharters.org
7
Oklahoma Virtual Charter School Funding Study COMMISSIONED BY THE STATEWIDE VIRTUAL CHARTER SCHOOL BOARD
Compared to non-virtual charter schools, Oklahoma virtual charter schools serve a higher
proportion of special education students, a lower proportion of economically disadvantaged
students, and a substantially lower proportion of English learner students. When compared to
traditional public schools, virtual charters serve a slightly higher proportion of special education
students, about the same proportion of economically disadvantaged students, and a substantially
lower proportion of English learner students.
While the sector has experienced significant growth, virtual charter schools in Oklahoma
underperform academically compared to non-virtual schools (both brick-and-mortar charter schools
and traditional public schools). Based on Oklahoma School Report Card data for FY18 and FY19, the
average virtual charter school Overall Performance Indicator score was 16 percentage points below
the average non-virtual charter school score for both years. Compared to traditional schools, the
average virtual charter school Overall Performance Indicator was 15 percentage points below the
average traditional school score for FY18 and 13 percentage points below the average traditional
school score for FY19.14
When looking at achievement, the average virtual charter school Achievement Composite Indicator
score was 12 percentage points and 14 percentage points below the average non-virtual charter
school score for FY18 and FY19 respectively. Compared to traditional schools, the average virtual
charter school Achievement Composite Indicator was 16 percentage points and 15 percentage
points below the average traditional school score for FY18 and FY19 respectively.15
14 For FY18, the average virtual charter school Overall Performance Indicator score was 38 percent and for FY19 it was 36 percent. Source:
https://escmatrix.com/ok/#matrix. The Overall indicator value relates how the school is performing relative to like LEAs (e.g., all elementary LEAs up to grade 6 that
have science) as reflected by the letter grade. Letter grades are based on the points earned out of the points possible. 15 For FY18 and FY19, the average virtual charter school Achievement Composite Indicator score was 35% and 28% respectively. Source:
https://escmatrix.com/ok/#matrix; The Achievement-Composite indicator value relates how well the site is preparing students for the next grade, course, or level. This
is reflected by the percentage of points earned for students meeting or exceeding their state-level targets. This is measured in percentage terms – points earned/points
possible, by school. More can be found here.

www.qualitycharters.org
8
Oklahoma Virtual Charter School Funding Study COMMISSIONED BY THE STATEWIDE VIRTUAL CHARTER SCHOOL BOARD
Lastly, when looking at student growth, the average virtual charter school Growth Composite
Indicator was 25 percentage points and 34 percentage points below the average non-virtual charter
school score for FY18 and FY19 respectively. Compared to traditional schools, the average virtual
charter school Growth Composite Indicator was 24 percentage points below the average traditional
school score for both FY18 and FY19.16
The academic underperformance of virtual charter schools in Oklahoma is generally representative
of the lackluster performance of virtual charter schools nationwide. While we recognize that virtual
charter school academic performance is complicated by high student turnover, studies at the
national, state, and local levels have consistently demonstrated that virtual charter schools
significantly underperform brick-and-mortar charter schools and traditional public schools.17 A
recent study of virtual charter high school graduation rates found that nearly three-quarters of
students enrolled in virtual charters are attending a high school where fewer than half graduated in
four years,18 and an examination of state data showed that fewer than half of all students at three of
the four virtual charter schools in Oklahoma (at that time) graduated within six years.19
The virtual charter school sector is also associated with high rates of student mobility. The mobility
rate for full-time virtual charter school students nationally is approximately 15 percent, almost twice
16 For FY18 and FY19, the average virtual charter school Growth Composite Indicator scores were 26% and 29% respectively. Source: https://escmatrix.com/ok/#matrix;
The Growth Composite indicator value relates a student’s movement within and across performance levels for ELA and Math in Grades 3-8. Since high school students
are only tested once in Grade 11, growth scores are not available for high school students. This is reflected by the percentage of points earned for students meeting or
exceeding their state-level targets. This is measured in percentage terms – points earned/points possible, by school. More can be found here. 17 See both national- and state-level charter school performance studies available at https://credo.stanford.edu/studies/charter-school-studies. See also Student
Enrollment Patterns and Achievement in Ohio’s Online Charter Schools available at https://journals.sagepub.com/doi/10.3102/0013189X17692999; Virtual Schools in
the U.S. 2019 available at http://nepc.colorado.edu/sites/default/files/publications/Virtual%20Schools%202019.pdf; and Virtual Illusion: Comparing Student
Achievement and Teacher and Classroom Characteristics in Online and Brick-and-Mortar Charter Schools available at
https://journals.sagepub.com/doi/abs/10.3102/0013189X20909814?journalCode=edra. 18 Many Online Charter Schools Fail to Graduate Even Half of Their Students on Time, https://www.edweek.org/teaching-learning/many-online-charter-schools-fail-to-
graduate-even-half-of-their-students-on-time/2019/04. 19 Most Students in Oklahoma’s Virtual Charter Schools Don’t Graduate, https://www.readfrontier.org/stories/most-students-in-oklahomas-virtual-charter-schools-dont-
graduate/.

www.qualitycharters.org
9
Oklahoma Virtual Charter School Funding Study COMMISSIONED BY THE STATEWIDE VIRTUAL CHARTER SCHOOL BOARD
the rate of non-virtual school students.20 While short-term enrollment can be intentional or
unintentional, this high rate of student mobility disrupts learning, makes it harder to capture
accurate student counts for funding, and decreases the number of students included for
accountability purposes.
Since funding in Oklahoma is primarily based on student enrollment over the first nine weeks of the
school year, a virtual charter school will continue to be paid for students who depart after the first
nine weeks as if those students remained enrolled in the school for the entire school year. Likewise,
a virtual charter school will not be paid for students that enroll after this period. Regarding
accountability, students in Oklahoma must be in a school for a full academic year before their state
assessment scores are attributable to that school. So, if a student attends a virtual charter school for
less than a year, that student’s assessment scores are excluded from the school’s results for
accountability purposes.
Of the six virtual charter schools in Oklahoma currently operating in Oklahoma, five are operated by
for-profit management companies. This includes Oklahoma’s largest virtual charter school: the Epic
One-on-One Charter School, which served 35,371 students in FY21 or 82.5 percent of students
attending virtual charter schools in Oklahoma.21 Since for-profit management companies are private
entities, they are not required by law to provide the same level of fiscal and operational
transparency as traditional public and brick-and-mortar charter schools.
Oklahoma has a large, rapidly growing virtual charter school sector that significantly underperforms
brick-and-mortar charter and traditional public schools. The sector is dominated by for-profit
management companies, which makes financial and operational transparency difficult. Additionally,
high student mobility, which plagues the sector nationally, presents a particular funding challenge,
given Oklahoma’s method of counting and funding students. With this context in mind, this report
addresses each of the Research tasks identified above and ultimately provides recommendations
regarding how Oklahoma could strengthen the way it funds virtual charter schools, with the goal of
creating a system that:
• Provides a more accurate count of the number of students a virtual charter school educates;
• Uses funding as a means to incentivize student learning; and
• Provides greater transparency regarding how for-profit management companies spend
public dollars.
20 https://credo.stanford.edu/sites/g/files/sbiybj6481/f/online_charter_study_final.pdf. 21 The governing board of Epic One-on-One Charter School approved a mutual termination agreement with their for-profit management company on May 26, 2021,
which will be effective July 1, 2021.

www.qualitycharters.org
10
Oklahoma Virtual Charter School Funding Study COMMISSIONED BY THE STATEWIDE VIRTUAL CHARTER SCHOOL BOARD
These goals are supported by Oklahoma’s charter school law, whose purpose, among others, is to
improve student learning and establish new forms of accountability; and Oklahoma’s state aid law,
which seeks to provide the best possible educational opportunities for every child in Oklahoma, to
have a more beneficial use of public funds expended for education, and to continually improve the
public schools of Oklahoma.22
Approach
Below is an explanation of how we approached each Research task.
State Funding Systems for Virtual Charter Schools. For the research on Oklahoma and other states’
funding systems for virtual charter schools, we reviewed and analyzed state charter school laws. We
identified and summarized 13 states, including Oklahoma, to provide a representative sample of
virtual charter school funding approaches. Our summaries and analyses of each state’s funding
approach were then verified by in-state school finance experts.23
Existing Research. For the summary of existing research in this area, we reviewed papers, issue
briefs, and articles that focused on how states fund virtual charter schools and the cost of educating
a student in a full-time virtual environment in comparison to the cost of educating a student in a
traditional brick-and-mortar school environment. Most research on full-time virtual charter schools
has focused on the growth of the sector, the characteristics of students who attend virtual charter
schools, and the academic performance of virtual charter schools. As a result, the body of research
that focuses primarily on virtual school funding is more limited.
The Real Costs Analysis. For the analysis of the “real costs” of educating a student in Oklahoma’s
virtual charter school learning environment (the Real Costs Analysis), we evaluated actual historical
LEA-level expenditure data as published in the OCAS24 along with student enrollment data, ADM
data, student needs data, audited financial reports, academic performance data, and the
management agreements between the nonprofit virtual charter schools and their for-profit
operators. By focusing on the actual historical expenditure data and performance to analyze real
costs, our analysis intentionally does not quantify, propose, or prescribe the costs that a virtual
charter school must incur or the resources a school must allocate to provide an adequate level of
education to its students. To provide a frame of reference for this Real Costs Analysis, we also
compared the expenditure data from the virtual charter LEAs to non-virtual charter LEAs and
traditional LEAs. As of the time this analysis was completed, expenditure data for FY21 was not yet
available. Expenditures were analyzed for FY17-FY20. See Real Costs Analysis, Section 4 of this
report, for a more detailed description of our approach to this analysis.
Applying Different Approaches to Oklahoma’s Context. For assessing how different funding
approaches would apply to Oklahoma’s context, we focused on approaches used in other states that
differed from Oklahoma’s current approach and how these approaches would support the goals
referenced above. We also analyzed implementation considerations associated with each approach.
To supplement our work, we interviewed local and national experts on virtual charter school funding
to better understand, provide feedback on, and help us assess implementation considerations.
22 70 O.S. §3-130 and 70 O.S. §18-101 23 All except for Pennsylvania where our outreach was unsuccessful. 24 OCAS is available through the Oklahoma State Department of Education’s website at https://sdeweb01.sde.ok.gov/OCAS_Reporting/.

www.qualitycharters.org
11
Oklahoma Virtual Charter School Funding Study COMMISSIONED BY THE STATEWIDE VIRTUAL CHARTER SCHOOL BOARD
Section 2: How States Fund Virtual Charter Schools
States largely fund virtual charter schools in a similar manner as brick-and-mortar charter schools,
using the same method of counting pupils and applying the same per-pupil weights and funding
amounts. However, when comparing states, there are some critical differences, some of which relate
to how a state funds schools generally, some specific to all charter schools, and some specific to
virtual charter schools.
First, states differ in how they count pupils for the purposes of funding formulas. Broadly, states
count students for state funding purposes in one of three ways: by specific count dates, by ADM, or
by average daily attendance (ADA).
Next, states also differ on the extent to which their funding formulas apply to virtual charter schools.
Some states make no modifications, treating virtual charter schools the same as all other schools.
Other states modify how formulas apply either to all charter schools; all forms of virtual schooling,
including virtual charter schools; or only to virtual charter schools.
Lastly, some states have specific provisions or funding mechanisms, such as completion-based
funding, that apply only to all virtual schools or all virtual charter schools.
This section of the report begins with an explanation of how Oklahoma funds its virtual charter
schools and then organizes the remainder of the states we examined by how students are counted
generally. Within each state summary, we describe how the state applies funding formulas to brick-
and-mortar charter and virtual charter schools, as applicable, and any virtual-specific funding
provisions included in statute. The 13 states summarized below, including Oklahoma, represent a
cross section of different approaches, states with large virtual charter school sectors, and those with
unique funding provisions applicable to virtual charter schools. For a chart summarizing the analysis
below, see Appendix A.
Oklahoma
Pupil Count: Oklahoma counts pupils for state aid purposes using an ADM method, counting the
number of days each student is enrolled in school over the first nine weeks of the school year.25
Under this method, student enrollment, not student attendance, is counted; as long as a student is
enrolled in the course, they are counted for aid purposes, though a student absent 10 consecutive
days must be withdrawn from the course and therefore excluded from the ADM count.26
State Funding Formula: Oklahoma’s state education funding system is composed of three funding
formulas: Foundation Aid, Salary Incentive Aid, and Transportation Supplement Aid.27 Two of these
formulas (Foundation and Salary Incentive) rely on a school’s “weighted ADM,” which is calculated by
applying the following four weighting factors to the ADM count:
• Weighted Pupil Grade Level: This applies a multiplier based on student grade level, with
Kindergarten the highest (1.5) and Grade 4 through Grade 6 the lowest (1.0)
25 70 O.S. §18-201.1(B); OAS 210:25-3-2 26 70 O.S. §18-107(2) 27 70 O.S. §18-200.1(D)

www.qualitycharters.org
12
Oklahoma Virtual Charter School Funding Study COMMISSIONED BY THE STATEWIDE VIRTUAL CHARTER SCHOOL BOARD
• Weighted Pupil Category: This applies a multiplier based on pupil categorization, such as for
specific learning impairments, economic disadvantage, and English learner status.
• Weighted District: This applies additional weight for small districts and district sparsity.
• Weighted Teacher Experience and Degree: This applies additional weight for teaching staff
with greater experience and/or higher education.28
Weighted ADM is then used to calculate two of the three formulas:
• Foundation Aid is calculated by first determining the school’s highest weighted ADM over the
current year and two preceding years.29 The weighted ADM is multiplied by the Foundation
Aid Factor (which, in 2020, was $1,764.77).30 Foundation Program Income, a measure of the
amount of local revenue the district receives less 25% of the county mill levy, is removed
from this amount to reach the Foundation Program amount.
• Salary Incentive Aid is calculated by multiplying a salary incentive factor—determined by the
local district’s teacher salaries—by the weighted ADM. For traditional school districts,
additional local revenue considerations are taken, but these are not applicable to charter
schools.
The third funding formula, Transportation Supplement Aid, does not rely on weighted ADM. Instead,
this formula is calculated using average daily haul, a local per capita amount, and an annual
transportation factor. Charter schools are generally not eligible for Transportation Supplement Aid.
Charter School Modifications: For Foundation Aid, the Foundation Program Income amount for
charter schools is zero, as they do not receive local revenue. Therefore, the first calculation
(weighted ADM multiplied by the Foundation Aid Factor) generates the charter school’s Foundation
Aid Amount. Additionally, charter schools are not eligible for the small school or district sparsity
weights.
For new charter schools, the initial weighted ADM amount is calculated as actual enrollment of
students on August 1, multiplied by 1.333. At midyear, this allocation is adjusted using the actual
weighted ADM from the first quarter.31
Virtual-specific Provisions: Statute lays out specific requirements on how virtual charter schools
must count attendance for the purposes of calculating ADM, including when a student may be
considered “in attendance” for an entire quarter for membership purposes, how to prorate
attendance when a student falls short of those requirements, and when a student must be
automatically withdrawn.32 These rules regarding when a student must be automatically withdrawn
from a course impact a school’s overall ADM calculation.
28 70 O.S. §18-201.1 29 70 O.S. §18-201.1(B). Legislation enacted in 2021 will change this calculation beginning in the 2022-23 school year. Under the new law, initial aid allocation will be
based on the weighted ADM from the prior school year, rather than the highest weighted ADM over the previous two preceding years. Final aid allocation will be based
on the higher of the current year’s nine-week ADM count or the prior year’s final ADM count, rather than the highest of the current year’s nine-week ADM or two
preceding years final ADM. 2021 Okla. Sess. Laws ch. 5, §1. 30 See Oklahoma State Department of Education, State Funding Formula Worksheets, available at https://sde.ok.gov/notice-allocation. 31 70 O.S. §3-142(B) 32 70 O.S. §3-145.8

www.qualitycharters.org
13
Oklahoma Virtual Charter School Funding Study COMMISSIONED BY THE STATEWIDE VIRTUAL CHARTER SCHOOL BOARD
Statute limits when a virtual charter school may use prior years’ ADM: If a virtual charter school has
experienced a year-to-year decline in enrollment equal or greater than 15%, then the current year’s
weighted ADM must be used, not a prior year.33
Virtual charter schools are, generally, not eligible for Transportation Supplement Aid.34 Virtual
charter schools receive state aid directly from the State Board of Education, minus up to 3 percent in
administrative fees.35
Count Day States
Under the most basic version of this approach, pupil enrollment is taken on just one day, typically
shortly after the school year begins; state funding for the year is based solely on that day’s
enrollment. Many states that employ a “count day” model modify it in some way to account for some
variations in enrollment throughout the year, from taking the average of two count days, allowing
adjustments over a short period, or funding districts at the highest count over recent years.
Colorado
Pupil Count: Colorado uses a “single count day” to count pupils. Pupil enrollment day is the school
day closest to October 1 each year. To account for variation and irregularities in enrollment, schools
and districts are funded at the greatest of either the current year’s count or the average of the
current year plus up to the prior four years.36
State Funding Formula: Statute calculates “district total program” aid starting from a base per-pupil
amount, which is then modified by district-dependent factors (such as cost of living and district size).
An “at-risk” per-pupil amount is then added; these two amounts are multiplied by the pupil count to
determine a district’s Total Program Aid. Statute also calculates a “minimum total program” amount
based on a flat per-pupil amount established in statute, below which a district’s Total Program Aid
cannot fall. Lastly, a budget stabilization factor is applied, reducing the aid amount, based on each
year’s final approved state budget.37
Charter School Modifications: Locally authorized charter schools receive 100 percent of the
district’s Total Program Aid attributable to the student, less administrative costs up to 5
percent.38 Some charter schools have arrangements with the local district to share local aid. State-
authorized charter schools receive 100 percent of students’ host district’s attributable Total
Program Aid, less up to 3 percent that may be held as an oversight fee.39
Virtual-specific Provisions: Colorado has two types of virtual charter schools, which are funded
differently. A district may authorize a “single-district” virtual charter school while only the state
charter board may authorize a “multi-district” virtual charter school. The difference between these
types is the enrollment zone: within a single district or statewide.40
33 70 O.S. §18-201.1(B) 34 OAS 777:10-5-3(d) 35 70 O.S. §3-142(A) 36 Colo. Rev. Stat. 22-54-103 37 Colo. Rev. Stat. 22-54-104 38 Colo. Rev. Stat. 22-30.5-112(2) 39 Colo. Rev. Stat. 22-30.5-513(2) 40 Colo. Rev. Stat. 22-30.7-106

www.qualitycharters.org
14
Oklahoma Virtual Charter School Funding Study COMMISSIONED BY THE STATEWIDE VIRTUAL CHARTER SCHOOL BOARD
“Single-district” virtual charter schools receive per-pupil funding at the same rate as brick-and-
mortar charter school students.41 For “single-district” virtual charter schools, the enrollment count is
multiplied by the host district’s per-pupil funding amount.42
For “multi-district” virtual charter schools, pupils are funded at a separate, statutory per-pupil
amount adjusted up annually by the change in the statewide per-pupil average, and then down by
the budget stabilization factor.43 In FY20, this amount was $7,341.44
Indiana
Pupil Count: Indiana uses a “double count day”: Enrollment is taken once in the fall and once in the
spring.45 Schools are required to submit an enrollment estimate in April, which is used to fund
schools from July to October. The September and February counts (once verified) are used to
reconcile the estimate with actual enrollment.46
State Funding Formula: State funding comes primarily through the Basic Tuition Support formula.47
The bulk of this amount comes from an annually set per-pupil amount, modified by each district’s
“complexity factor” (a measure of low-income populations).48 Additional categorical formulas, such
as special education, also use the pupil count.
Charter School Modifications: Most charter schools are eligible for a grant equal to the charter
school’s ADM multiplied by a fixed amount (for FY21, $750). This grant funding must generally be
used for capital projects, transportation costs, and technology.49
Virtual-specific Provisions: Students who receive 50 percent or more of their instruction in a virtual
setting are funded under a separate formula, regardless of the type of school. For a full-time virtual
charter school, this formula would apply to each student. Students receiving the majority of
instruction in a virtual setting are funded at 85 percent of the “foundation” amount for which they
would otherwise be eligible.50 Virtual charter schools must additionally comply with specific
onboarding, student engagement, and attendance rules.51
Georgia
Pupil Count: Georgia uses a “double count day,” with a fall and spring count day. Rather than
counting pupils for the full day, Georgia divides the day into six segments and the school must
report each pupil’s “specific assigned program” for each segment.52
State Funding Formula: The Quality Basic Education (QBE) formula uses a universal base amount,
calculated annually as the minimum cost of providing a high school course. This amount is then
adjusted for 18 educational programs (e.g., Kindergarten, special education) by a statutory
41 Colo. Rev. Stat. 22-30.7-107 42 Colo. Rev. Stat. 22-54-103 43 Colo. Rev. Stat. 22-54-104(4.5) 44 https://leg.colorado.gov/sites/default/files/images/lcs/final_fy20-21_financing_of_public_schools.pdf. 45 IC 20-43-4-3 46 IC 20-43-4-2 47 IC 20-43-6-3 48 IC 20-43-13-4 49 IC 20-24-13 50 IC 20-43-6-3 51 IC 20-24-7-13 52 Ga. Code §20-2-160(a)

www.qualitycharters.org
15
Oklahoma Virtual Charter School Funding Study COMMISSIONED BY THE STATEWIDE VIRTUAL CHARTER SCHOOL BOARD
percentage. Each program amount is then multiplied by that program’s pupil count to calculate each
district’s QBE amount. There is an additional “training and experience” formula amount to equalize
differences in teacher salaries.53
Charter School Modifications: Charter schools are funded through QBE in the same manner as
districts. District-authorized charter schools are eligible for a share of local revenue, while state-
authorized charter schools are eligible for a supplemental grant to offset local revenue for which
they are otherwise ineligible.54
Virtual-specific Provisions: Virtual charter schools are funded by the same formula with two
exceptions. First, virtual charter schools receive only two-thirds of the per-pupil amount, though this
“amount may be increased by any amount up to the originally calculated amount in the discretion of
the department if relevant factors warrant such increase.” Second, a virtual charter school is not
generally eligible for the supplemental grant, though if the school provides students with required
technology, it is eligible for 25 percent of the amount.55
Average Daily Membership States
This approach measures average enrollment over a certain portion of the year, from a number of
weeks (e.g., Oklahoma) to the full year. This approach factors in changes to enrollment to various
degrees, such as student transfers, throughout the year.
Ohio
Pupil Count: ADM is reported and updated three times each year: in October, March, and June.56
Charter schools must report enrollment monthly.
State Funding Formula: The Foundation Program is made up of seven funding formulas. The
Opportunity Grant, the largest amount, is a flat per-pupil amount set each year: for FY20, this was
set at $6,020.57 A “state share index,” based on the district’s property values and resident incomes, is
then applied. The other six formulas also rely on ADM counts. 58
Charter School Modifications: Per-pupil aid for charter school students is deducted from the
student’s district of residence state aid and paid directly by the state to the charter school.59 Brick-
and-mortar charter schools are eligible for all seven formulas. Because charter schools receive no
local tax revenue, they are not subject to the state share index.
Virtual-specific Provisions: Virtual charter schools are only eligible for three of the seven aid
categories: the base Opportunity Grant, special education, and career-technical education
formulas.60 Virtual charter amounts are also not subject to the state share index. Charter schools,
53 Ga. Code §20-2-161 54 Ga. Code §20-2-2068.1 55 Ga. Code §20-2-2068.1(d) 56 Ohio Rev. Code 3317.03 57 http://education.ohio.gov/getattachment/Topics/Finance-and-Funding/School-Payment-Reports/State-Funding-For-Schools/Traditional-School-Districts/FY20-SFPR-
Funding-Form-Line-by-Line.pdf.aspx?lang=en-US. 58 Ohio Rev. Code 3317.022 59 Ohio Rev. Code 3314.08(C) 60 Ohio Rev. Code 3314.08(C)(2)

www.qualitycharters.org
16
Oklahoma Virtual Charter School Funding Study COMMISSIONED BY THE STATEWIDE VIRTUAL CHARTER SCHOOL BOARD
including virtual charter schools, are subject to periodic “FTE (full time equivalent) reviews.” For
virtual charter schools, student participation in remote learning opportunities must be verified or
the state may reduce funding allocations.61
Pennsylvania62
Pupil Count: ADM is calculated across the entire school year by dividing the aggregate days’
membership for all students by the number of days the school is in session. Charter schools must
report the previous year’s enrollment count by October 1 to each school district from which it
enrolls students”63
State Funding Formula: The Basic Education Funding (BEF) formula is based on an annual per-pupil
amount, established annually, multiplied by each district’s weighted pupil count. A variety of weights,
considering pupil- and district-based factors, are then applied. This final weighted pupil amount is
then multiplied by the formula amount for that year.64
Charter Modifications: Charter schools are funded through a separate formula, based on the
student’s host district. For non-special education students, charter schools receive an amount equal
to the district’s “budgeted total expenditure per average daily membership,” less certain categories,
such as transportation and facility-related expenses. For special education students, the charter
school receives this amount plus an additional amount, based on the host district’s per-pupil special
education expenditures.65
Virtual-specific Provisions: None; virtual charter schools are funded the same as brick-and-mortar
charter schools.
Minnesota
Pupil Count: ADM is defined as “the sum for all pupils of the number of days of the school year each
pupil is enrolled in the district's schools divided by the number of days the schools are in session or
are providing e-learning days due to inclement weather.”66
State Funding Formula: The General Education Revenue formula is made up of eight sub-formulas,
the largest of which is calculated by multiplying pupil count by a basic per-pupil amount set annually
by statute. In 2020-21, this amount is $6,438.67
Minnesota uses a limited weighting system to modify pupil counts: with weights only given for pupils
in Grades 7-12 and for certain categories of Pre-K and Kindergarten pupils.68
Charter School Modifications: Charter schools are funded through the state’s funding formula, with
two modifications. First, the state average per-pupil amount is used, not a locally weighted figure.69
61 Ohio Rev. Code 3314.08(K); see also Community School Full Time Equivalency (FTE) Review Manual. 62 We were unable to verify our summary of Pennsylvania. 63 24 Pa. Con. Stat. §17-1725-A(5) 64 24 Pa. Con. Stat. §25-2502.53 65 24 Pa. Con. Stat. §17-1725-A 66 Minn. Stat. 126C.05(8) 67 Minn. Stat. 126C.10 68 Minn. Stat. 126C.05(1) 69 Minn. Stat. 124E.20

www.qualitycharters.org
17
Oklahoma Virtual Charter School Funding Study COMMISSIONED BY THE STATEWIDE VIRTUAL CHARTER SCHOOL BOARD
Second, 4.66 percent of aid is withheld by the state for transportation expenses unless the charter
school provides transportation services.70
Virtual-specific Provisions: Full-time virtual charter schools are funded through the same ADM
formula as brick-and-mortar charter schools.
For students enrolled in supplemental online courses, an ADM count is only generated for the virtual
instruction if the student completes the course.71 A student failing to complete a course, therefore,
would generate no funding. Statute caps the share of ADM-based aid at 88 percent of the formula
amount for supplemental online courses.72
Arizona
Pupil Count: ADM is counted “through the first one hundred days or two hundred days in session, as
applicable, for the current year.” A student enrolled in the course is counted so long as they have not
been withdrawn. Withdrawals include both formal withdrawals, as well as students absent, without
excuse, for 10 consecutive days. Districts and charter schools must report attendance and absence
data at least every 60 school days.73
State Funding Formula: The Base Support Level formula starts from an annually established base
amount: for FY21, this amount is $4,305.73.74 Weights are applied for different grade levels, student
characteristics, and teacher experiences. An additional weight is applied for small districts. 75
Additionally, schools are eligible for supplemental per-pupil funding, up to $400, if they meet
additional student demographic and performance requirements.76
Charter School Modifications: Charter schools are funded similarly to district schools through the
state’s Base Support Level allocation. Charters are not eligible for local revenue but may receive a
state supplement intended to offset this revenue. Some charter schools are eligible for the small
district weight if certain conditions apply.77
Virtual-specific Provisions: Virtual instruction, including virtual charter schools, is funded through the
Arizona Online Instruction (AOI) formula. Virtual charter schools must maintain daily logs of student
instructional activity by actual instructional minutes. Rather than count students based on the
number of days they are enrolled in the virtual charter school, students are counted, for the
purposes of state funding, based on actual instructional time.78
AOI aid for each student is then calculated depending on the share of virtual instructional time
versus in-person instructional time. Pupils enrolled full-time in virtual instruction are funded at 95
percent of the base support level amount; for part-time enrolled students, the share of online
instructional time is funded at 85 percent of the base level support amount.79
70 Minn. Stat. 124E.23 71 Minn. Stat. 124D.095(8) 72 Minn. Stat. 124D.095(8) 73 A.R.S. 15-901 74 https://www.azed.gov/finance/2020/07/01/fy2021-school-finance-fiscal-operations-updates. 75 A.R.S. 15-943 76 A.R.S. 15-249.08 77 A.R.S. 15-185 78 A.R.S. 15-901 79 A.R.S. 15-808

www.qualitycharters.org
18
Oklahoma Virtual Charter School Funding Study COMMISSIONED BY THE STATEWIDE VIRTUAL CHARTER SCHOOL BOARD
Utah
Pupil Count: Pupils are counted by ADM, though based on enrolled “instructional clock hours” rather
than days. To calculate total enrollment days, a school must count “total clock hours of educational
services for which the student is enrolled during the school year divided by 990 hours and then
multiplied by 180 days and finally rounded up to the nearest whole day.”80
State Funding Formula: Pupil counts are weighted in three categories: grade span, special
classification (e.g., special education), and district-specific (e.g., sparsity) factors.81 This count is then
multiplied by an annually adjusted per-pupil amount. 82 The state provides additional program-
specific aid for a limited number of programs and services, such as transportation and gifted-and-
talented students.
Charter School Modifications: A charter school receives state funding on the same basis as a school
district, though with slightly different grade-span weighted pupil units, which gives slightly less
weight to elementary grades and slightly more weight to high school grades than the district school
formula.83
Charter schools are eligible for a share of local property tax revenue based on pupil count.84 Charter
schools are also eligible for an additional state allocation to supplement local property tax levies if
the property tax levy is below $1,427 per pupil, subject to annual budget allocations.85 Charter
schools are not eligible for state transportation aid.86
Virtual School Provisions: Full-time pupils enrolled in virtual charter schools are funded the same as
brick-and-mortar charter schools.
The state permits high school students to enroll, part-time, in virtual courses through the Statewide
Online Education Program (SOEP).87 Charter schools may serve as course providers through SOEP.88
Pupils enrolled in virtual courses through SOEP are funded by a statutory established flat rate fee on
a course completion basis.
Course providers are paid a portion of the course fee based on enrollment up through a statutory
withdrawal period: for a 0.5 credit course, 50 percent of the fee amount after the withdrawal period;
for a 1.0 credit course, 25 percent after the withdrawal period and 25 percent after the halfway point
in the course schedule. The remaining 50 percent of the course fee is received only “if a student
completes a 1.0 credit online course within 12 months or a 0.5 credit course within nine weeks
following the end of a traditional semester.” If the student fails to complete the course in this
timeframe, a course provider may still receive 30 percent of the fee if the student completes the
course prior to graduating high school.89
80 Utah Admin. Code R277-419.8(5) 81 Utah Code 53F-2-302 82 Utah Code 53F-2-301.5 83 Utah Code 53F-2-702; Utah Code 53F-2-302(4) 84 Utah Code 53F-2-703 85 Utah Code 53F-2-704 86 Utah Code 53F-2-702(5) 87 Utah Code 53F-2-503 88 Utah Code 53F-2-504 89 Utah Code 53F-4-505

www.qualitycharters.org
19
Oklahoma Virtual Charter School Funding Study COMMISSIONED BY THE STATEWIDE VIRTUAL CHARTER SCHOOL BOARD
New Hampshire
Pupil Count: For districts and brick-and-mortar charter schools, pupils are counted by an ADM
model (called “average daily membership attendance” in statute) calculated as the sum of half-day
student enrollment divided by total number of half-day school sessions.90 The Virtual Learning
Academy Charter School (VLACS) is New Hampshire’s sole virtual charter school. Through a
memorandum of understanding (MOU) with the State first signed in 2009, VLACS is funded based on
coursework completions rather than enrollment count.91 While this MOU expired in 2015, ADM for
VLACS is still calculated through completions rather than enrollment.
For VLACS, coursework completions are converted to membership for funding purposes. This
funding model has been described as “low-stakes” completion funding because, unlike Florida
described below, funding is not “all or nothing” depending on course completion: VLACS receives
revenue based on the portion of coursework a student completes and so may receive a portion of
the full per-pupil amount even if the student does not complete the course.
State Funding Formula: Charter schools are funded through the state’s Adequate Education
formula.92 This formula sets a per-pupil base amount, along with supplemental categorical amounts,
including for free and reduced-price lunch eligible students and English learners.93 The amounts are
adjusted annually in line with the consumer price index.94
Virtual-specific Provisions: VLACS is eligible to receive all attributable funding directly from the state
for each full-time enrolled student.95 In addition, VLACS is eligible for a flat per-pupil grant amount
(set at $2,036 in 2016 and linked to the consumer price index beginning in 2017). Both the formula-
driven aid and the flat per-pupil grant are tied to coursework completion.
For part-time enrolled students, VLACS receives the proportionate share of the state’s base funding
amount (but not supplemental amounts for low-income, English learner, or low-proficiency
students), based on the share of credit hours the student is enrolled in VLACS. For these students,
VLACS also receives the same per-pupil grant amount as above, proportionate to the student’s level
of enrollment.96
Florida
Pupil Count: Pupil counts for state funding purposes are based on an ADM count called FTE
enrollment. A student is counted for a full aid share if they are enrolled for at least the statutory
minimum number of hours or a proportionate share of aid if enrolled for less than the minimum.97
For virtual charter schools, FTE students are calculated based on successful course completions
rather than enrollment and attendance. A “successful completion” is either (1) credit completion or
90 N.H. Rev. Stat. 198:38; see also N.H. Rev. Stat. 189:1-d. 91 See National Center for Innovation in Education, Low-Stakes Completion-Based Funding, available at https://www.leadingwithlearning.org/low-stakes. 92 N.H. Rev. Stat. 194-B:11 93 N.H. Rev. Stat. 198:40-a 94 N.H. Rev. Stat. 198:40-d 95 N.H. Rev. Stat. 194-B:11; see also N.H. Rev. Stat 198:40-a 96 N.H. Rev. Stat. 194-B:11 97 Florida School Boards Association, Understanding the FEFP, available at https://fsba.org/wp-content/uploads/2016/11/2016-17-FEFP-101.pdf.

www.qualitycharters.org
20
Oklahoma Virtual Charter School Funding Study COMMISSIONED BY THE STATEWIDE VIRTUAL CHARTER SCHOOL BOARD
(2) “the prescribed level of content that counts towards promotion to the next grade level.”98 A
student must receive at least a “D” grade in a course in order to complete the credit.99
State Funding Formula: The Florida Education Finance Program (FEFP) formula multiplies a school’s
“weighted full-time equivalent” pupil count first by a basic cost formula. “Weighted full-time
equivalent” is calculated by applying program-specific weights to the pupil count.
Additional program (e.g., reading support programs) and district-specific (e.g., sparsity) factors and
formulas are added to the base student allocation to generate a final FEFP amount.100
Charter School Modifications: Charter schools are eligible for funding through the FEFP in the same
amounts as school districts. State and local funds are combined in the FEFP formula.
Virtual-specific Provisions: Virtual charter schools are only authorized to enroll students in full-time
instruction. Virtual charter schools are funded through the FEFP in the same manner as brick-and-
mortar charter schools, though virtual charter schools are ineligible for funds designated to meet
class size requirements.101
For a virtual charter school, an FTE count is only earned if the student successfully completes the
course. Funding for virtual charter schools is all-or-nothing: If a student does not successfully
complete a course, then no FTE is earned and no funding is allocated. This model is described as
“high-stakes” completion funding, since funding is “all or nothing” depending on whether or not the
student completes the course. The virtual school is not eligible for any funding if the student
completes a portion of the course but does not satisfactorily complete the entire course.102
The Florida Virtual School (FLVS) is operated by the Florida Department of Education and offers both
part-time and full-time virtual instruction. Students may enroll directly in FLVS full-time or may take
supplemental courses part-time while enrolled in a brick-and-mortar district or charter school. FLVS
is funded in the same completion-based manner as virtual charter schools.103 The completion-based
funding model for FLVS was implemented in 2003, one year after FLVS was first established.104 The
completion-based funding model for virtual charter schools was established in 2008 in the same
legislation permitting such schools.105
Average Daily Attendance States
Unlike ADM counts, this count method looks at actual attendance, not just enrollment. A student is
included in the day’s count only if they are in attendance, the requirements of which are typically
defined in statute. ADA counts tend to result in lower pupil counts than ADM, and also risk
underrepresenting low-income and high-needs student populations, who, on average, are absent
more frequently.
98 Fla. Stat. 1011.61(1)(c)1.b(III) 99 Fla. Stat. 1003.437 100 Fla. Stat. 1011.62 101 Fla. Stat. 1002.45(7) 102 Fla. Stat. 1002.45(7) 103 Fla. Stat. 1002.37(3) 104 Ch. 03-391, 19 at 29, Laws of Fla. (2003) 105 Ch. 08-147, 4 at 3, Laws of Fla. (2008)

www.qualitycharters.org
21
Oklahoma Virtual Charter School Funding Study COMMISSIONED BY THE STATEWIDE VIRTUAL CHARTER SCHOOL BOARD
California
Pupil Count: ADA is “measured as a count of daily attendance averaged over the school year
consisting of at least 175 school days meeting for the minimum length school day.”106
State Funding Formula: The Local Control Funding Formula (LCFF) comprises three formulas: a base
grant, a supplemental grant, and a concentration grant. The base grant applies grade-span weights
to the ADA count and the supplement grant gives weight to “targeted disadvantaged” populations
while the concentration grant builds on this by giving additional weight to charter schools or districts
with high concentrations of “targeted disadvantaged” pupils.107
Charter School Modifications: Charter schools are funded in the same manner as school districts
under the LCFF.108 Charter schools receive a portion of their LCFF allocation through a transfer in
lieu of property taxes from the host district.109
Virtual-specific Provisions: Virtual charter schools are included in the category of “non-classroom
based” schools, which include all types of schools that provide 20 percent or more of instructional
time outside of an in-person classroom setting.110
Non-classroom based schools are funded under the LCFF in the same manner as other schools but
are subject to an additional level of review and oversight prior to receiving funding.111 This additional
oversight is intended to ensure that the schools are spending an adequate share of their funding on
direct-instruction expenses.
Non-classroom based schools receive 70 percent of the LCFF amount unless the State Board of
Education determines that an adjustment, up to the full amount, is warranted; this determination
must be based on whether the school is meeting spending targets on direct instructional costs and
certified instructors.112 For virtual charter schools, the school may receive the full-share funding
amount if it exceeds an academic performance threshold or if it meets certain expenditure
thresholds and operational standards set out in regulation.113
Texas
Pupil Count: Pupil counts are calculated by ADA, measured as “the quotient of the sum of
attendance for each day of the minimum number of days of instruction … divided by the minimum
number of days of instruction.”114
State Funding Formula: The Foundation School Program funds schools through two formulas (called
“tiers”). The first, Basic Allotment (or Tier I), covers basic program costs and provides a per-pupil
amount, modified by local contribution and sparsity factors, based on a weighted pupil count that
includes various pupil- and district-specific weighting factors.115 Tier I makes up most of the state
106 5 CCR §15371(c) 107 Cal. Ed. Code 42238.02(d)-(f) 108 Cal. Ed. Code 42238.02 109 Cal. Ed. Code 47635 110 Cal. Ed. Code 47612.5(d); classroom instruction requirements are further set forth in 5 CCR §11963. 111 Cal. Ed. Code 47612.5(d) 112 Cal. Ed. Code 47634.2 113 5 CCR §11963.5 114 TEC 48.005(a)(1) 115 TEC Chapter 48, Subchapter B

www.qualitycharters.org
22
Oklahoma Virtual Charter School Funding Study COMMISSIONED BY THE STATEWIDE VIRTUAL CHARTER SCHOOL BOARD
funding. Tier II provides a mechanism to equalize local contribution disparities while allowing
districts to “enrich” their programmatic offering by exceeding the minimum tax effort
requirements.116
Charter School Modifications: Charter schools are funded through the Foundation School Program
in a similar manner to district schools, though with several modifications: Charter schools are
excluded from certain portions of the formula while exclusively eligible for other parts (intended to
offset those portions for which charters are ineligible).117 Charter school weighted ADA is also
calculated slightly differently, using state averages rather than local figures for certain weights.118
Virtual-specific Provisions: Virtual schools are funded differently depending on whether a student is
enrolled full-time or part-time. While there are many eligible part-time course providers, only
districts and charter schools may operate full-time virtual schools.119
Full-time virtual schools are entitled to funding “in the same manner that the district or [charter]
school is entitled to funding for the student’s enrollment in courses provided in a traditional
classroom setting, provided that the student successfully completes the electronic course.”120 A
student has successfully completed a course if the student “demonstrates academic proficiency and
earns credit for the course, as determined by a Texas Virtual Schools Network (TxVSN) teacher.”121
For part-time enrolled students, course providers are compensated at a flat rate per course, not to
exceed $400 per course: This amount is paid to the course provider by the district or charter school
in which the student is regularly enrolled. The district or charter school may refuse to pay course
costs for a student that enrolls in more than three full credit online courses in a single year. Course
payments for individual courses are split: the course provider receives no more than 70 percent of
the course cost prior to the student’s completion and the remainder upon completion. 122
116 TEC Chapter 48, Subchapter C 117 TAC 12.106 118 TEC 48.202 119 TEC 30A.101 120 TEC 30A.153(a) (emphasis added) 121 TAC 70.1015(a) 122 TAC 70.1025

www.qualitycharters.org
23
Oklahoma Virtual Charter School Funding Study COMMISSIONED BY THE STATEWIDE VIRTUAL CHARTER SCHOOL BOARD
Section 3: Existing Research on Virtual Charter School
Funding
Most research on full-time virtual charter schools has focused on the growth of the sector, the
characteristics of students who attend virtual charter schools, and the corresponding academic
performance of these students and schools. Some research has focused on how states fund virtual
charter schools, grouping states according to various approaches and highlighting examples of
these approaches in action. Far less attention has been paid to questions related to the cost of
educating a student in a full-time virtual environment in comparison to the cost of educating a
student in a traditional brick-and-mortar school environment.
Below is a summary of the key research, by publication, including any recommendations, on virtual
charter school funding in the following focus areas:
• Research on different approaches to funding virtual charter schools;
• Research comparing funding levels for virtual charter schools compared to brick-and-mortar
charter schools and traditional public schools; and
• Research on the costs associated with educating a student in a fully virtually environment
compared to costs associated with educating a student in a brick-and-mortar school
environment.
The summary below is not intended to be an exhaustive list of all research examined in these focus
areas but rather a summary of the research most relevant and aligned to the Research tasks
identified by SVCSB. The relevant “findings” and “recommendations” outlined below are as of the
publication date of the research and do not reflect subsequent statutory changes, as applicable. It is
also important to note that we did not independently fact check these research reports but rather
are compiling and summarizing the most relevant findings and recommendations from the existing
body of research in this area. In terms of the order of the reports below, we start with those that
cover virtual charter school funding more broadly before summarizing those that have a more
narrow focus.
The Center for Reinventing Public Education (CRPE); The Policy Framework for
Online Charter Schools (2015)
This report provides one of the most comprehensive examinations of the regulatory context for
online charter schools, including how online schools are funded across the country. This report was
one in a series of reports published by CRPE, Mathematica Policy Research, and the Center for
Research on Education Outcomes (CREDO) with the goal of increasing information on the landscape
and operation of online charter schools and their impact on students’ academic growth. CRPE is a
nonpartisan research center that seeks to make public education more effective, especially for
America’s disadvantaged students.

www.qualitycharters.org
24
Oklahoma Virtual Charter School Funding Study COMMISSIONED BY THE STATEWIDE VIRTUAL CHARTER SCHOOL BOARD
Relevant Findings – How States Fund Virtual Charter Schools
• States vary widely in determining how and when students in online charter schools are
counted for payment purposes. However, 19 states rely on traditional, enrollment-based
systems, such as ADM, ADA, or once- or twice-per-year headcounts.
• Only four states (Florida, Minnesota, New Hampshire, and Utah) use a completion-based
system to determine funding levels for online charter schools; each of these systems
operates differently, as illustrated in the table below.
State Standard Who Determines Successful
Completion
Partial
Payments
New Hampshire Competencies mastered Teacher Yes
Florida Pass end-of-course exam State No
Minnesota Course completions State No
Utah Credit registration/credit earned State Board of Education Yes
Table 1: Competency-based Funding System Attributes for Virtual Charter Schools in Four States
Relevant Findings – Funding Comparisons, Based on Statutory Analysis
• In 22 out of 27 states (82 percent), online charter schools are funded on par with brick-and-
mortar charter schools.
• In states in which online charter schools are funded at lower rates, their funding levels
ranged between 70 percent and 90 percent of charter school funding rates.
• Three states have funding provisions that apply only to online charter schools, which may or
may not result in “on par” funding.
o Wisconsin allows funding levels for online charter schools to be negotiated by a
student’s resident district and the charter provider.
o South Carolina funds online charter schools, authorized by the state, on par with
charter schools, but funds virtual charter schools, authorized by local districts, at
$1,500 less per student.
o Iowa limits the amount of categorical aid sent to online charter schools but not its
brick-and-mortar charter schools.
• In 12 of the 27 states with operating online charter schools, these schools receive additional
resources for serving students who are more costly to educate.
• While there is considerable empirical evidence that some students cost more to educate in
brick-and-mortar schools, such studies have not been replicated for virtual education.

www.qualitycharters.org
25
Oklahoma Virtual Charter School Funding Study COMMISSIONED BY THE STATEWIDE VIRTUAL CHARTER SCHOOL BOARD
Relevant Findings – Impact of Completion-based Funding
• Little is known about the impact of completion-based funding on schools and students.
While the policy experimentation is underway in a handful of states, CRPE found no evidence
of high-quality evaluation efforts of these funding models.
• However, based on limited research and data, CRPE found that completion-based funding
reduced the total amount of funding received by online charter schools in New Hampshire
and Florida.
o In Florida, based on data provided by Connections Academy, each full-time student
who successfully completed every course was funded at a rate of $5,145. Actual per-
student revenue, considering lost funding for students who failed to complete
courses, was $4,448, a 14 percent reduction.
o In New Hampshire, based on information from the Virtual Learning Academy Charter
School (the “NH Virtual Academy”), actual revenue is about 9 percent lower than the
state’s per-student allocation because not all students master competencies at the
same pace.
• Whether completion-based funding systems will motivate online charter schools to improve
instruction and increase completion rates remains an important question for future
research. It will also be interesting to see whether New Hampshire’s soft approach and
Florida’s hard approach produce different results. See How States Fund Virtual Charter
Schools, Section 2 of this report, for detailed descriptions of Florida’s and New Hampshire’s
differing approaches to completion-based funding.
Relevant Recommendations
• States should gather evidence and seek guidance about the effective online programs for
economically disadvantaged and exceptional learners to inform their regulatory decisions
and to allow them to provide appropriately differentiated funding.
• States should couple pilots of new funding approaches with high-quality evaluations so that
they can make evidence-based decisions about the expansion of these novel funding
approaches.
The National Alliance for Public Charter Schools, NACSA, 50CAN; A Call to Action:
To Improve the Quality of Full-time Virtual Charter Public Schools (June 2016)
In response to the well-documented and low academic performance of many full-time virtual
charter schools, this joint report was produced to spur action by state leaders and authorizers. The
report provides basic information about full-time virtual charter schools and their results while also
outlining a set of policy recommendations that states should adopt to improve the performance of
full-time virtual charter schools. It is important to note that each of these organizations supports
full-time virtual schooling as a choice option. While this report is not specifically focused on virtual
charter school funding, it does include some relevant findings and recommendations.

www.qualitycharters.org
26
Oklahoma Virtual Charter School Funding Study COMMISSIONED BY THE STATEWIDE VIRTUAL CHARTER SCHOOL BOARD
Relevant Findings – How States Fund Virtual Charter Schools
• Too many states rely on funding systems for full-time virtual charter schools that were
designed with brick-and-mortar schools in mind and do not consider the unique model of
these schools.
• However, a few states have implemented performance-based funding systems, including
Florida, Minnesota, New Hampshire, and Utah. Performance-based funding systems may
provide a means to improve the effectiveness of virtual charter schools by tying funding to
completion standards.
Relevant Findings – The Costs of Operating in a Virtual vs. Traditional School
Environment
• The operating costs for full-time virtual charter schools vary from the operating costs for
brick-and-mortar charter schools both in terms of the total costs as well as how resources
are allocated across certain funding categories.
o To support this finding, this paper cited studies from Augenblick, Palaich and
Associates and the Thomas B. Fordham Institute, both of which are summarized
below.
Relevant Recommendations
• States should require full-time virtual charter school operators to propose and justify a price
per student in their charter school applications.
• States should seek guidance from experts and researchers in determining responsible levels
of funding based on the real costs of full-time virtual charter schools.
• As states establish valid cost levels for operating full-time virtual charter schools, states
should also fund full-time virtual charter school students via a performance-based funding
system.
The Aurora Institute (formerly iNACOL); Performance-based Funding and Online
Learning: Maximizing Resources for Student Success (2015)
This report is focused on performance-based funding in online learning programs. In addition to
examining different online learning funding models and the costs of online schools, it also presents
a set of guiding principles for a performance-based funding model and offers corresponding
recommendations for policymakers. The Aurora Institute’s mission is to drive the transformation of
education systems and accelerate the advancement of breakthrough policies and practices to
ensure high-quality learning for all. This work includes support for competency-based education and
personalized learning.
Relevant Findings – Performance-based Funding
• Performance-based funding is a school finance model that links funding for public education
programs with measurable student performance outcomes.
• Performance-based funding is a multi-step policy evolution from course completion to
competency development.

www.qualitycharters.org
27
Oklahoma Virtual Charter School Funding Study COMMISSIONED BY THE STATEWIDE VIRTUAL CHARTER SCHOOL BOARD
• Completion-based funding is a step toward performance-based funding, but it is not the
same as competency-based funding.
• This report highlights the performance-based funding policies in Florida, Minnesota, and
New Hampshire.
Relevant Findings – Comparison of Total Funding Available Between Online
Schools and Brick-and-Mortar Charter and Traditional Schools
• Funding levels for specific schools are based on a variety of factors, including school size,
student characteristics, authorizer, whether it is single- or multi-district, and others.
• In most cases, the funding differences between online schools and traditional schools, in
addition to possible differences in proportions of weighted student subgroups, are primarily
a result of traditional schools’ access to additional targeted state funding streams, local
revenues, and federal funding sources.
• The table below compares funding for online schools versus traditional schools in select
states. Please note the data for online schools is from 2012-13 while the data for traditional
schools is from FY10; the report notes that the proportions are very similar in most cases
even though the comparison years are different.
Table 2: Funding of Online Schools Compared to Traditional Schools in Select States

www.qualitycharters.org
28
Oklahoma Virtual Charter School Funding Study COMMISSIONED BY THE STATEWIDE VIRTUAL CHARTER SCHOOL BOARD
Relevant Findings – Adequacy Study Comparing Costs of Online Schools to
Traditional Schools
• For this report, the Aurora Institute commissioned a study by Augenblick, Palaich and
Associates (APA Consulting) to determine the cost of “adequately” educating a student in an
online environment.
• This study (similar to a previous study conducted by APA Consulting and summarized
separately below) used a professional judgement panel methodology to understand and
describe costs of online schools and courses; compared those findings with funding for
students in traditional schools; and ultimately recommended a performance-based funding
model for online schools and courses. This study used comparative labor costs in Colorado
and Pennsylvania.
• This study found that:
o “Adequate” funding levels (meaning resourced to bring all students to college- and
career-ready success) for full-time online schools is between 93 percent and 98
percent of a traditional school cost.
o The largest driver of costs for online learning programs (as with traditional schools)
is labor; the most important impact on student success (as with traditional schools) is
the quality of the teacher.
o The other major cost drivers for online schools include content development,
technology, infrastructure, other operational costs for administration and program
management, counseling, and student support services.
Relevant Recommendations
For policymakers implementing a performance-based funding model, this paper recommends one
of the following two approaches:
• Online programs are funded for successful completion of online courses. Additional
incentive funding is available for students who show competency developments in learning
progressions for completed courses (for such courses where measurement based on
student growth is available) and for special needs student performance (if a school can show
greater gains for those students).
• Online programs receive funding based on course and competency completion percentages.
This rewards successful completion of competencies or units—rewarding incremental
student achievement and performance—centered on competency development in
alignment with state academic standards.
• The report also recognizes the key challenges and barriers to implementing a performance-
based funding formula, including:
o Most states do not yet have a system of assessments that allow for measurement of
student growth across most grade levels and subject areas (i.e., there are untested
subjects and grade levels without adequate independent assessments to ensure
performance outcomes).
o Few states have systems that measure student proficiency with benchmark “entry-
level assessments.”

www.qualitycharters.org
29
Oklahoma Virtual Charter School Funding Study COMMISSIONED BY THE STATEWIDE VIRTUAL CHARTER SCHOOL BOARD
o If states are measuring student growth, it is usually based on year-to-year state
assessments in certain grades and subjects, and not the amount of learning along a
trajectory for each student for certain increments of time.
o State data systems do not account well for student mobility.
Augenblick, Palaich and Associates (APA Consulting); 20/20 Costs and Funding of
Virtual Schools (2006)
Although dating back to 2006, this study commissioned by the BellSouth Foundation is the most
widely cited study on the costs associated with operating a full-time virtual school (both charter and
state- or district-led models) compared to a traditional brick-and-mortar school. This study is
noteworthy because it uses the professional judgment approach, which relies on the assumption
that experienced educators can specify the resources hypothetical schools need in order to meet
state standards, and that the costs of such resources can be determined based on a set of prices
specific to those resources.
Relevant Findings – Comparing Operating Costs of Virtual Schools to Traditional
Brick-and-Mortar Schools
• For virtual programs, five broad cost categories exist: management, instruction, course
development, technology set-up, and technology personnel.
• Costs within these categories can vary based on many factors, including program
governance; student-teacher ratio; student population; degree of at-home versus on-site
computing; course completion rates; quality assurance, research, and development; and
program size, growth, and economies of scale.
• This study found that the operating costs of virtual programs are about the same as the
costs of operating brick-and-mortar schools. However, the study did not look at costs related
to facilities or transportation. If those costs were factored in, the benefit/cost ratio for virtual
schools would likely increase since virtual schools spend little, if anything, on transportation
and capital improvements.
• Specifically, this study found that for a full-time virtual program, costs range from about
$7,200 to $8,300 per FTE, dependent on the variables noted above.
Relevant Recommendations
• Given variations across states and districts, individual states should develop more accurate
cost estimates and then tie these estimates to state funding mechanisms in order to develop
the most effective manner for funding virtual schools in their states.
The Thomas B. Fordham Institute; Creating Sound Policy for Digital Learning: The
Costs of Online Learning (2011)
This broadly cited paper seeks to answer the question of whether online learning can be better and
less expensive. Acknowledging the impossibility of placing a single price tag on online learning given
the widely varying levels of quality and efficiency, this paper attempts to estimate average costs and
a range of costs for online learning based on current practices. The mission of the Fordham Institute

www.qualitycharters.org
30
Oklahoma Virtual Charter School Funding Study COMMISSIONED BY THE STATEWIDE VIRTUAL CHARTER SCHOOL BOARD
is to promote educational excellence for every child in America via quality research, analysis, and
commentary, as well as advocacy and exemplary charter school authorizing in Ohio.
Relevant Findings – Comparing Actual Costs of Virtual Schools to Traditional Brick-
and-Mortar Schools
• This paper cites a cost range for virtual schools of $5,100 to $7,700 per pupil compared to
the $10,000 national average for traditional brick-and-mortar schools.
• The $10,000 per-pupil cost for traditional public schools does not include central
administrative costs and combines all public-school types (elementary, middle, and high
school) across the U.S. The virtual school per-pupil cost represents an estimate for full-time
high school students.
• In identifying these cost ranges, the paper also stresses that much better data on both costs
and outcomes are needed for policymakers to reach confident conclusions related to the
productivity and efficiency of virtual models.
• The figure below outlines the distribution of “current” costs, which should not be confused
with “recommended” costs by model.
Figure 1: Estimated Per-Pupil Expenditures

www.qualitycharters.org
31
Oklahoma Virtual Charter School Funding Study COMMISSIONED BY THE STATEWIDE VIRTUAL CHARTER SCHOOL BOARD
• This paper also examines the five-primary cost-driving categories (labor, content acquisition,
technology and infrastructure, school operations, and student-support services) and then
looks at the differences within those cost categories between the traditional model and the
fully virtual model. The figure below summarizes the cost estimate, fluctuation, and cost
levers.
Figure 2: Cost Bands for Virtual School Models
Relevant Recommendations
• To fulfill the promise of virtual learning (which has the potential to both improve student
outcomes and lower costs), researchers must examine not only the costs but also the
outcomes. The focus should shift to productivity: how to improve and maximize student
achievement relative to the money invested.
• Future innovation in this area should include careful tracking of quality and outcomes to
continue to provide more robust options for those experimenting with lower-cost delivery of
instruction.
National Education Policy Center (NEPC); Virtual Schools in the U.S. 2019
This comprehensive report on virtual schools, released by NEPC, examines: enrollment, student
characteristics, and performance of virtual schools in the United States; the relevant literature
regarding virtual schools; and the key policy issues and recent legislation in virtual schooling. The
NEPC has released similar reports on virtual schools since 2013. NEPC’s mission is to produce and
disseminate high-quality, peer-reviewed research to inform education policy discussions. Its work is
guided by the belief that the democratic governance of public education is strengthened when
policies are based on sound evidence. The relevant findings included below focus specifically on its
discussion of virtual school funding.
www.qualitycharters.org
32
Oklahoma Virtual Charter School Funding Study COMMISSIONED BY THE STATEWIDE VIRTUAL CHARTER SCHOOL BOARD
Relevant Findings – Comparing Costs of Virtual Schools to Traditional Brick-and-
Mortar Schools
• This report notes the differences in costs between traditional brick-and-mortar schools and
virtual schools has not been routinely studied or documented but that the limited studies in
this area find that the actual costs of virtual schools are less than traditional brick-and-
mortar schools.
• It cites various papers and articles in support of this position, including two papers that are
summarized below (see the Barbour and DeJarnatt papers).
• NEPC criticizes certain organizations that it says support virtual schools for using analyses
based on amount of average per-pupil funding received by virtual schools compared to
average per-pupil spend in traditional schools to argue that virtual schools should be funded
at equal levels to traditional brick-and-mortar schools.
Michael K. Barbour; Are Virtual Schools More Cost Effective-Compared to
Traditional, Brick-and- Mortar Schools; Technology in Schools: Debating Issues in
American Education (2012)
This paper was cited in the NEPC report to support its finding that the cost of virtual schools is less
than traditional brick-and-mortar schools. This paper examines whether virtual schools are more
cost effective compared to traditional brick-and-mortar schools. The author is currently an Associate
Professor of Instructional Design for the College of Education and Health Services at Touro
University in California. His research focuses on Kindergarten – Grade 12 online teaching and
learning.
Relevant Findings – Comparing Cost of Virtual Schools to Traditional Brick-and-
Mortar Schools
• This paper concludes that online learning is more cost effective than brick-and-mortar
schooling but acknowledges that this conclusion is based on a selective amount of data.
Furthermore, he highlights the difficulty in obtaining good data from the for-profit
companies that operate many of the virtual schools across the county.
• In support of the finding that online learning is more cost effective, the paper cites several
small and localized analyses, including:
o A 2007 report from the Florida TaxWatch Center for Educational Performance and
Accountability found that the Florida Virtual School (FLVS) gets solid student
achievement results at a reduced cost to the state. It noted that FLVS was $284 more
cost effective in 2003-04, and $1,048 more cost effective in 2006-07.
o Information presented in a webinar by Insight Schools Inc., a virtual charter school
provider, that the average expenditure per student in the state (report does not
identify the state) was $9,760 for the 2008-09 school year, but the cost per student to
Insight Schools was only $6,480.
o A 2005 study by the Ohio legislature determined that the per-student cost for its
virtual charter schools was $5,382 compared to $7,452 per student in brick-and-
mortar-charter schools and $8,437 per student in public brick-and-mortar schools.

www.qualitycharters.org
33
Oklahoma Virtual Charter School Funding Study COMMISSIONED BY THE STATEWIDE VIRTUAL CHARTER SCHOOL BOARD
• The paper notes that many of the examples used to support its position are based on
established programs and that starting a new virtual school may require a higher financial
investment. Despite higher initial start-up costs, economies of scale should be reached over
time.
Susan L. DeJarnatt; Keep Following the Money: Financial Accountability and
Governance of Cyber Charter Schools (2014)
This paper was cited in the NEPC report to support its finding that the cost of virtual schools is less
than traditional brick-and-mortar schools. The purpose of this paper is to highlight the significant
amount of money devoted to cyber charter education in Pennsylvania. The author is currently a
Professor of Law at Temple University Beasley School of Law. Her research focuses on education
reform and the psychology of parental choice in education.
Relevant Findings – Financial Health and Spending of Virtual Charter Schools in
Pennsylvania
• This paper focuses specifically on virtual charter schools in Pennsylvania, often comparing
those set up by a consortia of public school districts called Intermediate Units (IUs) (these
schools tend to be smaller) and those that are not affiliated with a public school district and
are often run by for-profit management companies (these schools tend to be very large).
• This paper found that all but one of the virtual charter schools examined reported significant
surpluses of revenue over expenses and were amassing significant net assets according to
their 990s and Annual Reports. While some reserves are prudent, the amount cited in this
paper raises questions as to what reserves are appropriate.
• This paper also highlights how the large virtual charter schools appear to devote significant
resources to marketing and advertising, travel and conferences, and management fees.
Relevant Recommendations
• Fix the formula for funding virtual charter schools; reduce the per-pupil funding to an
amount more in line with the actual costs of virtual education (noting that in Pennsylvania
virtual charter schools received the identical per-pupil funding as brick-and-mortar charter
schools).

www.qualitycharters.org
34
Oklahoma Virtual Charter School Funding Study COMMISSIONED BY THE STATEWIDE VIRTUAL CHARTER SCHOOL BOARD
Section 4: Real Costs Analysis
This section of the Report seeks to identify the “real costs” of educating a student in Oklahoma’s
virtual charter school learning environment. As referenced in the Introduction of this report, virtual 123charter local education agencies (LEAs) in Oklahoma continue to grow rapidly while
underperforming academically compared to non-virtual charter LEAs and traditional LEAs. Virtual
charter LEAs are funded through the same State funding formula, with no “virtual discount” as
applied in other states.
However, data shows that virtual charter LEAs received slightly lower levels of state and local
funding per pupil and reported lower per-pupil expenditure levels than both non-virtual charter
LEAs and traditional LEAs in the State, on average. Virtual LEAs do not have to spend on many non-
instructional “brick and mortar”-related expenditures. Additionally, data shows that virtual charter
LEAs also spent less per pupil than non-virtual charter and traditional LEAs on instruction, on
average. This is, in part, attributable to differences in school size and location, non-state foundation
funding formula revenues, the State’s use of “high year weighted ADM” to calculate Foundation Aid 124funding, differences in student needs, and differences in reported levels of net surplus and loss at
individual LEAs.
The analysis below is based on publicly available data. This data is limited because each of the five
virtual charter school operators in Oklahoma in FY20 contracted with for-profit management
companies and, as a result, most expenditures at four of the five virtual charter LEAs are in the form
of payments to contracted management companies for services without additional available detail.
We have drawn broad conclusions and highlighted key trends based on the data available to
complete this analysis, though additional detail, particularly on actual staffing levels, would provide
valuable insight to how these schools support their educational objectives.
Given the discretionary nature of funding sources, LEAs (regardless of school type) report
substantial variation in the way they spend funds. This report shares comparisons of virtual charter
LEAs to non-virtual charter LEAs and traditional LEAs, but it is important to keep in mind the
variability in spend within each of these groups—on total expenditures and on types of
expenditures as well.
Key Findings
A. Demand is strong for virtual school options – Virtual charter LEAs in Oklahoma have
experienced rapid growth over the past four years with annual expenditures increasing by
192 percent to $174 million in FY20.
B. Virtual and non-virtual LEAs receive funds through the same state funding formula. Through
Oklahoma’s State Foundation Aid funding formula (“Foundation Aid”), which funds LEAs
primarily on weighted ADM, virtual charter LEAs are mechanically funded through the same
formula as non-virtual (charter and traditional) counterparts.
123 This section of the report analyzes revenue and expenditures at the organization or LEA-level, rather than at the individual school level, as annual “Foundation Aid”
funding and expenditures are reported at the LEA-level. 124 High Year Weighted ADM allows for LEAs to be funded at the highest of three point-in-time weighted ADM data points: two years prior, one year prior, or first nine
weeks of the current fiscal year. This inherently allows for declining enrollment LEAs to receive more dollars per pupil (using current funding divided by current year
enrollment) than increasing enrollment LEAs. Per HB2078, effective for FY23, LEAs will be funded using the higher of two point-in-time weighted ADM data points: one
year prior or first nine weeks.
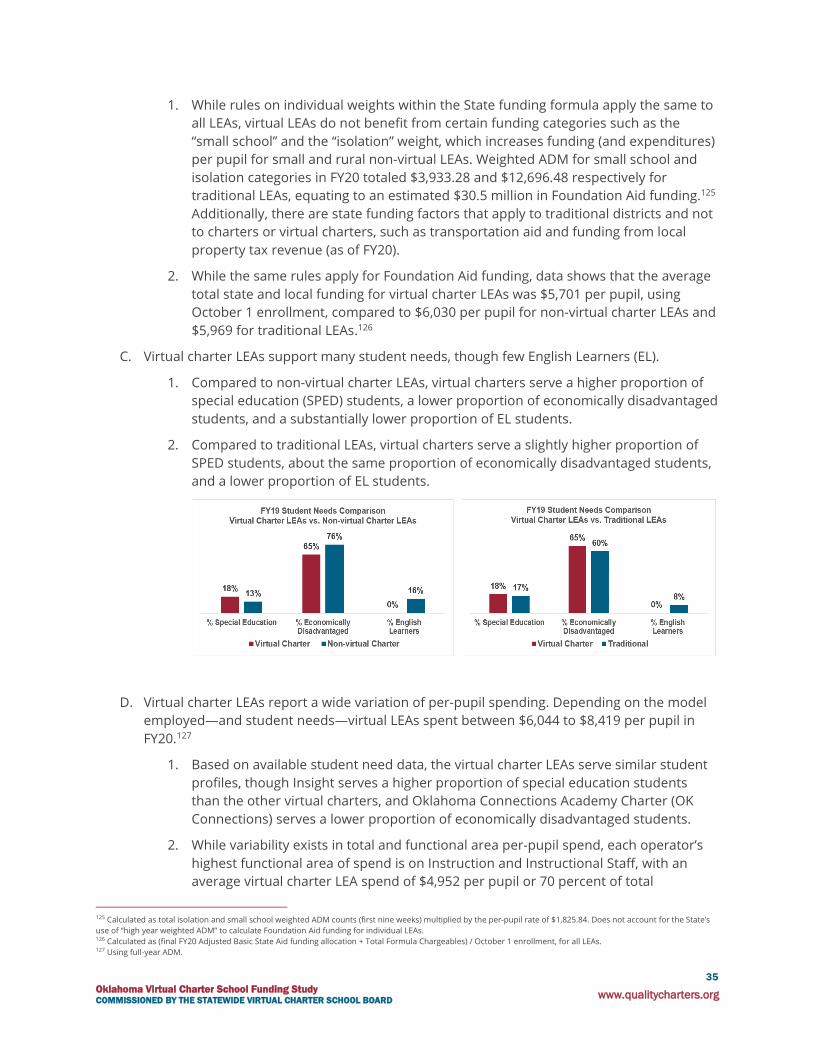
www.qualitycharters.org
35
Oklahoma Virtual Charter School Funding Study COMMISSIONED BY THE STATEWIDE VIRTUAL CHARTER SCHOOL BOARD
1. While rules on individual weights within the State funding formula apply the same to
all LEAs, virtual LEAs do not benefit from certain funding categories such as the
“small school” and the “isolation” weight, which increases funding (and expenditures)
per pupil for small and rural non-virtual LEAs. Weighted ADM for small school and
isolation categories in FY20 totaled $3,933.28 and $12,696.48 respectively for
traditional LEAs, equating to an estimated $30.5 million in Foundation Aid funding.125
Additionally, there are state funding factors that apply to traditional districts and not
to charters or virtual charters, such as transportation aid and funding from local
property tax revenue (as of FY20).
2. While the same rules apply for Foundation Aid funding, data shows that the average
total state and local funding for virtual charter LEAs was $5,701 per pupil, using
October 1 enrollment, compared to $6,030 per pupil for non-virtual charter LEAs and
$5,969 for traditional LEAs.126
C. Virtual charter LEAs support many student needs, though few English Learners (EL).
1. Compared to non-virtual charter LEAs, virtual charters serve a higher proportion of
special education (SPED) students, a lower proportion of economically disadvantaged
students, and a substantially lower proportion of EL students.
2. Compared to traditional LEAs, virtual charters serve a slightly higher proportion of
SPED students, about the same proportion of economically disadvantaged students,
and a lower proportion of EL students.
D. Virtual charter LEAs report a wide variation of per-pupil spending. Depending on the model
employed—and student needs—virtual LEAs spent between $6,044 to $8,419 per pupil in
FY20.127
1. Based on available student need data, the virtual charter LEAs serve similar student
profiles, though Insight serves a higher proportion of special education students
than the other virtual charters, and Oklahoma Connections Academy Charter (OK
Connections) serves a lower proportion of economically disadvantaged students.
2. While variability exists in total and functional area per-pupil spend, each operator’s
highest functional area of spend is on Instruction and Instructional Staff, with an
average virtual charter LEA spend of $4,952 per pupil or 70 percent of total
125 Calculated as total isolation and small school weighted ADM counts (first nine weeks) multiplied by the per-pupil rate of $1,825.84. Does not account for the State’s
use of “high year weighted ADM” to calculate Foundation Aid funding for individual LEAs. 126 Calculated as (final FY20 Adjusted Basic State Aid funding allocation + Total Formula Chargeables) / October 1 enrollment, for all LEAs. 127 Using full-year ADM.

www.qualitycharters.org
36
Oklahoma Virtual Charter School Funding Study COMMISSIONED BY THE STATEWIDE VIRTUAL CHARTER SCHOOL BOARD
expenditures. The next highest functional area of spend is on student support
services, with average spend of $789 per pupil or 11 percent of total expenditures.
E. All virtual charter LEAs contracted with for-profit management companies.
1. Each of the five virtual school operators in Oklahoma (open in FY20) contracted with
for-profit management companies and, as a result, the vast majority of expenditures
at four of the five virtual charter LEAs are in the form of payment to a contracted
management company for services. Total estimated fees paid from the charters to
the for-profit companies for services was $58 million in FY20, representing a range of
$1,773 to $7,000 per pupil.128
2. Without further detail on management company spending, it is difficult to ascertain
true drivers of resource allocation at virtual operators on student education; staffing
headcount, position type, and salary detail tying to actual expenditures are not
published.
F. Virtual charter LEAs spent between $0.73 to $0.79 for every $1 spent at non-virtual LEAs.
Compared to both non-virtual charter LEAs and traditional LEAs, virtual charter LEAs have
reported lower per-pupil expenditures, on average, in FY20. In total per-pupil terms:
1. Oklahoma virtual charter LEAs spend $0.79 for every $1 that non-virtual charter LEAs
spend.129
2. Oklahoma virtual charter LEAs spend $0.73 for every $1 that traditional LEAs spend.
G. Comparison to Non-Virtual LEAs - Expenditure Types. Unlike non-virtual charter and
traditional LEAs, virtual charter LEAs incur minimal expenditures for operations and
maintenance, and they do not incur expenditures for student transportation, food service, or
enterprise services. Virtual charter LEAs do not receive incremental funding (state and
federal) for some of these services, while their non-virtual charter and traditional LEA
counterparts do. Virtual charter LEAs also spend substantially less on school administration
costs per pupil compared to both non-virtual charter and traditional LEAs.
1. Further analysis on the types of expenditures that virtual charter LEAs spend
minimally or not at all on shows:
i. Operations and Maintenance: Non-virtual charter LEAs reported an average
of $945 per pupil or 11 percent of total expenditures on this category in
FY20. Traditional LEAs reported an average of $1,280 per pupil or 12 percent
of total expenditures on this category in FY20.
ii. Transportation Services: Non-virtual charter LEAs reported an average of $46
per pupil or 1 percent of total expenditures on this category in FY20.
Traditional LEAs reported an average of $293 per pupil or 3 percent of total
expenditures on this category in FY20. Virtual charter LEAs do not receive
incremental funding for transportation services, while their non-virtual
charter and traditional LEA counterparts do.
128 Per-pupil calculation uses October 1 enrollment counts. Object codes 361 to 399 in OCAS report. Assumes expenditures in these categories represent the total fees
for services and supplies paid to the management companies. 129 Per guidance from the Oklahoma Virtual School Board, analysis comparing virtual charter LEAs to non-virtual LEAs excludes Epic One-on-One Charter School (virtual
charter) and Epic Blended Learning Center (non-virtual charter) for data consistency. This figure is not adjusted for differences in funding levels and uses October 1
enrollment due to data availability.

www.qualitycharters.org
37
Oklahoma Virtual Charter School Funding Study COMMISSIONED BY THE STATEWIDE VIRTUAL CHARTER SCHOOL BOARD
iii. Food Services: Non-virtual charter LEAs reported an average of $451 per
pupil or 5 percent of total expenditures on this category in FY20. Traditional
LEAs reported an average of $679 per pupil or 6 percent of total
expenditures on this category in FY20. Virtual charter LEAs do not receive
incremental funding for food services, while their non-virtual charter and
traditional LEA counterparts do.
iv. Enterprise Services: Non-virtual charter LEAs reported an average of $19 per
pupil or 0 percent of total expenditures on this category in FY20. Traditional
LEAs reported an average of $124 per pupil or 1 percent of total
expenditures on this category in FY20.
v. Combined: When combining Operations and Maintenance, Food Services,
Transportation Services, and Enterprise Services, virtual charter LEAs
reported an average of only $25 per-pupil (0 percent of total expenditures),
compared to the non-virtual charter LEA average of $1,460 per pupil (16
percent of total expenditures) and the traditional LEA average of $2,377 per-
pupil (22 percent of total expenditures). As previously noted, virtual charter
LEAs do not receive incremental funding for transportation and food
services, while their non-virtual counterparts do.
vi. When excluding these expenditures from the analysis130, the reported FY20
average virtual charter LEA per-pupil expenditures was $887 (or 12 percent)
below the average for non-virtual charter LEAs and $1,814 (or 22 percent)
below the average for traditional LEAs.
2. While the three school types are funded through the same Foundation Aid formula,
and while virtual charter LEAs do not have to spend on the non-instructional items
noted above, data shows that virtual charter LEAs spent less, per pupil, than non-
virtual charter LEAs and traditional LEAs on instruction, on average. Virtual charter
LEAs reported an average spend of $4,594 per-pupil on Instruction and Instructional
Staff, compared to $5,376 for non-virtual charter LEAs and $6,185 for traditional
LEAs.
3. While, on average, virtual charter LEAs spend less on instruction than non-virtual
charter and traditional LEAs, some (but not all) of them spend more on instructional
technology services and supplies than traditional LEAs. There is variability in the level
of per-pupil spend on technology within the virtual charter category, with two of the
virtual charter LEAs reporting more than $1,600 per pupil on instructional technology
spend.131
4. Compared to non-virtual charter and traditional LEAs, virtual charter LEAs have
reported higher per-pupil expenditures on student support services. Compared to
traditional LEAs, specifically, virtual charter LEAs have reported higher per-pupil
spend on business.132
130 Only including expenditures for Instruction & Instructional Staff, Support Services – Students, General Administration, School Administration, and Business. 131 “Technology” considered to be the following object code categories: 346-TECH REL TECH SER; 371-Technology Related Technical Services; 432-Technology Services;
653-Supplies-Technology Related. Note, LEAs excluded from the comparison of virtual charter LEAs to both non-virtual LEAs and traditional LEAs are included in the
details of this report. 132 “Business” function is defined in OCAS as central services or activities that support other administrative and instructional functions, fiscal services, human resources,
planning, and administrative information technology.
www.qualitycharters.org
38
Oklahoma Virtual Charter School Funding Study COMMISSIONED BY THE STATEWIDE VIRTUAL CHARTER SCHOOL BOARD
Approach
To assess the “real costs” for educating a student in Oklahoma’s virtual charter school learning
environment, this report evaluates actual historical LEA-level expenditure data as published in the
OCAS alongside student enrollment data, ADM data, student needs data, audited financial reports,
academic performance data, and the management agreements between the non-profit virtual
charter LEAs and their for-profit operators.
By focusing on the reporting of actual historical expenditure data and performance to analyze real
costs, this analysis intentionally does not quantify, propose, or prescribe the costs that a virtual
charter LEA must incur or the resources a virtual LEA must allocate to provide an adequate level of
education to its students.
Through OCAS, the Oklahoma State Department of Education (“State Department of Education”)
collects and publishes actual historical LEA expenditure data for each LEA in the state annually.
These records include total or aggregate expenditures for each LEA with details and expenditure
categories aligning to the State’s uniform chart of accounts. OCAS also reports a “per-pupil
expenditure” figure calculated using aggregate expenditures (with exclusions) divided by the
October 1 enrollment count of that same year.
The OCAS expenditure report and the expenditures referred to in this report represent
expenditures funded with all sources of funds (state, federal, local, private, etc.), not just those
funded with State funding. This report categorizes all Oklahoma public Pre-kindergarten – Grade 12
LEAs into three categories: virtual charter LEAs, non-virtual charter LEAs, and traditional LEAs.
• Virtual charter LEAs – LEAs serving Oklahoma virtual charter schools authorized by the
SVCSB. These LEAs are full-time public education options delivering instruction through an
online format. In FY20, OCAS reported 5 authorized virtual charter LEAs serving 21,532
students, based on October 1 enrollment counts.
• Non-virtual charter LEAs – LEAs serving Oklahoma public schools established by contract
with a board of education of a school district, an area vocational-technical school district, a
higher education institution, or the State Board of Education pursuant to the Oklahoma
Charter Schools Act. For purposes of this report, this category excludes virtual charter LEAs.
These LEAs deliver instruction primarily in a traditional, in-person “brick-and-mortar” setting.
In FY20, OCAS reported 25 authorized non-virtual charter LEAs serving 24,456 students,
based on October 1 enrollment counts.
• Traditional LEAs – All other Oklahoma public Pre-kindergarten – Grade 12 LEAs reporting in
OCAS. These LEAs deliver instruction primarily in a traditional, in-person “brick-and-mortar”
setting. In FY20, OCAS reported 511 traditional LEAs serving 657,468 students, based on
October 1 enrollment counts.
This analysis reports on LEA-level per-pupil expenditures in a variety of ways. When counting
students, this report uses either 1) October 1 enrollment for the student count denominator or 2)
full-year ADM for the student count denominator. While both figures count full-time students only
and exclude partial or part-time students, the October 1 enrollment count represents a point-in-time
enrollment near the beginning of the school year while the full-year ADM count represents the
average of total days of membership (present and absent) divided by days taught.

www.qualitycharters.org
39
Oklahoma Virtual Charter School Funding Study COMMISSIONED BY THE STATEWIDE VIRTUAL CHARTER SCHOOL BOARD
Given the relatively mobile nature of virtual school membership and the fact that ADM more
accurately measures student participation over the course of the full year, some might view per-
pupil expenditures using ADM as more relevant and accurate. Given that OCAS reports per-pupil
expenditures using October 1 enrollment, some might prefer to use per-pupil expenditures using
enrollment for data consistency. The denominator used is noted, and the methodology used
depends on both context and data availability.
When reporting per-pupil expenditures for a group of LEAs, this report uses 1) total per-pupil
expenditures, 2) median LEA per-pupil expenditures, and/or 3) average LEA per-pupil expenditures.
Total per-pupil expenditures are calculated using total expenditures of all LEAs counted in the group
divided by total students of all LEAs counted in the group, representing a weighted average. Since
totals can be skewed by larger LEAs, this report also uses median and average per-pupil spend,
which is calculated as the median or average of each of the individual LEA’s reported per-pupil
expenditures in the group of LEAs analyzed.
Given that each of the five virtual charter LEAs in operation during FY20 contracted with for-profit
management companies, limited public data exists for the staffing structure, staff type used, and
employee salaries tying to reported expenditures.
This report classifies expenditures by type using OCAS function dimension codes (i.e., Instruction vs.
Operations and Maintenance). A short definition of each category is included below.133
• 1000 Instruction: Instruction includes the activities dealing directly with the interaction
between teachers and students. Teaching may be provided for students in a school
classroom, in another location such as a home or hospital, and in other learning situations
such as those involving co-curricular activities.
• 2100 Support Services - Students: Activities designed to assess and improve the well-being of
students and to supplement the teaching process.
• 2200 Instructional Staff: Activities associated with assisting the instructional staff with the
content and process of providing learning experiences for students.
• 2300 General Administration: Activities involving the establishment and administration of
policy in connection with operating the entire school district.
• 2400 School Administration: Activities concerned with overall administrative responsibility
for a single school or a group of schools.
• 2500 Business (or “Central Services”): Activities that support other administrative and
instructional functions, fiscal services, human resources, planning, and administrative
information technology.
• 2600 Operations & Maintenance: Activities concerned with keeping the physical plant open,
comfortable, and safe for use, and keeping the grounds, buildings, and equipment in an
effective working condition and state of repair. Activities which maintain safety in buildings,
on the grounds, and in the vicinity of schools are included.
133 For a complete list of OCAS function code definitions, please refer to the OCAS Manual Function Dimension Definitions section, starting on page F-2.

www.qualitycharters.org
40
Oklahoma Virtual Charter School Funding Study COMMISSIONED BY THE STATEWIDE VIRTUAL CHARTER SCHOOL BOARD
• 2700 Student Transportation: Activities concerned with the conveyance of students to and
from school as provided by state law. Included are trips between home and school, and trips
to school activities.
• 3100 Food Services: Activities concerned with providing food to students and staff in a
school or LEA. This service area includes the preparation and service of regular and
incidental meals, including breakfasts, lunches, or supplements in connection with school
activities, and the delivery of food.
• 3200 Enterprise Operations: Activities that are financed and operated in a manner similar to
private business enterprises where the stated intent is that the costs are financed or
recovered primarily through user charges.
Expenditures reported in OCAS and used in this report exclude in-kind expenditures benefiting the
virtual charter LEAs. These costs are reported to have been incurred by the management company
at no financial cost to the virtual charter LEAs, pursuant to management agreement provisions that
require the charters to maintain positive net assets.134
As of the time this analysis was completed, expenditure data for FY21 was not yet available.
Expenditures were analyzed for FY17-FY20.
Analysis
1. Sector Growth
Virtual charter LEAs are currently experiencing rapid growth in Oklahoma. Even prior to the
impact of COVID-19, virtual charter LEAs grew from 13,225 students in FY17 to 21,532
students in FY20, an increase of 62.8 percent over four years, with a compound annual
growth rate (“CAGR”) of 17.6 percent.135 By FY20, student enrollment at virtual charter LEAs
in total was just 3,000 students below student enrollment non-virtual charter LEAs, and in
FY21 with the impact of COVID-19, virtual charter LEA enrollment exceeded that of non-
virtual charter LEA enrollment in the State for the first time.
134 For example, for OK Virtual Charter LEA, a provision in the K12 management agreement provides for the issuance of accommodation credits to ensure the School
does not end a fiscal year in a negative net asset position. At June 30, 2020, in-kind contributions were $3,898,561. 135 Virtual charter LEA enrollment, based on October 1 enrollment counts.
Figure 1: Oklahoma Virtual Charter LEAs Total Expenditures and Total Enrollment.

www.qualitycharters.org
41
Oklahoma Virtual Charter School Funding Study COMMISSIONED BY THE STATEWIDE VIRTUAL CHARTER SCHOOL BOARD
While virtual charter LEAs are funded through the State per-pupil funding formula at the
same rate as their non-virtual counterparts, increasing enrollment and increasing funding
rates have directed increasing funds toward the virtual charter LEAs. Total expenditures at
Oklahoma’s virtual charter LEAs have grown from $59.9 million in FY17 to $174.9 million in
FY20, an increase of 191.9 percent over four years, with a CAGR of 42.9 percent.136
From FY17 to FY20 there have been four to five virtual charter LEAs in operation during a
given year, and in FY20 these operators were E-School Virtual Charter (E-School), Epic One-
on-One Charter School (Epic One Virtual), Insight School of Oklahoma (Insight), OK
Connections, and Oklahoma Virtual Charter Academy (OK Virtual). Each year, Epic One
Virtual has enrolled the majority of virtual charter students with 17,106 students in October
2019 (FY20) or 79 percent of total virtual charter LEA enrollment.
2. Comparison of Student Needs at Virtual Charter LEAs to Non-virtual Charter and Traditional
LEAs
As this report has noted, student needs are a factor in Oklahoma’s state funding formula,
with incremental weights for students with specific types of student need. Differences in
student need levels can explain differences in per-pupil spend among LEAs, as well. Figure
22 shows the enrollment percentages for special education, economically disadvantaged,
and EL students for virtual charter LEAs versus non-virtual charter LEAs and virtual LEAs
versus traditional LEAs.
Compared to non-virtual charter LEAs, virtual charters serve a higher proportion of SPED
students, a lower proportion of economically disadvantaged students, and a substantially
lower proportion of EL students.
Compared to traditional LEAs, virtual charters serve a slightly higher proportion of SPED
students, about the same proportion of economically disadvantaged students, and a lower
proportion of EL students.
136 Aggregate expenditures (all funds), with state-approved “exclusions,” as reported in OCAS.
Figure 2: Oklahoma virtual charter school enrollment by LEA.

www.qualitycharters.org
42
Oklahoma Virtual Charter School Funding Study COMMISSIONED BY THE STATEWIDE VIRTUAL CHARTER SCHOOL BOARD
3. Virtual Charter Expenditures – Per Pupil
Total View Using Enrollment: When reviewing historical per-pupil expenditures in total,
Oklahoma’s virtual charter LEAs’ spend has grown from $4,530 in FY17 to $8,122 in FY20, an
increase of 79.3 percent over four years, with a CAGR of 21.5 percent.
Total View Using ADM: When reviewing historical per-pupil expenditures in total, Oklahoma’s
virtual charter LEAs spend has grown from $5,042 in FY17 to $8,088 in FY20, an increase of
60.4 percent over four years, with a CAGR of 17.1 percent.
Given the proportion of total students and spend represented by Epic One Virtual in each
year, median virtual charter LEA expenditures should also be considered.
Median LEA Per-pupil Expenditures Using Enrollment: When reviewing the median LEA per-
pupil expenditures, Oklahoma’s virtual charter LEAs spend has grown from $4,626 in FY17 to
$7,094 in FY20, an increase of 53.3 percent over four years, with a CAGR of 15.3 percent.
Median LEA Per-pupil Expenditures Using ADM: When reviewing the median LEA per-pupil
expenditures, Oklahoma’s virtual charter LEAs’ spend has grown from $5,889 in FY17 to
$6,652 in FY20, an increase of 13.0 percent over four years, with a CAGR of 4.1 percent.
Figure 3: FY19 student need percentages comparison. FY20 data unavailable for special education and
English learners at the time of this report.

www.qualitycharters.org
43
Oklahoma Virtual Charter School Funding Study COMMISSIONED BY THE STATEWIDE VIRTUAL CHARTER SCHOOL BOARD
4. FY20 Virtual Charter Expenditures by LEA
Of the $175 million in total virtual charter LEA expenditures reported in Oklahoma in FY20,
expenditures between the virtual LEAs ranged from $244,000 at E-School to more than $146
million at Epic One Virtual. This results in a wide range in reported per-pupil spend at virtual
LEAs in FY20: from $6,044 at E-School to $8,419 at Epic One Virtual.
Figure 4: Oklahoma virtual charter LEAs – total per-pupil expenditures and median
LEA per-pupil expenditures.
Figure 5: Oklahoma virtual charter LEAs – FY20 expenditures by LEA.

www.qualitycharters.org
44
Oklahoma Virtual Charter School Funding Study COMMISSIONED BY THE STATEWIDE VIRTUAL CHARTER SCHOOL BOARD
Based on available student need data, the virtual charter LEAs serve similar student profiles,
though Insight serves a higher proportion of special education students than the other virtual
charters, and OK Connections serves a lower proportion of economically disadvantaged
students. While Insight reported nearly double the proportion of special education students as
other virtual charter LEAs, for which they receive incremental Foundation Aid funding, they do
not report the highest levels of per-pupil expenditures. The following section of this report
shows that Insight spent the second highest per pupil on both the Instruction and Student
Support Services categories.
When reviewing expenditure detail, each virtual charter spends differently. Of the five virtual
LEAs, only Epic One Virtual reports personnel salaries and benefits. This is because the other
four virtual operators leverage staff that are employees of the management company that they
contract with, the cost of which is codified as a contracted or purchased service. For this reason,
the vast majority of expenditures at four of the five virtual charter LEAs are in the form of
payment to a contracted management company for services. A view of FY20 expenditures by
object code is below.137
137 Per conversations with SVCSB, staffing detail for virtual charter LEAs contracting with for-profit management companies will likely be included in future year
accountability reports.
Figure 6: Oklahoma virtual charter LEAs – FY19 student need profiles. FY20 data for SPED and EL not available at
the time of this report. Note E-School was not open in FY19.

www.qualitycharters.org
45
Oklahoma Virtual Charter School Funding Study COMMISSIONED BY THE STATEWIDE VIRTUAL CHARTER SCHOOL BOARD
Figure 8 shows the breakout of expenditures by accounting function code. Differentiating
between the nature of the expenditures’ function, we see both similarities and differences in
FY20 resource allocation choices at the virtual charters:
• Instruction & Instructional Staff: With an average virtual charter LEA spend of $4,952
per pupil or 70 percent of total expenditures, this is each LEA’s largest expenditure
category.
• Support Services – Students: With average spend of $789 per pupil or 11 percent of
total expenditures, this is the second-largest expenditure area for three of the five
virtual charter LEAs.
• Business, Operations & Maintenance: This non-instructional category combines two
of Oklahoma’s function codes for presentation purposes. On average, 85 percent of
this category is composed of “Business” expenses with 15 percent coded to
“Operations & Maintenance.” On average, this is the third-highest functional area of
spend at virtual charters. This is the second-largest expenditure area for two of the
five virtual charter LEAs.
• General Administration: Virtual charters reported an average spend of $437 per
pupil or 6 percent of total expenditures in this non-instructional category.
• School Administration: With the way functional categories are grouped in this report,
School Administration is the lowest area of spend for each virtual charter, with an
average LEA spend of $188 per pupil or 3 percent of total spend.
Figure 7: Oklahoma virtual charter LEAs – FY20 expenditures by LEA, by object code.

www.qualitycharters.org
46
Oklahoma Virtual Charter School Funding Study COMMISSIONED BY THE STATEWIDE VIRTUAL CHARTER SCHOOL BOARD
While averages can be used to describe functional expenditures across the virtual charters,
there is material variability in spend levels for each category across the virtual charter LEAs.
Differences in spend can be mostly attributable to the discretionary nature of the funding
sources provided, as well as the varying level of student needs at each virtual charter LEA.
For additional context, Figure 9 below shows each virtual charter LEA’s FY20 reported
expenditure, by function area, as a percentage of total spend.
Figure 9: Oklahoma virtual charter LEAs – FY20 expenditures by LEA, by function code.
Figure 8: Oklahoma virtual charter LEAs – FY20 expenditures by LEA, by function code.

www.qualitycharters.org
47
Oklahoma Virtual Charter School Funding Study COMMISSIONED BY THE STATEWIDE VIRTUAL CHARTER SCHOOL BOARD
Figure 10 shows FY20 technology-related expenditures per pupil for Oklahoma virtual
charter LEAs. As the data shows, an average expenditure, or a virtual charter total view,
would not accurately articulate a meaningful data point for the group given the wide range
in reported expenditures. The variability in reported spend on technology ranges from $14
to $1,785 per pupil, based on reported expenditures. Of note, two LEAs, Insight and OK
Virtual, spent more than $1,700 per pupil in FY20 on technology services, supplies, and
materials.
Each virtual charter LEA has reported increasing expenditures from FY17 to FY20. See the
trend of reported expenditures per pupil, using ADM, by virtual charter LEA below.
Figure 11: Per-pupil Expenditure Trend by LEA - by function code, using ADM. Trend FY17-FY20.
Figure 10: Technology” considered to be the following object code categories: 346 TECH REL TECH SER, 371-
Technology Related Technical Services, 432 Technology Services, 653 Supplies-Technology Related.

www.qualitycharters.org
48
Oklahoma Virtual Charter School Funding Study COMMISSIONED BY THE STATEWIDE VIRTUAL CHARTER SCHOOL BOARD
5. Expenditures in the Form of Payment to Contracted Management Company
In FY20, all the virtual charter LEAs contracted with for-profit management companies for a
variety of services:
• Epic One Virtual contracted with Epic Youth Services, LLC (“EYS”)
• Insight School of Oklahoma, Inc., contracted with K12 Virtual Schools, LLC, a
subsidiary of Stride, Inc.
• Virtual Education Services Association operating as E-School Virtual Charter Academy
contracted with ESVCA, LLC
• Oklahoma Virtual Charter Academy contracted with K12 Virtual Schools, LLC, a
subsidiary of Stride Inc.
• Oklahoma Connections Academy contracted with Connections Academy LLC &
Pearson Online & Blended Learning K-12 (“OBL”)
Each contract specifies the different services that the for-profit management companies
provide and the fees for which they provide those services. Per the virtual charter LEAs’
submitted expenditure reports, total ESTIMATED fees paid from the charters to the for-profit
companies for services was $58 million in FY20.
The SVCSB has approved a new virtual charter LEA, the Oklahoma Information and
Technology School, opening in FY21, which is excluded from the above analysis. This new
LEA will not contract with a for-profit management company.
6. Comparing LEA Types
In Oklahoma, two charter LEAs with identical student enrollment counts and student need
profiles receive the same level of Foundation Aid funding, regardless of being a virtual or
non-virtual charter. Assuming all other revenues equal138 at these theoretical LEAs, if both
138 Assuming federal and philanthropic funds equal. Additionally, aside from Foundation Aid funding, there are two other state aid funds: Salary Incentive Aid (which
virtual and non-virtual LEAs receive) and Transportation Supplement Aid (which virtual LEAs do not receive and which some non-virtual charter and traditional LEAs
receive).
Figure 12: Estimated fees paid from virtual charters to for-profit partners for services in FY20. Per-pupil
calculation uses October 1 enrollment counts. Object codes 361 to 399 in OCAS report. Assumes
expenditures in these categories represent the total fees for services and supplies paid to the management
companies.

www.qualitycharters.org
49
Oklahoma Virtual Charter School Funding Study COMMISSIONED BY THE STATEWIDE VIRTUAL CHARTER SCHOOL BOARD
break even (or report net surplus of zero), the two LEAs should report identical per-pupil
expenditure figures. The thought is the same for traditional LEAs: funded through the same
Foundation Aid formula, final Foundation Aid funding for traditional LEAs accounts for the
incremental funding received through the local tax base revenues, with the goal of achieving
equitable total Foundation Aid and local funding for traditional LEAs.
In reality, however, no two LEAs are alike: they serve different students with different levels
of need, they receive different levels of non-state revenues, they qualify for different
components of the State formula139, they allocate resources differently, and they report
different levels of net surplus and loss. The remaining sections of this report attempt to
explain the differences between reported FY20 per-pupil expenditures at Oklahoma virtual
charter LEAs and their non-virtual counterparts. When comparing the averages of FY20 LEA-
reported expenditures by school type, virtual charter LEAs spent less per pupil compared to
both non-virtual charter LEAs and traditional LEAs, on average. The expenditures in this
analysis include those funded with all sources of funds, not just Foundation Aid funding.
Figure 13 shows average reported per-pupil expenditure by LEA type.
The above figure removes Epic One Virtual and Epic Blended Learning Center Charter from
the virtual charter LEA and non-virtual charter LEA categories, respectively, and shows the
two LEAs on a combined basis using total expenditures divided by total students across both
139 For example, small rural traditional LEAs can qualify for “isolation” and “small school” weights, which increase their total weighted ADM counts used in the
Foundation Aid formula. In FY20, no virtual LEAs received these incremental weights toward their weighted ADM counts.
Figure 13: FY20 LEA expenditure averages by school type, with functional expenditure area view.
• Virtual Charter LEA average excludes Epic One Virtual.
• Non-virtual Charter LEA average excludes Epic Blended Learning Center non-virtual charter and four
charter LEAs with District Code J for Juvenile and Delinquent.
• Traditional LEA average excludes Keyes District, which reported 13 students and was in its last year of
operation during FY20.
• Epic combined data point is calculated as Total Epic One Virtual and Epic Blended Learning Center non-
virtual charter expenditures divided by total students at both LEAs. See below for details.

www.qualitycharters.org
50
Oklahoma Virtual Charter School Funding Study COMMISSIONED BY THE STATEWIDE VIRTUAL CHARTER SCHOOL BOARD
LEAs. Epic One Virtual, the largest virtual charter LEA with 17,106 students (or 79 percent of
total virtual charter enrollment) in FY20 reports the highest virtual charter LEA per-pupil
spend.
At the same time, Epic Blended Learning Center, a related entity, is the largest non-virtual
charter LEA with 10,962 students (or 45 percent of total non-virtual charter enrollment) in
FY20 and reports the lowest non-virtual charter LEA per-pupil spend. Based on analysis of
per-pupil expenditures at both Epic LEAs, Epic Blended Learning Center, a non-virtual charter
LEA, reported significantly lower per-pupil expenditures than Epic One Virtual.
It appears that at least a portion of payroll for Epic Blended Learning Center was funneled
through Epic One Virtual.140 Because the extent to which Epic Blended Learning Center
expenditures may be included in Epic One Virtual ’s expenditures cannot be quantified given
the format of the data reported, the above figure shows the combined reported per-pupil
expenditures of both entities. This data point shows that on a combined basis, Epic LEAs’
reported expenditures per pupil were $6,350 in FY20 or 97 percent of the average reported
expenditures for virtual charter LEAs.
Per guidance from the SVCSB, for the purposes of the analysis comparing virtual charters to
non-virtual charter and traditional LEAs, these two entities are excluded from both the
virtual charter LEA category and from the non-virtual charter LEA category for data
consistency. A breakout of the two Epic LEAs’ reported per-pupil expenditures is included
below.
140 Certain personnel expenditures for Epic Blended Learning Center may have been included in Epic One Virtual’s reported expenditures for the purpose of
participation in the OK Teacher Retirement System for all Epic teachers.
Figure 14: FY20 reported expenditures, per pupil, using October 1 enrollment. Epic One Virtual Charter and
Epic Blended Learning Center, a non-virtual Charter LEA.

www.qualitycharters.org
51
Oklahoma Virtual Charter School Funding Study COMMISSIONED BY THE STATEWIDE VIRTUAL CHARTER SCHOOL BOARD
As stated, virtual charter LEAs spend less per pupil than non-virtual charter and traditional
LEAs, on average, but not all non-virtual LEAs spend more than virtual charter LEAs; there
are multiple individual non-virtual LEAs that have reported expenditures at similar levels to
virtual charter LEAs. While averages for groups of LEAs can facilitate comparison, it is
important to understand the level of variability in reported per-pupil expenditures within
each group as well. The following analysis explores the comparison of virtual charter LEA
expenditures to non-virtual charter and traditional LEAs in greater detail.
Comparing Virtual Charter LEAs to Non-Virtual Charter LEAs
In FY20, using October 1 enrollment, virtual charter LEAs reported a median per-pupil
expenditure of $6,702, which was $1,160 or 15 percent below the median for non-virtual
charter LEAs. Additionally, the average LEA per-pupil expenditures for virtual charter LEAs
was $6,539, which was $2,322 or 26 percent below that of non-virtual charter LEAs. Finally,
when looking at total per-pupil expenditures, virtual charter LEAs reported $6,632, which
was $1,787 or 22 percent lower per-pupil spend than non-virtual charter LEAs.
Figure 15: Comparison of Oklahoma virtual and non-virtual charter LEAs – FY20 expenditures by LEA, using
October 1 enrollment. Note: This data excludes Epic One Virtual Charter and Epic Blended Learning Center non-
virtual charter for data consistency. Data also excludes four charter LEAs with District Code J for Juvenile and
Delinquent.

www.qualitycharters.org
52
Oklahoma Virtual Charter School Funding Study COMMISSIONED BY THE STATEWIDE VIRTUAL CHARTER SCHOOL BOARD
Given the variability of reported LEA expenditures in both the virtual and non-virtual charter
LEA categories, it is helpful to use a “box plot” or “whisker plot,” showing quartile ranges,
averages, medians, and outliers for each group.
Figure 17 shows the box plot of Instructional and Student Support Expenditures on a per-
pupil basis for virtual charter LEAs (red) versus non-virtual charter LEAs (blue):
• Instruction & Instructional Staff: In this category of highest per-pupil spend, virtual
charter LEAs spend less than non-virtual charter LEAs. The average LEA expenditure
for non-virtual charter LEAs exceeds that of virtual charter LEAs by $783 per pupil or
17 percent. The median LEA expenditure for non-virtual charter LEAs exceeds that of
virtual charter LEAs by $95 or 2 percent.
Fourth Quartile
Third Quartile
Median
Minimum Value
Average
Outlier
First Quartile
Figure 16: Box plot comparison of Oklahoma virtual and non-virtual charter LEAs – FY20 expenditures by LEA, using
October 1 enrollment.

www.qualitycharters.org
53
Oklahoma Virtual Charter School Funding Study COMMISSIONED BY THE STATEWIDE VIRTUAL CHARTER SCHOOL BOARD
• Support Services – Students: Virtual charter LEAs spend substantially more than non-
virtual charter LEAs on student support services. The average LEA expenditure for
virtual charter LEAs exceeds that of non-virtual charter LEAs by $463 per pupil or 115
percent. The median LEA expenditure for virtual charter LEAs exceeds that of non-
virtual charter LEAs by $587 or 150 percent.
Figure 18 shows the box plot of Non-instructional and Non-student Support Expenditures on
a per-pupil basis for virtual charter LEAs (red) versus non-virtual charter LEAs (blue):
• General Administration: Spend is relatively similar for general administration when
comparing the two school types. The average LEA expenditure for non-virtual charter
LEAs exceeds that of virtual charter LEAs by $4 per pupil or 0 percent. The median
LEA expenditure for non-virtual charter LEAs is below that of virtual charter LEAs by
$36 or 10 percent.
• School Administration: Virtual charter LEAs spend significantly less than non-virtual
charter LEAs on school administration. The average LEA expenditure for non-virtual
charter LEAs exceeds that of virtual charter LEAs by $515 per pupil or 401 percent.
The median LEA expenditure for non-virtual charter LEAs exceeds that of virtual
charter LEAs by $543 or 1,534 percent.
• Business: Spend is relatively similar for business when comparing the two school
types. The average LEA expenditure for non-virtual charter LEAs exceeds that of
virtual charter LEAs by $48 per pupil or 10 percent. The median LEA expenditure for
non-virtual charter LEAs exceeds that of virtual charter LEAs by $3 or 1 percent.
Figure 17: Box plot comparison of Oklahoma virtual and non-virtual charter LEAs; FY20
expenditures by LEA, using October 1 enrollment. By function area. Instructional and
Student Support Expenditures per pupil.
Virtual Charter (red) vs. Non-Virtual Charter (blue)
Instructional and Student Support Expenditures Per Pupil Comparison

www.qualitycharters.org
54
Oklahoma Virtual Charter School Funding Study COMMISSIONED BY THE STATEWIDE VIRTUAL CHARTER SCHOOL BOARD
• Operations & Maintenance: Virtual charter LEAs spend significantly less than non-
virtual charter LEAs on operations and maintenance costs, driven by the fact that
virtual LEAs have no school buildings to maintain. The average LEA expenditure for
non-virtual charter LEAs exceeds that of virtual charter LEAs by $920 per pupil or
3,687 percent. The median LEA expenditure for non-virtual charter LEAs exceeds that
of virtual charter LEAs by $810 or 2,803 percent.
• Student Transportation: Virtual charter LEAs do not spend on student transportation.
The average and median LEA per-pupil expenditures for non-virtual charter LEAs in
FY20 was $46 and $10, respectively.
• Food Service: Virtual charter LEAs do not spend on food service. The average and
median LEA per-pupil expenditures for non-virtual charter LEAs on food service in
FY20 was $451 and $388, respectively.
• Enterprise Services: Virtual charter LEAs do not spend on enterprise services. Half of
the charter LEAs in this analysis spent in this area. The average and median LEA per-
pupil expenditure for non-virtual charter LEAs on enterprise services in FY20 was $19
and $1, respectively.
Virtual Charter (red) vs. Non-Virtual Charter (blue)
Non-Instructional, Non-Student Support Expenditures Per Pupil
Figure 18: Box plot comparison of Oklahoma virtual and non-virtual charter LEAs; FY20 expenditures by
LEA, using October 1 enrollment. By function area. Non-instructional and non-student support
expenditures per pupil.

www.qualitycharters.org
55
Oklahoma Virtual Charter School Funding Study COMMISSIONED BY THE STATEWIDE VIRTUAL CHARTER SCHOOL BOARD
The pie charts in Figure 19 below show average spend by school type and how FY20
reported expenditures by function area compare. Of note, on average, virtual charter LEAs
reported a higher percentage of total spend on instruction than non-virtual charters. Non-
virtual charters reported a combined 17 percent of total spend on Operations &
Maintenance, Student Transportation, Food Services, and Enterprise Operations, while
virtual charter LEAs reported 0 percent spend in these categories. As previously noted,
virtual LEAs do not receive incremental funding for transportation and food services, while
their non-virtual counterparts do.
Comparing Virtual Charter LEAs to Traditional LEAs
In FY20, using October 1 enrollment, virtual charter LEAs reported a median per pupil
expenditure of $6,702, which was $3,140 or 32 percent below the median for traditional
LEAs. Additionally, the average of LEA per-pupil expenditures for virtual charter LEAs was
$6,539, which was $4,165 or 39 percent below that of traditional LEAs. Finally, when looking
at total per-pupil expenditures for both school types, virtual charter LEAs reported $6,632,
which was $2,493 or 27 percent lower per-pupil spend than traditional LEAs. In other words,
in total per-pupil terms, Oklahoma virtual charter LEAs spend $0.73 for every $1 traditional
LEAs spend.
Figure 19: Oklahoma virtual charter LEAs vs. non-virtual charter LEAs average reported FY20 spend.
Proportion of total by function code. Same network exclusions as above analysis apply here.

www.qualitycharters.org
56
Oklahoma Virtual Charter School Funding Study COMMISSIONED BY THE STATEWIDE VIRTUAL CHARTER SCHOOL BOARD
Fourth Quartile
Third Quartile
Median
Minimum Value
Average
Outlier
First Quartile
Figure 21: Box plot comparison of Oklahoma virtual and traditional LEAs; FY20 expenditures by LEA, using October 1
enrollment.
Figure 20: Comparison of Oklahoma virtual and traditional LEAs; FY20 expenditures by LEA, using October 1
enrollment. Note: This data excludes Epic One Virtual (per reasons stated in previous sections) and Keyes District,
which reported 13 students and was in its last year of operation during FY20.

www.qualitycharters.org
57
Oklahoma Virtual Charter School Funding Study COMMISSIONED BY THE STATEWIDE VIRTUAL CHARTER SCHOOL BOARD
Figure 22 shows the box plot of Instructional and Student Support Expenditures on a per-
pupil basis for virtual charter LEAs (red) versus traditional LEAs (blue):
• Instruction & Instructional Staff: In this category of highest per-pupil spend, on
average, virtual charter LEAs spend less than traditional LEAs. The average LEA
expenditure for traditional LEAs exceeds that of virtual charter LEAs by $1,591 per
pupil or 35 percent. The median LEA expenditure for traditional LEAs exceeds that of
virtual charter LEAs by $848 or 17 percent.
• Support Services – Students: On average, virtual charter LEAs spend more than
traditional LEAs on student support services. The average LEA expenditure for virtual
charter LEAs exceeds that of traditional LEAs by $254 per pupil or 42 percent. The
median LEA expenditure for virtual charters exceeds that of traditional LEAs by $407
or 71 percent.
Virtual Charter (red) vs. Traditional (blue)
Instruction and Student Support Expenditures Per Pupil Comparison
Figure 22: Box plot comparison of Oklahoma virtual and traditional LEAs – FY20 expenditures by LEA, using
October 1 enrollment. By function area. Instructional and Student Support Expenditures per pupil.

www.qualitycharters.org
58
Oklahoma Virtual Charter School Funding Study COMMISSIONED BY THE STATEWIDE VIRTUAL CHARTER SCHOOL BOARD
Figure 23 shows the box plot of Non-instructional and Non-student Support Expenditures on
a per-pupil basis for virtual charter LEAs (red) versus traditional LEAs (blue):
• General Administration: On average, virtual charter LEAs spend less than traditional
LEAs on general administration. The average LEA expenditure for traditional LEAs
exceeds that of virtual charter LEAs by $178 per pupil or 42 percent. The median LEA
expenditure for traditional LEAs exceeds that of virtual charter LEAs by $80 or 21
percent.
• School Administration: Virtual charter LEAs spend substantially less than traditional
LEAs on school administration. The average LEA expenditure for traditional LEAs
exceeds that of virtual charter LEAs by $455 per pupil or 354 percent. The median
LEA expenditure for traditional LEAs exceeds that of virtual charter LEAs by $525 or
1,483 percent.
• Business: On average, virtual charters outspend traditional LEAs on business
expenditures. The average LEA expenditure for virtual charters exceeds that of
traditional LEAs by $157 per pupil or 44 percent. The median LEA expenditure for
virtual charters exceeds that of traditional LEAs by $94 per pupil or 32 percent.
• Operations & Maintenance: Virtual charter LEAs spend significantly less than
traditional LEAs on operations and maintenance costs, driven by the fact that virtual
LEAs have no school buildings to maintain. The average expenditure for traditional
LEAs exceeds that of virtual charter LEAs by $1,256 per pupil or 5,031 percent. The
median LEA expenditure for traditional LEAs exceeds that of virtual charter LEAs by
$1,036 or 3,586 percent.
• Student Transportation: Virtual charter LEAs do not spend on student transportation.
The average and median LEA per-pupil expenditure for traditional LEAs in FY20 was
$293 and $263, respectively.
• Food Service: Virtual charter LEAs do not spend on food service. The average and
median LEA per-pupil expenditure for traditional LEAs on food service in FY20 was
$679 and $622, respectively.
• Enterprise Services: Virtual charter LEAs do not spend on enterprise services. The
average and median LEA per-pupil expenditure for traditional LEAs on enterprise
services in FY20 was $124 and $115, respectively.

www.qualitycharters.org
59
Oklahoma Virtual Charter School Funding Study COMMISSIONED BY THE STATEWIDE VIRTUAL CHARTER SCHOOL BOARD
The pie charts in Figure 24 below show average spend by school type and how FY20
reported expenditures by function area compare. Of note, on average, virtual charter LEAs
reported a higher percentage of total spend on instruction than traditional LEAs: 70 percent
for virtual charters compared to 58 percent for traditional LEAs. This is in part due to
traditional LEAs reporting a combined 22 percent of total spend on Operations &
Maintenance, Student Transportation, Food Services, and Enterprise Operations, while
virtual charter LEAs reported 0 percent spend in these combined categories. As previously
noted, virtual LEAs do not receive incremental funding for transportation and food services
while their non-virtual counterparts do.
Figure 24: Oklahoma virtual charter LEAs vs. traditional LEAs average reported FY20 spend. Proportion of total
by function code. Same network exclusions as above analysis apply here.
Virtual Charter (red) vs. Traditional (blue)
Non-Instruction, Non-Student Support Expenditures Per Pupil Comparison
Figure 23: Box plot comparison of Oklahoma virtual and traditional LEAs; FY20 expenditures by LEA, using October 1
enrollment. By function area. Non-instructional and non-student support expenditures per pupil.

www.qualitycharters.org
60
Oklahoma Virtual Charter School Funding Study COMMISSIONED BY THE STATEWIDE VIRTUAL CHARTER SCHOOL BOARD
Section 5: Discussion and Recommendations
Based on the above Research and analysis, NACSA and Afton offer the following recommendations,
as further described below, organized into two parts.
The first part of this section examines the primary ways that states differ in how they fund virtual
charter schools and provides recommendations for how Oklahoma can strengthen the way it funds
virtual charter schools based on the Research and context included in Sections 1-4 of this report.
The different approaches we examine are:
• Adjusting how students are counted for funding purposes;
• Capping the percentage of state aid a virtual charter school may receive;
• Using funding as incentives or conditions for virtual charter schools; and
• Adopting a completion-based funding model.
We also include an assessment of implementation considerations for each approach, including any
possible impact on Oklahoma’s current school funding and taxation structures.
The second part of this section focuses on how Oklahoma can improve the fiscal and operational
transparency of the for-profit management companies contracting with Oklahoma’s virtual charter
schools based on our Real Costs Analysis included in Section 4 of this report.
Based on this Research and analysis, and as further described below, we recommend that
Oklahoma:
• Consider counting ADM throughout the entire year for virtual charter schools, which have
high levels of student mobility.
• Develop a system to effectively monitor and track schools’ adherence to the attendance
policy requirements adopted in 2020141, ensuring that students not actively engaged in
instructional activities are removed from the enrollment count.142
• Define “recurrent enrollment” as set forth in Section 135 of Oklahoma’s charter school law to
develop a better and more formalized means of tracking student mobility in Oklahoma
virtual charter schools.
• Not cap the amount of funding virtual charter schools receive at this time given the state’s
already low per-pupil spend and the lack of an adequacy study to support this change.
• Further explore making a portion of state funding conditional on fulfillment of certain
academic thresholds or spending in certain categories associated with student instruction
and learning.
• Further explore using a completion-based approach to fund its virtual charter schools; and
141 New attendance policy requirements for virtual charter schools were passed in 2020 as part of Oklahoma HB2905. See 70 OS §3-145.8. 142 In doing so, Oklahoma should also further examine the impact and potential unintended consequences of this new attendance policy on those virtual charter
schools serving alternative student populations.

www.qualitycharters.org
61
Oklahoma Virtual Charter School Funding Study COMMISSIONED BY THE STATEWIDE VIRTUAL CHARTER SCHOOL BOARD
• Strengthen reporting and disclosure requirements and make further adjustments to the
OCAS to increase fiscal transparency around for-profit management company spending on
staffing and compensation.
These recommendations are designed to support a funding system in Oklahoma that:
• Provides a more accurate count of the number of students a virtual charter school educates;
• Uses funding as a means to incentivize student learning; and
• Provides greater transparency regarding how for-profit management companies spend
public dollars.
The recommendations are aligned with and support the goals of Oklahoma’s charter school law,
whose purpose, among others, is to improve student learning and establish new forms of
accountability; and Oklahoma’s state aid law, which seeks to provide the best possible educational
opportunities for every child in Oklahoma, to have a more beneficial use of public funds expended
for education, and to continually improve the public schools of Oklahoma.143
Approaches and Recommendations for Funding Virtual Charter
Schools
Variations in How Students are Counted
How Oklahoma Currently Counts Students: Oklahoma uses an ADM method to count pupils for the
purposes of state funding. ADM is measured over the first nine weeks to establish the enrollment
count for the school year. The prior school year’s year-end ADM count is used to estimate initial aid
payments for the current year. Final aid calculation is made in December using the highest ADM
count of the current year’s ADM count over the first nine weeks or the year-end ADM count over the
past two years. Except for virtual charter schools experiencing significant drops in enrollment
(greater than 15%), the current year’s count must be used.144
How Other States Count Students: There are three typical ways in which states count pupils for state
aid purposes. Some states use a single- or double-day count, counting actual enrollment on one or
two specific days of the school year; some states count average daily attendance (ADA), counting the
actual days students are in school, not just enrolled; most states, like Oklahoma, use ADM.
Within the ADM method, states differ on the duration of the count period: Some, like Oklahoma,
count only the first few weeks of the year; some count the start of both the spring and the fall; and
some count the entire year. In Minnesota, for example, ADM is defined as “Average daily
membership equals the sum for all pupils of the number of days of the school year each pupil is
enrolled in the district's schools divided by the number of days the schools are in session or are
providing e-learning days due to inclement weather.”145
143 70 O.S. §3-130 and 70 O.S. §18-101. 144 70 O.S. §18-201.1(B). Legislation enacted in 2021 will change this calculation beginning in the 2022-23 school year. Under the new law, initial aid allocation will be
based on the weighted ADM from the prior school year, rather than the highest weighted ADM over the previous two preceding years. Final aid allocation will be based
on the higher of the current year’s nine-week ADM count or the prior year’s final ADM count, rather than the highest of the current year’s nine-week ADM or two
preceding years final ADM. 2021 Okla. Sess. Laws ch. 5, §1. 145 Minn. Stat. §126C.05(8)

www.qualitycharters.org
62
Oklahoma Virtual Charter School Funding Study COMMISSIONED BY THE STATEWIDE VIRTUAL CHARTER SCHOOL BOARD
Although examples in this area are limited, one state does count virtual charter school students
differently for school funding purposes than students attending non-virtual schools. In Arizona, all
virtual instruction is funded through a separate funding formula, which converts “student
instructional activity” to ADA. This ADA count is based on the full year, whereas Arizona’s ADM count
for its non-virtual students is based on the first 100 or 200 days of the school year.
Recommendations for Oklahoma: Oklahoma should continue to use an ADM method for counting
pupils. However, it should consider counting ADM throughout the entire year for virtual charter
schools. This would provide a more accurate pupil count for virtual charter schools, which have high
levels of student mobility.
ADM is the recommended method of counting pupils since it provides a more accurate count than a
single/double day count, which risks overcounting students who have dropped enrollment but is
more equitable than ADA, which tends to undercount high-needs students who are more likely to
have higher absentee rates.
Within the ADM method, counting ADM throughout the entire year (rather than the first nine weeks
of the school year) ensures that students who disenroll from a course or late enroll are factored into
the aid count. This is especially important for virtual charter schools, which tend to have higher
student turnover and mobility throughout the year. Under this method, a state would initially fund
schools based on the actual ADM count from the prior year, then correct the ADM count either
throughout the year, based on the current ADM count, or at the end of the year, based on the final
ADM count.
Additionally, Oklahoma can improve the accuracy of counting virtual charter school pupils by
implementing and operationalizing two recently enacted statutes. First, Oklahoma should develop a
system to effectively monitor and track schools’ adherence to the attendance policy requirements
adopted in 2020146, ensuring that students not actively engaged in instructional activities are
removed from the enrollment count.147 This monitoring system should be jointly developed by the
Oklahoma State Department of Education, as the agency responsible for calculating enrollment
counts, and the SVCSB, as the agency broadly responsible for virtual charter school oversight.
Next, the Oklahoma Department of Education should define “recurrent enrollment” as set forth in
Section 135 of Oklahoma’s charter school law to develop a better and more formalized means of
tracking student mobility in Oklahoma virtual charter schools.
Implementation Considerations for Oklahoma: Modifying how ADM is calculated for virtual charter
schools would not require the creation of new data and reporting system since it would only extend
the range of school days included in the aid count. However, using two different methods to count
pupils—one for virtual charter schools and the other for traditional public and brick-and-mortar
charter schools—may pose certain challenges if they are interrelated or rely on each other for final
aid calculations.
For example, if the ADM count for virtual charter schools is higher at the end of a school year, the
state will need to provide additional funding to the virtual charter school. Conversely, if ADM count
146 New attendance policy requirements for virtual charter schools were passed in 2020 as part of Oklahoma HB2905. 147 In doing so, Oklahoma should also further examine the impact and potential unintended consequences of this new attendance policy on those virtual charter
schools serving alternative student populations.

www.qualitycharters.org
63
Oklahoma Virtual Charter School Funding Study COMMISSIONED BY THE STATEWIDE VIRTUAL CHARTER SCHOOL BOARD
for virtual charter schools is lower at the end of the school year, the state will need to determine
where any excess funds should be directed.
Since this approach focuses on an adjustment to how ADM is calculated for virtual charter schools
rather than the underlying funding formula, we do not anticipate a large impact on Oklahoma’s
taxation structure. However, as referenced above, it is possible that additional funding would be
needed if virtual charter schools ADM count is higher at the end of a school year. As such, further
analysis should be completed to confirm that changes to how ADM is calculated for virtual schools,
as described above, would not cause any material impact on Oklahoma’s taxation structure.
Capping the Percentage of State Aid a Virtual Charter School May Receive
Oklahoma’s Current Use of This Approach: Virtual charter schools in Oklahoma are funded through
the same funding formula as their non-virtual (traditional and charter) school counterparts. This
funding is not capped or set at a lower threshold than their non-virtual counterparts. However,
virtual charter schools do not benefit from certain funding categories, which impacts their weighted
ADM, and do not receive Transportation Supplemental Aid because they do not provide
transportation services.148
Other States’ Use of This Approach: While many states use the same or a similar funding formula to
fund virtual charter schools as brick-and-mortar charter schools, some states cap the amount of per-
pupil funding that a virtual charter school can receive by a certain statutorily defined percentage. For
example, in Indiana, students attending full-time virtual charter schools are funded at 85 percent of
the “foundation” funding amount for which they would otherwise be eligible. In Arizona, students
enrolled full-time in virtual instruction are funded at 95 percent of the base support level amount.
In the limited research in this area, the rationale often cited for capping the amount virtual charter
schools receive is that virtual charter schools do not incur expenses or the same level of expenses
for facilities, transportation, food services, maintenance, and operations. However, other reports
also note areas in which virtual charter schools spend more than their traditional counterparts, such
as instructional technology, professional development, and other IT-related costs.149 It is also
important to note that we did not find any research that supported or outlined how states that do
cap the amount virtual charter schools receive arrived at the percentages set forth in statute.
Recommendations for Oklahoma: We do not recommend capping the amount of funding virtual
charter schools in Oklahoma receive at this time for two reasons. First, Oklahoma’s current average
per-pupil spend on education is already one of the lowest in the country. Oklahoma tied for third-
lowest in the country in 2018 based on the Annual Survey of School System Finances.150
Second, any cap on funding should be preconditioned on the completion of an adequacy study,
which has not yet been done in Oklahoma. An “adequacy” study would determine whether the
current level of funding is sufficient for virtual charter schools to provide an “adequate level of
148 However, in the rare instance a virtual charter school does provide transportation services, it can receive Transportation Supplemental Aid if it has a written
transportation plan approved by the SVCSB. OAS 777:10-5-3. 149 Creating Sound Policy for Digital Learning; A Working Paper Series from the Thomas B. Fordham Institute, Thomas B. Fordham Institute, 2012 and Patrick, S., Myers,
J., Silverstein, J., Brown, A., Watson, J.,
Performance-based Funding & Online Learning: Maximizing Resources for Student Success,
International Association for K–12 Online Learning, 2015. 150 See Annual Survey of School System Finances, 2018, available at https://www.census.gov/programs-surveys/school-finances.html.

www.qualitycharters.org
64
Oklahoma Virtual Charter School Funding Study COMMISSIONED BY THE STATEWIDE VIRTUAL CHARTER SCHOOL BOARD
education” for its students. In contrast to the Real Costs Analysis in section 4 of this report, which
analyzes historical actual expenditures, an adequacy study would examine and identify the costs
that a virtual charter school must incur or the resources a virtual charter school must allocate to
provide an adequate level of education to its students.
An adequacy study was not part of the scope of this work given the complexities of completing such
a study and the limitations of the available data (see also our recommendations regarding fiscal
transparency below). However, if Oklahoma is interested in this approach, then an adequacy study
would be a critical next step because any cap should be based on what it costs to “adequately”
educate a student in a particular environment rather than perceived differences between
educational models.
Implementation Considerations for Oklahoma: Since this is not a recommended approach,
implementation considerations will not be addressed.
Conditional Funding or Incentives for Virtual Charter Schools
Oklahoma’s Current Use of This Approach: Oklahoma does not currently use conditional funding or
incentives for virtual charter schools.
Other States’ Use of This Approach: Although not common, a few states provide funding incentives
or condition funding for virtual charter schools, with the aim of ensuring that virtual charter schools
either provide specific services or meet certain academic or spending thresholds. In Georgia, virtual
charter schools are generally not eligible for the state-provided local revenue supplement. However,
they can receive 25 percent of this supplement amount if they provide their students with required
technology.151 In California, funding for non-classroom-based schools, which include virtual charter
schools, is structured to incentivize academic outcomes and spending in certain categories
associated with student learning. Under this approach, virtual charter schools only receive 70
percent of the LCFF, the state’s funding formula, unless the California State Board of Education
determines that an adjustment to the full LCFF amount is warranted. For virtual charter schools to
receive the full LCFF, they must either exceed an academic threshold or meet certain instructional
expenditure and operational standards.152 Since 2010, 529 schools have participated in 1,008
funding determination hearings: in 95 percent of cases, the non-classroom-based charter school has
received full funding after meeting expenditure or performance requirements.153
Recommendations for Oklahoma: Oklahoma should further explore a funding approach for its
virtual charter schools that would tie a portion of state funding to meeting certain academic
thresholds or spending in certain categories associated with student instruction and learning. This
approach could promote student learning by aligning funding with student outcomes. It could also
increase transparency and promote student learning by aligning funding with spending in certain
student- and instructional-focused areas.
151 Ga. Code §20-2-2068.1(d)(C) 152 5 CCR §11963.5. To meet the academic threshold, a virtual charter school must rank in at least the 80th percentile in either the statewide or ‘similar schools’
performance rankings and at least the 60th percentile in the other ranking. If the virtual charter school does not meet this academic threshold, it may still receive full
LCFF by meeting operational thresholds, such as student-teacher ratios and minimum spending on direct instructional expenses. 153 California adopted this funding model in 2005: data on funding determination decisions is available from 2010. See California Department of Education, Non-
classroom-based funding determination requests, available at https://www.cde.ca.gov/sp/ch/nclrbifunddet.asp.
www.qualitycharters.org
65
Oklahoma Virtual Charter School Funding Study COMMISSIONED BY THE STATEWIDE VIRTUAL CHARTER SCHOOL BOARD
Implementation Considerations for Oklahoma: To implement this type of funding incentive,
Oklahoma should further study the model implemented by California and what impact it has had on
student outcomes. If Oklahoma wished to proceed with an approach similar to California, it would
need to determine the nature of the academic or spending incentives it wishes to tie to this
holdback.
For example, Oklahoma could take advantage of the existing OCAS and tie receipt of a specific
amount of funding to virtual schools spending in certain cost categories that are directly related to
student instruction. Then, the state would need to determine the amount it wishes to hold back as
an incentive and the process for verifying that a virtual charter school has met the requirements for
receipt of the held-back funds. Oklahoma would also need to determine what rights, if any, virtual
charter schools would have to dispute the state’s determination regarding receipt of these funds.
Lastly, it is possible that some virtual charter schools will not meet the requirements for receipt of
the full funding and, as a result, Oklahoma would also need to consider what happens to those
funds (i.e., are they returned to the state’s general fund or are they repurposed). If the incentive is
structured as a holdback, it would not require any additional funds. Therefore, we do not anticipate
a large impact on Oklahoma’s taxation structure. However, further analysis should be completed to
confirm that adding such a holdback, as described above, would not cause any material impact on
Oklahoma’s taxation structure.
Completion-based Funding Formulas
Oklahoma’s Current Use of This Approach: Oklahoma does not currently employ any completion-
based funding methods.
Other States’ Use of This Approach: Only two states, Florida and New Hampshire, exclusively use a
completion-based method to fund their full-time virtual charter schools. However, an increasing
number of states are using a completion-based approach to fund students who enroll part-time in
online courses.
Florida was the first state to adopt a completion-based funding system for its virtual charter
schools.154 While virtual charter schools are funded through the same funding formula as brick-and-
mortar charter schools, a “full time equivalent” count is only earned if the student successfully
completes the course. So, funding for virtual charter schools in Florida is all-or-nothing: if a student
does not successfully complete a course, then no “full-time equivalent” is earned and no funding is
allocated.
This model is often described as “high-stakes” completion funding, since funding is “all or nothing”
depending on whether the student completes the course. The virtual school is not eligible for any
funding if the student completes a portion of the course but does not satisfactorily complete the
course by earning a letter grade of “D” or better.
New Hampshire has one virtual charter school, the VLACS, and the state funds this charter school
based on coursework completions rather than enrollment count. Rather than using ADM for pupil
154 Patrick, S., Myers, J., Silverstein, J., Brown, A., Watson, J.,
Performance-based Funding & Online Learning: Maximizing Resources for Student Success,
International Association for K–12 Online Learning, 2015.

www.qualitycharters.org
66
Oklahoma Virtual Charter School Funding Study COMMISSIONED BY THE STATEWIDE VIRTUAL CHARTER SCHOOL BOARD
counts, as the state does for the rest of public schools in the state, coursework completions are
converted to membership for funding purposes. This funding model has been described as “low-
stakes” completion funding because funding is not “all or nothing” depending on course completion.
VLACS receives revenue based on the portion of coursework a student completes, so it may receive
a portion of the full per-pupil amount even if the student does not complete the course.
Other states permit or use completion-based funding in other more limited instances. For example,
in Texas, virtual school funding is dependent on the student successfully completing the electronic
course, though when a student has “completed” a course is solely determined by the virtual charter
school. Utah now uses a completion-based funding system for high school students who participate
in part-time virtual learning courses, and some of Utah’s virtual charter schools participate in this
program. Minnesota has also adopted a completion-based funding system for students participating
in supplemental online courses.
It is important to note that there has been minimal, if any, formal research done on the impact of
completion-based funding systems on school outcomes. Across multiple interviews, we heard
anecdotal information that completion-based funding had positive impacts on student completions
and student performance. However, we could not locate nor were those we interviewed aware of
robust research on the impact of completion-based funding models.155
Recommendations for Oklahoma: Oklahoma should further explore using a completion-based
approach to fund its virtual charter schools. Given the historical academic underperformance of
Oklahoma’s virtual charter schools when compared to traditional public schools and brick-and-
mortar charter schools, a completion-based funding approach offers a way to promote student
learning by aligning funding with student outcomes. However, it is important to note that while a
funding methodology can incent student outcomes, it does not and should not replace the need for
strong accountability systems that set a high bar for entry, proactively monitor for compliance with
existing law, and close low-performing schools.
While we believe that this funding approach has the potential to support improved student
outcomes for Oklahoma’s virtual charter schools, it does represent an entirely new way of funding
virtual schools in Oklahoma and is not yet supported with robust research on the impact of this
funding approach on student outcomes. Consequently, we recommend that Oklahoma undertake
research, in partnership with other stakeholders, on the impact of this funding approach on student
outcomes and course completion rates. Oklahoma should convene a group of states to jointly solicit
and/or support this research. This research should be able to draw upon robust historical data from
New Hampshire and Florida, and possibly some more limited data from the other states referenced
above.
Next, we recommend that Oklahoma convene a working group to explore the implementation
considerations, as outlined below, associated with adopting and transitioning to a completion-based
funding system. The findings of this working group would help Oklahoma better assess how this
type of system could be structured in its local context and the steps that Oklahoma would need to
take prior to fully adopting a completion-based funding system. This working group could include
155 A 2016 article, Has New Hampshire found the secret to online education that works?, highlights the performance of VLACS noting that “on average, the school’s full-
time students typically equal or modestly exceed New Hampshire average scores on state reading and math tests, as well as on the SAT.” However, no source or related
study is cited within the article to further explore this finding.

www.qualitycharters.org
67
Oklahoma Virtual Charter School Funding Study COMMISSIONED BY THE STATEWIDE VIRTUAL CHARTER SCHOOL BOARD
representatives from states that currently use completion-based funding (both representatives from
the oversight bodies, as well as local school operators), local virtual charter school representatives
(both operators and teachers), and individuals from the SVCSB and the Oklahoma Department of
Education.
Implementation Considerations for Oklahoma: Prior to deciding to adopt a completion-based
funding system, Oklahoma should further examine the following implementation considerations:
Defining Completion: Oklahoma could take either a “high-stakes” or “low stakes” approach, as
referenced above, in defining how “completion” will be measured for funding purposes. As
described above, “high stakes” completion-based funding defines completion as receiving a passing
grade in a course and only provides funding for those students who successfully pass the given
course within a period of time, whereas a “low-stakes” approach ties payment to the portion of
assignments completed for a given course. Even within a system that permits “partial” payments, the
degree of partial payments still needs to be determined (i.e., a sliding scale or fixed cut-off points).
Also, to the extent end-of-course (EOC) assessments exist for certain courses, completion could also
be tied these assessments. However, given that EOC assessments are not available for all courses,
this variation in how completion is measured could make implementation of this system more
complex.
Time Limits: Oklahoma would also need to decide how long a student would have to “complete” the
course for funding purposes. Some states do not place a time limit on completion or do include a
time limit that provides ample flexibility, allowing a virtual charter school to receive funding
whenever a student completes a course, whether it is more quickly (if a student completes courses
at a faster pace than a traditional school schedule) or over a longer period of time. Providing this
funding flexibility aligns with the self-paced nature of most virtual learning programs.
Per-course Funding Rate: Regarding the per course funding rate, both Florida and New Hampshire
assume a base amount that a school would otherwise receive (based on the state’s funding formula)
and then divide that amount by the number of courses a student would need to take to be
considered FTE. Student weights are incorporated into this FTE calculation.
Timing of Payments: The timing of payments would also need to be considered. Virtual charter
schools could be paid on the same schedule as its non-virtual counterparts, with initial payments
being based on the prior school year’s data and with reconciliations occurring both at mid-year and
at the end of the school year.
Oversight: Another critical implementation consideration is how oversight would be structured. In
both Florida and New Hampshire, the completion-based funding is provided based on data reported
by the virtual charter school. Self-reported data presents some inherent challenges, but these
challenges can be at least partially addressed by requiring periodic audits of this data. However,
developing systems to audit student-level completion data is complex and would be resource-
intensive.
Transition: The transition plan could include a pilot program with a subset of virtual charter schools
or with a certain grade range to test-drive the new approach and better understand its likely impact.
Oklahoma could also consider a phased-in implementation plan based on a sliding scale that would

www.qualitycharters.org
68
Oklahoma Virtual Charter School Funding Study COMMISSIONED BY THE STATEWIDE VIRTUAL CHARTER SCHOOL BOARD
initially provide all schools with a guaranteed base amount and then a certain percentage that
would be based on completion. The guaranteed base amount would decrease over a certain period
of years and the percentage of funding tied to completion would increase, until full funding would
be based solely on completion.
Another approach would be to institute a “hold harmless” period whereby virtual charter schools
would continue to be funded based on the existing weighted ADM system, but the schools would
report completion rates and the state would provide the virtual charter schools with an accounting
of the funding they would receive under a completion-based system. This would provide virtual
charter schools with information on what funding would look like under this new system for
planning purposes while providing schools with the predictability of the current funding system for a
period of time before making the full transition to a completion-based approach.
Tax System and Possible Surplus: It is difficult to predict what impact, if any, a completion-based
funding system would have on Oklahoma’s tax structure without a better sense of how this system
would be structured in Oklahoma. Given that each student who enrolls in a virtual charter school is
unlikely to have a 100 percent completion rate, a completion-based funding system should not
require any additional funds. In fact, it may result in excess funds and Oklahoma would need to
consider what happens to those funds (i.e., are they returned to the state’s general fund or are they
repurposed in some other way?).
However, it is possible, that some students may progress more quickly and complete more than a
traditional full-time student’s course load over a given year (unless the completion-rate is capped at
100 percent). If so, it is possible that additional funding would be needed for virtual charter schools.
So, while we do not anticipate a large impact on Oklahoma’s taxation structure, further analysis
should be completed to confirm that a completion-based approach would not cause any material
impact on this system.
Fiscal and Operational Transparency Recommendations
Based on our Real Costs Analysis, included in Section 4 of this report, this next set of
recommendations focuses on strengthening the fiscal and operational transparency of for-profit
management companies contracting with Oklahoma’s virtual charter schools.
Our Real Costs Analysis highlighted a lack of fiscal and operational transparency among those virtual
charter schools that contract with for-profit management companies. In FY20, each of the five virtual
charter schools in Oklahoma contracted with a for-profit management company for comprehensive
school management services. This lack of transparency is due to the school/vendor contractual
relationship between the parties and the fact that, as private entities, management companies are
not subject to the same financial and operational reporting requirements as traditional LEAs and
charter schools (that do not contract with a for-profit management company).
For example, while traditional LEAs in Oklahoma reported 78 percent of their total FY20
expenditures as personnel costs (which is typical given that most LEA expenditures are personnel
related), four of the five virtual charter LEAs reported $0 in salaries and benefits. These four virtual
LEAs have no paid employees as each of them contracts with a for-profit management company,

www.qualitycharters.org
69
Oklahoma Virtual Charter School Funding Study COMMISSIONED BY THE STATEWIDE VIRTUAL CHARTER SCHOOL BOARD
which is responsible for employing and paying all school personnel. Without more detailed financial
and operational expenditure data, it is difficult to understand and compare actual resource
allocation and ascertain exactly how public funds are spent on students under current reporting
requirements.
Given the historical academic underperformance of virtual charter schools in Oklahoma, this staffing
and compensation data is critical to gaining insights into virtual charter school staffing structures,
compensation systems, and student-to-teacher ratios. Oklahoma can already track this information
for all other public schools (both traditional and charter, excepting only those charter schools that
contract with a for-profit management company). Oklahoma should also be able to track this same
information for virtual charter schools that contract with for-profit management companies.
It is important to acknowledge that Oklahoma has made progress in this area. In 2019, Oklahoma
passed HB1395, which subjects virtual charter schools to the same “reporting requirements,
financial audits, audit procedures, and audit requirements” as school districts. Oklahoma should
build on this progress by adopting the following additional policies that support fiscal and
operational transparency on staffing expenditures.
Use of the Annual Accountability Report
A primary source of school staffing and compensation data in Oklahoma is the Annual
Accountability Report, which provides comprehensive information on how each school allocates its
resources in these and other areas. These Accountability Reports allow the reader to understand
how schools are staffed and how school employees are compensated. Specifically, related to
staffing, these reports show: average teacher salary; percentage of teachers with advanced degrees;
average years of experience; administrator salaries; student-to-staff ratios; and FTE data for non-
special education teachers, special education teachers, counselors, other professional staff, and
administrators. This staffing data is available for almost every school in Oklahoma except for the
four virtual charter LEAs referenced above. However, we understand that this data is provided to the
Oklahoma State Department of Education but not currently published.
Recommendation: Confirm that the Oklahoma Department of Education receives staffing data from
virtual charter schools and, if so, require the Department to verify and publish this data in the
Accountability Reports for virtual charter schools that contract with for-profit management
companies. Publishing this data promotes equity and fiscal transparency.
Strengthening OCAS to Capture Better Data on Virtual Charter Schools
The OCAS includes robust staffing and compensation expenditure data for all public schools.
However, the level of detail required by schools contracting with for-profit management companies
and the consistency of how such data is reported across OCAS could be significantly strengthened to
provide greater fiscal transparency and to better understand how for-profit management
companies are using public funds to support the students they serve.
First, while the LEA expenditures associated with management company payments are reported
through OCAS, most of the expenditures at four of the five virtual charter LEAs are in the form
“purchased services,” likely representing the payments to their respective management companies.
While OCAS object codes 360-399 are intended to only represent LEA payments to management

www.qualitycharters.org
70
Oklahoma Virtual Charter School Funding Study COMMISSIONED BY THE STATEWIDE VIRTUAL CHARTER SCHOOL BOARD
companies, upon review of FY20 expenditure data, one or more virtual LEAs may also be including
payments to other vendors. As a result, these payments to for-profit management companies
cannot be easily quantified and separated from payments to other vendors for contracted
purchased services in OCAS.
Recommendation: Oklahoma should adjust OCAS to require annual expenditure data that only
represents virtual charter school payments to their respective for-profit management companies.
The total expenditures in this additional report should align with invoices received by the virtual
charter LEA from its for-profit management company.
Second, based on existing OCAS data on virtual charter LEAs, it is unclear if virtual charter LEAs are
allocating resources differently or if they are allocating resources similarly but coding them
differently in OCAS. This lack of clarity makes reviewing, comparing, and monitoring such
expenditure data challenging. Taking the OCAS Instructional (function code 1000) as an example, we
presume Certified Purchased Service Salaries (object code 361) and Non-certified Purchased Service
Salaries (object code 363) are intended to codify the contracted service payment going toward
payment of vendor’s staff and that these object codes likely include salary, stipends, bonuses, and
employee benefits.
However, this is not entirely clear based on current OCAS guidance. We also see a variety of ways in
which LEAs are reporting data within the Instructional (function code 1000), as well. For example,
one LEA coded $0 to Certified and Non-certified Purchased Service Salaries (object codes 361 and
363) and most of its expenditures to Management Services (object code 366), while other LEAs show
the opposite.
Recommendation: To strive for more consistent data reporting, Oklahoma should develop
additional OCAS object codes to provide greater fiscal transparency around for-profit management
company spending on staffing and compensation. These additional OCAS object codes should be
accompanied by specific guidance regarding how fees paid to management companies and their
corresponding expenditures, especially surrounding staffing and compensation, should be coded.
Submitted reports should be reviewed to ensure accurate and consistent reporting of expenditures.
Lastly, regarding OCAS, our Real Costs Analysis found that LEAs might have been reporting
expenditures that were not associated with their LEAs. It appears that at least a portion of payroll for
Epic Blended Learning Center was funneled through Epic One Virtual, resulting in artificially inflated
expenditures at Epic One Virtual and artificially deflated expenditures at Epic Blended Learning
Center. Certain personnel expenditures for Epic Blended Learning Center may have been included in
Epic One Virtual’s reported expenditures for the purpose of participation in the Oklahoma Teacher
Retirement System for all Epic teachers.
Recommendation: Oklahoma should ensure that virtual charter LEAs only report expenditures
associated with their virtual charter LEA, and that staff and students from a given virtual charter LEA
are coded to the appropriate reported entity.

OKLAHOMA COLORADO INDIANA GEORGIA OHIO
Pupil Count ADM (first nine weeks) Single day Double day Double day ADM (three reporting periods)
State Formula
Foundation Aid: annual foundation factor
multiplied by "weighted ADM" (four weighting
categories), less an amount based on local tax
contribution
Host district's "attributable per-pupil aid"
Basic Tuition Support: enrollment multiplied by statute-established
categorical amounts
Quality Basic Education: universal base amount,
established as the "minimum cost of providing a high school course," then modified for 18
different educational programs; school enrollment count for each category then
multiplied by program amount
Seven formulas: a basic foundation amount, then six categorical formulas; charter
school students are included in home district's count, then
state reduces and redirects aid directly to charter schools
Charter Modifications
Since no local funding, no deduction from foundation
aid amountNo
Yes: supplemental charter per-pupil grant ($750 for FY21)
No
Since charter schools do not receive local funds, their state aid calculation is not reduced
by a 'local contribution' amount
Virtual-specific Provisions
Virtual charter schools are typically not eligible for transportation aid and
limits to use of prior year ADM counts.
State has two categories of virtual schools, which differ
based on authorizer. Funding method differs on charter type: "multi-district" virtual charter schools are funded
through flat statute-established per-pupil amount.
Students receiving more than 50 percent of instruction virtually, regardless of school type, are
funded at 85 percent of the basic tuition support amount.
Virtual charter schools receive only 2/3 QBE amount, though that can be increased by any amount up to full amount at
the discretion of the Department of Education. Virtual charter schools are
typically ineligible for supplemental grants to replace local funds; however they are eligible for 25 percent of the
amount if they provide students' required technology.
Virtual charter schools are only eligible for three of the seven
funding formulas. Charter schools are subject to periodic "full-time equivalent" student
enrollment audits; virtual charter schools must verify
student engagement in remote learning as part of these
reviews.
No
Appendix A
PENNSYLVANIA
ADM (full year)
Charter schools receive per-pupil funding directly from
student's home district; amount is based on district's "budgeted
total expenditure per ADM" minus expenditures in certain
categories (e.g., transportation; facilities)
State aid flows through student's home district; charters
funded by separate formula

MINNESOTA ARIZONA UTAH NEW HAMPSHIRE FLORIDA CALIFORNIA TEXAS
Pupil Count ADM (full year) ADM (100/200 day average)ADM (full year, based on
course hours)ADM ADM ADA (full year) ADA + course completion
State Formula
General Education Revenue: eight formula
amounts, each multiplied by varying weighted ADM
counts
Base Support Level: statutory base amount is established, then various weights are applied based
on student and educational program; school's
enrollment then multiplied by weighted per-pupil
amounts
Based on per-pupil count, weighted for three factors
(grade span, special classification, district sparsity);
additional program-specific state aid formulas
Adequate Education: per-pupil base formula, plus supplemental
category formulas
Florida Education Funding Program: base formula, then weights
and supplements based on local circumstances, grade level, and student
characteristics
Local Control Funding Formula (LCFF): set of
three weighted formulas, multiplied by ADA
Foundation School Program: two formula amounts, multiplied by
weighted ADA
Charter Modifications
Yes: statewide average per pupil used instead of local
weighted amount; 4.66 percent of aid is withheld
unless the charter provides transportation
Not all charters eligible for small-district weight and
teacher salary supplemental weight
Slightly different grade-span weights for charter schools; some charters eligible for
supplemental aid if local aid share is below a certain
amount
No No No No
Virtual-specific Provisions
None for full-time virtual charter schools. For part-
time enrolled students, aid is capped at 88 percent of
the General Education Revenue amount and an
'ADM' count for aid purposes is only earned for a student who completes
the course.
Virtual instruction is funded through Arizona Online
Instruction (AOI) formula, which counts students
through actual instructional minutes, not enrollment
days. Full-time virtual students are funded at 95
percent of base level support; part-time students
are funded at 85 percent.
None for full-time enrolled students; part-time enrolled students are funded partially
by a completion formula. Part-time students are funded 50 percent based on enrollment
and up to 50 percent on course completion within set time frame, with a reduced
amount for completion beyond this window.
Yes: VLACS is a special-case school that is funded through an
MOU with the state. The MOU expired in 2015, but the funding arrangement remains the same.
Under the arrangement, completion replaces ADM, with
an additional flat per-pupil supplemental amount.
Virtual charter schools are ineligible for class-
size reduction aid supplement. A "full-time equivalent" ADM count
is only earned for a student if they complete
the course; otherwise, no funding is allocated.
Virtual charters are funded at base of 70
percent of LCFF amount, requiring an "affirmative determination" that the virtual school spends a
sufficient share of aid on direct instruction or
meets academic performance measures.
For full-time students, funding is only received if a student successfully completes the course; for part-time students,
funding is a flat per-course amount.
Appendix A