Embed Size (px)
Citation preview

Oklahoma School Testing Program
Oklahoma State Department of Education
Oklahoma State Department of Education Oklahoma City, Oklahoma
Oklahoma Core Curriculum Tests
2010–2011Released Items
End-of-InstructionACE Algebra I

Copyright © 2010 by the Oklahoma State Department of Education. All rights reserved. Any other use or reproduction of this document, in whole or in part, requires written permission of the Oklahoma State Department of Education.

1
Section 1

2GO ON
Section 1Directions
2 The perimeter of the triangle below is 23 centimeters.
What is the length, in centimeters, of the shortest side?
F 4 centimeters
G 6 centimeters
H 8 centimeters
J 9 centimeters
x
x+3
x+2
1 Let x represent Sue’s age and y represent Kay’s age. Kay is three yearsolder than twice Sue’s age. Which equation shows the relationship betweentheir ages?
A
B
C
D y x= +2 3
y x= +3 2
2 3y x= +
3 2y x= +
Read each question and choose the best answer.

3
Section 1
GO ON
3 What is the value of when and
A 5
B 8
C 22
D 38
y = 4?x = 65 2x y− ,
4
What is the simplified form of this expression?
F
G
H
J 3 9a −
3 3a −
2 9a −
2 3a −
6 2 64
b ab
( )−
5 Which expression is equivalent to
A
B
C
D x w90 35
x w40 35
x w19 12
x w13 12
( ) ( ) ?x w x w5 2 7 3 3 5

4
Section 1
GO ON
6
What is the factored form of this expression?
F
G
H
J ( )( )y y− +8 4
( )( )y y+ −8 4
( )( )y y− +2 16
( )( )y y+ −2 16
y y2 14 32+ −
7 Which diagram represents a function?
-2
0
1
3
5
6
7
8
Input OutputA0
1
4
5
-6
-2
-1
3
Input OutputB
4
3
2
1
-6
-5
2
1
Input OutputC-3
-1
1
3
2
4
6
8
Input OutputD

5
Section 1
GO ON
9
What is the solution to this equation?
A
B
C
D−1112
− 316
16
316
− + − =4 6 2( ) 15x
8 Nancy sells orange juice and lemonade. She charges different prices forsmall, medium, and large sizes of these drinks. What are the independentand dependent variables?
F Independent variable: drink sizeDependent variable: price charged
G Independent variable: type of drinkDependent variable: price charged
H Independent variable: price chargedDependent variable: drink size
J Independent variable: price chargedDependent variable: type of drink
6
Section 1
GO ON
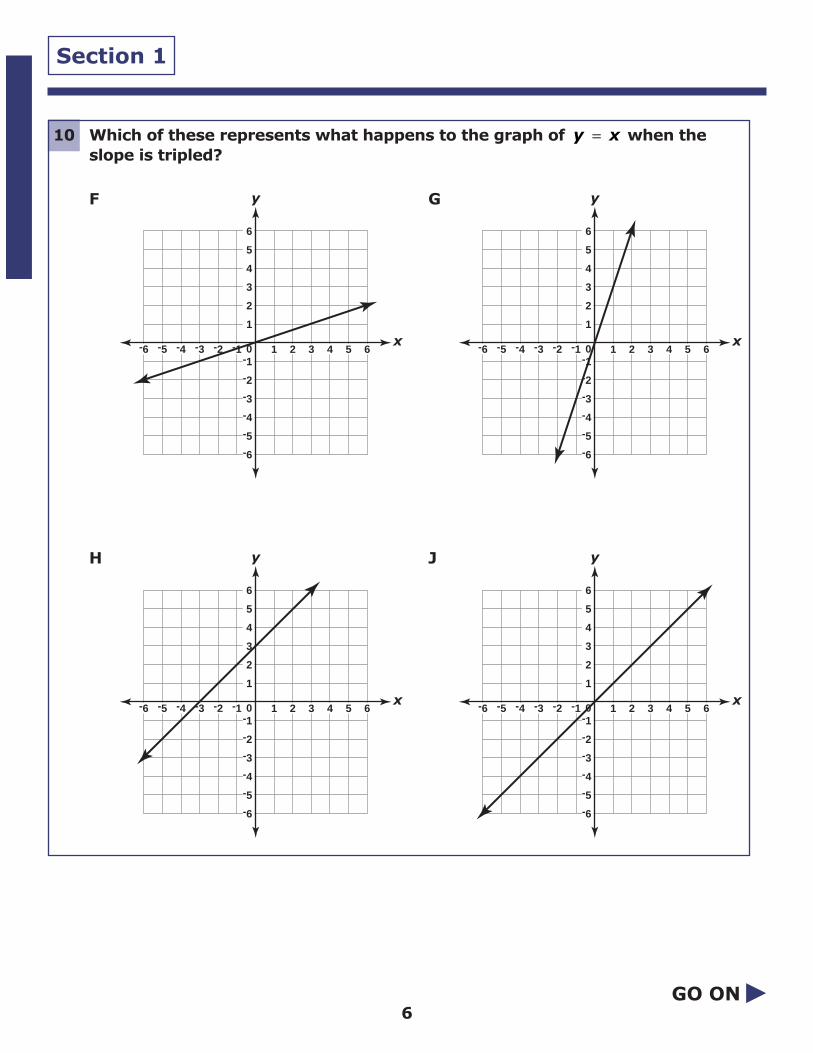
10 Which of these represents what happens to the graph of when theslope is tripled?
y x=
y
x
6
5
4
3
2
1
-1
-2
-3
-4
-5
-6
0 1 2 3 4 5 6-6 -5 -4 -3 -2 -1
F y
x
6
5
4
3
2
1
-1
-2
-3
-4
-5
-6
0 1 2 3 4 5 6-6 -5 -4 -3 -2 -1
G
y
x
6
5
4
3
2
1
-1
-2
-3
-4
-5
-6
0 1 2 3 4 5 6-6 -5 -4 -3 -2 -1
H y
x
6
5
4
3
2
1
-1
-2
-3
-4
-5
-6
0 1 2 3 4 5 6-6 -5 -4 -3 -2 -1
J

7
Section 1
GO ON
12 What is the slope of a line perpendicular to the line represented by
F
G
H
J 23
−13
12
−12
y x= +2 3?
11
What is the slope of the line defined by the points in the table?
A
B
C
D 83
23
−23
−83
x
f(x)
0
-5
3
-3
6
-1
9
1

8
Section 1
GO ON
13
What is the equation of this graphed line?
A
B
C
D y x= +4 3
y x= +14 3
y x= − −14 3
y x= − −4 3
x
y
654321
-1-2-3-4-5-6
0 1 2 3 4 5 6-2-3-4-5-6 -1

9
Section 1
GO ON
14 The table below shows the amount of money Jerry’s Tree Service chargesfor various hours of work.
Which equation represents the amount charged (y), in dollars, for x hoursof work?
F
G
H
J y x= +8 4
y x= +2 10
y x= +6 6
y x= 12
Jerry’s Tree Service Rates
1
$12
2
$18
3
$24
6
$42
8
$54AmountCharged
Number of Hours

10
Section 1
GO ON
15
Which number line represents the solution to this inequality?
A
B
C
D-8 -7 -6 -5 -4 -3 -2 -1 210 3
-8 -7 -6 -5 -4 -3 -2 -1 210 3
-8 -7 -6 -5 -4 -3 -2 -1 210 3
-8 -7 -6 -5 -4 -3 -2 -1 210 3
8 4 2 2≥ − ≥ −x

11
Section 1
GO ON
16
What is the solution to this inequality?
F
G
H
J x ≥ −1
x ≤ −1
x ≤ −3
x ≥ −3
− + ≥ − +x x7 4 2( )
17
Which inequality matches this number line?
A
B
C
D − < <2 1x
− ≤ <2 1x
− ≤ ≤2 1x
− < ≤2 1x
-3 -2 -1 0 1 2 3

12
Section 1
18
What is the solution to this system of equations?
F
G
H
J ( , )−85 35
( , )−70 29
( , )−17 7
( , )1 1−
2 5 55 12 2
x yx y
+ =+ = −
⎧⎨⎩
19
What is the y-value of the solution to this system of equations?
A 3
B 5
C 7
D 9
y x
y x
= += −
4
2 1
GO ON

13
Section 1
GO ON
20 The table below shows the number of letters in a paragraph.
Which graph represents this data?
E
46
S
22
T
19
Letter Frequency
A
24
W
2
50454035302520151050
E S T A WLetter
Fre
qu
en
cy
F 50454035302520151050
E S T A WLetter
Fre
qu
en
cy
G
50454035302520151050
E S T A WLetter
Fre
qu
en
cy
H 50454035302520151050
E S T A WLetter
Fre
qu
en
cy
J

14
Section 1
GO ON
21 Diane budgets her monthly salary according to the circle graph below.
Diane earns $1,200 each month. Approximately how much of her monthlysalary does she spend on school fees and clothes combined?
A $120
B $300
C $341
D $420
Diane’s Budget
RentRent40%40%Rent40%
School FeesSchool Fees25%25%
School Fees25%
FoodFood9%9%
Food9%
RecreationRecreation16%16%
Recreation16%
ClothesClothes10%10%
Clothes10%
15
Section 1
GO ON
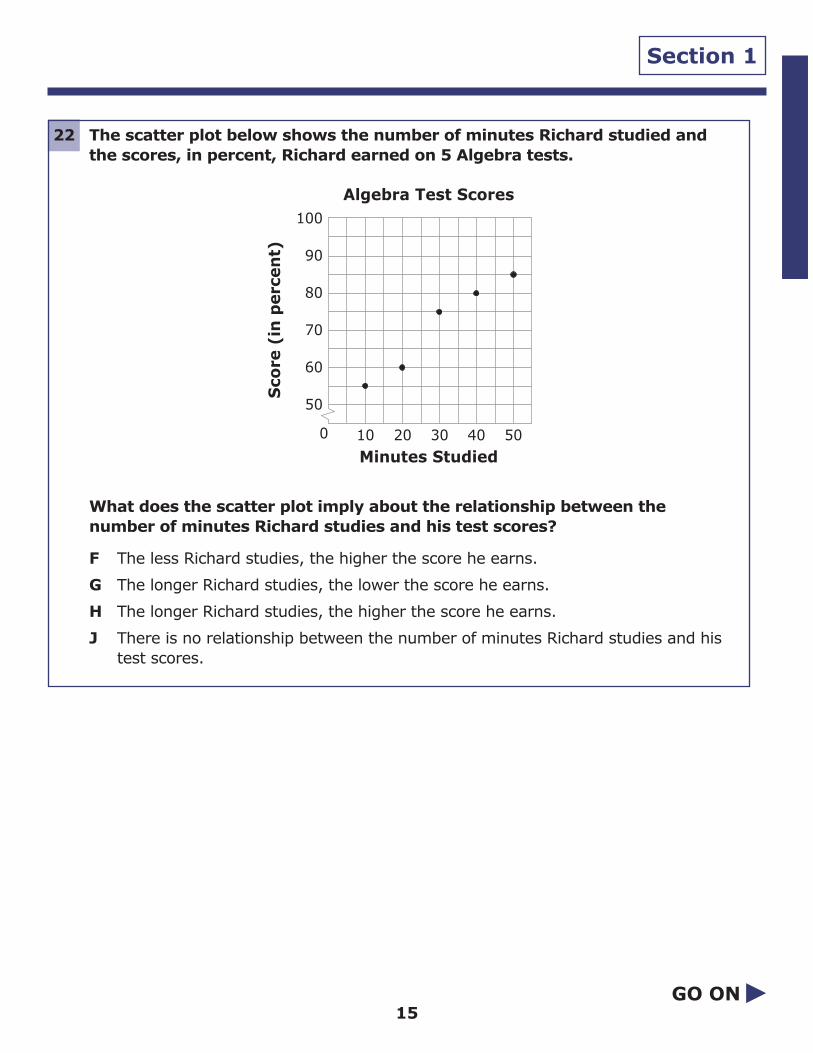
22 The scatter plot below shows the number of minutes Richard studied andthe scores, in percent, Richard earned on 5 Algebra tests.
What does the scatter plot imply about the relationship between thenumber of minutes Richard studies and his test scores?
F The less Richard studies, the higher the score he earns.
G The longer Richard studies, the lower the score he earns.
H The longer Richard studies, the higher the score he earns.
J There is no relationship between the number of minutes Richard studies and histest scores.
Algebra Test Scores
Minutes Studied0 2010 30 40 50
100
90
80
70
60
50
Sco
re (
in p
erc
en
t)

16
Section 1
GO ON
23 For how many seconds was the height of the ball increasing?
A 1
B 2
C 3
D 4
The graph shows the height of a football from the time it was kicked untilit landed.
x
y
175
150
125
100
75
50
25
Height of Football
Time (in seconds)2 3 41
Heig
ht
(in
feet)
0
Use the information below to answer Numbers 23 through 25.

17
Section 1
25 As soon as the ball was kicked, the kicker’s teammates began running at anaverage speed of 30 feet per second. Approximately how far did theteammates run while the ball was in the air?
A 7.5 feet
B 15 feet
C 60 feet
D 120 feet
24 What was the approximate height of the football 1 second after it waskicked?
F 100 feet
G 125 feet
H 160 feet
J 175 feet
STOP

18
STOPEND OF SECTION 1

527901 1 2 3 4 5 A B C D E Printed in the USA ISD1621