Embed Size (px)
Citation preview

Spring 2008
Intelligent Gas Storage
Zonal Isolation
Smart Materials
Seismic Inversion
Oilfield Review
SCHLUMBERGER OILFIELD REVIEW
SPRING 2008
VOLUME 20 N
UMBER 1

08-OR-002-0
61459schD1R1.qxp:61459schD1R1 5/24/08 4:54 AM Page 2

One of the most important functions of a cement sheath isto provide hydraulic zonal isolation between different loca-tions in the wellbore. In the 1970s, the E&P industry faceda significant challenge: understanding a phenomenonknown variously as gas migration, annular flow aftercementing or, simply, flow after cementing. In the simplestterms, flow after cementing is a loss of well control experi-enced in the first few hours following a cement job.
Wells were cemented using slurry with a density greaterthan that of the mud that had been used for drilling the wells.Yet these wells, which had been successfully controlled bythe drilling-mud density, could flow. This was puzzling.
Operators and service companies spent roughly twodecades performing cement research and trying field solu-tions to solve the puzzle. We studied many aspects of slurrydesign and performance, including fluid loss, free fluid,permeability, static gel-strength development and shrink-age in small- and large-scale laboratory tests. Instru-mented field tests documented the loss of pressure inactual wells during cement hydration.
Mud-removal techniques were improved through bettercentralization, casing movement, fluid properties (densityand rheological hierarchies) and the power of computersimulators to replace rules of thumb to engineer cementplacement for specific well applications. The result is thattoday’s industry is well-equipped to meet the challenge ofproviding zonal isolation in the short term through effec-tive slurry design and efficient mud-removal technique.
Now the industry faces another important challenge:improved understanding and maintenance of zonal isola-tion throughout a well’s productive life and even beyond. Ithas become apparent that the materials and techniquesthat successfully achieve short-term zonal isolation are notalways sufficient to maintain that isolation in the longerterm. Sustained casing pressure (SCP) is pressurebetween the well’s casing and tubing, or between strings ofcasing, that rebuilds after being bled down. SCP and itsmirror image, casing vent flows, have been documented inmany fields worldwide, and cement-sheath damage is oneof the possible causes for these long-term problems.
As early as 1989, a field case was reported in which zonalisolation was lost because of extensive fractures and finefissures in the cement matrix. This damage resulted fromrepeated thermal cycling of the cement sheath in a geo-thermal well. In the latter half of the 1990s, the first publi-cations appeared dealing with damage of the cementsheath caused by stresses imposed after its initial place-ment and hydration. The stresses described result primar-ily from changes in temperature and pressure during theproductive life of the well. Examples of such changesinclude increasing temperature due to production of
Zonal Isolation—Where Do We Go from Here?
hydrocarbons, temperature variations from cyclic-steamenhanced-oil recovery, pressure changes due to requiredcasing-pressure tests, and pressure changes due tochange-out of well fluids from heavier drilling fluids tolighter completion brines. These temperature and pres-sure changes can cause loss of zonal isolation through theformation of microannuli or stress fractures in the cementsheath, or both. The small size of such defects makes themdifficult, if not impossible, to identify and repair using con-ventional remedial techniques. Thus, prevention of the ini-tial failure is important.
With respect to long-term isolation, the industry is now ina position similar to that of the short-term flow-after-cementing puzzle in the late 1970s. The problem has beenidentified and the first steps in prediction and preventionhave been taken (see “Ensuring Zonal Isolation Beyond theLife of the Well,” page 18). Much work remains to be done.
Test methods used to determine parameters—such asYoung’s modulus and Poisson’s ratio—need to be refinedand standardized so they can reliably be used in predictivesoftware. The most commonly measured cement mechani-cal property is unconfined uniaxial compressivestrength—a result of a test adapted from the constructionindustry and based on geometries common in construc-tion. The measured value does not directly apply to theperformance of a cement sheath under confined downholeconditions. The long-entrenched paradigm that highercompressive strength is always better compressivestrength will gradually change.
The software models themselves (like the early versions ofcement-slurry placement software) have potential for growthin predictive capability and refinement of the stressesmodeled. For example, what effect do compaction and otherformation changes caused by production have on isolation?
Inevitably, new techniques and materials will develop tomeet the market’s needs. Exciting times are ahead!
Craig GardnerCementing Team Leader and Cementing ConsultantChevronHouston, Texas, USA
Craig Gardner is a Consultant in cementing and Cement Team Leader atChevron in Houston. After receiving a BS degree in chemistry from the Univer-sity of Houston, he worked for a major drilling fluids company prior to joiningGulf Oil as a drilling supervisor in 1980. He is involved in Chevron’s worldwidecementing operations through technical services, technology development andtraining. Craig is a member of SPE, API and ISO and is a former chairman ofthe API Subcommittee on Well Cements.
1
61459schD2R1.qxp:61459schD2R1 5/15/08 8:57 AM Page 1
GasLiquidSolid
Schlumberger
Oilfield Review4 Intelligent Well Technology in Underground
Gas Storage
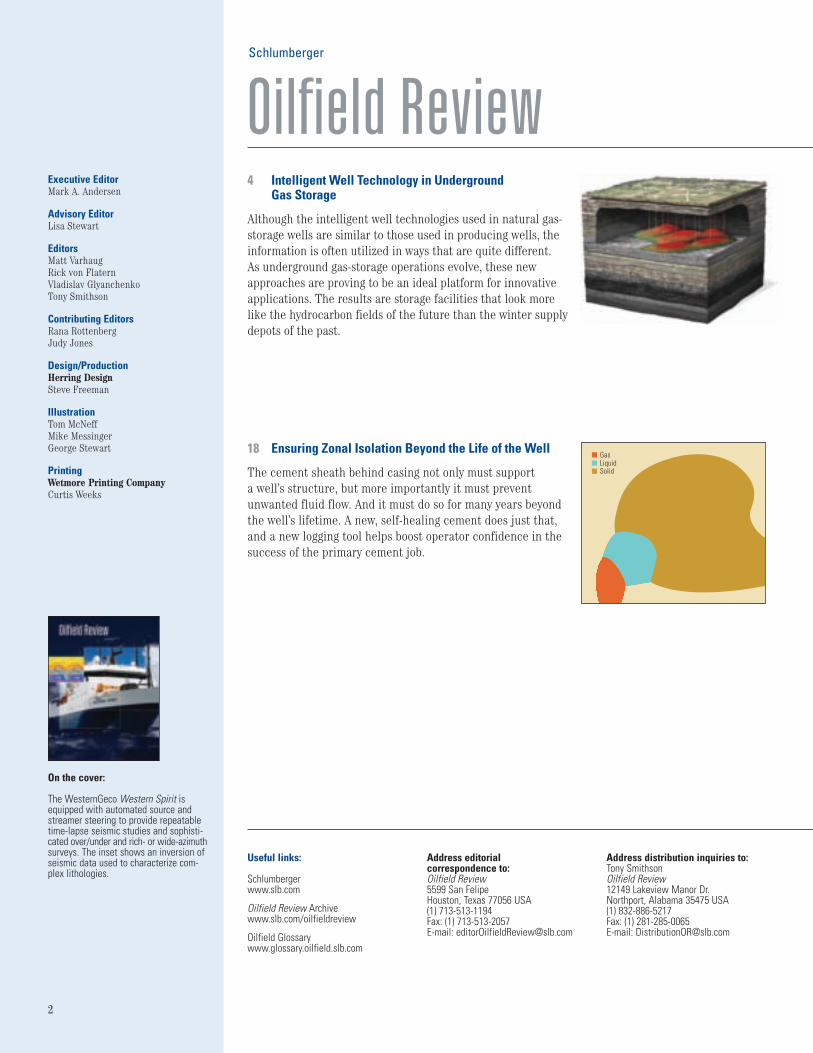
Although the intelligent well technologies used in natural gas-storage wells are similar to those used in producing wells, theinformation is often utilized in ways that are quite different. As underground gas-storage operations evolve, these newapproaches are proving to be an ideal platform for innovativeapplications. The results are storage facilities that look morelike the hydrocarbon fields of the future than the winter supplydepots of the past.
18 Ensuring Zonal Isolation Beyond the Life of the Well
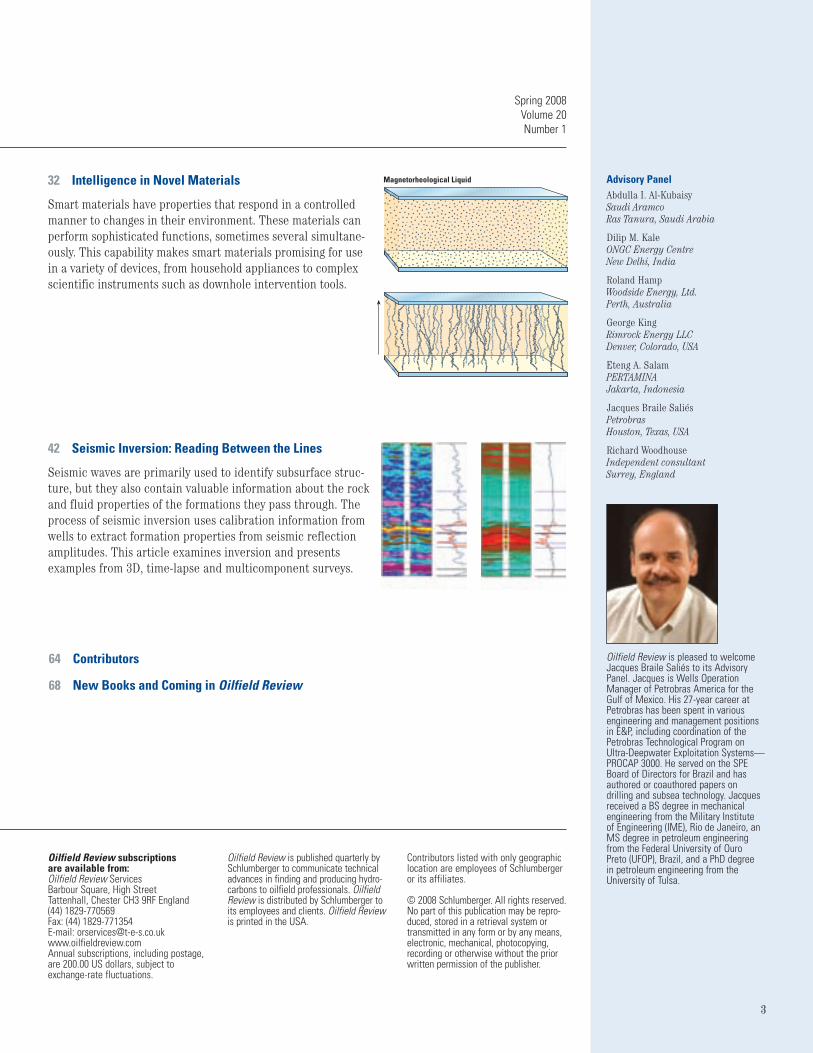
The cement sheath behind casing not only must support a well’s structure, but more importantly it must preventunwanted fluid flow. And it must do so for many years beyondthe well’s lifetime. A new, self-healing cement does just that,and a new logging tool helps boost operator confidence in the success of the primary cement job.
Executive EditorMark A. Andersen
Advisory EditorLisa Stewart
EditorsMatt VarhaugRick von FlaternVladislav GlyanchenkoTony Smithson
Contributing EditorsRana RottenbergJudy Jones
Design/ProductionHerring DesignSteve Freeman
IllustrationTom McNeffMike MessingerGeorge Stewart
PrintingWetmore Printing CompanyCurtis Weeks
Address editorial correspondence to:Oilfield Review5599 San Felipe Houston, Texas 77056 USA(1) 713-513-1194Fax: (1) 713-513-2057E-mail: [email protected]
Address distribution inquiries to:Tony SmithsonOilfield Review12149 Lakeview Manor Dr.Northport, Alabama 35475 USA(1) 832-886-5217Fax: (1) 281-285-0065E-mail: [email protected]
Useful links:
Schlumbergerwww.slb.com
Oilfield Review Archivewww.slb.com/oilfieldreview
Oilfield Glossarywww.glossary.oilfield.slb.com
On the cover:
The WesternGeco Western Spirit isequipped with automated source andstreamer steering to provide repeatabletime-lapse seismic studies and sophisti-cated over/under and rich- or wide-azimuthsurveys. The inset shows an inversion ofseismic data used to characterize com-plex lithologies.
2
61459schD3R1.qxp:61459schD3R1 5/21/08 12:55 AM Page 2
Magnetorheological Liquid
Spring 2008Volume 20Number 1
64 Contributors
68 New Books and Coming in Oilfield Review
3
32 Intelligence in Novel Materials
Smart materials have properties that respond in a controlledmanner to changes in their environment. These materials canperform sophisticated functions, sometimes several simultane-ously. This capability makes smart materials promising for usein a variety of devices, from household appliances to complexscientific instruments such as downhole intervention tools.
42 Seismic Inversion: Reading Between the Lines
Seismic waves are primarily used to identify subsurface struc-ture, but they also contain valuable information about the rockand fluid properties of the formations they pass through. Theprocess of seismic inversion uses calibration information fromwells to extract formation properties from seismic reflectionamplitudes. This article examines inversion and presentsexamples from 3D, time-lapse and multicomponent surveys.
Abdulla I. Al-KubaisySaudi AramcoRas Tanura, Saudi Arabia
Dilip M. KaleONGC Energy CentreNew Delhi, India
Roland HampWoodside Energy, Ltd.Perth, Australia
George KingRimrock Energy LLCDenver, Colorado, USA
Eteng A. SalamPERTAMINAJakarta, Indonesia
Jacques Braile SaliésPetrobrasHouston, Texas, USA
Richard WoodhouseIndependent consultantSurrey, England
Advisory Panel
Oilfield Review subscriptions are available from:Oilfield Review ServicesBarbour Square, High StreetTattenhall, Chester CH3 9RF England(44) 1829-770569Fax: (44) 1829-771354E-mail: [email protected] subscriptions, including postage,are 200.00 US dollars, subject toexchange-rate fluctuations.
Oilfield Review is published quarterly bySchlumberger to communicate technicaladvances in finding and producing hydro-carbons to oilfield professionals. OilfieldReview is distributed by Schlumberger toits employees and clients. Oilfield Reviewis printed in the USA.
Contributors listed with only geographiclocation are employees of Schlumbergeror its affiliates.
© 2008 Schlumberger. All rights reserved.No part of this publication may be repro-duced, stored in a retrieval system ortransmitted in any form or by any means,electronic, mechanical, photocopying,recording or otherwise without the priorwritten permission of the publisher.
Oilfield Review is pleased to welcomeJacques Braile Saliés to its AdvisoryPanel. Jacques is Wells OperationManager of Petrobras America for theGulf of Mexico. His 27-year career atPetrobras has been spent in variousengineering and management positionsin E&P, including coordination of thePetrobras Technological Program onUltra-Deepwater Exploitation Systems—PROCAP 3000. He served on the SPEBoard of Directors for Brazil and hasauthored or coauthored papers ondrilling and subsea technology. Jacquesreceived a BS degree in mechanicalengineering from the Military Institute of Engineering (IME), Rio de Janeiro, anMS degree in petroleum engineeringfrom the Federal University of Ouro Preto (UFOP), Brazil, and a PhD degree in petroleum engineering from theUniversity of Tulsa.
61459schD3R1.qxp:61459schD3R1 5/21/08 12:56 AM Page 3

4 Oilfield Review
Intelligent Well Technology in Underground Gas Storage
Kenneth BrownPittsburgh, Pennsylvania, USA
Keith W. ChandlerJohn M. HopperLowell ThronsonFalcon Gas Storage Company, Inc.Houston, Texas, USA
James HawkinsMidland, Texas
Taoufik ManaiParis, France
Vladimír OnderkaRWE Transgas NetBrno, Czech Republic
Joachim WallbrechtBEB Transport und Speicher Service GmbHHannover, Germany
Georg ZanglBaden, Austria
For help in preparation of this article, thanks to EdmundKnolle, Falcon Gas Storage Company, Houston; andMonsurat Ottun, Houston.BorView, BlueField, DECIDE!, ECLIPSE, ELANPlus, FMI(Fullbore Formation MicroImager), NODAL, Petrel andPIPESIM are marks of Schlumberger.Excel is a mark of Microsoft Corporation.
Intelligent well technologies are ideal for underground gas-storage facilities.
Formation properties have been determined; storage capacity and deliverability
can be modeled; and analytical tools can track historical production trends.
These technologies provide efficient, cost-effective storage and delivery systems,
helping secure the position of natural gas as a dependable energy resource.
When it comes to applying intelligent welltechnologies to oil and gas production, a primeobjective is maximizing the value of a continuallydiminishing asset. For underground natural gas-storage facilities, the application of these smarttechnologies can be significantly different,primarily because the gas reservoir can bereplenished. Thus, it is the ability to repeatedlyinject natural gas into and withdraw it fromunderground storage at high rates that must beoptimized and intelligently managed.
Formation properties define the optimal levelat which a well flows at high recovery rates. As thestored natural gas is recovered from the reservoir,the pressure decreases and flow rates fall. Cushiongas, the gas that remains in place betweeninjection and withdrawal cycles, ensures thatthere is sufficient pressure to maintain the desiredminimum flow rates on withdrawal. The pressureand volume provided by the cushion gas alsodiminish the likelihood of water influx into the gascap and can prevent gas/water contact movement.Because the most expensive component of anunderground gas-storage (UGS) facility can be thecushion gas, minimizing its volume andunderstanding the reservoir well enough to definethe efficient operating range can reduce theoverall development cost of a storage project, aswell as greatly enhance project profitability.
In hydrocarbon production, intelligent welltechnologies allow reservoir engineers to useinformation such as decline curves, material-balance relationships, inflow-performance-relationship (IPR) curves and reservoirsimulations and models—all in real time oralmost real time.1 A sophisticated system mayautomatically take corrective action or alert theoperator that intervention is warranted. Theultimate goal of intelligent production wells is todeliver more oil and gas with greater efficiency—at a lower cost.
While UGS facilities also benefit from effi -ciencies and lower cost provided by intel ligentwell technologies, they are not operated tomaximize the recovery of hydrocarbon. In fact,gas-storage operations in many parts of the worldare more analogous to a bank than a producingreservoir. Just as currency flows into and out of abank, assets in the form of natural gas flow intoand out of the storage reservoir. When calledupon, sometimes months after injection into astorage reservoir, but increasingly within a fewdays or even hours, the gas is delivered to a buyerwho supplies it to industrial and residentialcustomers. Banks have automated the flow ofcurrency and capital between institutions andusers; similarly, storage facilities are automatingthe flow of natural gas between producers and consumers.
61459schD4R1.qxp:Format Layout V7.2 5/15/08 9:02 AM Page 4
Spring 2008 5
component in the secure delivery of natural gas,these facilities must be managed appropriately.
Maintaining reliable natural gas supplies hasrecently become a geopolitical priority in manyareas of the world. Governmental regulations,such as those in the European Union, have hadincreased influence on how the UGS industryconducts business. Intelligent well technology isbeing adopted as a natural by-product of thesedevelopments because it helps facilitateautomatic storage and delivery of natural gas,improves the operational efficiencies of these
facilities, and assists in optimizing themanagement of assets (gas) in the ground.
The degree of implementation varies between different operations, and not all UGSfacilities operate using these relatively newtechnologies. However, the improved operatingperformance that has been demonstrated isprompting operators to retrofit and upgrademany older storage operations—sometimesyielding unexpected benefits.
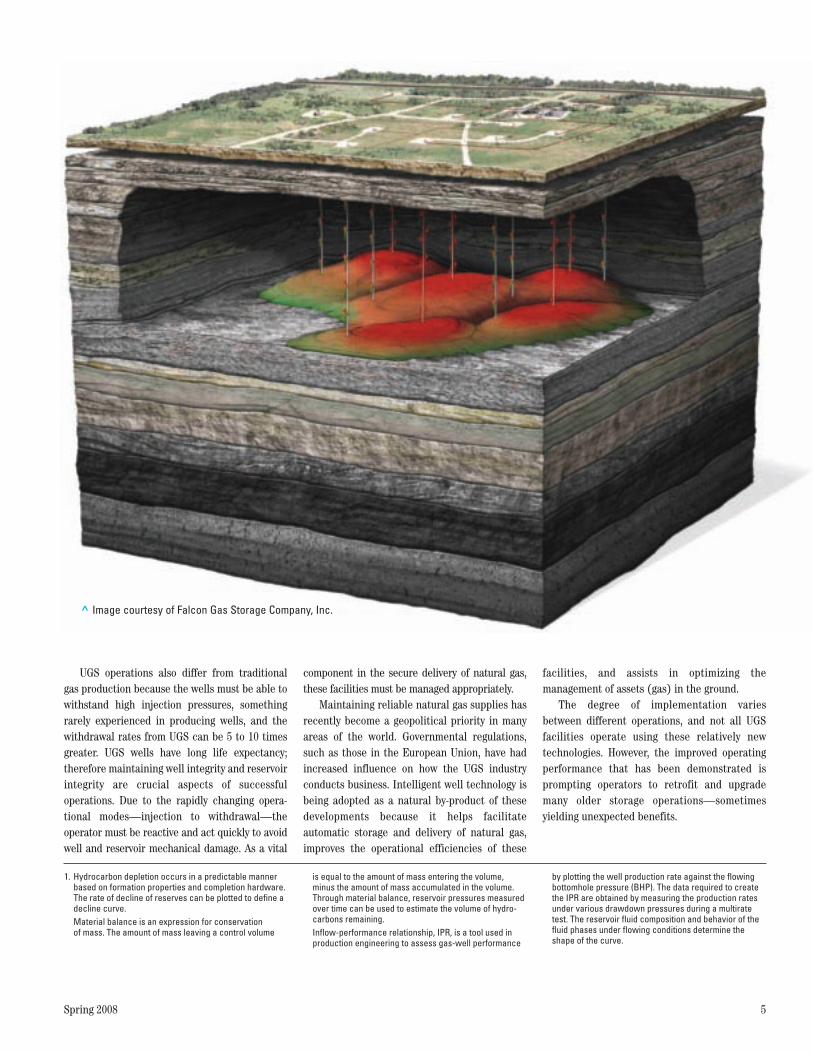
UGS operations also differ from traditionalgas production because the wells must be able towithstand high injection pressures, somethingrarely experienced in producing wells, and thewithdrawal rates from UGS can be 5 to 10 timesgreater. UGS wells have long life expectancy;therefore maintaining well integrity and reser voirintegrity are crucial aspects of successfuloperations. Due to the rapidly changing opera -tional modes—injection to withdrawal—theoperator must be reactive and act quickly to avoidwell and reservoir mechanical damage. As a vital
1. Hydrocarbon depletion occurs in a predictable mannerbased on formation properties and completion hardware.The rate of decline of reserves can be plotted to define adecline curve.Material balance is an expression for conservation of mass. The amount of mass leaving a control volume
is equal to the amount of mass entering the volume,minus the amount of mass accumulated in the volume.Through material balance, reservoir pressures measuredover time can be used to estimate the volume of hydro- carbons remaining.Inflow-performance relationship, IPR, is a tool used inproduction engineering to assess gas-well performance
by plotting the well production rate against the flowingbottomhole pressure (BHP). The data required to createthe IPR are obtained by measuring the production ratesunder various drawdown pressures during a multiratetest. The reservoir fluid composition and behavior of thefluid phases under flowing conditions determine theshape of the curve.
> Image courtesy of Falcon Gas Storage Company, Inc.
61459schD4R1.qxp:Format Layout V7.2 5/15/08 9:02 AM Page 5

After a brief review of gas-storage basics, thisarticle examines the different levels of intelligentwell technology being applied to undergroundgas-storage operations in North America andEurope. We present case studies showing howreal-time data are used to identify damage instorage wells and how the implementation of newoptimization and surveillance techniques hasimproved performance. Also included is adescription of a cutting-edge, automated opera -tion that integrates three levels of intelligent well technology.2
An Underground Gas-Storage PrimerTraditionally, natural gas has been considered aseasonal fuel because of the higher demand forheating during winter months. Beginning in the1940s, the US natural gas industry recognizedthat long-distance pipeline capacity was notsufficient to supply natural gas to largepopulation centers during peak-demand periods.To balance the gas-demand cycle, a gas-storagenetwork was developed to inject gas intounderground storage facilities when demand waslow and to release gas during periods of highdemand. This buffering of demand is referred toas peak-shaving.
Underground gas storage, however, has beenavailable almost as long as long-distancepipelines. In 1915, natural gas was firstsuccessfully stored underground in WellandCounty, Ontario, Canada. Several wells in apartially depleted gas field were reconditioned,and gas was injected into the reservoir during thesummer and withdrawn the following winter.
In 1916, Iroquois Gas Company placed theZoar field, south of Buffalo, New York, USA, intooperation as a storage site, and it is still inoperation today. In 1919, the Central KentuckyNatural Gas Company injected gas into thedepleted Menifee gas field in Kentucky, USA. By1930, nine storage sites in six different stateswere in operation with a total capacity of about18 Bcf [510 million m3]. Before 1950, essentiallyall underground gas storage consisted of reusedpartially or fully depleted gas reservoirs.
Today, the two primary types of undergroundgas-storage locations are caverns and porousreservoirs. Leached salt caverns and abandonedmines account for a small portion of the totalstorage capacity, while depleted oil and gasreservoirs and saline aquifers are by far the mostcommon UGS medium (left). Salt-cavern storage,better suited for high-rate delivery and injection,is primarily used for peak-day delivery purposes.3
Typically, 20 to 30% of the gas must remain inplace to maintain the structural stability of thecavern. Saline aquifers can provide high-ratedelivery, but cushion-gas requirements aresignificant, ranging from 50 to 80% of the totalstorage capacity. By far the most common type ofstorage, depleted hydrocarbon reservoirs areused for seasonal delivery or buffering highdemand. Typically, 30 to 50% of the storagecapacity must be maintained as cushion gas.4
In recent years, UGS withdrawal practiceshave changed in the USA because of theincreased use of natural gas for electricitygeneration. Drawdown during summer months ishigher than in the past because natural gas isbeing used to generate electricity for airconditioning and cooling requirements (left). Inmany ways, this has altered the scope of gasstorage in the USA. UGS facilities that arelocated in proximity to gas-fired power plants areused to moderate the supply for seasonal, as wellas hourly, variations. On a daily basis, gas instorage can be tapped during high-demandperiods and stored during low-demand periods.Commercial pipelines may be incapable ofsupplying sufficient quantities of gas during thepeak periods—or putting away gas duringperiods of low demand—but the UGS facility canmake up the shortfall in either case.
6 Oilfield Review
> Underground gas storage by type. UGS facilities can take several forms,but depleted hydrocarbon reservoirs and saline aquifers make up 96% ofthe global supply. The choice of storage type can be driven by availability:aquifers and salt caverns make up 34% of Western Europe’s storage capacitycompared with just 14% in the USA where there is greater access todepleted fields. (Adapted from Wallbrecht, reference 6.)
Depleted oil and gas fields81.6%
Aquifers14.5%
Salt caverns 3.9% Abandoned mines0.02%
Global Working-Gas Volume Distribution by Storage Types
> The cyclicity of natural gas usage. As a source of residential heating in the USA (blue), natural gas from storage peaks during winter months. Whenused for generating electricity to provide cooling (red), usage peaks duringsummer months. Commercial usage, driven by temperature (black), tracksresidential demand. Also note the rise in natural gas usage for electricitygeneration in successive years. [Adapted from http://www.eia.doe.gov/oil_gas/natural_gas/info_glance/natural_gas.html (accessed February 29, 2008.)]
Gas
usag
e, Tc
f
1.0
0.8
0.6
0.4
0.2
0
Gas
usag
e, b
illio
n m
3
0
4
8
12
16
20
24
28
Year2004 2005 2006 2007 2008
Residential
CommercialElectric power
61459schD4R1.qxp:Format Layout V7.2 5/15/08 9:02 AM Page 6

Spring 2008 7
UGS is not just a North Americanphenomenon—storage facilities are currentlyopera ting in 33 countries—although the USA hasby far the greatest number. As an energy source,natural gas utilization in residential andcommercial sectors of Western Europe hasexceeded 44%, highlighting the importance ofmaintaining a secure, uninterrupted supply. InFrance, storage facilities have at times suppliedmore than half the residential gas needed tomeet temperature-driven demand.5
Western Europe has recently experienced arise in gas trading between holding companiesand market suppliers. The use of gas-storagefacilities is often driven by short-term buying andselling, rather than traditional peak-shaving.Profitability for both buyers and suppliers isdetermined by the ability of the UGS facility tostore and deliver gas on demand in a cost-effective manner.
In 1997, there were 580 UGS sites worldwide,of which 448 were in depleted reservoirs. In 2006,of the estimated 606 UGS sites, the number indepleted reservoirs had grown to 495.6 In 1996,there were 92 UGS operations in Europe,excluding Russia. By 2006, the total number hadgrown to 127—a 38% increase. The working-gasvolume in storage facilities in the same area grewfrom 60.6 million m3 [2.14 Bcf] to 110.5 million m3
[3.9 Bcf], an 82% increase.Although the USA has had a slight decrease in
the number of UGS sites between 1995 and 2004,its total storage capacity has experienced amarginal increase through improved fieldutilization and retrofitting of existing facilities(top right). Many of these older UGS operationswere developed before the introduction of thereservoir modeling tools available today. Advancesin sensor technology and surface equipment arebeing applied to these older facilities, makingthem “smarter” and more versatile.7
How Smart Is an Intelligent Well?The relative intelligence of gas-storageoperations can be grouped into three levels.Level I, automated data flow, is reactive: receivedata, analyze data and respond. Level II,surveillance and optimization, is reflective butfocuses on action: analyze data, compare andvalidate models, manage models and determinenecessary courses of action. Level III can bedescribed as the digital oil field: integrateprocesses, optimize, automate and operateremotely, where it is applicable, in a proactivemanner (bottom right).
2. For more on intelligent field applications in producingwells: Dyer S, El-Khazindar Y, Reyes A, Huber M, Raw Iand Reed D: “Intelligent Completions—A Hands-Off Management Style,” Oilfield Review 19, no. 4 (Winter 2007/2008): 4–17.
3. For more on underground gas storage: Bary A,Crotogino F, Prevedel B, Berger H, Brown, K, Frantz J,Sawyer W, Henzell M, Mohmeyer K-U, Ren NK, Stiles Kand Xiong H: “Storing Natural Gas Underground,” OilfieldReview 14, no. 2 (Summer 2002): 2–17.
4. For more on current trends in UGS: https://www.ferc.gov/EventCalendar/Files/20041020081349-final-gs-report.pdf(accessed January 23, 2008).
5. Chabrelie MF, Dussaud M, Bourjas D and Hugout B:“Underground Gas Storage: Technological Innovationsfor Increased Efficiency,” http://217.206.197.194:8190/wec-geis/publications/default/tech_papers/17th_congress/2_2_09.asp (accessed December 12, 2007).
6. Wallbrecht J: “Underground Gas Storage,” InternationalGas Union, Report of Working Committee 2, Basic UGSActivities, presented at the 23rd World Gas Conference,Amsterdam, June 5–9, 2006, http://www.igu.org/html/wgc2006/WOC2database/index.htm (accessed March 27, 2008).
7. For more on recent sensor and instrumentation develop-ments in intelligent wells: Bouleau C, Gehin H, Gutierrez F,Landgren K, Miller G, Peterson R, Sperandio U,Traboulay I and Bravo da Silva L: “The Big Picture: Integrated Asset Management,” Oilfield Review 19, no. 4(Winter 2007/2008): 34–48.
> A growing supply. The working-gas volume has grown steadily in the past 35 years with most of theincrease occurring outside North and South America (blue), especially in Eastern Europe and theMiddle East (black), which includes Russia. Current projections indicate that capacity is insufficient tomeet the long-term demand and increased growth is required. (Adapted from Wallbrecht, reference 6.)
350
300
250
200
150
100
50
01970 1975 1980 1985 1990 1995 2000 2005
Year
Wor
king
-gas
vol
ume,
109 m
3
TotalEastern Europeand Middle EastAmericasWestern Europe
Middle East 2%
North and SouthAmerica 35%
Asia 2%
Western Europe 19%
Eastern Europe 42%
Working-Gas Volume Distribution by Region in 2004
> Levels of intelligence. Three levels can be identified in theimplementation of intelligent well technology. Each level brings addedcomplexity and builds upon the others. The most comprehensive is thedigital oil field with optimization and opportunities for automation.
Reservoir
Wells
Gatheringsystem
Facilities
Level I, Reactive
Dynamic data: SCADA systemStatic data: well, reservoir
and technology
Level II, Active
Level III, Proactive
Digital oil field
Surveillance and optimization
61459schD4R1.qxp:Format Layout V7.2 5/15/08 9:02 AM Page 7
Level-I intelligence begins by developingconfidence in the data. Supervisory control anddata acquisition (SCADA) systems can be foundin most UGS operations. These computerizednetworks remotely acquire well data such as flowrate, pressure and flowing volume, and controltransmission of gas throughout a pipeline system.With millions of data points thus acquired, it isimpossible to manually validate all theinformation. Automating quality control of thedata flow is a necessity.
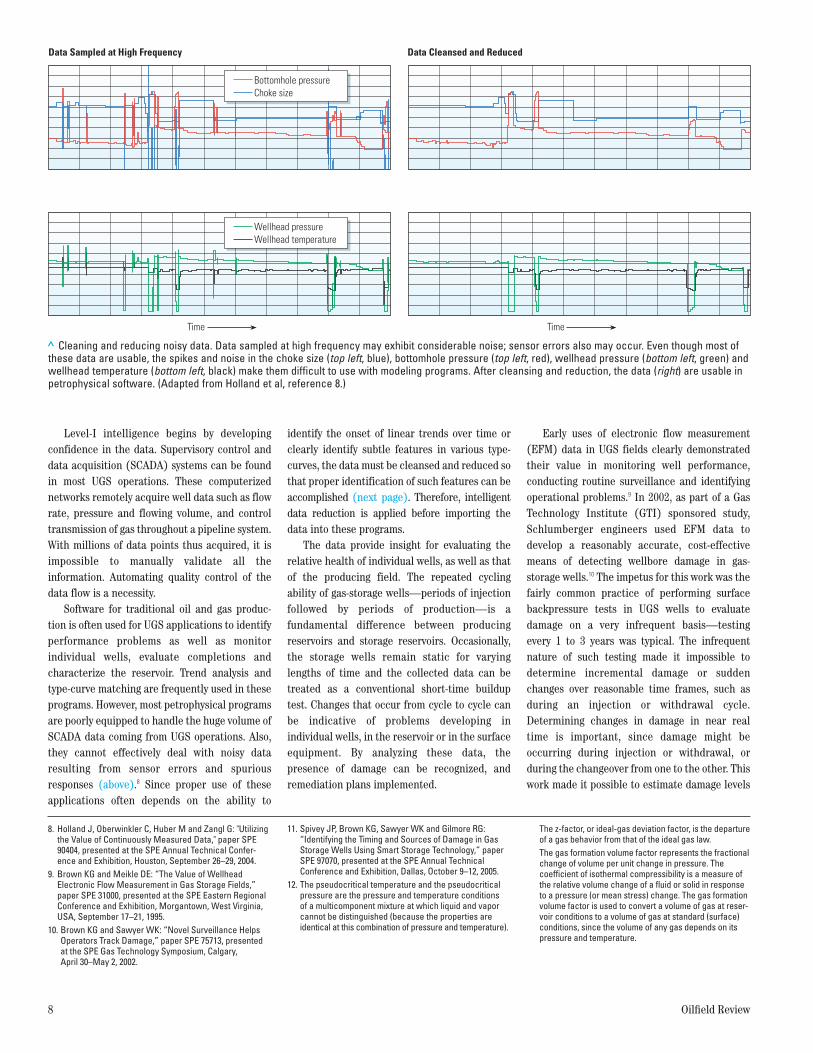
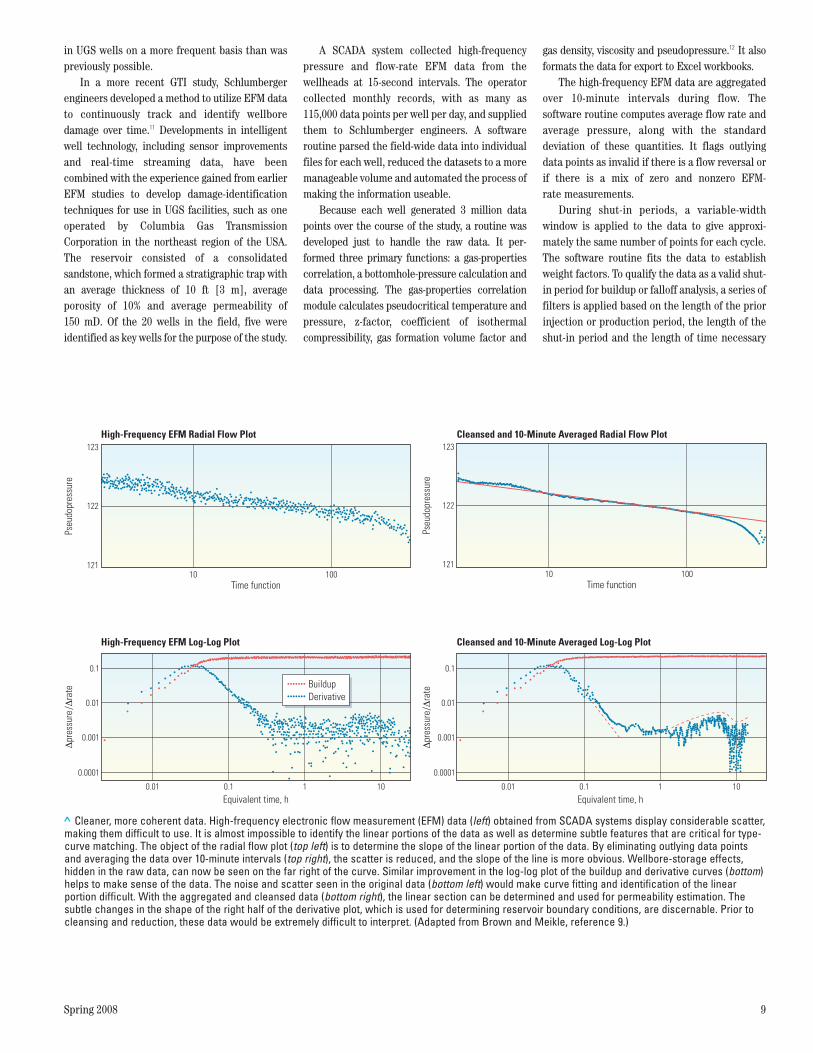
Software for traditional oil and gas produc -tion is often used for UGS applications to identifyperformance problems as well as monitorindividual wells, evaluate completions andcharacterize the reservoir. Trend analysis andtype-curve matching are frequently used in theseprograms. However, most petrophysical programsare poorly equipped to handle the huge volume ofSCADA data coming from UGS operations. Also,they cannot effectively deal with noisy dataresulting from sensor errors and spuriousresponses (above).8 Since proper use of theseapplications often depends on the ability to
identify the onset of linear trends over time orclearly identify subtle features in various type-curves, the data must be cleansed and reduced sothat proper identification of such features can beaccomplished (next page). Therefore, intelligentdata reduction is applied before importing thedata into these programs.
The data provide insight for evaluating therelative health of individual wells, as well as thatof the producing field. The repeated cyclingability of gas-storage wells—periods of injectionfollowed by periods of production—is afundamental difference between producingreservoirs and storage reservoirs. Occasionally,the storage wells remain static for varyinglengths of time and the collected data can betreated as a conventional short-time builduptest. Changes that occur from cycle to cycle canbe indicative of problems developing inindividual wells, in the reservoir or in the surfaceequipment. By analyzing these data, thepresence of damage can be recognized, andremediation plans implemented.
Early uses of electronic flow measurement(EFM) data in UGS fields clearly demonstratedtheir value in monitoring well performance,conducting routine surveillance and identifyingoperational problems.9 In 2002, as part of a GasTechnology Institute (GTI) sponsored study,Schlumberger engineers used EFM data todevelop a reasonably accurate, cost-effectivemeans of detecting wellbore damage in gas-storage wells.10 The impetus for this work was thefairly common practice of performing surfacebackpressure tests in UGS wells to evaluatedamage on a very infrequent basis—testingevery 1 to 3 years was typical. The infrequentnature of such testing made it impossible todetermine incremental damage or suddenchanges over reasonable time frames, such asduring an injection or withdrawal cycle.Determining changes in damage in near realtime is important, since damage might beoccurring during injection or withdrawal, orduring the changeover from one to the other. Thiswork made it possible to estimate damage levels
8 Oilfield Review
8. Holland J, Oberwinkler C, Huber M and Zangl G: "Utilizingthe Value of Continuously Measured Data," paper SPE90404, presented at the SPE Annual Technical Confer-ence and Exhibition, Houston, September 26–29, 2004.
9. Brown KG and Meikle DE: “The Value of Wellhead Electronic Flow Measurement in Gas Storage Fields,”paper SPE 31000, presented at the SPE Eastern RegionalConference and Exhibition, Morgantown, West Virginia,USA, September 17–21, 1995.
10. Brown KG and Sawyer WK: “Novel Surveillance HelpsOperators Track Damage,” paper SPE 75713, presented at the SPE Gas Technology Symposium, Calgary, April 30–May 2, 2002.
The z-factor, or ideal-gas deviation factor, is the departureof a gas behavior from that of the ideal gas law.The gas formation volume factor represents the fractionalchange of volume per unit change in pressure. The coefficient of isothermal compressibility is a measure ofthe relative volume change of a fluid or solid in responseto a pressure (or mean stress) change. The gas formationvolume factor is used to convert a volume of gas at reser-voir conditions to a volume of gas at standard (surface)conditions, since the volume of any gas depends on itspressure and temperature.
11. Spivey JP, Brown KG, Sawyer WK and Gilmore RG:“Identifying the Timing and Sources of Damage in GasStorage Wells Using Smart Storage Technology,” paperSPE 97070, presented at the SPE Annual Technical Conference and Exhibition, Dallas, October 9–12, 2005.
12. The pseudocritical temperature and the pseudocriticalpressure are the pressure and temperature conditions of a multicomponent mixture at which liquid and vaporcannot be distinguished (because the properties areidentical at this combination of pressure and temperature).
> Cleaning and reducing noisy data. Data sampled at high frequency may exhibit considerable noise; sensor errors also may occur. Even though most of these data are usable, the spikes and noise in the choke size (top left, blue), bottomhole pressure (top left, red), wellhead pressure (bottom left, green) andwellhead temperature (bottom left, black) make them difficult to use with modeling programs. After cleansing and reduction, the data (right) are usable inpetrophysical software. (Adapted from Holland et al, reference 8.)
Time Time
Wellhead pressureWellhead temperature
Bottomhole pressureChoke size
Data Sampled at High Frequency Data Cleansed and Reduced
61459schD4R1.qxp:Format Layout V7.2 5/15/08 9:02 AM Page 8
Spring 2008 9
in UGS wells on a more frequent basis than waspreviously possible.
In a more recent GTI study, Schlumbergerengineers developed a method to utilize EFM datato continuously track and identify wellboredamage over time.11 Developments in intelligentwell technology, including sensor improvementsand real-time streaming data, have beencombined with the experience gained from earlierEFM studies to develop damage-identificationtechniques for use in UGS facilities, such as oneoperated by Columbia Gas TransmissionCorporation in the northeast region of the USA.The reservoir consisted of a consolidatedsandstone, which formed a strati graphic trap withan average thickness of 10 ft [3 m], averageporosity of 10% and average permeability of150 mD. Of the 20 wells in the field, five wereidentified as key wells for the purpose of the study.
A SCADA system collected high-frequencypressure and flow-rate EFM data from thewellheads at 15-second intervals. The operatorcollected monthly records, with as many as115,000 data points per well per day, and suppliedthem to Schlumberger engineers. A softwareroutine parsed the field-wide data into individualfiles for each well, reduced the datasets to a moremanageable volume and automated the process ofmaking the information useable.
Because each well generated 3 million datapoints over the course of the study, a routine wasdeveloped just to handle the raw data. It per -formed three primary functions: a gas-propertiescorrelation, a bottomhole-pressure calculation anddata processing. The gas-properties correla tionmodule calculates pseudo critical temperature andpressure, z-factor, coefficient of isothermalcompressibility, gas formation volume factor and
gas density, viscosity and pseudo pressure.12 It alsoformats the data for export to Excel workbooks.
The high-frequency EFM data are aggregatedover 10-minute intervals during flow. Thesoftware routine computes average flow rate andaverage pressure, along with the standarddeviation of these quantities. It flags outlyingdata points as invalid if there is a flow reversal orif there is a mix of zero and nonzero EFM-rate measurements.
During shut-in periods, a variable-widthwindow is applied to the data to give approxi -mately the same number of points for each cycle.The software routine fits the data to establishweight factors. To qualify the data as a valid shut-in period for buildup or falloff analysis, a series offilters is applied based on the length of the priorinjection or production period, the length of theshut-in period and the length of time necessary
> Cleaner, more coherent data. High-frequency electronic flow measurement (EFM) data (left) obtained from SCADA systems display considerable scatter,making them difficult to use. It is almost impossible to identify the linear portions of the data as well as determine subtle features that are critical for type-curve matching. The object of the radial flow plot (top left) is to determine the slope of the linear portion of the data. By eliminating outlying data pointsand averaging the data over 10-minute intervals (top right), the scatter is reduced, and the slope of the line is more obvious. Wellbore-storage effects,hidden in the raw data, can now be seen on the far right of the curve. Similar improvement in the log-log plot of the buildup and derivative curves (bottom)helps to make sense of the data. The noise and scatter seen in the original data (bottom left) would make curve fitting and identification of the linearportion difficult. With the aggregated and cleansed data (bottom right), the linear section can be determined and used for permeability estimation. Thesubtle changes in the shape of the right half of the derivative plot, which is used for determining reservoir boundary conditions, are discernable. Prior tocleansing and reduction, these data would be extremely difficult to interpret. (Adapted from Brown and Meikle, reference 9.)
0.1
0.01
0.001
0.0001
0.01 1 10
High-Frequency EFM Log-Log Plot
Equivalent time, h0.1
Δpr
essu
re/Δ
rate Buildup
Derivative
0.1
0.01
0.001
0.0001
0.01 1 10
Cleansed and 10-Minute Averaged Log-Log Plot
Equivalent time, h0.1
Δpr
essu
re/Δ
rate
Time function
123
122
12110 100
High-Frequency EFM Radial Flow Plot
Pseu
dopr
essu
re
Cleansed and 10-Minute Averaged Radial Flow Plot123
122
12110 100
Time function
Pseu
dopr
essu
re
61459schD4R1.qxp:Format Layout V7.2 5/15/08 9:02 AM Page 9

for sufficient data to be acquired for the analysisto be valid. Additional controls wereimplemented to avoid limitations when exportingdata to an Excel worksheet.
At this point in the data-handling process, auser must intervene to select the plots and adjustthe scales as applicable. Apparent mechanicalskin damage factor, S, can be plotted as afunction of time or rate. If the mechanical skindamage factor, s, and non-Darcy flow coefficient,D, are constant with time, then the apparentmechanical skin damage factor, S, will be a linearfunction of rate and can be used to estimate sand D.13 If s or D changes with time, the data willnot be a linear function of rate. Abrupt changeswill cause clusters of data points, and gradualchanges will result in the data drifting away fromthe baseline model (above).
One study found that 60% of the reservoirsevaluated had wells in which non-Darcy flow wasidentified as a damage mechanism.14 If thedamage is assumed to be related to mechanical
skin damage factor alone, erroneous conclusionsmight lead to inappropriate or ineffectiveintervention. Mechanical skin damage is oftenimproved by pumping acid into the perforationsor by hydraulically fracturing the formation.These types of remediation would not effectivelytreat non-Darcy flow effects, and performingthem could be a waste of time and money.
A change in non-Darcy flow effects duringinjection was observed during the Columbia GasTransmission study period. The onset of damagewas isolated to a particular week in 2004. Severalwells in the field exhibited this increased non-Darcy flow effect, which was identified by anabrupt change of the slope on the apparent skindamage versus rate plot, while other wells in thefield did not experience this change. The analysissuggests that the cause of this perceived damageis related to an increase in turbulent flow duringinjection, rather than mechanical damage toindividual wells. Thus, no remediation was
warranted. Had the problem been detectedduring an annual test conducted on an individualwell, rather than by continuous monitoring of allthe wells in the field, it is possible that theresults could have led the operator to the wrongconclusion and needless expenditures.
Existing data sources and new data miningtechniques were used to perform the analyses,allowing the operator to determine the source ofperceived damage and make the proper decisionfor dealing with it. In this case study, the wells inquestion were able to remain in operation and noremediation was necessary.15
Practical Improvement Leads to Level IIA systemic approach to the processes ofinjection, storage and delivery for UGS facilitiesis likely to provide the greatest benefit tooperators. Individual-well analysis, reservoirmodeling, surface hardware and system ineffi -ciencies need to be fully evaluated, but it is not enough to focus on one or two aspects of
10 Oilfield Review
> Monitoring well performance. If mechanical skin damage factor, s, and non-Darcy flow coefficient, D, remain constant, apparent mechanical skin damagefactor, S, plotted versus flow rate should be a straight line (left, black). If s or D changes, the plot changes depending on the type of damage. From EFM data(top right), a step change in s occurs between the two withdrawal cycles (arrows). Plotting flow rate (bottom right) versus injection S (buildup) andwithdrawal S (falloff) reveals changes occurring during injection but not during withdrawal. Had s and D remained constant, the data would have fallenalong the reference line (red). In this example, the change in slope indicates an increase in D. (Adapted from Spivey et al, reference 11.)
Withdrawal Injection Withdrawal
0
Mec
hani
cal s
kin
dam
age
fact
or, s –1
–2
–3
–4
–5
Date4/1/041/16/0411/1/03 6/16/04 8/31/04 11/15/04 1/30/05 4/16/05
Shift in both slope andintercept: s and D changed
Shift in slope:D changedShift in intercept:s changed
Appa
rent
mec
hani
cal s
kin
dam
age
fact
or, S
Flow rate
FalloffBuildupBest fit
Appa
rent
mec
hani
cal s
kin
dam
age
fact
or, S
0–1,000–2,000–3,000–4,000–5,000 1,000 2,000 3,000 4,000 5,000
3
2
1
0
–1
–2
–3
–4
Flow rate, Mcf/d
S = –2.67D = 1.124 D/MMcf
61459schD4R1.qxp:Format Layout V7.2 6/25/08 6:23 PM Page 10

Spring 2008 11
the operation, such as EFM data, reservoircharacterization or surface hardware. Theoptimization process requires that all thecomponents be considered together to develop amodel that represents the total system.Optimization, modeling and surveillance are keycomponents in developing a Level-II intelligentUGS facility.
Most testing experts would agree that thefirst step in optimization is to characterizeindividual wells or completions. The conditionand quality of the reservoir in the vicinity of thewellbore and the level of damage affect the flowefficiency of the completion. Once these aredetermined, a predictive model can be developedto provide the expected performance undervarious operating conditions. Multirate welltesting is the standard method for fullcharacterization of well damage and flowperformance, and, with regard to developing arealistic model, it is indispensable.
Multirate pressure-transient testing quantifiesmechanical skin damage factor, s, and non-Darcyflow effects, D, and establishes a baseline forfuture comparison. Once the individual wellshave been tested, the next step is to characterizethe production properties of the system with amultirate test across the entire field. Usingoperational data, such as flow rates, tempera -tures and pressures from wellheads, treatmentfacilities and metering stations, an operator candesign an effective field-wide multirate test. If allthe wells in the field can flow simultaneously,this type of test provides a field-wide delivera -bility curve. The field-wide flow rate should behigh enough to identify the first bottleneck in the system.
Bottlenecks can be characterized as systeminefficiencies that affect overall performance atsome specific operating condition. Wellbore size,tubulars, wellhead equipment, gathering linesand treatment facilities impact the system andmay act as bottlenecks (right). Once thesebottlenecks are identified, economics determinewhether it is worthwhile to remove the cause ofthe bottleneck. For example, if a multirate testindicates that larger tubing will eliminate abottle neck but the wellbore size limits thetubulars that can be installed, there is little thatcan be done to fix the problem. Adding wells orreplacing existing wells might be the onlysolution, albeit an expensive one.
If a total-field flow test cannot be conducted,a deliverability curve can be constructed fromtests performed on individual wells. However,
surface-facility effects must then be measuredand included. Nonetheless, the total-fieldmethod will yield the most accurate results.
Finally, an inventory model for the storagefield can be developed that describes the total gasinventory as a function of reservoir pressure. Thisis accomplished by maintaining a constant flowrate from the storage field for a period of timesufficient to reach pseudosteady state, and usingthe pressure-decline rate observed duringpseudosteady-state flow to calculate the reser voirpore volume. In other words, this technique candetermine the size of the underground storage“tank” available for storage and delivery. Once thisreservoir pore volume is quantified, the operatorcan estimate the total gas contained in thereservoir for a given average reservoir pressure.
With existing technology, the averagereservoir pressure can be estimated from abuild up test any time there is a sufficiently longshut-in period during normal operations. Since
the field-inventory model quantifies therelationship between average reservoir pressureand total inventory, the operator can performmore frequent inventory audits than werepossible using data acquired only during routinespring and fall shut-in periods. Calculation ofaverage reservoir pressure from flowing data,perhaps available with currently developingtechnology, may allow real-time inventoryauditing in UGS fields rather than waiting forlong- or short-term buildup data. This isespecially important in cases where frequentcycling of gas is occurring and there is noroutine shut-in.
Once the pore volume has been establishedby collecting both individual well and field-widedata from extended tests, two independentestimates of pore volume can be derived andcompared. This information is integrated withthe deliverability-testing data to create the totalsystem model.
13. Mechanical skin damage factor, s, is a dimensionlessnumber calculated to determine the production efficiencyof a well by comparing actual conditions with theoreticalor ideal conditions. A positive skin value indicates thatsome damage or influences are impairing well produc- tivity. A negative skin value indicates enhancedproductivity, typically resulting from stimulation.The non-Darcy flow coefficient, D, is calculated fromfluid flow that deviates from Darcy's law. Darcy’s lawassumes laminar flow in the formation, and if the flow isturbulent rather than laminar, it is referred to as non-Darcy flow. Typically observed near high-rate gas wells,turbulent flow occurs when the flow converging to thewellbore reaches velocities exceeding the Reynoldsnumber for laminar or Darcy flow. Since most of the
> Identifying bottlenecks with multirate flow testing. NODAL production systemanalysis indicates that the tubing size is a bottleneck in this test. Tubing insidediameter (ID) is varied from the existing size of 3.092 in. (green) to 8.0 in. (blue).The analysis confirms that increasing the tubing ID from 3.092 in. to 5 in.(red) would provide a 54% increase in flow capacity, from 11 MMcf/d[311,000 m3/d] to 17 MMcf/d [481,000 m3/d]. Above 5-in. ID, only a nominal flowincrease would be added. (Adapted from Brown and Sawyer, reference 14.)
Pres
sure
, psi
500
400
300
200
100
05,000 10,000 15,000 20,0000 30,00025,000
Gas rate, Mcf/d
Inflow at sandface A B CD
E
Case 1 (A) - 3.092Case 2 (B) - 4.000Case 3 (C) - 5.000Case 4 (D) - 6.000Case 5 (E) - 8.000
Outflow, tubing ID, in.
turbulent flow in producing formations occurs near the wellbore, the effect of non-Darcy flow can be represented as a rate-dependent skin effect, D. Apparent mechanical skin damage factor, S, is similar tos but may be a result of mechanical damage or non-Darcy flow effects such as a rate-dependent restriction.
14. Brown KG and Sawyer WK: “Practical Methods toImprove Storage Operations—A Case Study,” paper SPE 57460, presented at the SPE Eastern Regional Conference and Exhibition, Charleston, West Virginia,October 20–22, 1999.
15. For more on recent sensor and data-handling develop-ments: Bouleau et al, reference 7.
61459schD4R1.qxp:Format Layout V7.2 5/15/08 9:02 AM Page 11
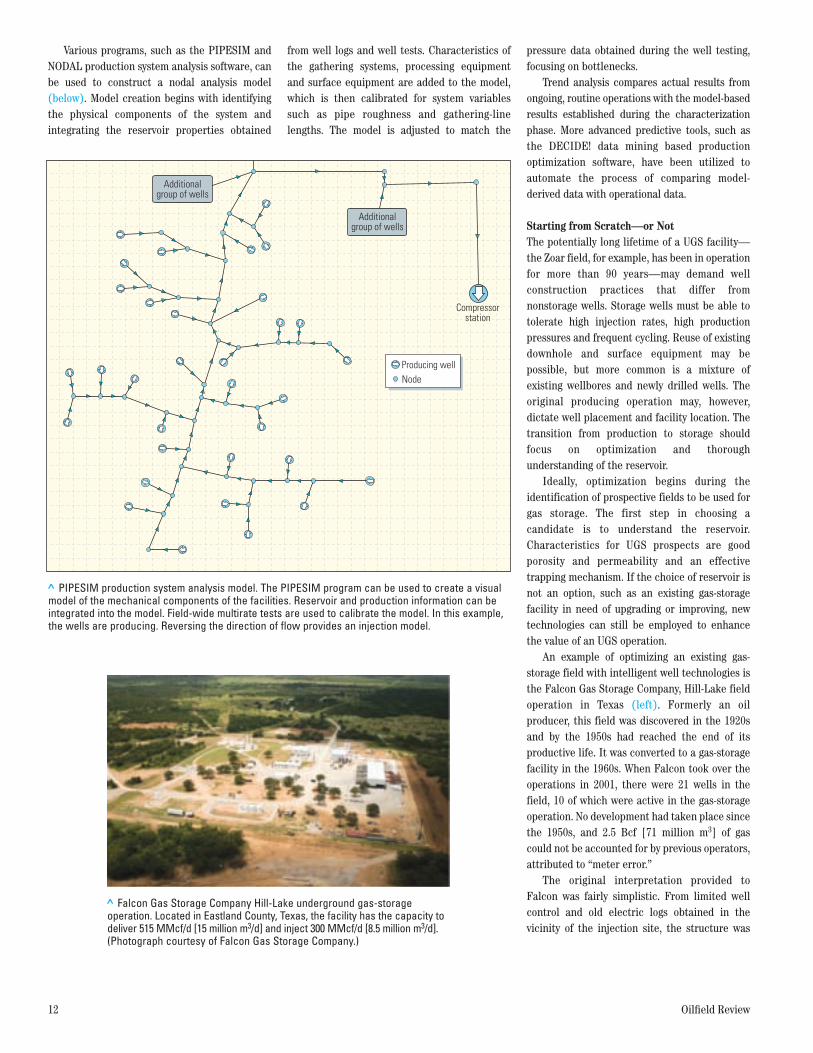
Various programs, such as the PIPESIM andNODAL production system analysis software, canbe used to construct a nodal analysis model(below). Model creation begins with identifyingthe physical components of the system andintegrating the reservoir properties obtained
from well logs and well tests. Characteristics ofthe gathering systems, pro cessing equipmentand surface equipment are added to the model,which is then calibrated for system variablessuch as pipe roughness and gathering-linelengths. The model is adjusted to match the
pressure data obtained during the well testing,focusing on bottlenecks.
Trend analysis compares actual results fromongoing, routine operations with the model-basedresults established during the character izationphase. More advanced predictive tools, such asthe DECIDE! data mining based productionoptimization software, have been utilized toautomate the process of comparing model-derived data with operational data.
Starting from Scratch—or Not The potentially long lifetime of a UGS facility—the Zoar field, for example, has been in operationfor more than 90 years—may demand wellconstruction practices that differ fromnonstorage wells. Storage wells must be able totolerate high injection rates, high productionpressures and frequent cycling. Reuse of existingdownhole and surface equipment may bepossible, but more common is a mixture ofexisting wellbores and newly drilled wells. Theoriginal producing operation may, however,dictate well placement and facility location. Thetransition from production to storage shouldfocus on optimization and thoroughunderstanding of the reservoir.
Ideally, optimization begins during theidentification of prospective fields to be used forgas storage. The first step in choosing acandidate is to understand the reservoir.Characteristics for UGS prospects are goodporosity and permeability and an effectivetrapping mechanism. If the choice of reservoir isnot an option, such as an existing gas-storagefacility in need of upgrading or improving, newtechnologies can still be employed to enhancethe value of an UGS operation.
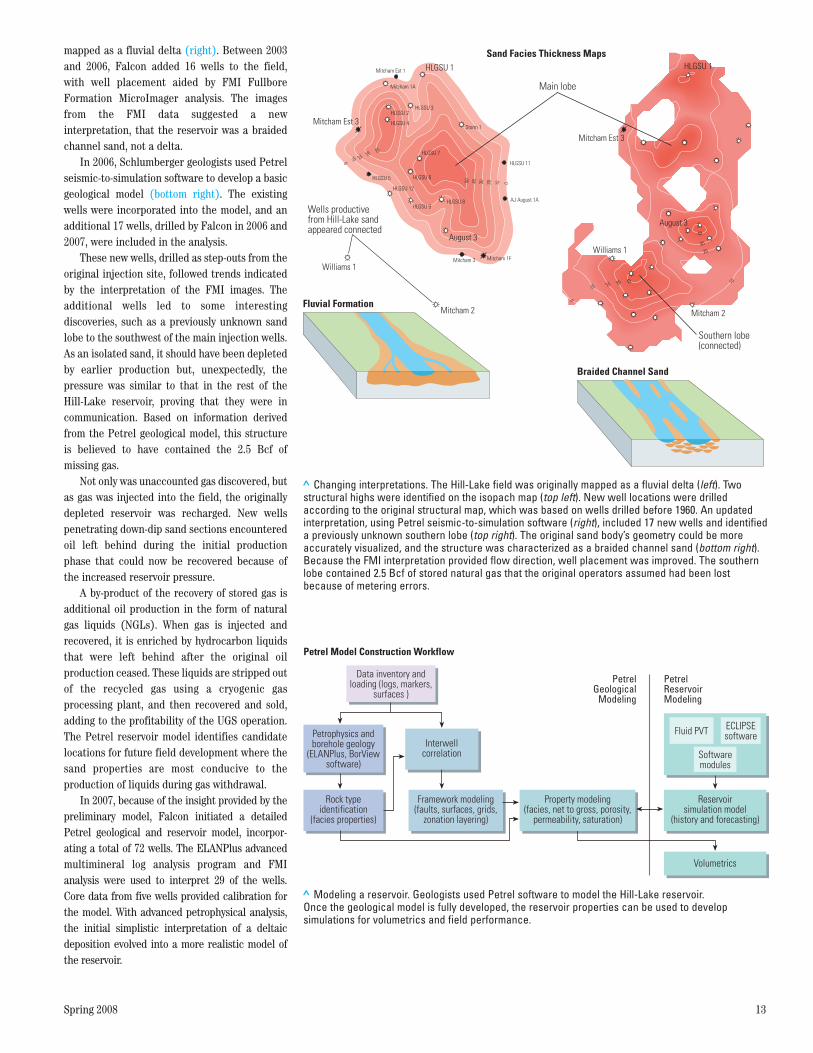
An example of optimizing an existing gas-storage field with intelligent well technologies isthe Falcon Gas Storage Company, Hill-Lake fieldoperation in Texas (left). Formerly an oilproducer, this field was discovered in the 1920sand by the 1950s had reached the end of itsproductive life. It was converted to a gas-storagefacility in the 1960s. When Falcon took over theoperations in 2001, there were 21 wells in thefield, 10 of which were active in the gas-storageoperation. No development had taken place sincethe 1950s, and 2.5 Bcf [71 million m3] of gascould not be accounted for by previous operators,attributed to “meter error.”
The original interpretation provided toFalcon was fairly simplistic. From limited wellcontrol and old electric logs obtained in thevicinity of the injection site, the structure was
12 Oilfield Review
> PIPESIM production system analysis model. The PIPESIM program can be used to create a visualmodel of the mechanical components of the facilities. Reservoir and production information can beintegrated into the model. Field-wide multirate tests are used to calibrate the model. In this example,the wells are producing. Reversing the direction of flow provides an injection model.
Compressorstation
NodeProducing well
Additionalgroup of wells
Additionalgroup of wells
> Falcon Gas Storage Company Hill-Lake underground gas-storageoperation. Located in Eastland County, Texas, the facility has the capacity todeliver 515 MMcf/d [15 million m3/d] and inject 300 MMcf/d [8.5 million m3/d].(Photograph courtesy of Falcon Gas Storage Company.)
61459schD4R1.qxp:Format Layout V7.2 5/15/08 9:02 AM Page 12
Spring 2008 13
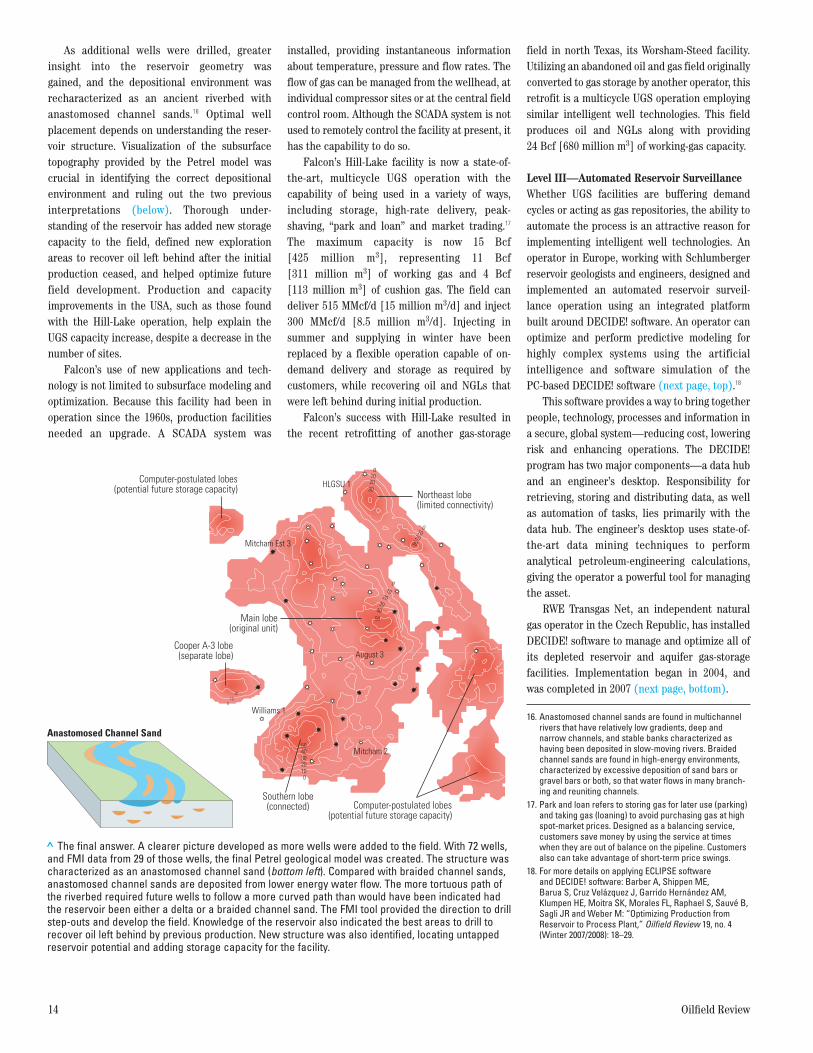
mapped as a fluvial delta (right). Between 2003and 2006, Falcon added 16 wells to the field, with well placement aided by FMI FullboreFormation MicroImager analysis. The imagesfrom the FMI data suggested a newinterpretation, that the reservoir was a braidedchannel sand, not a delta.
In 2006, Schlumberger geologists used Petrelseismic-to-simulation software to develop a basicgeological model (bottom right). The existingwells were incorporated into the model, and anadditional 17 wells, drilled by Falcon in 2006 and2007, were included in the analysis.
These new wells, drilled as step-outs from theoriginal injection site, followed trends indicatedby the interpretation of the FMI images. Theadditional wells led to some interestingdiscoveries, such as a previously unknown sandlobe to the southwest of the main injection wells.As an isolated sand, it should have been depletedby earlier production but, unexpectedly, thepressure was similar to that in the rest of theHill-Lake reservoir, proving that they were incommunication. Based on information derivedfrom the Petrel geological model, this structureis believed to have contained the 2.5 Bcf ofmissing gas.
Not only was unaccounted gas discovered, butas gas was injected into the field, the originallydepleted reservoir was recharged. New wellspenetrating down-dip sand sections encounteredoil left behind during the initial productionphase that could now be recovered because ofthe increased reservoir pressure.
A by-product of the recovery of stored gas isadditional oil production in the form of naturalgas liquids (NGLs). When gas is injected andrecovered, it is enriched by hydrocarbon liquidsthat were left behind after the original oilproduction ceased. These liquids are stripped outof the recycled gas using a cryogenic gasprocessing plant, and then recovered and sold,adding to the profitability of the UGS operation.The Petrel reservoir model identifies candidatelocations for future field development where thesand properties are most conducive to theproduction of liquids during gas withdrawal.
In 2007, because of the insight provided by thepreliminary model, Falcon initiated a detailedPetrel geological and reservoir model, incorpo r -ating a total of 72 wells. The ELANPlus advancedmultimineral log analysis program and FMIanalysis were used to interpret 29 of the wells.Core data from five wells provided calibration forthe model. With advanced petrophysical analysis,the initial simplistic interpretation of a deltaicdeposition evolved into a more realistic model ofthe reservoir.
> Changing interpretations. The Hill-Lake field was originally mapped as a fluvial delta (left). Twostructural highs were identified on the isopach map (top left). New well locations were drilledaccording to the original structural map, which was based on wells drilled before 1960. An updatedinterpretation, using Petrel seismic-to-simulation software (right), included 17 new wells and identifieda previously unknown southern lobe (top right). The original sand body’s geometry could be moreaccurately visualized, and the structure was characterized as a braided channel sand (bottom right).Because the FMI interpretation provided flow direction, well placement was improved. The southernlobe contained 2.5 Bcf of stored natural gas that the original operators assumed had been lostbecause of metering errors.
Fluvial Formation
Braided Channel Sand
Wells productivefrom Hill-Lake sandappeared connected
Mitcham Est 1
HLGSU 11
AJ August 1A
Storm 1
Mitcham 1A
HLGSU 1
Mitcham 3 Mitcham 1F
August 3
HLGSU 3HLGSU 2
HLGSU 4Mitcham Est 3
HLGSU 7
HLGSU 6HLGSU 5
HLGSU 12
HLGSU 9HLGSU 8
Williams 1
Mitcham 2
50 40 30 20 10 0
40302010
0
Mitcham 2
Williams 1
August 3
Mitcham Est 3
HLGSU 1
Main lobe
Sand Facies Thickness Maps
Southern lobe(connected)
40302010
0
10
2030
40
> Modeling a reservoir. Geologists used Petrel software to model the Hill-Lake reservoir. Once the geological model is fully developed, the reservoir properties can be used to developsimulations for volumetrics and field performance.
Data inventory andloading (logs, markers,
surfaces )
Petrophysics andborehole geology
(ELANPlus, BorViewsoftware)
Interwellcorrelation
Rock typeidentification
(facies properties)
Framework modeling(faults, surfaces, grids,
zonation layering)
Property modeling(facies, net to gross, porosity,
permeability, saturation)
PetrelGeological
Modeling
PetrelReservoirModeling
Reservoirsimulation model
(history and forecasting)
Volumetrics
Softwaremodules
Fluid PVT ECLIPSEsoftware
Petrel Model Construction Workflow
61459schD4R1.qxp:Format Layout V7.2 5/15/08 9:02 AM Page 13
As additional wells were drilled, greaterinsight into the reservoir geometry was gained, and the depositional environment wasrecharacterized as an ancient riverbed withanastomosed channel sands.16 Optimal wellplacement depends on understanding the reser -voir structure. Visualization of the subsurfacetopography provided by the Petrel model wascrucial in identifying the correct depositionalenvironment and ruling out the two previousinterpretations (below). Thorough under -standing of the reservoir has added new storagecapacity to the field, defined new explorationareas to recover oil left behind after the initialproduction ceased, and helped optimize futurefield development. Production and capacityimprovements in the USA, such as those foundwith the Hill-Lake operation, help explain theUGS capacity increase, despite a decrease in thenumber of sites.
Falcon’s use of new applications and tech -nology is not limited to subsurface modeling andoptimization. Because this facility had been inoperation since the 1960s, production facilitiesneeded an upgrade. A SCADA system was
installed, providing instantaneous informationabout temperature, pressure and flow rates. Theflow of gas can be managed from the wellhead, atindividual compressor sites or at the central fieldcontrol room. Although the SCADA system is notused to remotely control the facility at present, ithas the capability to do so.
Falcon’s Hill-Lake facility is now a state-of-the-art, multicycle UGS operation with thecapability of being used in a variety of ways,including storage, high-rate delivery, peak-shaving, “park and loan” and market trading.17
The maximum capacity is now 15 Bcf[425 million m3], representing 11 Bcf[311 million m3] of working gas and 4 Bcf[113 million m3] of cushion gas. The field candeliver 515 MMcf/d [15 million m3/d] and inject300 MMcf/d [8.5 million m3/d]. Injecting insummer and supplying in winter have beenreplaced by a flexible operation capable of on-demand delivery and storage as required bycustomers, while recovering oil and NGLs thatwere left behind during initial production.
Falcon’s success with Hill-Lake resulted inthe recent retrofitting of another gas-storage
field in north Texas, its Worsham-Steed facility.Utilizing an abandoned oil and gas field originallyconverted to gas storage by another operator, thisretrofit is a multicycle UGS operation employingsimilar intelligent well technologies. This fieldproduces oil and NGLs along with providing24 Bcf [680 million m3] of working-gas capacity.
Level III—Automated Reservoir SurveillanceWhether UGS facilities are buffering demandcycles or acting as gas repositories, the ability toautomate the process is an attractive reason forimplementing intelligent well technologies. Anoperator in Europe, working with Schlumbergerreservoir geologists and engineers, designed andimplemented an automated reservoir surveil -lance operation using an integrated platformbuilt around DECIDE! software. An operator canoptimize and perform predictive modeling forhighly complex systems using the artificialintelligence and software simulation of the PC-based DECIDE! software (next page, top).18
This software provides a way to bring togetherpeople, technology, processes and information ina secure, global system—reducing cost, loweringrisk and enhancing operations. The DECIDE!program has two major components—a data huband an engineer’s desktop. Responsibility forretrieving, storing and distributing data, as wellas automation of tasks, lies primarily with thedata hub. The engineer’s desktop uses state-of-the-art data mining techniques to performanalytical petroleum-engineering calculations,giving the operator a powerful tool for managingthe asset.
RWE Transgas Net, an independent naturalgas operator in the Czech Republic, has installedDECIDE! software to manage and optimize all ofits depleted reservoir and aquifer gas-storagefacilities. Implementation began in 2004, andwas completed in 2007 (next page, bottom).
14 Oilfield Review
16. Anastomosed channel sands are found in multichannelrivers that have relatively low gradients, deep and narrow channels, and stable banks characterized ashaving been deposited in slow-moving rivers. Braidedchannel sands are found in high-energy environments,characterized by excessive deposition of sand bars orgravel bars or both, so that water flows in many branch-ing and reuniting channels.
17. Park and loan refers to storing gas for later use (parking)and taking gas (loaning) to avoid purchasing gas at highspot-market prices. Designed as a balancing service,customers save money by using the service at timeswhen they are out of balance on the pipeline. Customersalso can take advantage of short-term price swings.
18. For more details on applying ECLIPSE softwareand DECIDE! software: Barber A, Shippen ME, Barua S, Cruz Velázquez J, Garrido Hernández AM,Klumpen HE, Moitra SK, Morales FL, Raphael S, Sauvé B,Sagli JR and Weber M: “Optimizing Production fromReservoir to Process Plant,” Oilfield Review 19, no. 4(Winter 2007/2008): 18–29.
> The final answer. A clearer picture developed as more wells were added to the field. With 72 wells,and FMI data from 29 of those wells, the final Petrel geological model was created. The structure wascharacterized as an anastomosed channel sand (bottom left). Compared with braided channel sands,anastomosed channel sands are deposited from lower energy water flow. The more tortuous path ofthe riverbed required future wells to follow a more curved path than would have been indicated hadthe reservoir been either a delta or a braided channel sand. The FMI tool provided the direction to drillstep-outs and develop the field. Knowledge of the reservoir also indicated the best areas to drill torecover oil left behind by previous production. New structure was also identified, locating untappedreservoir potential and adding storage capacity for the facility.
Anastomosed Channel Sand
Computer-postulated lobes(potential future storage capacity)
Computer-postulated lobes(potential future storage capacity)
Main lobe(original unit)
Cooper A-3 lobe(separate lobe)
Northeast lobe(limited connectivity)
30
504030
2010
0
010
20
2010
0
302010
0
HLGSU 1
Mitcham Est 3
August 3
Mitcham 2
Williams 1
Southern lobe(connected)
5040302010 0
61459schD4R1.qxp:Format Layout V7.2 6/25/08 6:24 PM Page 14
Spring 2008 15
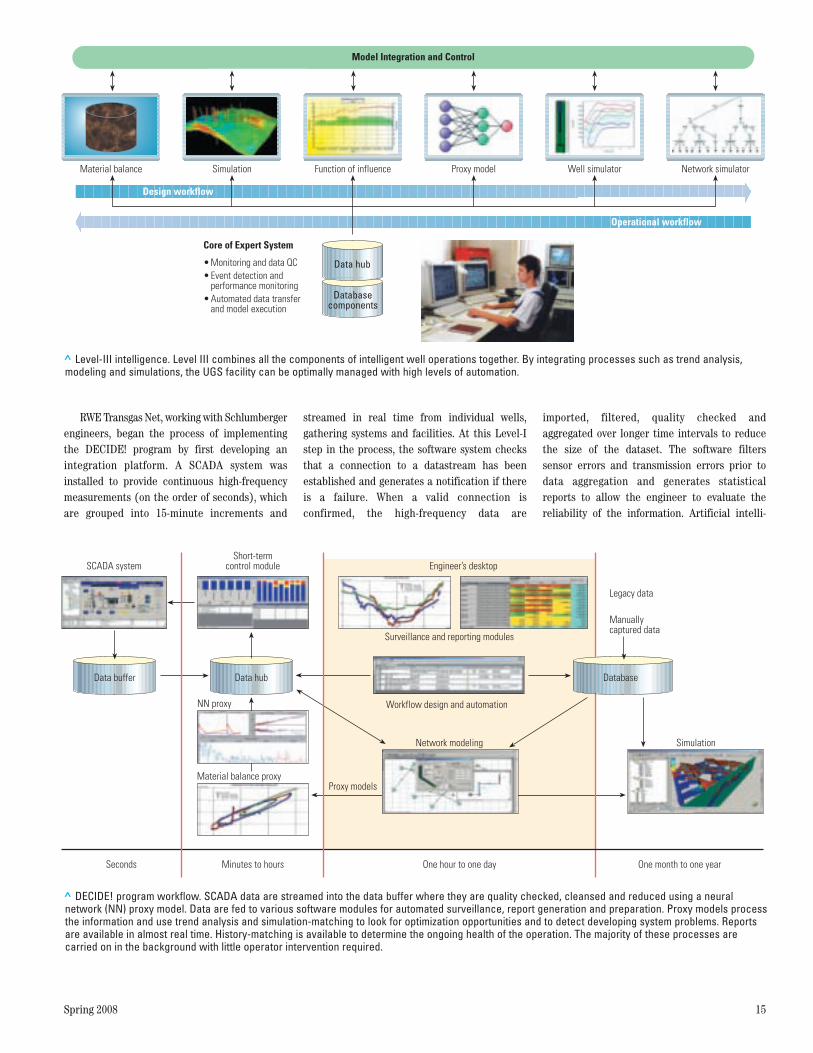
RWE Transgas Net, working with Schlumbergerengineers, began the process of implementingthe DECIDE! program by first developing anintegration platform. A SCADA system wasinstalled to provide continuous high-frequencymeasurements (on the order of seconds), whichare grouped into 15-minute increments and
streamed in real time from individual wells,gathering systems and facilities. At this Level-Istep in the process, the software system checksthat a connection to a datastream has beenestablished and generates a notifi cation if thereis a failure. When a valid connection isconfirmed, the high-frequency data are
imported, filtered, quality checked andaggregated over longer time intervals to reducethe size of the dataset. The software filterssensor errors and transmission errors prior todata aggregation and generates statisticalreports to allow the engineer to evaluate thereliability of the information. Artificial intelli -
> DECIDE! program workflow. SCADA data are streamed into the data buffer where they are quality checked, cleansed and reduced using a neuralnetwork (NN) proxy model. Data are fed to various software modules for automated surveillance, report generation and preparation. Proxy models processthe information and use trend analysis and simulation-matching to look for optimization opportunities and to detect developing system problems. Reportsare available in almost real time. History-matching is available to determine the ongoing health of the operation. The majority of these processes arecarried on in the background with little operator intervention required.
Engineer’s desktopSCADA systemShort-term
control module
Surveillance and reporting modules
Manuallycaptured data
Workflow design and automation
Network modeling Simulation
NN proxy
Material balance proxy
Data buffer Data hub
Proxy models
Database
Seconds Minutes to hours One hour to one day One month to one year
Legacy data
> Level-III intelligence. Level III combines all the components of intelligent well operations together. By integrating processes such as trend analysis,modeling and simulations, the UGS facility can be optimally managed with high levels of automation.
Data hub
Databasecomponents
Core of Expert System
• Monitoring and data QC• Event detection and performance monitoring• Automated data transfer and model execution
Material balance Simulation Function of influence Proxy model Well simulator Network simulator
Operational workflow
Design workflow
Model Integration and Control
61459schD4R1.qxp:Format Layout V7.2 5/15/08 9:02 AM Page 15

gence has been developed to automate theseroutine tasks as well as increase the speed ofdelivery. With the newly acquired data, keyperformance indicators are available to evaluatethe ongoing operation.
At Level II, the cleansed data are fed tosoftware modules to validate proper systemperformance. The DECIDE! program can integrateexternal applications that allow data exchange,including ECLIPSE reservoir simulation software,PIPESIM production system analysis software andvarious modules available in the DECIDE!software. The process automatically conductshistory-matching for trend analysis, providesindividual well status and determines productionand capacity constraints. Current and futuredelivery requests for injection and withdrawal—inputs into a dispatcher’s module—are passed to a DECIDE! software module. This module then provides all the necessary calculations and predictions to ensure that the reservoir has sufficient capacity to meet the dis-patcher’s requests.19
The advanced programs used for the reservoir-surveillance models require computer-intensivecalculations. Running optimization iterationscannot provide satisfactory results in therequired time frame using the large volume ofdata, even after the data have been aggregatedand cleansed. Proxy models, although not asaccurate, are substituted for full-scale
simulations and can provide results in seconds or minutes.20
Proxy models, in the form of trained neuralnetworks (NNs) optimized to require a reducednumber of input parameters, use artificialintelligence to mimic large-scale simulators. TheNN learns to behave like the simulator and, oncetrained, it can perform a set of calculations in afraction of a second for a given set of inputparameters. The NN drastically reduces thecomputation time necessary, allowing real-timehistory-matching with the optimized originaloutputs of full-scale numerical models.
An example of the use of a NN is a productionforecast and optimization simulation. If smallchanges of the input parameters are involved,such as tubing-head pressure, a forecast can becalculated immediately, rather than waiting for atime-intensive full simulation to be performed.Multiple iterations can also be run quickly todetermine the best course of action. Additionally,NNs are used to evaluate uncertainties in theinput data provided in the Level-I data-acquisition phase. This speeds up thequality-control and data-cleansing functionsprior to inputting data into the proxy models.
An automated surveillance system comparescalculated results with measured results. Ifinformation from proxy models indicates that awell or surface component has failed to performas expected, an event alarm is triggered and
reported to the operator by way of the engineer’sdesktop. For the parameters that are set totrigger alarms, a deviation range can beestablished and adjusted as required. Once analarm has been triggered, the reservoir engineercan react in a timely manner to investigate thesource of the problem (above).
The level beyond monitoring and surveillanceis Level-III intelligence—an example of thedigital oil field. Although oil companies andservice providers have found it difficult toprovide a single definition for this term, thedigital oil field essentially provides a high level ofautomation, simulation modeling, decision-making tools (the faster, the better) and anintegrated approach that does not lose sight ofthe small details (or at least has a system tomonitor them). Schlumberger refers to this levelof field operation as the BlueField intelligentasset integration service.21
At the BlueField level, data are acquired andprepared for processing, and integrated-simulation models are run from variousperformance modules. System checks are carriedout at the highest level, and reports concerningthe health of the complete operation, usingdeterministic models, are generated anddelivered to the DECIDE! engineer’s desktop(next page). The service provides the ability tooversee scheduled automated tasks or thosetriggered by event alarms.
16 Oilfield Review
> Neural networks (NN) and problem identification. Multiple parameters are required to calculate the bottomhole pressure(BHP). Neural networks, functioning as proxy models, are trained with data from operations and can reduce the total iterationsrequired to produce results in a fraction of the time required by full-scale modeling programs. Measured BHP data (red) duringinjection and withdrawal are compared with NN-derived BHP data (blue). The two sets of data compare very favorably untilSeptember 2000 when the calculated BHP during injection increased and remained higher for the next four months because ofreservoir damage. The higher backpressure indicated well intervention would be required to maintain deliverability.
Measured BHP deviatesfrom calculated BHP
Pres
sure
, MPa
85
80
75
70
65
55
50
Jan 1999 April July Oct Jan 2000 April July Oct Jan 2001Time
Calculated BHPMeasured BHP
NN Architecture for Well Model
Reservoir pressure
Aquifer influx
Gas injection
Gas production
19. Onderka V, Dressler M, Severýn O, Giovannoli M andZangl G: “Expert System of UGS—An Efficient Tool forOnline Performance Management and Optimization,”presented at the 23rd World Gas Conference, Amsterdam, June 5–9, 2006.
20. Zangl G, Giovannoli M and Stundner M: “Application ofArtificial Intelligence in Gas Storage Management,”paper SPE 100133, presented at the SPE Europec/EAGE
23. “Supply on Demand,” http://www.falcongasstorage.com/fw/main/MoBay_Storage_Hub_LLC-28.html (accessedJanuary 15, 2008).
24. National Petroleum Council (ed): Hard Truths: Facing theHard Truths about Energy. Washington, DC: NationalPetroleum Council (2007): 36.
Annual Conference and Exhibition, Vienna, Austria, June 12–15, 2006.
21. Bouleau et al, reference 7.22. Foh SE: “The Use of Inert Gas as Cushion Gas in
Underground Storage: Practical and Economic Issues,”presented at the Gas Supply Planning and Management:1991 and Beyond Conference, Lake Buena Vista, Florida,USA, February 25–27, 1991.
61459schD4R1.qxp:Format Layout V7.2 5/15/08 9:02 AM Page 16
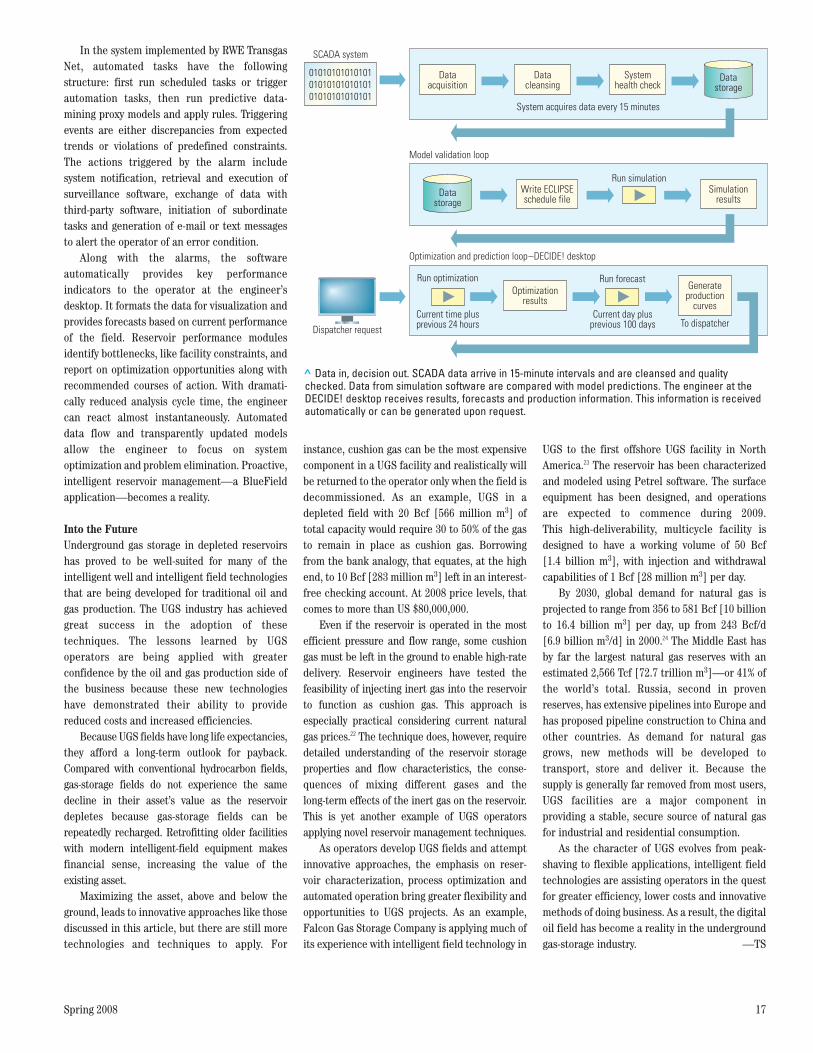
Spring 2008 17
In the system implemented by RWE TransgasNet, automated tasks have the followingstructure: first run scheduled tasks or triggerautomation tasks, then run predictive data-mining proxy models and apply rules. Triggeringevents are either discrepancies from expectedtrends or violations of predefined constraints.The actions triggered by the alarm includesystem notification, retrieval and execution ofsurveillance software, exchange of data withthird-party software, initiation of subordinatetasks and generation of e-mail or text messagesto alert the operator of an error condition.
Along with the alarms, the softwareautomatically provides key performanceindicators to the operator at the engineer’sdesktop. It formats the data for visualization andprovides forecasts based on current performanceof the field. Reservoir performance modulesidentify bottlenecks, like facility constraints, andreport on optimization opportunities along withrecommended courses of action. With dramati -cally reduced analysis cycle time, the engineercan react almost instantaneously. Automateddata flow and transparently updated modelsallow the engineer to focus on systemoptimization and problem elimination. Proactive,intelligent reservoir management—a BlueFieldapplication—becomes a reality.
Into the FutureUnderground gas storage in depleted reservoirshas proved to be well-suited for many of theintelligent well and intelligent field technologiesthat are being developed for traditional oil andgas production. The UGS industry has achievedgreat success in the adoption of thesetechniques. The lessons learned by UGSoperators are being applied with greaterconfidence by the oil and gas production side ofthe business because these new technologieshave demonstrated their ability to providereduced costs and increased efficiencies.
Because UGS fields have long life expec tancies,they afford a long-term outlook for payback.Compared with conventional hydrocarbon fields,gas-storage fields do not experience the samedecline in their asset’s value as the reservoirdepletes because gas-storage fields can berepeatedly recharged. Retrofitting older facilitieswith modern intelligent-field equipment makesfinancial sense, increasing the value of the existing asset.
Maximizing the asset, above and below theground, leads to innovative approaches like thosediscussed in this article, but there are still moretechnologies and techniques to apply. For
instance, cushion gas can be the most expensivecomponent in a UGS facility and realistically willbe returned to the operator only when the field isdecommissioned. As an example, UGS in adepleted field with 20 Bcf [566 million m3] oftotal capacity would require 30 to 50% of the gasto remain in place as cushion gas. Borrowingfrom the bank analogy, that equates, at the highend, to 10 Bcf [283 million m3] left in an interest-free checking account. At 2008 price levels, thatcomes to more than US $80,000,000.
Even if the reservoir is operated in the mostefficient pressure and flow range, some cushiongas must be left in the ground to enable high-ratedelivery. Reservoir engineers have tested thefeasibility of injecting inert gas into the reservoirto function as cushion gas. This approach isespecially practical considering current naturalgas prices.22 The technique does, however, requiredetailed understanding of the reservoir storageproperties and flow characteristics, the conse -quences of mixing different gases and thelong-term effects of the inert gas on the reservoir.This is yet another example of UGS operatorsapplying novel reservoir management techniques.
As operators develop UGS fields and attemptinnovative approaches, the emphasis on reser -voir characterization, process optimization andautomated operation bring greater flexibility andopportunities to UGS projects. As an example,Falcon Gas Storage Company is applying much ofits experience with intelligent field technology in
UGS to the first offshore UGS facility in NorthAmerica.23 The reservoir has been characterizedand modeled using Petrel software. The surfaceequipment has been designed, and operationsare expected to commence during 2009. This high-deliverability, multicycle facility isdesigned to have a working volume of 50 Bcf [1.4 billion m3], with injection and withdrawalcapabilities of 1 Bcf [28 million m3] per day.
By 2030, global demand for natural gas isprojected to range from 356 to 581 Bcf [10 billionto 16.4 billion m3] per day, up from 243 Bcf/d [6.9 billion m3/d] in 2000.24 The Middle East hasby far the largest natural gas reserves with anestimated 2,566 Tcf [72.7 trillion m3]—or 41% ofthe world’s total. Russia, second in provenreserves, has extensive pipelines into Europe andhas proposed pipeline construction to China andother countries. As demand for natural gasgrows, new methods will be developed totransport, store and deliver it. Because thesupply is generally far removed from most users,UGS facilities are a major component inproviding a stable, secure source of natural gasfor industrial and residential consumption.
As the character of UGS evolves from peak-shaving to flexible applications, intelligent fieldtechnologies are assisting operators in the questfor greater efficiency, lower costs and innovativemethods of doing business. As a result, the digitaloil field has become a reality in the undergroundgas-storage industry. —TS
> Data in, decision out. SCADA data arrive in 15-minute intervals and are cleansed and qualitychecked. Data from simulation software are compared with model predictions. The engineer at theDECIDE! desktop receives results, forecasts and production information. This information is receivedautomatically or can be generated upon request.
SCADA system
System acquires data every 15 minutes
Dataacquisition
Datacleansing
Systemhealth check
Datastorage
010101010101010101010101010101010101010101
Run simulationWrite ECLIPSEschedule file
Datastorage
Simulationresults
Model validation loop
Run forecastRun optimization
Current day plusprevious 100 days To dispatcher
Current time plusprevious 24 hoursDispatcher request
Optimization and prediction loop–DECIDE! desktop
Generateproduction
curvesOptimization
results
61459schD4R1.qxp:Format Layout V7.2 5/15/08 9:02 AM Page 17
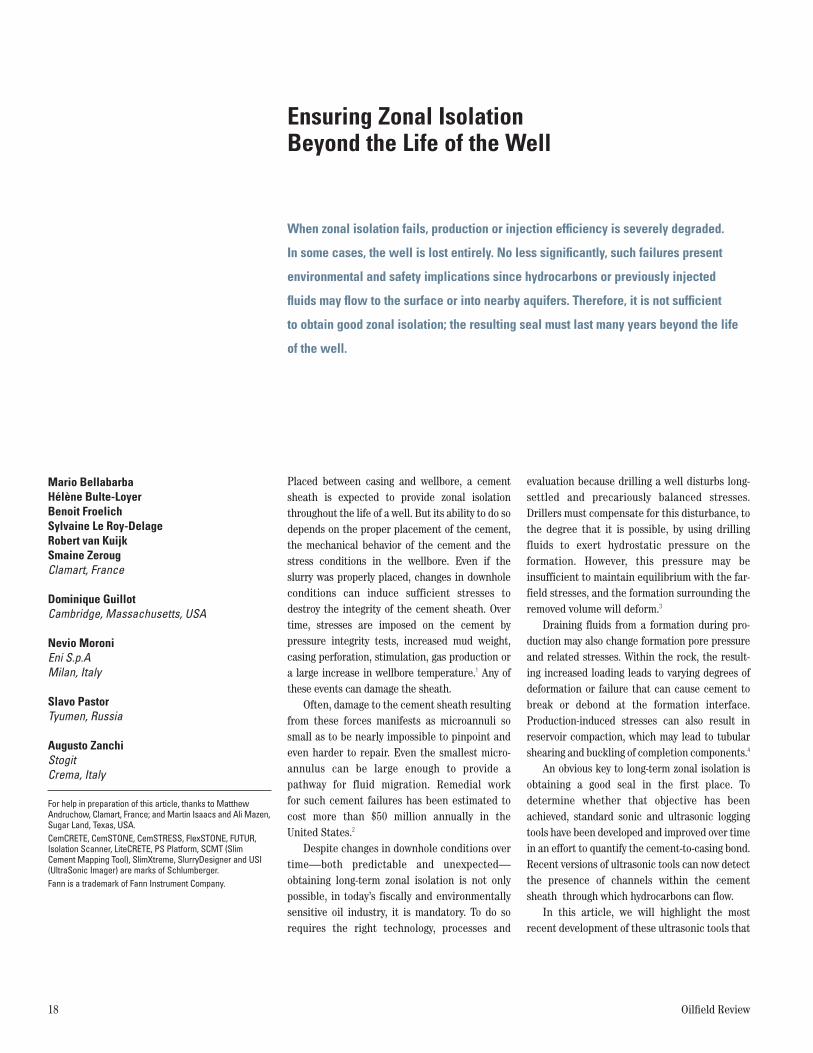
18 Oilfield Review
Ensuring Zonal Isolation Beyond the Life of the Well
Mario BellabarbaHélène Bulte-LoyerBenoit FroelichSylvaine Le Roy-Delage Robert van KuijkSmaine ZerougClamart, France
Dominique GuillotCambridge, Massachusetts, USA
Nevio MoroniEni S.p.AMilan, Italy
Slavo PastorTyumen, Russia
Augusto ZanchiStogitCrema, Italy
For help in preparation of this article, thanks to MatthewAndruchow, Clamart, France; and Martin Isaacs and Ali Mazen,Sugar Land, Texas, USA.CemCRETE, CemSTONE, CemSTRESS, FlexSTONE, FUTUR,Isolation Scanner, LiteCRETE, PS Platform, SCMT (SlimCement Mapping Tool), SlimXtreme, SlurryDesigner and USI(UltraSonic Imager) are marks of Schlumberger.Fann is a trademark of Fann Instrument Company.
When zonal isolation fails, production or injection efficiency is severely degraded.
In some cases, the well is lost entirely. No less significantly, such failures present
environmental and safety implications since hydrocarbons or previously injected
fluids may flow to the surface or into nearby aquifers. Therefore, it is not sufficient
to obtain good zonal isolation; the resulting seal must last many years beyond the life
of the well.
Placed between casing and wellbore, a cementsheath is expected to provide zonal isolationthroughout the life of a well. But its ability to do sodepends on the proper placement of the cement,the mechanical behavior of the cement and thestress conditions in the wellbore. Even if theslurry was properly placed, changes in downholeconditions can induce sufficient stresses todestroy the integrity of the cement sheath. Overtime, stresses are imposed on the cement bypressure integrity tests, increased mud weight,casing perforation, stimulation, gas production ora large increase in wellbore temperature.1 Any ofthese events can damage the sheath.
Often, damage to the cement sheath resultingfrom these forces manifests as microannuli sosmall as to be nearly impossible to pinpoint andeven harder to repair. Even the smallest micro -annulus can be large enough to provide apathway for fluid migration. Remedial work for such cement failures has been estimated tocost more than $50 million annually in theUnited States.2
Despite changes in downhole conditions overtime—both predictable and unexpected—obtaining long-term zonal isolation is not onlypossible, in today’s fiscally and environmentallysensitive oil industry, it is mandatory. To do sorequires the right technology, processes and
evaluation because drilling a well disturbs long-settled and precariously balanced stresses.Drillers must compensate for this disturbance, tothe degree that it is possible, by using drillingfluids to exert hydrostatic pressure on theformation. However, this pressure may beinsufficient to maintain equilibrium with the far-field stresses, and the formation surrounding theremoved volume will deform.3
Draining fluids from a formation during pro -duction may also change formation pore pressureand related stresses. Within the rock, the result -ing increased loading leads to varying degrees ofdeformation or failure that can cause cement tobreak or debond at the formation interface.Production-induced stresses can also result inreservoir compaction, which may lead to tubularshearing and buckling of completion components.4
An obvious key to long-term zonal isolation isobtaining a good seal in the first place. Todetermine whether that objective has beenachieved, standard sonic and ultrasonic loggingtools have been developed and improved over timein an effort to quantify the cement-to-casing bond.Recent versions of ultrasonic tools can now detectthe presence of channels within the cementsheath through which hydrocarbons can flow.
In this article, we will highlight the mostrecent development of these ultrasonic tools that
61459schD5R1.qxp:61459schD5R1 5/20/08 3:05 AM Page 18
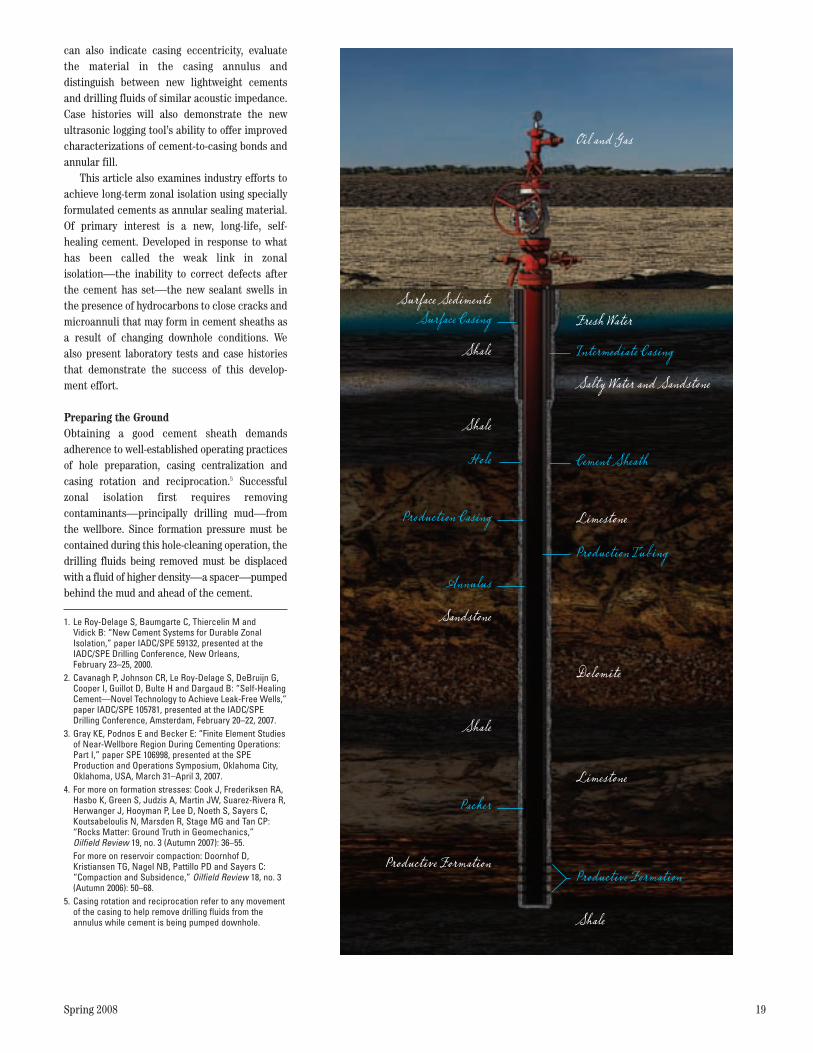
Spring 2008 19
can also indicate casing eccentricity, evaluatethe material in the casing annulus anddistinguish between new lightweight cementsand drilling fluids of similar acoustic impedance.Case histories will also demonstrate the newultrasonic logging tool’s ability to offer improvedcharacterizations of cement-to-casing bonds andannular fill.
This article also examines industry efforts toachieve long-term zonal isolation using speciallyformulated cements as annular sealing material.Of primary interest is a new, long-life, self-healing cement. Developed in response to whathas been called the weak link in zonalisolation—the inability to correct defects afterthe cement has set—the new sealant swells inthe presence of hydrocarbons to close cracks andmicroannuli that may form in cement sheaths asa result of changing downhole conditions. Wealso present laboratory tests and case historiesthat demonstrate the success of this develop -ment effort.
Preparing the Ground Obtaining a good cement sheath demandsadherence to well-established operating practicesof hole preparation, casing centralization andcasing rotation and reciprocation.5 Successfulzonal isolation first requires removingcontaminants—principally drilling mud—fromthe wellbore. Since formation pressure must becontained during this hole-cleaning operation, thedrilling fluids being removed must be displacedwith a fluid of higher density—a spacer—pumpedbehind the mud and ahead of the cement.
1. Le Roy-Delage S, Baumgarte C, Thiercelin M andVidick B: “New Cement Systems for Durable ZonalIsolation,” paper IADC/SPE 59132, presented at theIADC/SPE Drilling Conference, New Orleans,February 23–25, 2000.
2. Cavanagh P, Johnson CR, Le Roy-Delage S, DeBruijn G,Cooper I, Guillot D, Bulte H and Dargaud B: “Self-HealingCement—Novel Technology to Achieve Leak-Free Wells,”paper IADC/SPE 105781, presented at the IADC/SPEDrilling Conference, Amsterdam, February 20–22, 2007.
3. Gray KE, Podnos E and Becker E: “Finite Element Studiesof Near-Wellbore Region During Cementing Operations:Part I,” paper SPE 106998, presented at the SPEProduction and Operations Symposium, Oklahoma City,Oklahoma, USA, March 31–April 3, 2007.
4. For more on formation stresses: Cook J, Frederiksen RA,Hasbo K, Green S, Judzis A, Martin JW, Suarez-Rivera R,Herwanger J, Hooyman P, Lee D, Noeth S, Sayers C,Koutsabeloulis N, Marsden R, Stage MG and Tan CP:“Rocks Matter: Ground Truth in Geomechanics,” Oilfield Review 19, no. 3 (Autumn 2007): 36–55.For more on reservoir compaction: Doornhof D,Kristiansen TG, Nagel NB, Pattillo PD and Sayers C:“Compaction and Subsidence,” Oilfield Review 18, no. 3(Autumn 2006): 50–68.
5. Casing rotation and reciprocation refer to any movementof the casing to help remove drilling fluids from theannulus while cement is being pumped downhole.
Oil and Gas
Surface SedimentsSurface Casing
Shale
Shale
Sandstone
Shale
Productive Formation
Fresh Water
Salty Water and Sandstone
Intermediate Casing
Cement Sheath
Limestone
Dolomite
Limestone
Shale
Hole
Production Casing
Annulus
Packer
Productive Formation
Production Tubing
61459schD5R1.qxp:61459schD5R1 5/21/08 3:24 PM Page 19
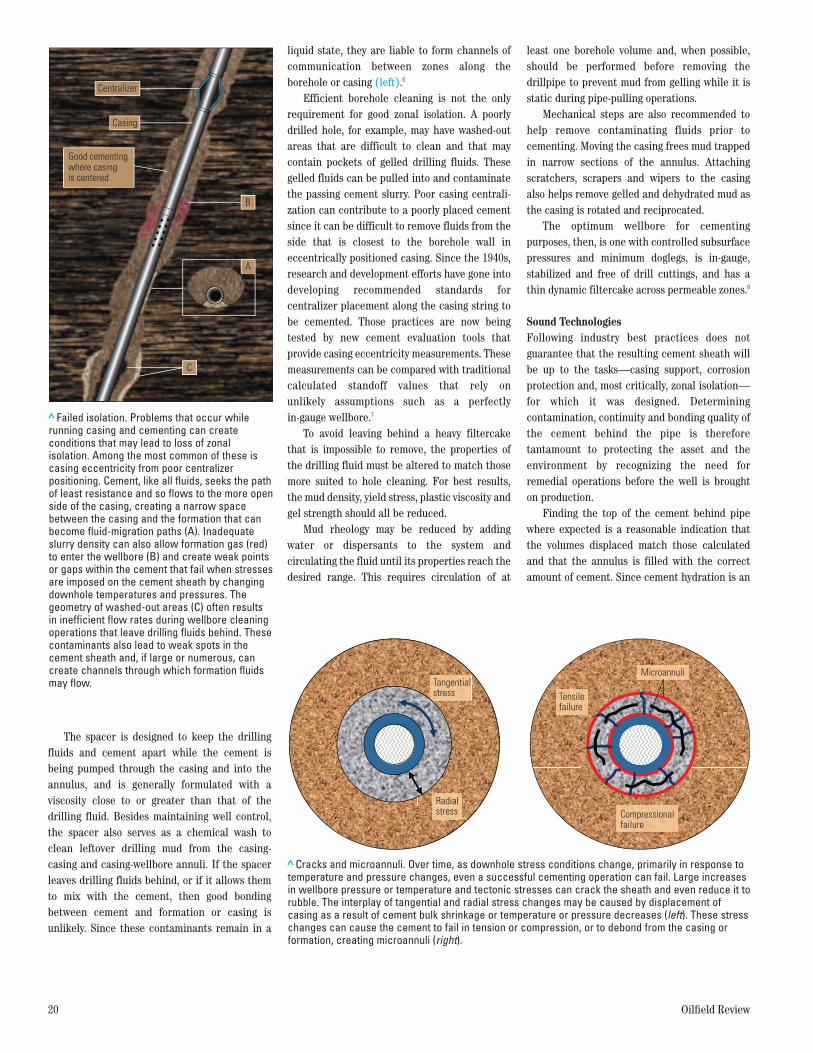
The spacer is designed to keep the drillingfluids and cement apart while the cement isbeing pumped through the casing and into theannulus, and is generally formulated with aviscosity close to or greater than that of thedrilling fluid. Besides maintaining well control,the spacer also serves as a chemical wash toclean leftover drilling mud from the casing-casing and casing-wellbore annuli. If the spacerleaves drilling fluids behind, or if it allows themto mix with the cement, then good bondingbetween cement and formation or casing isunlikely. Since these contaminants remain in a
liquid state, they are liable to form channels ofcommunication between zones along theborehole or casing (left).6
Efficient borehole cleaning is not the onlyrequirement for good zonal isolation. A poorlydrilled hole, for example, may have washed-outareas that are difficult to clean and that maycontain pockets of gelled drilling fluids. Thesegelled fluids can be pulled into and contaminatethe passing cement slurry. Poor casing centrali -zation can contribute to a poorly placed cementsince it can be difficult to remove fluids from theside that is closest to the borehole wall ineccentrically positioned casing. Since the 1940s,research and development efforts have gone intodeveloping recommended standards forcentralizer placement along the casing string tobe cemented. Those practices are now beingtested by new cement evaluation tools thatprovide casing eccentricity measurements. Thesemeasurements can be compared with traditionalcalculated standoff values that rely on unlikely assumptions such as a perfectly in-gauge wellbore.7
To avoid leaving behind a heavy filtercakethat is impossible to remove, the properties ofthe drilling fluid must be altered to match thosemore suited to hole cleaning. For best results,the mud density, yield stress, plastic viscosity andgel strength should all be reduced.
Mud rheology may be reduced by addingwater or dispersants to the system andcirculating the fluid until its properties reach thedesired range. This requires circulation of at
least one borehole volume and, when possible,should be performed before removing thedrillpipe to prevent mud from gelling while it isstatic during pipe-pulling operations.
Mechanical steps are also recommended tohelp remove contaminating fluids prior tocementing. Moving the casing frees mud trappedin narrow sections of the annulus. Attachingscratchers, scrapers and wipers to the casingalso helps remove gelled and dehydrated mud asthe casing is rotated and reciprocated.
The optimum wellbore for cementingpurposes, then, is one with controlled subsurfacepressures and minimum doglegs, is in-gauge,stabilized and free of drill cuttings, and has athin dynamic filtercake across permeable zones.8
Sound TechnologiesFollowing industry best practices does notguarantee that the resulting cement sheath willbe up to the tasks—casing support, corrosionprotection and, most critically, zonal isolation—for which it was designed. Determiningcon tami nation, continuity and bonding quality ofthe cement behind the pipe is thereforetantamount to protecting the asset and theenvironment by recognizing the need forremedial operations before the well is brought on production.
Finding the top of the cement behind pipewhere expected is a reasonable indication thatthe volumes displaced match those calculatedand that the annulus is filled with the correctamount of cement. Since cement hydration is an
20 Oilfield Review
> Failed isolation. Problems that occur whilerunning casing and cementing can createconditions that may lead to loss of zonalisolation. Among the most common of these iscasing eccentricity from poor centralizerpositioning. Cement, like all fluids, seeks the pathof least resistance and so flows to the more openside of the casing, creating a narrow spacebetween the casing and the formation that canbecome fluid-migration paths (A). Inadequateslurry density can also allow formation gas (red)to enter the wellbore (B) and create weak pointsor gaps within the cement that fail when stressesare imposed on the cement sheath by changingdownhole temperatures and pressures. Thegeometry of washed-out areas (C) often resultsin inefficient flow rates during wellbore cleaningoperations that leave drilling fluids behind. Thesecontaminants also lead to weak spots in thecement sheath and, if large or numerous, cancreate channels through which formation fluidsmay flow.
Centralizer
Good cementingwhere casingis centered
Casing
A
B
C
> Cracks and microannuli. Over time, as downhole stress conditions change, primarily in response totemperature and pressure changes, even a successful cementing operation can fail. Large increasesin wellbore pressure or temperature and tectonic stresses can crack the sheath and even reduce it torubble. The interplay of tangential and radial stress changes may be caused by displacement ofcasing as a result of cement bulk shrinkage or temperature or pressure decreases (left). These stresschanges can cause the cement to fail in tension or compression, or to debond from the casing orformation, creating microannuli (right).
Tangentialstress Tensile
failure
Compressionalfailure
Microannuli
Radialstress
61459schD5R1.qxp:61459schD5R1 5/20/08 3:05 AM Page 20

Spring 2008 21
exothermic reaction, this can be done using atemperature survey. This method, however,reveals little else about the results of thecementing operation.
Hydraulic testing—a common test of zonalisolation—applies internal pressure along theentire casing string. But pressure can expand thecasing, causing the cement sheath to experiencetensile failure. This may lead to radial cracks andlocal debonding of the cement and casing inareas where the cracks are near the casing wall(previous page, bottom).
Because of the limitations of the othertechniques, acoustic logging has become theindustry’s tool of choice for detecting cementbehind casing and assessing the quality of thebonds between casing, cement and formation.Acoustic logs help indicate nonintrusively thedepth interval at which cement has been placedaround the casing, measure acoustic impedanceof the cement bonded to the casing, and quantifythe percentage of pipe circumference bonded to the cement.
These characteristics inform the operator offaults in the cement sheath that may requireremedial measures—commonly a squeezeoperation in which cement is pushed throughperforations into the annulus to fill gaps alonginterfaces at the casing, formation or within theannular material itself.
Cement bond logs (CBLs) and variable densitylogs (VDLs) are acquired using a sonic logging tool(right). Standard CBL tools, which comprise thosethat measure signal amplitude or attenuation, havea common theory of measurement andinterpretation. The principle behind them is tomeasure the amplitude of a sonic signal producedby a transmitter emitting a 10- to 20-kHz acousticwave after it has traveled through a section of thecasing as an extensional mode.9
Measurements are displayed on the CBL login millivolts (mV) or decibel (dB) attenuation, orboth. Increased attenuation indicates betterquality bonding of the cement to the outer casing
6. For more on hole cleaning: Abbas R, Cunningham E,Munk T, Bjelland B, Chukwueke V, Ferri A, Garrison G,Hollies D, Labat C and Moussa O: “Solutions for Long-Term Zonal Isolation,” Oilfield Review 14, no. 3(Autumn 2002): 16–29.
7. Guillot DJ, Froelich B, Caceres E and Verbakel R: “Are Current Casing Centralization Calculations ReallyConservative?” paper IADC/SPE 112725, presented at theIADC/SPE Drilling Conference, Orlando, Florida, USA,March 4–6, 2008.
8. Nelson EB and Guillot D: Well Cementing, 2nd ed. Sugar Land, Texas: Schlumberger, 2006.
9. Morris C, Sabbagh L, Wydrinski R, Hupp J, van Kuijk Rand Froelich B: “Application of Enhanced UltrasonicMeasurements for Cement and Casing Evaluation,”paper SPE/IADC 105648, presented at the SPE/IADCDrilling Conference, Amsterdam, February 20–22, 2007.
> Traditional sonic cement bond log tools. The slim array sonic tool (SSLT) isa digital sonic tool that provides conventional openhole sonic measurements,standard cement bond log (CBL) amplitude and a variable density log (VDL).The SlimXtreme slimhole well logging platform provides the samemeasurements as the SSLT for evaluation of the cement bond quality in high-pressure and high-temperature environments. The digital sonic logging tool(DSLT) uses the sonic logging sonde to measure the cement bond amplitudeand provide a VDL display for evaluation of the cement bond quality. Thehostile environment sonic logging tool (HSLT) provides the samemeasurements of the cement bond amplitude and the same variable densitydisplay as the SSLT in standard wellbore sizes. The SCMT Slim CementMapping Tool is a through-tubing cement evaluation tool combinable withthe PS Platform new-generation production services tool. It is sized so that itmay be used to evaluate the cement behind casing in workover operationswithout having to first pull the tubing.
HSLT
SCMTtool
DSLT
SlimXtremetool
SSLT
61459schD5R1.qxp:61459schD5R1 5/20/08 3:05 AM Page 21
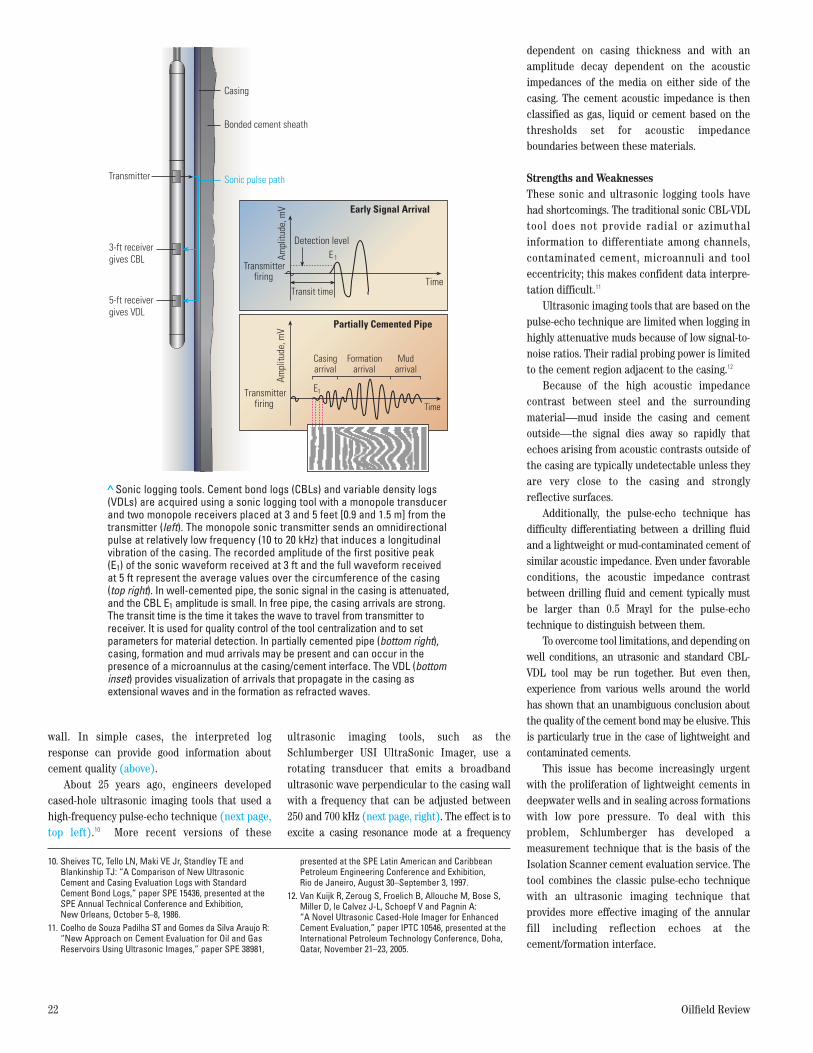
wall. In simple cases, the interpreted logresponse can provide good information aboutcement quality (above).
About 25 years ago, engineers developedcased-hole ultrasonic imaging tools that used ahigh-frequency pulse-echo technique (next page,top left).10 More recent versions of these
ultrasonic imaging tools, such as theSchlumberger USI UltraSonic Imager, use arotating transducer that emits a broadbandultrasonic wave perpendicular to the casing wallwith a frequency that can be adjusted between250 and 700 kHz (next page, right). The effect is toexcite a casing resonance mode at a frequency
dependent on casing thickness and with anamplitude decay dependent on the acousticimpedances of the media on either side of thecasing. The cement acoustic impedance is thenclassified as gas, liquid or cement based on thethresholds set for acoustic impedanceboundaries between these materials.
Strengths and WeaknessesThese sonic and ultrasonic logging tools havehad shortcomings. The traditional sonic CBL-VDLtool does not provide radial or azimuthal information to differentiate among channels,contaminated cement, microannuli and tooleccentricity; this makes confident data interpre-tation difficult.11
Ultrasonic imaging tools that are based on thepulse-echo technique are limited when logging inhighly attenuative muds because of low signal-to-noise ratios. Their radial probing power is limitedto the cement region adjacent to the casing.12
Because of the high acoustic impedancecontrast between steel and the surroundingmaterial—mud inside the casing and cementoutside—the signal dies away so rapidly thatechoes arising from acoustic contrasts outside ofthe casing are typically undetectable unless theyare very close to the casing and stronglyreflective surfaces.
Additionally, the pulse-echo technique hasdifficulty differentiating between a drilling fluidand a lightweight or mud-contaminated cement ofsimilar acoustic impedance. Even under favorableconditions, the acoustic impedance contrastbetween drilling fluid and cement typically mustbe larger than 0.5 Mrayl for the pulse-echotechnique to distinguish between them.
To overcome tool limitations, and depending onwell conditions, an utrasonic and standard CBL-VDL tool may be run together. But even then,experience from various wells around the worldhas shown that an unambiguous conclusion aboutthe quality of the cement bond may be elusive. Thisis particularly true in the case of lightweight andcontaminated cements.
This issue has become increasingly urgentwith the proliferation of lightweight cements indeepwater wells and in sealing across formationswith low pore pressure. To deal with thisproblem, Schlumberger has developed ameasurement technique that is the basis of theIsolation Scanner cement evaluation service. Thetool combines the classic pulse-echo techniquewith an ultrasonic imaging technique thatprovides more effective imaging of the annularfill including reflection echoes at thecement/formation interface.
22 Oilfield Review
10. Sheives TC, Tello LN, Maki VE Jr, Standley TE andBlankinship TJ: “A Comparison of New UltrasonicCement and Casing Evaluation Logs with StandardCement Bond Logs,” paper SPE 15436, presented at theSPE Annual Technical Conference and Exhibition,New Orleans, October 5–8, 1986.
11. Coelho de Souza Padilha ST and Gomes da Silva Araujo R:“New Approach on Cement Evaluation for Oil and GasReservoirs Using Ultrasonic Images,” paper SPE 38981,
presented at the SPE Latin American and CaribbeanPetroleum Engineering Conference and Exhibition, Rio de Janeiro, August 30–September 3, 1997.
12. Van Kuijk R, Zeroug S, Froelich B, Allouche M, Bose S,Miller D, le Calvez J-L, Schoepf V and Pagnin A: “A Novel Ultrasonic Cased-Hole Imager for EnhancedCement Evaluation,” paper IPTC 10546, presented at theInternational Petroleum Technology Conference, Doha,Qatar, November 21–23, 2005.
> Sonic logging tools. Cement bond logs (CBLs) and variable density logs(VDLs) are acquired using a sonic logging tool with a monopole transducerand two monopole receivers placed at 3 and 5 feet [0.9 and 1.5 m] from thetransmitter (left). The monopole sonic transmitter sends an omnidirectionalpulse at relatively low frequency (10 to 20 kHz) that induces a longitudinalvibration of the casing. The recorded amplitude of the first positive peak(E1) of the sonic waveform received at 3 ft and the full waveform receivedat 5 ft represent the average values over the circumference of the casing(top right). In well-cemented pipe, the sonic signal in the casing is attenuated,and the CBL E1 amplitude is small. In free pipe, the casing arrivals are strong.The transit time is the time it takes the wave to travel from transmitter toreceiver. It is used for quality control of the tool centralization and to setparameters for material detection. In partially cemented pipe (bottom right),casing, formation and mud arrivals may be present and can occur in thepresence of a microannulus at the casing/cement interface. The VDL (bottominset) provides visualization of arrivals that propagate in the casing asextensional waves and in the formation as refracted waves.
Transmitter
3-ft receivergives CBL
5-ft receivergives VDL
Casing
Bonded cement sheath
Sonic pulse path
Ampl
itude
, mV
Detection level
Early Signal Arrival
Partially Cemented Pipe
E 1
Transit time
Transmitterfiring Time
Ampl
itude
, mV
Transmitterfiring
Casingarrival
Formationarrival
Mud
Time
E1
arrival
61459schD5R1.qxp:61459schD5R1 6/25/08 7:10 PM Page 22
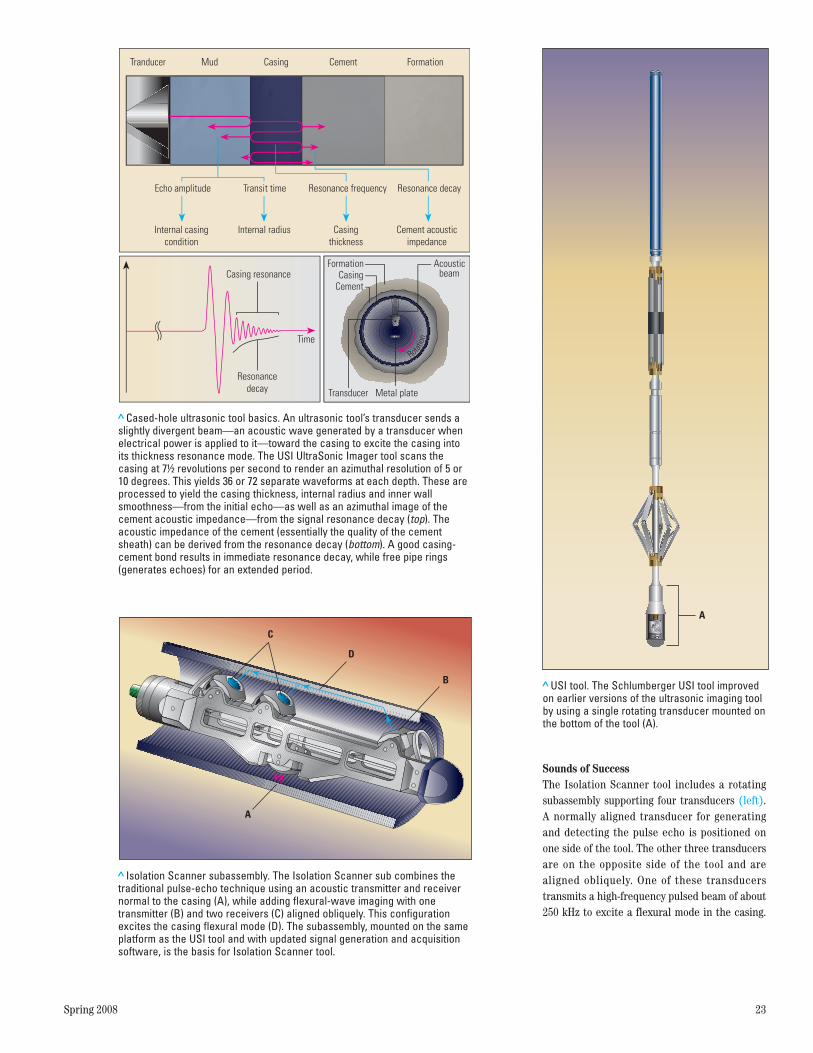
Spring 2008 23
Sounds of SuccessThe Isolation Scanner tool includes a rotatingsubassembly supporting four transducers (left).A normally aligned transducer for generatingand detecting the pulse echo is positioned onone side of the tool. The other three transducersare on the opposite side of the tool and arealigned obliquely. One of these transducerstransmits a high-frequency pulsed beam of about250 kHz to excite a flexural mode in the casing.
> Cased-hole ultrasonic tool basics. An ultrasonic tool’s transducer sends aslightly divergent beam—an acoustic wave generated by a transducer whenelectrical power is applied to it—toward the casing to excite the casing intoits thickness resonance mode. The USI UltraSonic Imager tool scans thecasing at 7½ revolutions per second to render an azimuthal resolution of 5 or10 degrees. This yields 36 or 72 separate waveforms at each depth. These areprocessed to yield the casing thickness, internal radius and inner wallsmoothness—from the initial echo—as well as an azimuthal image of thecement acoustic impedance—from the signal resonance decay (top). Theacoustic impedance of the cement (essentially the quality of the cementsheath) can be derived from the resonance decay (bottom). A good casing-cement bond results in immediate resonance decay, while free pipe rings(generates echoes) for an extended period.
Echo amplitude
Internal casingcondition
Transit time
Internal radius
Resonance frequency
Casingthickness
Resonance decay
Cement acousticimpedance
Time
Resonancedecay
Casing resonance
Transducer Metal plate
Acousticbeam
Cement
FormationCasing
Tranducer Mud Casing Cement Formation
Rotatio
n
> USI tool. The Schlumberger USI tool improvedon earlier versions of the ultrasonic imaging toolby using a single rotating transducer mounted onthe bottom of the tool (A).
A
> Isolation Scanner subassembly. The Isolation Scanner sub combines thetraditional pulse-echo technique using an acoustic transmitter and receivernormal to the casing (A), while adding flexural-wave imaging with onetransmitter (B) and two receivers (C) aligned obliquely. This configurationexcites the casing flexural mode (D). The subassembly, mounted on the sameplatform as the USI tool and with updated signal generation and acquisitionsoftware, is the basis for Isolation Scanner tool.
C
D
B
A
61459schD5R1.qxp:61459schD5R1 5/20/08 3:05 AM Page 23
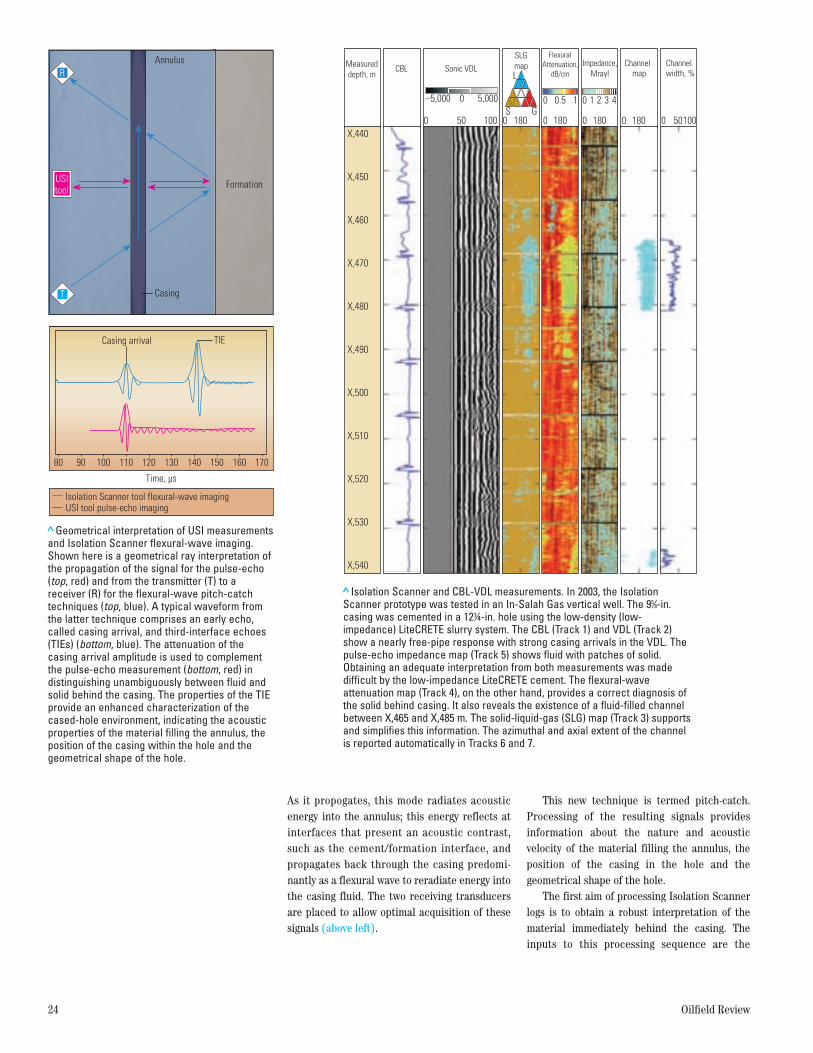
As it propogates, this mode radiates acousticenergy into the annulus; this energy reflects atinterfaces that present an acoustic contrast,such as the cement/formation interface, andpropagates back through the casing predomi-nantly as a flexural wave to reradiate energy intothe casing fluid. The two receiving transducersare placed to allow optimal acquisition of thesesignals (above left).
This new technique is termed pitch-catch.Processing of the resulting signals providesinformation about the nature and acousticvelocity of the material filling the annulus, theposition of the casing in the hole and thegeometrical shape of the hole.
The first aim of processing Isolation Scannerlogs is to obtain a robust interpretation of thematerial immediately behind the casing. Theinputs to this processing sequence are the
24 Oilfield Review
0 0 180 0
0 0 1 2 3 410.5–5,000 5,0000
0180 0 180 0 18050 50100 100
FlexuralAttenuation,
dB/cmImpedance,
MraylChannel
mapChannelwidth, %
X,440
X,450
X,460
X,470
X,480
X,510
X,540
Measureddepth, m
CBL Sonic VDL
SLGmap
X,490
X,500
X,520
X,530
L
GS
> Isolation Scanner and CBL-VDL measurements. In 2003, the IsolationScanner prototype was tested in an In-Salah Gas vertical well. The 95⁄8-in.casing was cemented in a 12¼-in. hole using the low-density (low-impedance) LiteCRETE slurry system. The CBL (Track 1) and VDL (Track 2)show a nearly free-pipe response with strong casing arrivals in the VDL. Thepulse-echo impedance map (Track 5) shows fluid with patches of solid.Obtaining an adequate interpretation from both measurements was madedifficult by the low-impedance LiteCRETE cement. The flexural-waveattenuation map (Track 4), on the other hand, provides a correct diagnosis ofthe solid behind casing. It also reveals the existence of a fluid-filled channelbetween X,465 and X,485 m. The solid-liquid-gas (SLG) map (Track 3) supportsand simplifies this information. The azimuthal and axial extent of the channelis reported automatically in Tracks 6 and 7.
> Geometrical interpretation of USI measurementsand Isolation Scanner flexural-wave imaging.Shown here is a geometrical ray interpretation ofthe propagation of the signal for the pulse-echo(top, red) and from the transmitter (T) to areceiver (R) for the flexural-wave pitch-catchtechniques (top, blue). A typical waveform fromthe latter technique comprises an early echo,called casing arrival, and third-interface echoes(TIEs) (bottom, blue). The attenuation of thecasing arrival amplitude is used to complementthe pulse-echo measurement (bottom, red) indistinguishing unambiguously between fluid andsolid behind the casing. The properties of the TIEprovide an enhanced characterization of thecased-hole environment, indicating the acousticproperties of the material filling the annulus, theposition of the casing within the hole and thegeometrical shape of the hole.
Time, µs
80 90 100 110 120 130 140 150 160 170
Isolation Scanner tool flexural-wave imagingUSI tool pulse-echo imaging
TIECasing arrival
Annulus
Formation
Casing
R
T
USItool
61459schD5R1.qxp:61459schD5R1 5/20/08 3:05 AM Page 24

Spring 2008 25
cement impedance, as delivered by the pulse-echo measurement, and the flexural-waveattenuation computed from the amplitude of thecasing arrivals on the obliquely aligned receivers.
These two inputs are independent measure -ments linked through an invertible relation tothe properties of the fluids inside both thecasing and annular fill. The inputs are firstcombined to eliminate the effect of the insidefluid, thus obviating the need for specifichardware for fluid-property measurementsrequired by the USI tool.
The output of the Isolation Scanner service isa solid-liquid-gas (SLG) map displaying the mostlikely material state behind the casing. The stateis obtained for each azimuth by locating the twomeasurements, corrected for the effects due tothe inside fluid, on a crossplot of attentuationand acoustic impedance, giving the areaencompassed by each state (above left). Themeasurement plane can be mapped out indifferent regions with three colors correspondingto the different states (previous page, top right).
The white-colored areas in the SLG mapcorrespond to locations with nonsolvableinconsistencies between measurements, such asmight appear at the casing collars.
In addition to evaluating the material behindthe casing, a second objective of processing is toextract relevant information from the annulus-formation reflection echo or echoes and furthercharacterize the annulus between the casing and formation.
First, the software detects the echoes on thewaveform envelope following the casing arrivaland then measures their time of arrival andamplitude. From the time differences betweenthe reflection echoes and the casing arrival—provided enough echo azimuthal presence isavailable in the data—it is straightforward todetermine how well the casing is centered withinthe borehole. This is presented as a percentagein which 100% represents perfect centering, and0% is casing in contact with the formation wall.Additionally, if the borehole diameter is known,the time-difference processing can be furtherconverted into a material-wave velocity and
displayed as an annulus-velocity map or cementazimuthal thickness.
A polar plot of the flexural waveforms fromthe variable density log provides a picture of thegeometry of the casing within the borehole(above right).
New Cements Even the most sophisticated logs present only asnapshot of the cement condition and its abilityto provide zonal isolation. Over the long life spanof a well, changing downhole conditions remainthe enemy of cement sheaths and may causeeven well-placed sheaths to fail over time.
Throughout the industry’s long history ofusing cement in well construction, addressingthese failures first focused on placement of theslurry and later on its chemical makeup. Duringthe 1980s, engineers and scientists began toconsider ways to deliver specific set-cementproperties with the aim of increasing the
Flex
ural
-wav
e at
tenu
atio
n, d
B/cm
Pulse-echo impedance, Mrayl
1.6
1.4
1.8
1.0
1.2
0.8
0.6
0.4
0.2
0
–0.2–0.2 0 2 4 6 8 10
GasLiquidSolid
>Waveform polar plot across the fluid-filledchannel at a depth of X,477 m on the IsolationScanner log (previous page, top right). Thecurvature of the annulus-formation echo revealsthat the casing is slightly eccentered in theborehole and that the channel is located on thenarrow side (direction of blue arrows). Theabsence of a third-interface echo across thecement azimuth may be due to a low acousticcontrast between the cement and formation.
150
100
50
0
–50
–100
–150–50–100–150 0 50 100 150
Time, µs
Tim
e, µ
s
Casing
Channel
Formation reflectionwithin channel
> Solid-liquid-gas mapping of the measurement plane for a Class G cement.Once the expected impedance values are defined for the cement, liquid andgas through a laboratory-measured database and the material selection isconverted into acoustic properties, the next step is to predict themeasurements from the expected acoustic material properties. Then, multiplerealizations of the measurement noise are added to generate three clouds ofpoints (solid, liquid and gas) in the bidimensional measurements plane.
61459schD5R1.qxp:61459schD5R1 5/20/08 3:05 AM Page 25
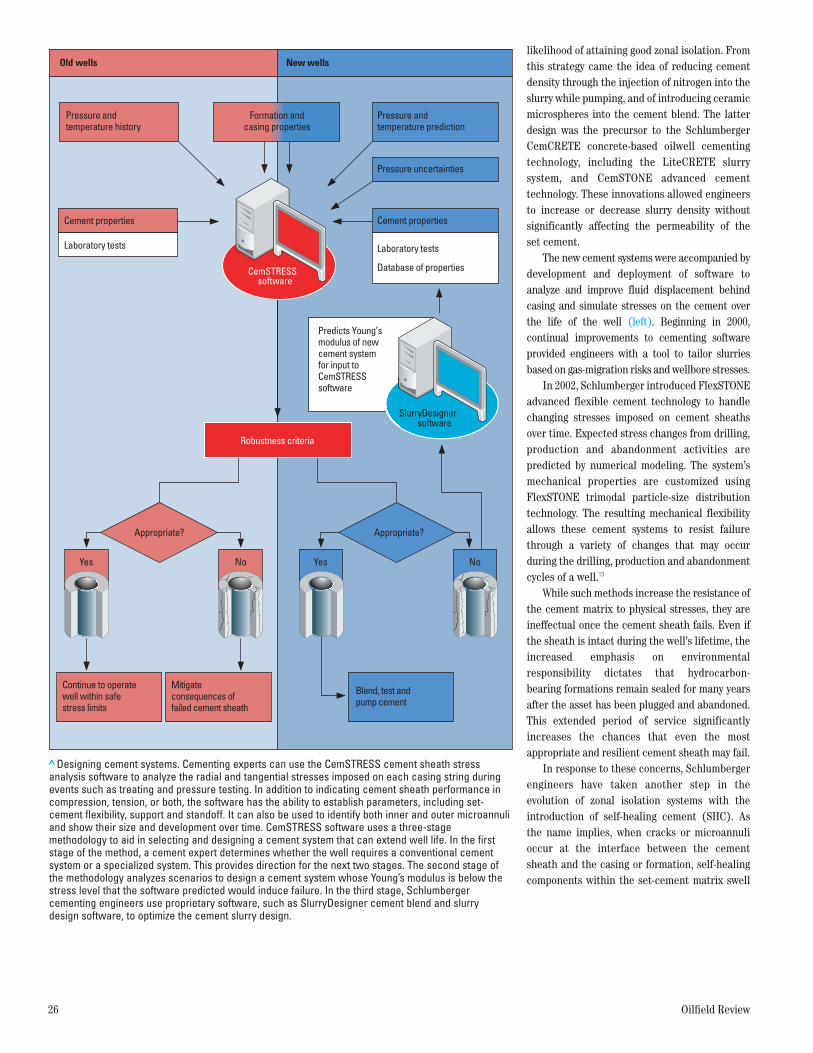
likelihood of attaining good zonal isolation. Fromthis strategy came the idea of reducing cementdensity through the injection of nitrogen into theslurry while pumping, and of introducing ceramicmicrospheres into the cement blend. The latterdesign was the precursor to the SchlumbergerCemCRETE concrete-based oilwell cementingtechnology, including the LiteCRETE slurrysystem, and CemSTONE advanced cementtechnology. These innovations allowed engineersto increase or decrease slurry density withoutsignificantly affecting the permeability of the set cement.
The new cement systems were accompanied bydevelopment and deployment of software toanalyze and improve fluid displacement behindcasing and simulate stresses on the cement overthe life of the well (left). Beginning in 2000,continual improvements to cementing softwareprovided engineers with a tool to tailor slurriesbased on gas-migration risks and wellbore stresses.
In 2002, Schlumberger introduced FlexSTONEadvanced flexible cement technology to handlechanging stresses imposed on cement sheathsover time. Expected stress changes from drilling,production and abandonment activities arepredicted by numerical modeling. The system’smechanical properties are customized usingFlexSTONE trimodal particle-size distributiontechnology. The resulting mechanical flexibilityallows these cement systems to resist failurethrough a variety of changes that may occurduring the drilling, production and abandonmentcycles of a well.13
While such methods increase the resistance ofthe cement matrix to physical stresses, they areineffectual once the cement sheath fails. Even ifthe sheath is intact during the well’s lifetime, theincreased emphasis on environ mentalresponsibility dictates that hydrocarbon-bearing formations remain sealed for many yearsafter the asset has been plugged and abandoned.This extended period of service significantlyincreases the chances that even the mostappropriate and resilient cement sheath may fail.
In response to these concerns, Schlumbergerengineers have taken another step in theevolution of zonal isolation systems with theintroduction of self-healing cement (SHC). Asthe name implies, when cracks or microannulioccur at the interface between the cementsheath and the casing or formation, self-healingcomponents within the set-cement matrix swell
26 Oilfield Review
> Designing cement systems. Cementing experts can use the CemSTRESS cement sheath stressanalysis software to analyze the radial and tangential stresses imposed on each casing string duringevents such as treating and pressure testing. In addition to indicating cement sheath performance incompression, tension, or both, the software has the ability to establish parameters, including set-cement flexibility, support and standoff. It can also be used to identify both inner and outer microannuliand show their size and development over time. CemSTRESS software uses a three-stagemethodology to aid in selecting and designing a cement system that can extend well life. In the firststage of the method, a cement expert determines whether the well requires a conventional cementsystem or a specialized system. This provides direction for the next two stages. The second stage ofthe methodology analyzes scenarios to design a cement system whose Young’s modulus is below thestress level that the software predicted would induce failure. In the third stage, Schlumbergercementing engineers use proprietary software, such as SlurryDesigner cement blend and slurrydesign software, to optimize the cement slurry design.
Old wells New wells
NoYes
Appropriate?
Laboratory tests
Cement properties
Pressure andtemperature history
Formation andcasing properties
Laboratory tests
SlurryDesignersoftware
NoYes
Appropriate?
Predicts Young’smodulus of newcement systemfor input toCemSTRESSsoftware
Continue to operatewell within safestress limits
Mitigateconsequences offailed cement sheath
Blend, test andpump cement
Database of properties
Cement properties
Pressure andtemperature prediction
Pressure uncertainties
Robustness criteria
Cemsoftware
STRESS
61459schD5R1.qxp:61459schD5R1 5/20/08 3:05 AM Page 26
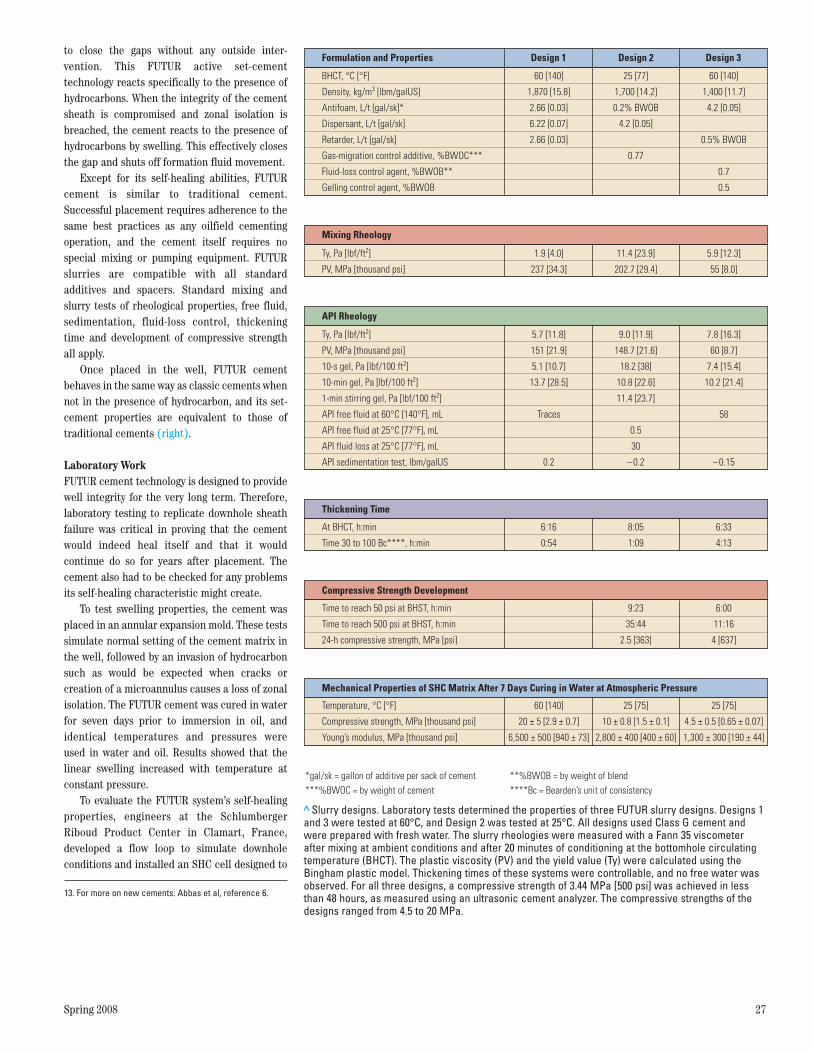
Spring 2008 27
to close the gaps without any outside inter -vention. This FUTUR active set-cementtechnology reacts specifically to the presence ofhydrocarbons. When the integrity of the cementsheath is compromised and zonal isolation isbreached, the cement reacts to the presence ofhydrocarbons by swelling. This effectively closesthe gap and shuts off formation fluid movement.
Except for its self-healing abilities, FUTURcement is similar to traditional cement.Successful placement requires adherence to thesame best practices as any oilfield cementingoperation, and the cement itself requires nospecial mixing or pumping equipment. FUTURslurries are compatible with all standardadditives and spacers. Standard mixing andslurry tests of rheological properties, free fluid,sedimentation, fluid-loss control, thickeningtime and development of compressive strengthall apply.
Once placed in the well, FUTUR cementbehaves in the same way as classic cements whennot in the presence of hydrocarbon, and its set-cement properties are equivalent to those oftraditional cements (right).
Laboratory WorkFUTUR cement technology is designed to providewell integrity for the very long term. Therefore,laboratory testing to replicate downhole sheathfailure was critical in proving that the cementwould indeed heal itself and that it wouldcontinue do so for years after placement. Thecement also had to be checked for any problemsits self-healing characteristic might create.
To test swelling properties, the cement wasplaced in an annular expansion mold. These testssimulate normal setting of the cement matrix inthe well, followed by an invasion of hydrocarbonsuch as would be expected when cracks orcreation of a microannulus causes a loss of zonalisolation. The FUTUR cement was cured in waterfor seven days prior to immersion in oil, andidentical temperatures and pressures were used in water and oil. Results showed that thelinear swelling increased with temperature atconstant pressure.
To evaluate the FUTUR system’s self-healingproperties, engineers at the SchlumbergerRiboud Product Center in Clamart, France,developed a flow loop to simulate downholeconditions and installed an SHC cell designed to
13. For more on new cements: Abbas et al, reference 6.
> Slurry designs. Laboratory tests determined the properties of three FUTUR slurry designs. Designs 1and 3 were tested at 60°C, and Design 2 was tested at 25°C. All designs used Class G cement andwere prepared with fresh water. The slurry rheologies were measured with a Fann 35 viscometer after mixing at ambient conditions and after 20 minutes of conditioning at the bottomhole circulatingtemperature (BHCT). The plastic viscosity (PV) and the yield value (Ty) were calculated using theBingham plastic model. Thickening times of these systems were controllable, and no free water wasobserved. For all three designs, a compressive strength of 3.44 MPa [500 psi] was achieved in lessthan 48 hours, as measured using an ultrasonic cement analyzer. The compressive strengths of thedesigns ranged from 4.5 to 20 MPa.
*gal/sk = gallon of additive per sack of cement***%BWOC = by weight of cement
**%BWOB = by weight of blend****Bc = Bearden’s unit of consistency
Formulation and Properties Design 3Design 2Design 1
BHCT, °C [°F]
Density, kg/m3 [lbm/galUS]
Antifoam, L/t [gal/sk]*
Dispersant, L/t [gal/sk]
Retarder, L/t [gal/sk]
Gas-migration control additive, %BWOC***
Fluid-loss control agent, %BWOB**
Gelling control agent, %BWOB
60 [140]
1,870 [15.8]
2.66 [0.03]
6.22 [0.07]
2.66 [0.03]
25 [77]
1,700 [14.2]
0.2% BWOB
4.2 [0.05]
0.77
60 [140]
1,400 [11.7]
4.2 [0.05]
0.5% BWOB
0.7
0.5
Ty, Pa [lbf/ft2]
PV, MPa [thousand psi]
10-s gel, Pa [lbf/100 ft2]
10-min gel, Pa [lbf/100 ft2]
1-min stirring gel, Pa [lbf/100 ft2]
API free fluid at 60°C [140°F], mL
API free fluid at 25°C [77°F], mL
API fluid loss at 25°C [77°F], mL
API sedimentation test, lbm/galUS
5.7 [11.8]
151 [21.9]
5.1 [10.7]
13.7 [28.5]
Traces
0.2
9.0 [11.9]
148.7 [21.6]
18.2 [38]
10.8 [22.6]
11.4 [23.7]
0.5
30
–0.2
7.8 [16.3]
60 [8.7]
7.4 [15.4]
10.2 [21.4]
58
–0.15
API Rheology
Temperature, °C [°F]
Compressive strength, MPa [thousand psi]
Young’s modulus, MPa [thousand psi]
60 [140]
20 ± 5 [2.9 ± 0.7]
6,500 ± 500 [940 ± 73]
25 [75]
10 ± 0.8 [1.5 ± 0.1]
2,800 ± 400 [400 ± 60]
25 [75]
4.5 ± 0.5 [0.65 ± 0.07]
1,300 ± 300 [190 ± 44]
Mechanical Properties of SHC Matrix After 7 Days Curing in Water at Atmospheric Pressure
Time to reach 50 psi at BHST, h:min
Time to reach 500 psi at BHST, h:min
24-h compressive strength, MPa [psi]
9:23
35:44
2.5 [363]
6:00
11:16
4 [637]
Compressive Strength Development
At BHCT, h:min
Time 30 to 100 Bc****, h:min
6:16
0:54
8:05
1:09
6:33
4:13
Thickening Time
Ty, Pa [lbf/ft2]
PV, MPa [thousand psi]
1.9 [4.0]
237 [34.3]
11.4 [23.9]
202.7 [29.4]
5.9 [12.3]
55 [8.0]
Mixing Rheology
61459schD5R1.qxp:61459schD5R1 5/20/08 3:05 AM Page 27

evaluate self-healing capability in an annularconfiguration (above). Oil was injected throughsamples to test both cracks and microannuli. Inone test, a microannulus of 100 microns wascreated between the casing and cement insidethe SHC cell. While a conventional cement systemtested in this apparatus allowed oil to flowthrough the sample, the FUTUR system reacted tooil invasion with an efficient closure of themicroannulus in less than six hours (above right).
The self-healing system has also been testedin a cyclic failure scenario. Successive micro -annuli were created and repaired with the SHCat a differential pressure of 1.4 MPa/m[62 psi/ft]. Using the same flow loop, the flow ofoil through successively generated cracks wasrepeatedly shut off by the SHC. The same testusing a conventional neat cement system did notshow any decrease in flow (next page, top left).
FUTUR cement also can handle oil flows athigher pressure. A pressure increase to 3 MPa/m[133 psi/ft] did not diminish the self-healing
capabilities of the system, which maintainedintegrity and continued to block the flow of oil athigh pressure. The tests were repeated withdifferential pressures up to 5.3 MPa/m, and thecement’s self-healing property was confirmed inevery test.
A specialized testing system was devised tostudy self-healing properties in dynamicconditions with dry gas under realistic reservoirconditions. Test results highlighted the efficiencyof the FUTUR system when exposed to naturalgas under dynamic conditions. In less than onehour, the self-healing cement caused asignificant decrease of flow rate from425 mL/min [26 in.3/min] to 0.52 mL/min[0.03 in.3/min] (next page, top right).
Finally, researchers investigated thedurability of the self-healing cement. Thedurability—or aging—test consisted of twoparts. The first part, using a swelling test, was tocheck that the self-healing property ismaintained over time. The second was toevaluate whether matrix integrity is maintainedwhen the cement is immersed in oil for a longperiod of time.
Swelling tests performed after prolongedimmersion of FUTUR cement in water confirmedthat the self-healing properties were maintained.In this test, cement placed in an expansion cellwas cured in water for several months, thenimmersed in oil at 60°C. Results showed that thereactivity of the self-healing matrix remainedeffective even after resting dormant for a year.Testing of the matrix integrity, after one year ofexposure in oil, also showed no indication thatthe integrity of the matrix was deteriorating. Themechanical properties remained within the samerange even after immersion in oil for a year.
28 Oilfield Review
> Test cell results. The SHC cell was installed in a flow loop to investigate FUTUR self-healingefficiency. Oil was injected through samples inthe SHC cell at pressures up to 0.4 MPa [58 psi],corresponding to a differential pressure of 5.3 MPa/m [234 psi/ft] across the sample. In onetest, a microannulus of 100 microns was createdbetween the casing and the cement inside theSHC cell. The neat cement system (green)allowed oil to flow through the sample, whereasthe SHC system (blue) responded to oil invasionwith an efficient closure of the microannulus inless than 6 hours.
Time, days
Time, days
100
80
40
20
60
0
100
80
60
40
20
00
0 1 2 3
0.5 1.0 1.5
Mic
roan
nulu
s w
idth
, µm
Nor
mal
ized
flow
rate
, %
Neat systemSelf-healing cement
> Healing check. An SHC cell with two concentric cylinders simulates anannular volume. The outer cylinder, or ring, is a thin, steel sleeve (green). Theinner cylinder (purple) is made of a deformable elastic material into which aradially expandable core assembly (gray) is inserted, allowing expansion ofthe inner sleeve in a controlled manner. Top and bottom plugs sealing theannular volume are equipped with fittings that allow fluid to enter and toescape the cell. With the inner cylinder expanded by a core assembly, thecement is injected into the annular space. Once the cement has set, theinner-cylinder expansion is released. The inner cylinder shrinks back to itsoriginal shape, generating a microannulus of a controlled size. Radial crackswithin the cement are created by expanding the inner core assembly afterthe cement has set.
Expandable andretractablecenter assembly
Inner ring
Outer ring
Cement
61459schD5R1.qxp:61459schD5R1 5/20/08 3:05 AM Page 28
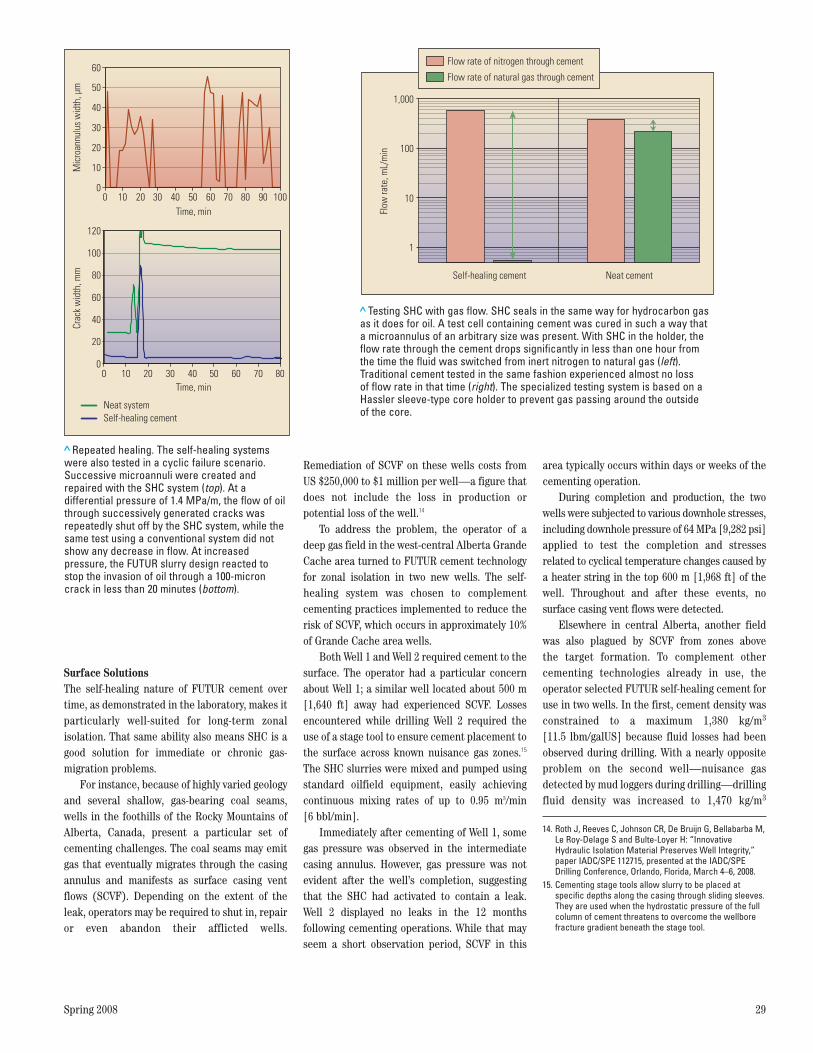
Spring 2008 29
Surface SolutionsThe self-healing nature of FUTUR cement overtime, as demonstrated in the laboratory, makes itparticularly well-suited for long-term zonalisolation. That same ability also means SHC is agood solution for immediate or chronic gas-migration problems.
For instance, because of highly varied geologyand several shallow, gas-bearing coal seams,wells in the foothills of the Rocky Mountains ofAlberta, Canada, present a particular set ofcementing challenges. The coal seams may emitgas that eventually migrates through the casingannulus and manifests as surface casing ventflows (SCVF). Depending on the extent of theleak, operators may be required to shut in, repairor even abandon their afflicted wells.
Remediation of SCVF on these wells costs fromUS $250,000 to $1 million per well—a figure thatdoes not include the loss in production orpotential loss of the well.14
To address the problem, the operator of adeep gas field in the west-central Alberta GrandeCache area turned to FUTUR cement technologyfor zonal isolation in two new wells. The self-healing system was chosen to complementcementing practices implemented to reduce therisk of SCVF, which occurs in approximately 10%of Grande Cache area wells.
Both Well 1 and Well 2 required cement to thesurface. The operator had a particular concernabout Well 1; a similar well located about 500 m[1,640 ft] away had experienced SCVF. Lossesencountered while drilling Well 2 required theuse of a stage tool to ensure cement placement tothe surface across known nuisance gas zones.15
The SHC slurries were mixed and pumped usingstandard oilfield equipment, easily achievingcontinuous mixing rates of up to 0.95 m3/min[6 bbl/min].
Immediately after cementing of Well 1, somegas pressure was observed in the inter mediatecasing annulus. However, gas pressure was notevident after the well’s completion, suggestingthat the SHC had activated to contain a leak. Well 2 displayed no leaks in the 12 monthsfollowing cementing operations. While that mayseem a short observation period, SCVF in this
area typically occurs within days or weeks of thecementing operation.
During completion and production, the twowells were subjected to various downhole stresses,including downhole pressure of 64 MPa [9,282 psi]applied to test the completion and stressesrelated to cyclical temperature changes caused bya heater string in the top 600 m [1,968 ft] of thewell. Throughout and after these events, nosurface casing vent flows were detected.
Elsewhere in central Alberta, another fieldwas also plagued by SCVF from zones above the target formation. To complement othercementing technologies already in use, theoperator selected FUTUR self-healing cement foruse in two wells. In the first, cement density wasconstrained to a maximum 1,380 kg/m3
[11.5 lbm/galUS] because fluid losses had beenobserved during drilling. With a nearly oppositeproblem on the second well—nuisance gasdetected by mud loggers during drilling—drillingfluid density was increased to 1,470 kg/m3
14. Roth J, Reeves C, Johnson CR, De Bruijn G, Bellabarba M,Le Roy-Delage S and Bulte-Loyer H: “InnovativeHydraulic Isolation Material Preserves Well Integrity,”paper IADC/SPE 112715, presented at the IADC/SPEDrilling Conference, Orlando, Florida, March 4–6, 2008.
15. Cementing stage tools allow slurry to be placed atspecific depths along the casing through sliding sleeves.They are used when the hydrostatic pressure of the fullcolumn of cement threatens to overcome the wellborefracture gradient beneath the stage tool.
> Repeated healing. The self-healing systemswere also tested in a cyclic failure scenario.Successive microannuli were created andrepaired with the SHC system (top). At adifferential pressure of 1.4 MPa/m, the flow of oilthrough successively generated cracks wasrepeatedly shut off by the SHC system, while thesame test using a conventional system did notshow any decrease in flow. At increasedpressure, the FUTUR slurry design reacted tostop the invasion of oil through a 100-microncrack in less than 20 minutes (bottom).
Time, min
Time, min
0
0 10 20 30 40 50 60 70 80
10 20 30 40 50 60 70 80 90 100
60
50
120
100
80
60
40
20
0
40
30
20
10
0
Mic
roan
nulu
s w
idth
, µm
Crac
k w
idth
, mm
Neat systemSelf-healing cement
> Testing SHC with gas flow. SHC seals in the same way for hydrocarbon gasas it does for oil. A test cell containing cement was cured in such a way thata microannulus of an arbitrary size was present. With SHC in the holder, theflow rate through the cement drops significantly in less than one hour fromthe time the fluid was switched from inert nitrogen to natural gas (left).Traditional cement tested in the same fashion experienced almost no loss of flow rate in that time (right). The specialized testing system is based on aHassler sleeve-type core holder to prevent gas passing around the outside of the core.
1,000
100
10
1
Flow
rate
, mL/
min
Self-healing cement Neat cement
Flow rate of nitrogen through cement
Flow rate of natural gas through cement
61459schD5R1.qxp:61459schD5R1 5/20/08 3:05 AM Page 29

30 Oilfield Review
> Analysis of cement evaluation logs in the Cortemaggiore 155dir underground gas-storage (UGS) well. The brown color of theSLG map (Track 1) of the ultrasonic flexural attenuation logging tool indicates solid (cement), resulting from a measuredacoustic impedance (Track 2) of about 5 Mrayl (close to the expected cement value) and high flexural attenuation. The CBL(Track 7) is in agreement, showing 100% casing to cement bonding (average CBL value of 5 mV) and strong formation arrivalson the VDL (Track 8), which is an indication of excellent cement-to-formation bonding. The optimal cement bonding is alsorelated to the fact that the liner is fairly well-centralized, as shown by casing centering (Track 4) and third interface short- andlong-axis outputs (Tracks 5 and 6). The casing centering curve is above 80% for most of the interval shown except near a depthof X,720 m, where the casing nearly touches the formation. This is also indicated in the vanishingly small cement thicknessalong the short axis. The horizontal features visible on the SLG map, cement map and flexural attenuation map (Track 3) are thecasing joints about every 14 m [45 ft] and two casing centralizers per joint. Together the logs show optimal cement bonding tothe casing and to the formation, providing assurance of effective hydraulic isolation across the permeable injection zones ofthe UGS well.
X,650
X,675
X,700
X,725
MeasuredDepth, m
SLGMap
AcousticImpedance
CementMap
0 0 10.521 3 4
CasingCentering
%00 180 100
Casing andThird-Interface
Long Axis
in.5 2.5
FlexuralAttenuation
Map CBL
mV0 50Variable Density
200 1,200
AmplitudeMin MaxCasing and
Third-InterfaceShort Axis
in.5 2.5S G
L
61459schD5R1.qxp:61459schD5R1 5/20/08 3:05 AM Page 30

Spring 2008 31
[12.25 lbm/galUS]. This meant cement densityfor that well had to be increased to 1,550 kg/m3
[12.9 lbm/galUS] to meet the requirements of themud-removal plan.16
Zonal isolation was achieved with the newcementing system in both wells despite difficultconditions—a low-pore-pressure zone in Well A,and a narrow pore-pressure-fracture windowacross a gas-influx zone in Well B. Cementreturns to the surface in Well A alsodemonstrated that SHC can be applied in asingle-stage cement job in wells prone to lostcirculation. During and after subsequent drilling,stimulation and completion operations, therewas no indication of annular gas flow.
Gas StorageSustaining self-healing characteristics over timeholds special attraction for engineers chargedwith sealing underground gas-storage (UGS)wells. Because these wells are used to both injectand produce, the wellbores are repeatedlysubjected to considerable temperature andpressure changes—often in short cycles—thatcan induce stress-load changes on the casing and cement.
Additionally, in contrast to producing wellsthat have a life expectancy of perhaps 20 years,UGS well plans are likely to include a production-injection life span of 80 years or more. As aconsequence, zonal isolation failure inunderground gas storage wells is a significantand ongoing operator concern (see “IntelligentWell Technology in Underground Gas Storage,”page 4). In many UGS facilities, poor hydraulicisolation is caused by drilling fluid channeling asa result of eccentric casing or through thedevelopment of a dry microannulus.17
A combination of these factors hadhistorically resulted in poor zonal isolation inUGS wells in an Eni S.p.A.-operated, depleted gasfield in northern Italy. The challenges facing Eniand Schlumberger engineers included obtainingseals across gas-injection zones and gas-tightcement sheaths across deviated (49°), washed-out sections.
For a new well in this field, Eni subsidiaryStogit chose to cement the production casingwith FUTUR self-healing cement. The plan alsoincluded proper placement of centralizers, a gas-migration analysis software package and
Isolation Scanner logging tools to evaluate thecement bond.
The solution to persistent problems ofsustained casing pressure in UGS wells drilled inthis area involved a multipronged approach:• more centralizers to improve standoff• a liner across the zone of interest to facilitate
casing rotation during cementing• use of a software advisor tool for gas-migration
prediction and prevention during cementhydration
• software to tailor the cement system to associ-ated risk
• use of FUTUR SHC• a full suite of postcementing logging tools that
included all ultrasonic and flexural-wave measurements.
In 2007, the SHC cementing operation wasperformed on the Cortemaggiore 155dir UGSwell. The team used a computer-aided design andevaluation software program that optimized mudremoval and standoff, and fine-tuned the spacerand slurry characteristics. A separate softwareprogram was used to evaluate the risk of theseverity of gas migration based on the pressure-decay limit—a measurement of how far thehydrostatic pressure of the slurry will fall duringhydration before it is below the pore pressureand might allow gas migration into the annulus.
Finally, a mechanical-stress modelingsoftware tool that simulated pressure andtemperature variations during the life of the wellwas used to evaluate cement sheath integrityover time. The software modeled the threemechanisms of cement sheath failure—traction,compressional failure and both internal andexternal microannulus development.
Once the cement was placed, CBL-VDL andIsolation Scanner tool analyses all indicatedoptimal cement bonding at the casing andformation interfaces (previous page). Theultimate success of the SHC system is beingmonitored over time as gas is cyclically injectedinto and produced from the well.
In another recent FUTUR cement appli -cation, the technology was applied inenvironmentally sensitive areas of the CanadianRocky Mountains. Following the suspension ofdrilling because of surface casing leaks andresulting environmental concerns, one USoperator reevaluated its well constructionprocedures in the area and then resumedoperations. Despite the revised strategy, three ofseven wells drilled had obvious gas leaks whilethe other four were suspect; possible leaks weremasked by heavy cement poured around the
casing at the surface. The company then addedFUTUR cement to its drilling and completionprogram. Of the 13 area wells drilled andcompleted since then, only two wells haddetectable leaks; one was due to an operationalfailure unrelated to the SHC and a second was barely detectable.
Time Will TellLong-term performance of its self-healingcharacteristics is key to the success of FUTURcement. Laboratory work shows that this SHCwill continue to close the pathways throughwhich gas migrates without interventionthroughout the life of the well and beyond. Intime, operators pressured by environmentalregulators—internal and external—will insistthat the cement sheaths in their wells preventhydrocarbons from escaping formations longafter the well has been plugged and abandoned.The ability of FUTUR cement to react to andrepair the channels through which formationfluids travel to the surface makes it an idealanswer to such demands.
Operators, especially those in gas-migrationprone areas, will also come to expect an improvedview behind casing to eliminate other costly zonalisolation tests in the face of conflicting orambiguous CBL-VDL logs. In drilling environ -ments with proximate pore pressures andfracture gradients, lightweight cements that posea significant challenge to traditional sonic loggingtools are required. The Isolation Scanner tooloffers a clear solution to these and other currentzonal isolation challenges. —RvF
16. Cavanagh et al, reference 2.17. Moroni N, Panciera N, Zanchi A, Johnson CR,
LeRoy-Delage S, Bulte-Loyer H, Cantini S, Belleggia Eand Illuminati R: “Overcoming the Weak Link in CementedHydraulic Isolation,” paper SPE 110523, presented at theSPE Annual Technical Conference and Exhibition,Anaheim, California, USA, November 11–14, 2007.
61459schD5R1.qxp:61459schD5R1 5/20/08 3:05 AM Page 31
32 Oilfield Review
Intelligence in Novel Materials
Rashmi BhavsarNitin Y. VaidyaRosharon, Texas, USA
Partha GangulyAlan HumphreysAgathe RobissonHuilin TuNathan WicksCambridge, Massachusetts, USA
Gareth H. McKinleyMassachusetts Institute of TechnologyCambridge, Massachusetts
Frederic PauchetClamart, France
For help in preparation of this article, thanks to Hiroshi Hori,Sagamihara, Kanagawa, Japan.CQG (Crystal Quartz Gauge), FUTUR, Isolation Scanner, Q-Marine, Q-Seabed, Sonic Scanner and sonicVISION are marks of Schlumberger.CryoFit is a mark of Aerofit Products Inc.Motion Master is a mark of LORD Corporation.Simon Nitinol Filter is a mark of C.R. Bard, Inc. or an affiliate.Smart Magnetix is a mark of Biedermann Motech GmbH.
Defined as materials whose properties can be varied controllably in response to
changes in their environment, smart materials can convert one type of energy to
another. This opens the way to use them for performing the complex functions of
sensors and actuators—sometimes several functions simultaneously—in a device
essentially consisting of a single piece of a single substance.
Throughout history, people have shaped tools fromthe materials at hand. With better under standingof material properties came the ability to fabri -cate materials with designed character istics.Currently, a materials category that is experi -encing extensive research and some application is“smart materials.”
Some smart materials are widely known.Piezoelectric lighters and igniters in gas stoves,grills and other gas appliances produce a spark,or electric discharge, without using an electriccircuit—just by striking a piezoelectric crystalwith a spring-loaded hammer. This property ofpiezoelectric materials to “feel” pressure andrespond by generating electric potential is usedin a wide range of smart applications. Othersmart materials respond to different externalstimuli, such as temperature, electromagneticfields and moisture.
What all smart materials have in common isthe ability to convert one type of energy toanother. Piezoelectric materials can convertmechanical energy to electric energy, and viceversa. Other smart materials convert betweenother types of energy. A key to practical appli -cations is the fact that this conversion can occurin a controlled manner. Materials that manifestthis property of responding in a controllablefashion to changes in the environment arecommonly termed smart materials.1
The two main types of energy-conversiondevices are sensors and actuators, and these arethe principal applications of smart materials. Asensor converts an action to a signal, whereas anactuator converts a signal to an action.Conventional sensors and actuators are typicallyconstructed of multiple materials and havemovable parts. Some smart materials can per formthe functions of several materials and partssimultaneously, thus simplifying the device designand having fewer parts to break or wear down.
From the standpoint of practical appli cations,of greatest interest are materials that convertmechanical energy to thermal, electric, magneticor chemical energy, and vice versa. In addition topiezoelectric materials converting mechanicalenergy into electricity, other smart materials thatare utilized in commercial applications includeshape-memory alloys that respond mechanicallyto applied heat; magneto rheological andmagneto strictive materials, whose properties arecontrolled by the application of magnetic fields;and materials that swell when chemicallyactivated. This article will look at some of thesematerials, their current applications and theirpotential for use in future oilfield applications.
1. Schwartz MM (ed): Encyclopedia of Smart Materials.New York City: John Wiley & Sons, 2002.
2. Otsuka K and Wayman CM (eds): Shape MemoryMaterials. Cambridge, England: Cambridge UniversityPress, 1998.
3. Kauffman GB and Mayo I: “The Metal with a Memory,”Invention & Technology Magazine 9, no. 2 (Fall 1993): 18–23, http://www.americanheritage.com/articles/magazine/it/1993/2/1993_2_18.shtml (accessedDecember 4, 2007).
61459schD8R1.qxp:61459schD8R1 5/15/08 9:04 AM Page 32

Spring 2008 33
Thermally Activated Materials: Total RecallSome materials can be deformed but then regaintheir original shape when heat is applied. Theseare called shape-memory materials. Alloys withproperties later found to be directly related tothe shape-memory phenomenon have beenknown since the 1930s.2 However, technologicalapplication of this phenomenon did not occuruntil almost three decades later.3 In early 1958, William J. Buehler, a metallurgist at theNaval Ordnance Laboratory (NOL), White Oak,Maryland, USA, began to test various alloys to beused for the nose cone of a submarine rocket. Hedetermined that a nickel-titanium alloy had thehighest impact resistance and other beneficialproperties, such as elasticity, malleability andfatigue resistance. Buehler named this alloy
Nitinol, combining the chemical symbols ofnickel, Ni, and titanium, Ti, with the laboratory’sacronym, NOL.
The first hint of the unusual properties ofNitinol was seen in 1959 when Buehlerdiscovered the alloy’s exceptional temperature-dependent acoustic-damping characteristics,which suggested temperature-dependent changesin the alloy’s atomic structure. But the final steptoward the discovery of shape memory was madein 1960 at a meeting of NOL management. Theywere presented with a Nitinol specimen thatwould demonstrate the alloy’s favorable fatigue-resistance properties. The specimen was a longNitinol strip folded repeatedly to form a zigzagprofile. The directors bent and unbent the
specimen and were satisfied with its mechanicalcharacteristics. One of the managers decided tocheck the alloy’s thermal properties using acigarette lighter. Amazingly, when the com pressedstrip got hot, it stretched out longitudinally.
It took a few more years to understand themechanism of shape memory. One importantdiscovery was that Nitinol can exist as twodifferent temperature-dependent phases; shapememory is possible because of phase transitionsbetween these phases. To fix the original shape,or to “train” a specimen to “remember” thisshape, the Nitinol specimen must be annealed atapproximately 500°C [932°F] for an hour while itis held in a fixed position. Heating gives rise to ahigh-temperature, hard, inelastic phase calledaustenite. Subsequent cooling, or quenching, of
61459schD8R1.qxp:61459schD8R1 5/15/08 9:04 AM Page 33
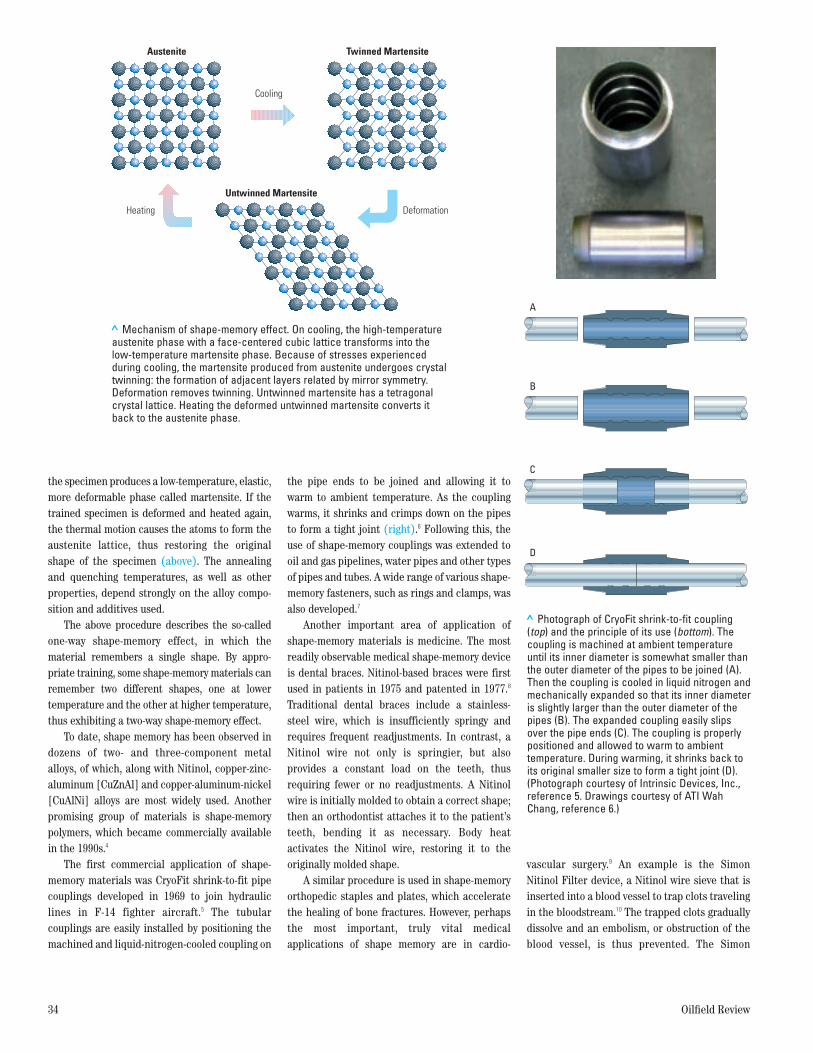
the specimen produces a low-temperature, elastic,more deformable phase called martensite. If thetrained specimen is deformed and heated again,the thermal motion causes the atoms to form theaustenite lattice, thus restoring the originalshape of the specimen (above). The annealingand quenching temperatures, as well as otherproperties, depend strongly on the alloy compo -sition and additives used.
The above procedure describes the so-calledone-way shape-memory effect, in which thematerial remembers a single shape. By appro -priate training, some shape-memory materials canremember two different shapes, one at lowertemperature and the other at higher tempera ture,thus exhibiting a two-way shape-memory effect.
To date, shape memory has been observed indozens of two- and three-component metalalloys, of which, along with Nitinol, copper-zinc-aluminum [CuZnAl] and copper-aluminum-nickel[CuAlNi] alloys are most widely used. Anotherpromising group of materials is shape-memorypolymers, which became commercially availablein the 1990s.4
The first commercial application of shape-memory materials was CryoFit shrink-to-fit pipecouplings developed in 1969 to join hydrauliclines in F-14 fighter aircraft.5 The tubularcouplings are easily installed by positioning themachined and liquid-nitrogen-cooled coupling on
the pipe ends to be joined and allowing it towarm to ambient temperature. As the couplingwarms, it shrinks and crimps down on the pipesto form a tight joint (right).6 Following this, theuse of shape-memory couplings was extended tooil and gas pipelines, water pipes and other typesof pipes and tubes. A wide range of various shape-memory fasteners, such as rings and clamps, wasalso developed.7
Another important area of application ofshape-memory materials is medicine. The mostreadily observable medical shape-memory deviceis dental braces. Nitinol-based braces were firstused in patients in 1975 and patented in 1977.8
Traditional dental braces include a stainless-steel wire, which is insufficiently springy andrequires frequent readjustments. In contrast, aNitinol wire not only is springier, but alsoprovides a constant load on the teeth, thusrequiring fewer or no readjustments. A Nitinolwire is initially molded to obtain a correct shape;then an orthodontist attaches it to the patient’steeth, bending it as necessary. Body heatactivates the Nitinol wire, restoring it to theoriginally molded shape.
A similar procedure is used in shape-memoryorthopedic staples and plates, which acceleratethe healing of bone fractures. However, perhapsthe most important, truly vital medicalapplications of shape memory are in cardio -
vascular surgery.9 An example is the SimonNitinol Filter device, a Nitinol wire sieve that isinserted into a blood vessel to trap clots travelingin the bloodstream.10 The trapped clots graduallydissolve and an embolism, or obstruction of theblood vessel, is thus prevented. The Simon
34 Oilfield Review
> Mechanism of shape-memory effect. On cooling, the high-temperatureaustenite phase with a face-centered cubic lattice transforms into thelow-temperature martensite phase. Because of stresses experiencedduring cooling, the martensite produced from austenite undergoes crystaltwinning: the formation of adjacent layers related by mirror symmetry.Deformation removes twinning. Untwinned martensite has a tetragonalcrystal lattice. Heating the deformed untwinned martensite converts itback to the austenite phase.
Cooling
DeformationHeating
Austenite
Untwinned Martensite
Twinned Martensite
> Photograph of CryoFit shrink-to-fit coupling(top) and the principle of its use (bottom). Thecoupling is machined at ambient temperatureuntil its inner diameter is somewhat smaller thanthe outer diameter of the pipes to be joined (A).Then the coupling is cooled in liquid nitrogen andmechanically expanded so that its inner diameteris slightly larger than the outer diameter of thepipes (B). The expanded coupling easily slipsover the pipe ends (C). The coupling is properlypositioned and allowed to warm to ambienttemperature. During warming, it shrinks back toits original smaller size to form a tight joint (D).(Photograph courtesy of Intrinsic Devices, Inc.,reference 5. Drawings courtesy of ATI WahChang, reference 6.)
A
C
D
B
61459schD8R1.qxp:61459schD8R1 5/15/08 9:04 AM Page 34

Spring 2008 35
Nitinol Filter sieve is inserted using a catheterwhile being in a cooled, deformed martensiticstate, and then it expands to full size whenwarmed by body heat (right).
Electrically Activated Materials: Smart as PaintA large range of applications has been createdusing piezoelectric smart materials. The piezo -electric effect, also called the direct piezoelectriceffect, is the ability of certain materials—minerals, ceramics and some polymers—toproduce an electric charge in response to anapplied mechanical stress. The converse effectcan also be seen, in which piezoelectric materialsare deformed in an applied electric field.
The direct piezoelectric effect was discoveredby the brothers Pierre and Jacques Curie in 1880.They noticed that compressing a quartz crystalplate cut at a certain orientation gave rise toelectric charges on plate faces opposite to thecompression direction: a positive charge on oneface and a negative charge on the other.Expanding the crystal plate also generatedelectric charges, but if the charge on a face whilecompressing was negative, then the charge onthis face while expanding was positive, and viceversa. The direct piezoelectric effect occurs if anelastic deformation of a solid is accompanied byan asymmetric distortion of the distribution ofpositive and negative charges, dipoles or groupsof parallel dipoles (Weiss domains) in thestructure of the solid so that a total dipolemoment is induced; that is, the solid is polarized.The converse piezoelectric effect takes place ifan applied electric field causes such a distortionof the distribution of charges, dipoles or Weissdomains that this leads to geometric distortions,manifested as mechanical strains (right).
> Simon Nitinol Filter. The schematic (top) shows the deployment of thedevice on a catheter. Also included are the front and side views in thedeployed state (bottom). (Copyright Brazilian Journal of Medical andBiological Research; used with permission, reference 9.)
Simon Nitinol Filter Being Deployed
Side ViewFront View
4. Lendlein A and Kelch S: “Shape-Memory Polymers,”Angewandte Chemie International Edition 41, issue 2(June 12, 2002): 2034–2057.
5. “Use of Shape Memory Alloys in High ReliabilityFastening Applications,” http://www.intrinsicdevices.com/history.html (accessed December 24, 2007).
6. Tuominen S and Wojcik C: “Unique Alloys for Aerospaceand Beyond,” Outlook 16, no. 2 (2nd Quarter 1995),http://www.wahchang.com/pages/outlook/html/bkissues/16_02.htm (accessed December 24, 2007).
7. Stöckel D: “The Shape Memory Effect: Phenomenon,Alloys, Applications,” Report (2000), NDC, Nitinol Devices& Components, Inc., Fremont, California, USA,www.nitinol-europe.com/pdfs/smemory.pdf (accessedDecember 24, 2007).
8. Andreasen GF: “Method and System for OrthodonticMoving of Teeth,” US Patent No. 4,037,324 (July 26, 1977).
9. Machado LG and Savi MA: “Medical Applications ofShape Memory Alloys,” Brazilian Journal of Medicaland Biological Research 36, no. 6 (June 2003): 683–691,www.scielo.br/pdf/bjmbr/v36n6/4720.pdf (accessedDecember 19, 2007).
10. Duerig TW, Pelton AR and Stöckel D: “SuperelasticNitinol for Medical Devices,” Medical Plastics andBiomaterials 4, no. 2 (March 1997): 30–43.
> Direct and converse piezoelectric effects. In the direct piezoelectriceffect, compressing and expanding a piezoelectric material samplegenerate opposite electric charges on respective faces of the sample (top).In the converse piezoelectric effect, application of voltage to apiezoelectric material sample causes deformation Δh (bottom right). Thiscontrasts with the direct piezoelectric effect, in which deformation Δhproduces voltage (bottom left).
No strain Compression Expansion
Piezoelectricity Converse Piezoelectricity
61459schD8R1.qxp:61459schD8R1 5/29/08 12:38 PM Page 35

To date, piezoelectricity has been detected inmany types of materials. The Curie brothersdiscovered piezoelectricity in naturally occurringminerals, such as quartz, tourmaline, topaz andRochelle salt (sodium potassium tartratetetrahydrate, or KNaC4H4O6·4H2O). Of these, onlyquartz is now used commercially. All otherpractically important piezoelectric singlecrystals—such as ammonium dihydrophosphate[NH4H2PO4], gallium orthophosphate [GaPO4],and lanthanum gallium complex oxides—aregrown artificially.
Although single-crystal piezoelectric materialscontinue to be developed, the most extensivelyused class of piezoelectric materials is nowpolycrystalline piezoelectric ceramics, whichhave much wider ranges of useful characteristicsand work under broader operating conditions.Currently, the largest group of piezoelectricceramics is materials consisting of crystalliteswith the perovskite structure.11 These arecomplex metal oxides with the general formulaABO3, where A and B are cations of differentsizes. The cation A includes elements such as Na,K, Rb, Ca, Sr, Ba and Pb, and B includes Ti, Sn, Zr,Nb, Ta and W. Sometimes A and B each mayrepresent two or more of these cations, providedthat the total stoichiometry is satisfied (forexample as in lead zirconate titanate,PbZrxTi1−xO3). The main examples of perovskite-like piezoelectric ceramics are barium titanate[BaTiO3] (the first piezo electric ceramicdiscovered), lead titanate [PbTiO3], leadzirconate titanate (the most widely usedpiezoelectric ceramic to date), lead lanthanumzirconate titanate [Pb1−xLax(ZryTi1−y)1−x/4O3]and lead magnesium niobate [PbMg1/3Nb2/3O3].12
After the sintering stage in manufacturing,dipoles in such ceramics are parallel only withineach domain, whereas the domains are polarizedrandomly.13 An elastic deformation of a set ofrandomly polarized dipoles cannot lead to anasymmetric distortion of the charge distributionand, therefore, cannot result in piezoelectricity.Therefore, the last stage of manufacturing ofpiezoelectric ceramics is always the applicationof a strong electric field at elevated temperature,after which the domains are polarized approxi -mately identically and the substance becomespiezoelectric (above).
Some polymers can be piezo electric or can bemade so. Piezoelectricity was discovered ordeveloped in a number of natural polymers,including keratin, collagen, some polypeptides andoriented films of DNA, and synthetic polymers,such as some nylons and polyurea. However,currently the only commer cially availablepiezoelectric polymers are polyvinylidenedifluoride (PVDF) and its copolymers withtrifluoroethylene and tetra fluoro ethylene.14 PVDFis a semicrystalline synthetic polymer with thechemical formula (CH2–CF2)n. PVDF is producedin thin films, which are stretched along the filmplane and polarized perpendicular to this plane toproduce piezoelectric properties (right).
Because piezoelectric materials can convertmechanical energy to electric energy and viceversa, their applications are dominated byvarious electromechanical sensors and actuators.The piezoelectric effect is used in sensors forvarious physical quantities (such as force,pressure, acceleration, side impact and yaw rate),and in microphones, hydrophones, ultrasonicsensors, seismic sensors, acoustic pickups andmany other devices.
An interesting example of a continuouslydistributed piezoelectric sensor is piezoelectric,or smart, paints.15 Such paint can be preparedusing lead zirconate titanate ceramic powder asa pigment with epoxy resin as a binder. Themixture is coated on a surface and cured andpolarized at room temperature. The resultingpaint film acts as a vibration and acoustic-emission sensor for the entire surface. Thesesmart paints can be used to cover large surfaceareas of individual structural elements and evenentire constructions, such as bridges, to monitortheir integrity. Recent controlled weatheringtrials on river-crossing bridges in the UK andFinland have shown that the piezoelectric-paintsensors can survive harsh outdoor conditions andremain functional for at least six years.16
36 Oilfield Review
> Polarization effects. Dipoles in sintered ceramics are parallel only withineach domain, whereas the domains are polarized randomly (left). Afterpolarization in strong electric field Ep at elevated temperature, the domainsare approximately aligned and the substance becomes piezoelectric (right).
Before Polarization
E p
After Polarization
> Polyvinylidene difluoride (PVDF) treatment toimpart piezoelectric properties. In a melt-castpolymer film, crystallites (tens to hundreds ofnanometers in size) are randomly distributedamong amorphous regions (top). Stretching thepolymer film (middle) significantly aligns polymerchains in the amorphous regions in the sheetplane and facilitates uniform rotation of thecrystallites by an electric field. Polarizationthrough the film thickness (such as by usingdeposited metal electrodes) makes the filmpiezoelectric (bottom). (Figure courtesy of NASA;used with permission, reference 14.)
Melt-Cast
Crystallineregion
Amorphousregion
Electrically Polarized
Elec
tric
field
dire
ctio
n
Mechanically Oriented
Stretchdirection
61459schD8R1.qxp:61459schD8R1 5/15/08 9:04 AM Page 36

Spring 2008 37
Other important examples of piezoelectricactuators are loudspeakers, piezoelectric motorsand high-precision microactuators. High-precision microactuators use the fact that smallchanges in voltage applied to piezoelectricmaterials cause small changes in their shape.This allows fine control of positions and displace -ments of parts and elements, which is critical inthe operation of a variety of devices from inkjetprintheads to guidance systems.
The most significant class of piezoelectricdevices is piezoelectric ultrasonic generators,which, unlike magnetostrictive or other types ofultrasonic generators, provide the most efficientgeneration of ultrasound with controlled powerand frequency. Ultrasound in such generators isproduced using the converse piezoelectric effect.Here, a cyclic application of voltage to apiezoelectric material causes it to expand andcontract, thus emitting a pressure wave.
The creation of piezoelectric ultrasonicgenerators has opened the way for an extremelywide array of applications. The first practicalapplication of piezoelectricity was a piezo -electric quartz ultrasonic generator in an activesonar designed to detect submarines duringWorld War I in 1915.17 Since then, this appli -cation has grown to an extensive collection ofmethods for detecting inhomogeneities invarious media. Flaw detection using ultrasonictechnology tests a broad range of materials andconstructions, including various pipes and pipe -lines. For the general public, the most commonapplication is medical ultrasonography, atechnique for visualizing internal tissues andorgans of the body, especially obstetric ultra -sonography for visualizing an embryo or fetus inutero, which has become a standard procedure ofprenatal care in many countries.
Piezoelectric devices are also found innumerous oilfield applications. A quartzpiezoelectric element is an important part of theSchlumberger CQG Crystal Quartz Gauge, whichis used as a pressure sensor in a wide variety oftools. Piezoelectric ceramic devices also play akey role in Schlumberger seismic, sonic andultrasonic logging instrumentation: as pingers
and hydrophones in the Q-Marine single-sensormarine seismic system and Q-Seabed multi -component seabed seismic system, and asreceivers and monopole transmitters in the SonicScanner acoustic scanning platform, IsolationScanner cement evaluation service andsonicVISION sonic-while-drilling tool. Althoughcurrent applications are limited to sensors,future oilfield applications might utilize thepiezoelectric effect for energy harvesting andmicroactuators.
Magnetically Activated Materials: FastStrength of Minute ParticlesAnother category of smart materials ismagnetorheological (MR) fluids. These fluidshave rheological properties that may be varied byapplying a magnetic field. The change is propor -tional to the magnetic field intensity, can becontrolled very accurately by varying thisintensity, and is immediately reversible afterremoving the field.
A typical MR fluid is a suspension of micron-sized (usually 3 to 8 microns) magneticallysusceptible particles (generally 20 to 40% byvolume of pure iron particles) in a carrier fluid,such as mineral oil, synthetic oil, water orglycol.18 Various surfactants, including oleic andcitric acids, tetramethylammonium hydroxideand soy lecithin, are also added to MR fluids toprevent particles from settling. MR materialssystems may be manufactured as gels, foams,powders, greases, and even solid elastomers.
Without a magnetic field, particles in an MRfluid are randomly distributed. Once a magneticfield is applied, the particles align with themagnetic field to form chains, which resist flow or shear deformation in the directionperpendicular to the magnetic field directionand dramatically increase the viscosity (or moreaccurately, yield strength) in this direction(above). As soon as the magnetic field isremoved, the chains of particles disintegrate(through random Brownian forces) and theinitial viscosity is restored.
11. Perovskite (named after Lev A. Perovski, a Russianmineralogist) is a natural calcium titanate [CaTiO3] with a pseudocubic lattice. This class of solids includes many technologically important ceramics, such assemiconductors and magnetic, ferroelectric andpiezoelectric materials.
12. Kholkin A, Jadidian B and Safari A: “Ceramics,Piezoelectric and Electrostrictive,” in Schwartz MM(ed): Encyclopedia of Smart Materials. New York City:John Wiley & Sons (2002): 139–148.
13. Sintering is a method for forming objects from agranular material by heating the material close to itsmelting point until its particles adhere to one other.
14. Harrison JS and Ounaies Z: “Piezoelectric Polymers,”ICASE Report No. 2001-43, NASA/CR-2001-211422,http://ntrs.nasa.gov/archive/nasa/casi.ntrs.nasa.gov/20020044745_2002075689.pdf (accessed December 24,2007). (Color added to original figure.)
15. Egusa S and Iwasawa N: “Piezoelectric Paints as OneApproach to Smart Structural Materials with Health-Monitoring Capabilities,” Smart Materials andStructures 7, no. 4 (August 1998): 438–445.Egusa S and Iwasawa N: “Piezoelectric Paints:Preparation and Application as Built-In VibrationSensors of Structural Materials,” Journal of MaterialsScience 28, no. 6 (March 1993): 1667–1672.
16. Hale JM and Lahtinen R: “Piezoelectric Paint: Effect ofHarsh Weathering on Aging,” Plastics, Rubber andComposites 36, no. 9 (November 2007): 419–422.
17. Sonar, an acronym for sound navigation and ranging, is a technique that uses underwater sound waves todetect and locate submerged objects. Active sonarsproduce a pulse of sound and then listen for reflectionsof the pulse. Passive sonar equipment only listens forunderwater sounds without transmitting.
18. Henrie AJM and Carlson JD: “Magnetorheological Fluids,”in Schwartz MM (ed): Encyclopedia of Smart Materials.New York City: John Wiley & Sons (2002): 597–600.
> Applying a magnetic field to magnetorheological (MR) fluids. Without amagnetic field, ferrous particles are randomly distributed in a nonmagneticoil to form an MR fluid (top). Once a magnetic field is applied, the particlesalign with the magnetic field to form chains, dramatically increasing theviscosity in the direction perpendicular to the field direction (bottom).
Magnetorheological Liquid
Carrier fluid
Ferrous particles
Mag
netic
fiel
d di
rect
ion
Chains of particlesaligned with the field
61459schD8R1.qxp:61459schD8R1 5/15/08 9:04 AM Page 37
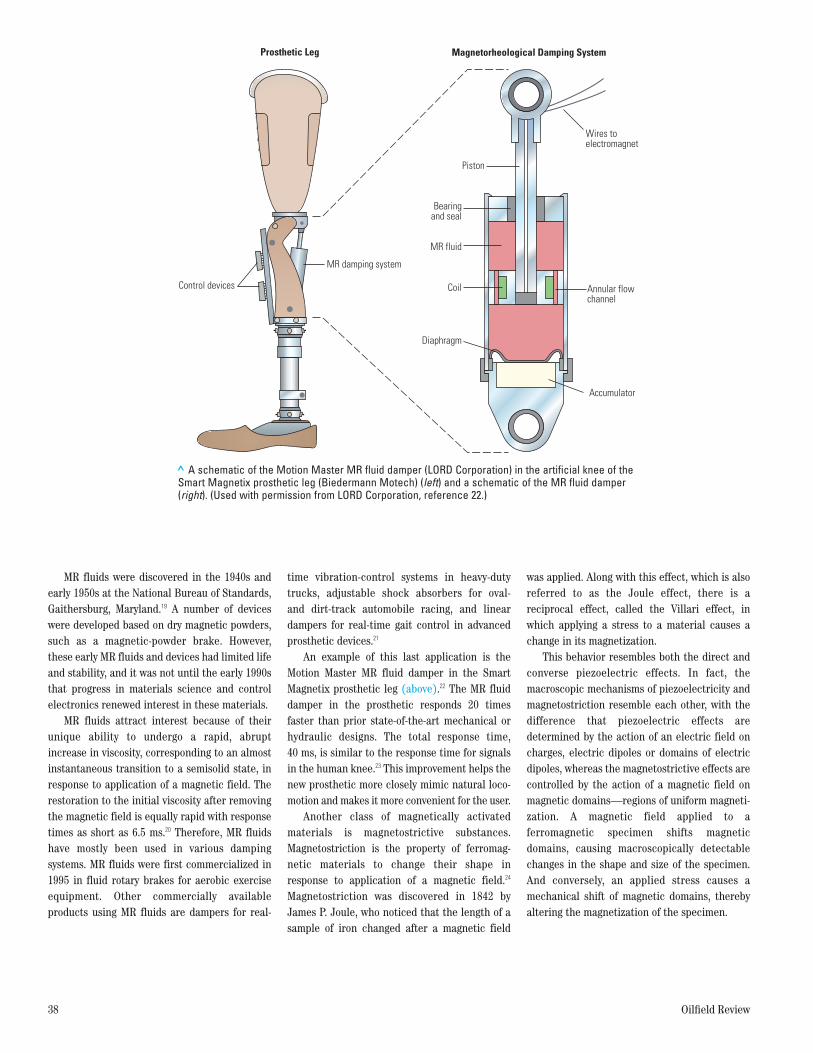
MR fluids were discovered in the 1940s andearly 1950s at the National Bureau of Standards,Gaithersburg, Maryland.19 A number of deviceswere developed based on dry magnetic powders,such as a magnetic-powder brake. However,these early MR fluids and devices had limited lifeand stability, and it was not until the early 1990sthat progress in materials science and controlelectronics renewed interest in these materials.
MR fluids attract interest because of theirunique ability to undergo a rapid, abruptincrease in viscosity, corresponding to an almostinstantaneous transition to a semisolid state, inresponse to application of a magnetic field. Therestoration to the initial viscosity after removingthe magnetic field is equally rapid with responsetimes as short as 6.5 ms.20 Therefore, MR fluidshave mostly been used in various dampingsystems. MR fluids were first commercialized in1995 in fluid rotary brakes for aerobic exerciseequipment. Other commercially availableproducts using MR fluids are dampers for real-
time vibration-control systems in heavy-dutytrucks, adjustable shock absorbers for oval- and dirt-track automobile racing, and lineardampers for real-time gait control in advancedprosthetic devices.21
An example of this last application is theMotion Master MR fluid damper in the SmartMagnetix prosthetic leg (above).22 The MR fluiddamper in the prosthetic responds 20 timesfaster than prior state-of-the-art mechanical orhydraulic designs. The total response time,40 ms, is similar to the response time for signalsin the human knee.23 This improvement helps thenew prosthetic more closely mimic natural loco -mo tion and makes it more convenient for the user.
Another class of magnetically activatedmaterials is magnetostrictive substances.Magnetostriction is the property of ferromag -netic materials to change their shape in response to application of a magnetic field.24
Magnetostriction was discovered in 1842 byJames P. Joule, who noticed that the length of asample of iron changed after a magnetic field
was applied. Along with this effect, which is alsoreferred to as the Joule effect, there is areciprocal effect, called the Villari effect, inwhich applying a stress to a material causes achange in its magnetization.
This behavior resembles both the direct andconverse piezoelectric effects. In fact, themacroscopic mechanisms of piezoelectricity andmagnetostriction resemble each other, with thedifference that piezoelectric effects aredetermined by the action of an electric field oncharges, electric dipoles or domains of electricdipoles, whereas the magnetostrictive effects arecontrolled by the action of a magnetic field onmagnetic domains—regions of uniform magneti -zation. A magnetic field applied to aferro magnetic specimen shifts magneticdomains, causing macroscopically detectablechanges in the shape and size of the specimen.And conversely, an applied stress causes amechanical shift of magnetic domains, therebyaltering the magnetization of the specimen.
38 Oilfield Review
> A schematic of the Motion Master MR fluid damper (LORD Corporation) in the artificial knee of theSmart Magnetix prosthetic leg (Biedermann Motech) (left) and a schematic of the MR fluid damper(right). (Used with permission from LORD Corporation, reference 22.)
MR damping system
Control devices
Prosthetic Leg
Wires toelectromagnet
Bearingand seal
MR fluid
Coil Annular flowchannel
Diaphragm
Magnetorheological Damping System
Accumulator
Piston
61459schD8R1.qxp:61459schD8R1 5/15/08 9:04 AM Page 38

Spring 2008 39
The direct magnetostrictive (Joule) effect isused in magnetostrictive actuators, while theVillari effect is used in magnetostrictive sensors.Applications of magnetostriction include tele -phone receivers, hydrophones, magneto strictiveultrasonic generators for sonars, linear androtational motors, and various sensors fordeformation, motion, position and force.
Chemically Activated Materials: How Swell They AreChemical activation of materials is an almostendless topic. Here, we address only thechemical activation of polymers under exposureto liquids. This phenomenon is general enough tooccur in everyday life and also specific enough tounderlie smart applications, including some inthe oil field. Most people have observed bothintentional and unintentional swelling ofpolymers in ordinary life. For example, spillingcoffee or tea onto a book lets the natural polymercellulose contained in the book paper swell, andpreparing gelatin desserts makes use of theproperty of the polymer gelatin to swell in water.However, such swelling behavior can also bedeleterious: industrial companies may incurgreat losses if even a small gasket made of apolymer unsuitable for the existing operatingconditions swells and degrades, causing leakageor other dangerous consequences.
On the other hand, people have long foundways to use polymer swelling in a controllableway, as in food processing, medicine (absorbentmaterials), chemical spill kits and construction(various fillers). An example of the modernapplication of controllable polymer swelling inmedicine is targeted drug-delivery systems.25 Thesimplest form of such a system is a capsule witha drug-containing core and a swellable coating.The properties of the coating are designed sothat the coating gradually swells and the drug isreleased at given rates at given places as thecapsule is transported through the gastro -intestinal tract. More intricate designs includemultilayer and multidrug capsules, sometimesprovided with special drug-delivery ports.
Swellable polymers are starting to beemployed in oilfield applications. They are usedin swellable packers for zonal isolation andefficient borehole water control (above right).For zonal isolation, a series of unswollen oil-sensitive packers is run into the well. When theyare exposed to oil, they swell and seal off theformation face, creating intervals isolated from
each other. For water control, an unswollenwater-sensitive polymer (elastomer or composite)packer is installed in the well. If waterencroaches into the wellbore, the packer swellsand seals the wellbore at that location, isolatingthe interval so that water influx decreases and oilproduction increases.26
Swellable packers are advantageous com -pared with conventional ones as they aregenerally less expensive, contain no movingparts, and require no mechanical or hydraulicactuation mechanism. All the functions of theseelements are performed by a single piece ofpolymeric smart material.
19. Rabinow J: “Magnetic Fluid Torque and ForceTransmitting Device,” US Patent No. 2,575,360(November 20, 1951).Rabinow J: “The Magnetic Fluid Clutch,” Transactionsof the American Institute of Electrical Engineers 67(1948): 1308–1315.
20. Weiss KD, Duclos TG, Carlson JD, Chrzan MJ andMargida AJ: “High Strength Magneto- and Electro-Rheological Fluids,” Society of Automotive EngineersTechnical Paper Series, no. 932451, Warendale,Pennsylvania, USA (1993): 1–6.
21. Carlson JD and Sproston JL: “Controllable Fluids in2000—Status of ER and MR Fluid Technology,” paperpresented at the Actuator 2000—7th InternationalConference on New Actuators, Bremen, Germany,June 19–21, 2000.
22. http://www.lord.com/Home/MagnetoRheologicalMRFluid/Applications/OtherMRApplicationSolutions/Medical/tabid/3791/Default.aspx (accessed January 5, 2008).
23. Bullough WA: “Fluid Machines,” in Schwartz MM (ed):Encyclopedia of Smart Materials. New York City: JohnWiley & Sons (2002): 448–456.
24. Not only can a ferromagnetic material be magnetized inan external magnetic field, but it remains magnetized afterremoving the field. Examples of ferromagnetic materialsare iron, nickel, cobalt, some rare-earth elements andsome alloys and compounds of these elements.
25. Wise DL (ed): Handbook of Pharmaceutical ControlledRelease Technology. New York City: Marcel Dekker, 2002.
26. http://www.tamintl.com/pdf/FreeCapAd1JPT.pdf(accessed January 11, 2008).
> Photograph (top), schematic (middle) and illustration of swelling (bottom) of a swellable packer.
Swelling
Antiextrusion caps
Swellable packer
61459schD8R1.qxp:61459schD8R1 5/15/08 9:04 AM Page 39
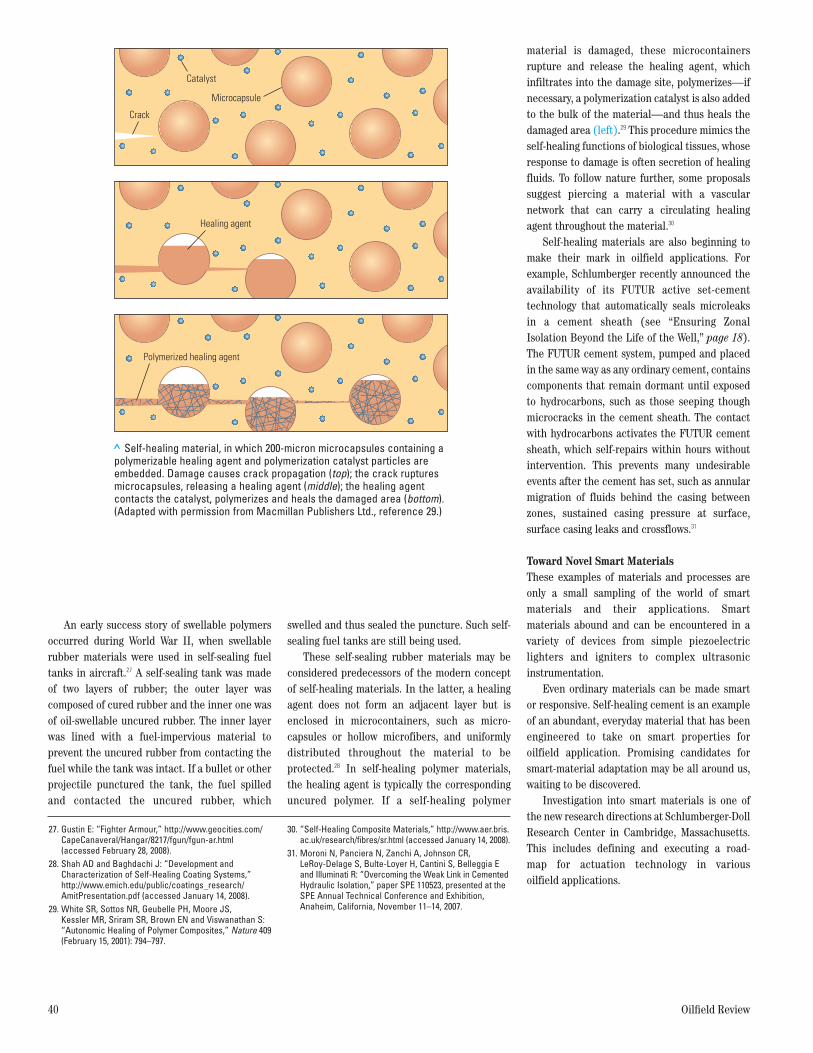
An early success story of swellable polymersoccurred during World War II, when swellablerubber materials were used in self-sealing fueltanks in aircraft.27 A self-sealing tank was madeof two layers of rubber; the outer layer wascomposed of cured rubber and the inner one wasof oil-swellable uncured rubber. The inner layerwas lined with a fuel-impervious material toprevent the uncured rubber from contacting thefuel while the tank was intact. If a bullet or otherprojectile punctured the tank, the fuel spilledand contacted the uncured rubber, which
swelled and thus sealed the puncture. Such self-sealing fuel tanks are still being used.
These self-sealing rubber materials may beconsidered predecessors of the modern conceptof self-healing materials. In the latter, a healingagent does not form an adjacent layer but isenclosed in microcontainers, such as micro -capsules or hollow microfibers, and uniformlydistributed throughout the material to beprotected.28 In self-healing polymer materials,the healing agent is typically the correspondinguncured polymer. If a self-healing polymer
material is damaged, these microcontainersrupture and release the healing agent, whichinfiltrates into the damage site, polymerizes—ifnecessary, a polymerization catalyst is also addedto the bulk of the material—and thus heals thedamaged area (left).29 This procedure mimics theself-healing functions of biological tissues, whoseresponse to damage is often secretion of healingfluids. To follow nature further, some proposalssuggest piercing a material with a vascularnetwork that can carry a circulating healingagent throughout the material.30
Self-healing materials are also beginning tomake their mark in oilfield applications. Forexample, Schlumberger recently announced theavailability of its FUTUR active set-cementtechnology that automatically seals microleaksin a cement sheath (see “Ensuring ZonalIsolation Beyond the Life of the Well,” page 18).The FUTUR cement system, pumped and placedin the same way as any ordinary cement, containscomponents that remain dormant until exposedto hydrocarbons, such as those seeping thoughmicrocracks in the cement sheath. The contactwith hydrocarbons activates the FUTUR cementsheath, which self-repairs within hours withoutintervention. This prevents many undesirableevents after the cement has set, such as annularmigration of fluids behind the casing betweenzones, sustained casing pressure at surface,surface casing leaks and crossflows.31
Toward Novel Smart MaterialsThese examples of materials and processes areonly a small sampling of the world of smartmaterials and their applications. Smartmaterials abound and can be encountered in avariety of devices from simple piezoelectriclighters and igniters to complex ultrasonicinstrumentation.
Even ordinary materials can be made smartor responsive. Self-healing cement is an exampleof an abundant, everyday material that has beenengineered to take on smart properties foroilfield application. Promising candidates forsmart-material adaptation may be all around us,waiting to be discovered.
Investigation into smart materials is one ofthe new research directions at Schlumberger-DollResearch Center in Cambridge, Massachusetts.This includes defining and executing a road-map for actuation technology in various oilfield applications.
40 Oilfield Review
27. Gustin E: “Fighter Armour,” http://www.geocities.com/CapeCanaveral/Hangar/8217/fgun/fgun-ar.html(accessed February 28, 2008).
28. Shah AD and Baghdachi J: “Development andCharacterization of Self-Healing Coating Systems,”http://www.emich.edu/public/coatings_research/AmitPresentation.pdf (accessed January 14, 2008).
29. White SR, Sottos NR, Geubelle PH, Moore JS,Kessler MR, Sriram SR, Brown EN and Viswanathan S:“Autonomic Healing of Polymer Composites,” Nature 409(February 15, 2001): 794–797.
30. “Self-Healing Composite Materials,” http://www.aer.bris.ac.uk/research/fibres/sr.html (accessed January 14, 2008).
31. Moroni N, Panciera N, Zanchi A, Johnson CR, LeRoy-Delage S, Bulte-Loyer H, Cantini S, Belleggia Eand Illuminati R: “Overcoming the Weak Link in CementedHydraulic Isolation,” paper SPE 110523, presented at theSPE Annual Technical Conference and Exhibition,Anaheim, California, November 11–14, 2007.
> Self-healing material, in which 200-micron microcapsules containing apolymerizable healing agent and polymerization catalyst particles areembedded. Damage causes crack propagation (top); the crack rupturesmicrocapsules, releasing a healing agent (middle); the healing agentcontacts the catalyst, polymerizes and heals the damaged area (bottom).(Adapted with permission from Macmillan Publishers Ltd., reference 29.)
Catalyst
Microcapsule
Crack
Healing agent
Polymerized healing agent
61459schD8R1.qxp:61459schD8R1 6/25/08 8:27 PM Page 40

Spring 2008 41
A significant part of implementing theroadmap involves defining and developingcommon technological building blocks that canbe integrated in various ways to provideactuation applications. This will be accomplishedby studying actuation systems—actuators,sensors, system dynamics and control, and novelmechanisms—and applying smart materials toinvent new actuating systems (right).
While materials-science researchers areexcited about the enormous potential of smartmaterials, these new materials are unlikely tosupplant the standard materials we use every day.The vast majority of materials are structural—selected not only for their proper ties, but becausethey are cheap and abundant. Smart materials,like other functional materials, including
tungsten filaments in light bulbs, platinum-rhodium wire in thermocouples and diamond tipsin drill bits, typically have small-volumeapplications. These require unique proper ties forwhich there are few or no substitutes, and thuscost is less of an issue. For sophisticated oilfieldtools, smart materials may allow implementationof new technologies, miniaturization of parts andenhanced reliability in the increasingly harshdownhole environment. —VG
> A researcher (above) studying the thermo -mechanical properties of a specimen of amaterial at Schlumberger-Doll Research (SDR)Center, Cambridge, Massachusetts (below left).
61459schD8R1.qxp:61459schD8R1 5/15/08 9:04 AM Page 41

42 Oilfield Review
Seismic Inversion: Reading Between the Lines
Frazer Barclay Perth, Western Australia, Australia
Anders BruunKlaus Bolding RasmussenCopenhagen, Denmark
Jose Camara AlfaroPemexTampico, Tamaulipas, Mexico
Anthony CookeAberdeen, Scotland
Dennis CookeDarren SalterSantosPerth, Western Australia
Robert GodfreyDominic LowdenSteve McHugoHüseyin ÖzdemirStephen PickeringGatwick, England
Francisco Gonzalez PinedaPemexReynosa, Tamaulipas, Mexico
Jorg HerwangerStefano VolterraniHouston, Texas, USA
Andrea MurinedduAndreas RasmussenStavanger, Norway
Ron RobertsApache CorporationCalgary, Alberta, Canada
For help in preparation of this article, thanks to Trine Alsos,StatoilHydro, Harstad, Norway; Ted Bakamjian, SEG, Tulsa;Richard Bottomley, Mexico City; Jonathan Bown, Henrik JuhlHansen and Kim Gunn Maver, Copenhagen; Tim Bunting,Kuala Lumpur; Karen Sullivan Glaser, Houston; JalalKhazanehdari, Abu Dhabi, UAE; Hasbi Lubis, Gatwick,England; Farid Mohamed, Aberdeen; Richard Patenall, Perth,Western Australia; Pramesh Tyagi, Cairo; and Anke SimoneWendt, Stavanger.ECLIPSE, ISIS and Q-Marine are marks of Schlumberger.
The reflections of seismic waves from subsurface layers illuminate potential
hydrocarbon accumulations. As waves reflect, their amplitudes change to reveal
important information about the underlying materials. Seismic amplitude inversion
uses reflection amplitudes, calibrated with well data, to extract details that can be
correlated with porosity, lithology, fluid saturation and geomechanical parameters.
The undisputed leader among tools foridentifying potential exploration targets is the3D seismic survey. These surveys probe greatvolumes of the subsurface, helping oil and gascompanies map geological structures and selectdrilling locations.
The original use of seismic data, and still themain use today, has been to identify the geometryof reflectors and ascertain their depths. This ispossible because seismic waves reflect atinterfaces between materials of differentacoustic properties.
However, seismic reflection data containinformation beyond reflector location: everyreflection changes the amplitude of the returnedwave. The controlling property in this change atthe interface is the contrast in impedance, whichis the product of density and velocity. Seismicreflection amplitude information can be used toback out, or invert for, the relative impedances ofthe materials on both sides of the interface. Bycorrelating these seismically derived propertieswith values measured in the borehole, inter -preters may be able to extend well informationthroughout the entire seismic volume. Thisprocess, called seismic inversion for reservoir
characterization, can help fill gaps in ourknowledge of formation properties between wells.
This article describes the science and art ofseismic inversion, and how oil and gas companiesare using it to reduce risk in their exploration,development and production operations. After anintroduction to the uses of inversion, we presentits various types, from simple to more complex.Examples from Mexico, Egypt, Australia and theNorth Sea demonstrate applications of inversionto fine-tune drilling locations, characterize hard-to-image reservoirs, map water saturation,improve reservoir simulations and enhanceknowledge of geomechanical properties.
Inversion BasicsMany measurements in the E&P industry rely tosome extent on inversion for their interpretation.The reason is simple. For several measurement-interpretation problems, no equation that directlyrelates the multiple measurements—whichinclude noise, losses and other inaccuracies—canbe solved with a unique answer. We then resort toinversion, which is a mathematical way ofestimating an answer, checking it againstobservations and modifying it until the answer is acceptable.
1. Quirein J, Kimminau S, La Vigne J, Singer J and Wendel F:“A Coherent Framework for Developing and ApplyingMultiple Formation Evaluation Models,” Transactions ofthe SPWLA 27th Annual Logging Symposium, Houston,June 9–13, 1986, paper DD.Jammes L, Faivre O, Legendre E, Rothnemer P, Trouiller J-C, Galli M-T, Gonfalini M and Gossenberg P:“Improved Saturation Determination in Thin-BedEnvironments Using 2D Parametric Inversion,” paperSPE 62907, presented at the SPE Annual TechnicalConference and Exhibition, Dallas, October 1–4, 2000.
Faivre O, Barber T, Jammes L and Vuhoang D: “UsingArray Induction and Array Laterolog Data to CharacterizeResistivity Anisotropy in Vertical Wells,” Transactions ofthe SPWLA 43rd Annual Logging Symposium, Oiso,Japan, June 4–7, 2002, paper M.Marsala AF, Al-Ruwaili S, Ma SM, Modiu SL, Ali Z,Donadille J-M and Wilt M: “Crosswell ElectromagneticTomography in Haradh Field: Modeling to Measurements,”paper SPE 110528, presented at the SPE Annual TechnicalConference and Exhibition, Anaheim, California, USA,November 11–14, 2007.
61459schD9R1.qxp:61459schD9R1 5/20/08 4:54 AM Page 42
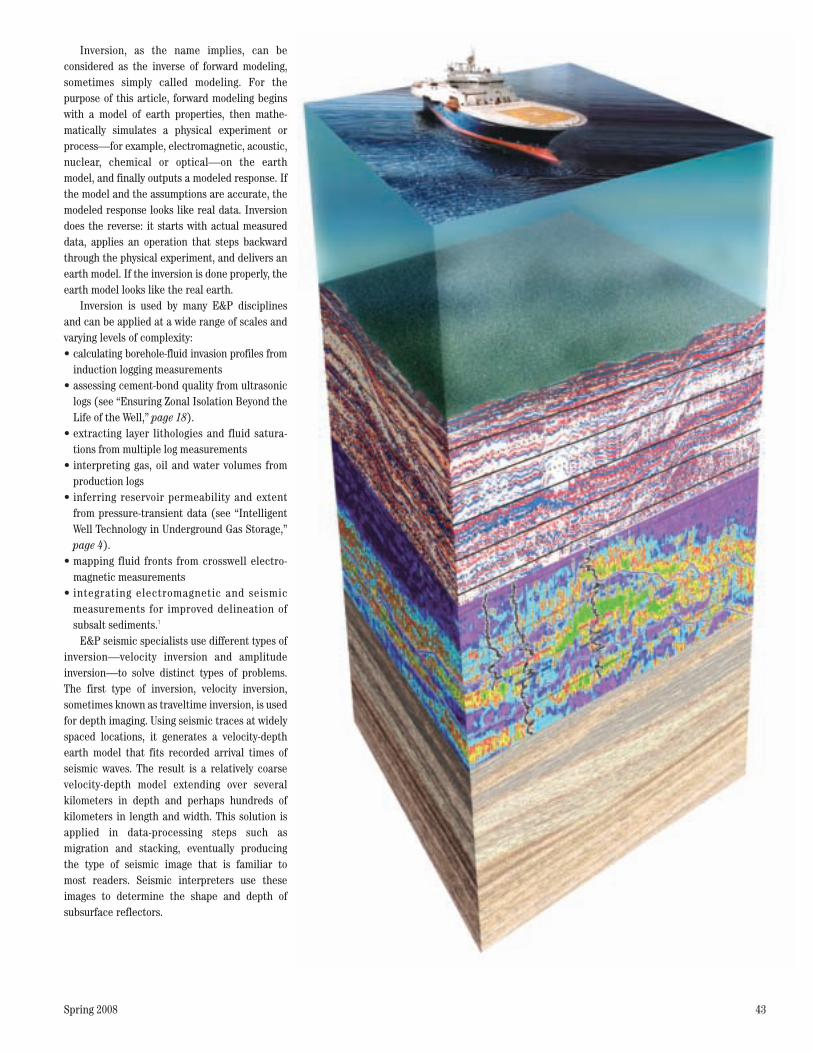
Spring 2008 43
Inversion, as the name implies, can beconsidered as the inverse of forward modeling,sometimes simply called modeling. For thepurpose of this article, forward modeling beginswith a model of earth properties, then mathe -mati cally simulates a physical experiment orprocess—for example, electromagnetic, acoustic,nuclear, chemical or optical—on the earthmodel, and finally outputs a modeled response. Ifthe model and the assumptions are accurate, themodeled response looks like real data. Inversiondoes the reverse: it starts with actual measureddata, applies an operation that steps backwardthrough the physical experiment, and delivers anearth model. If the inversion is done properly, theearth model looks like the real earth.
Inversion is used by many E&P disciplinesand can be applied at a wide range of scales andvarying levels of complexity:• calculating borehole-fluid invasion profiles from
induction logging measurements• assessing cement-bond quality from ultrasonic
logs (see “Ensuring Zonal Isolation Beyond theLife of the Well,” page 18).
• extracting layer lithologies and fluid satura-tions from multiple log measurements
• interpreting gas, oil and water volumes fromproduction logs
• inferring reservoir permeability and extentfrom pressure-transient data (see “IntelligentWell Technology in Underground Gas Storage,”page 4).
• mapping fluid fronts from crosswell electro-magnetic measurements
• integrating electromagnetic and seismic measurements for improved delineation ofsubsalt sediments.1
E&P seismic specialists use different types ofinversion—velocity inversion and amplitudeinversion—to solve distinct types of problems.The first type of inversion, velocity inversion,sometimes known as traveltime inversion, is usedfor depth imaging. Using seismic traces at widelyspaced locations, it generates a velocity-depthearth model that fits recorded arrival times ofseismic waves. The result is a relatively coarsevelocity-depth model extending over severalkilometers in depth and perhaps hundreds ofkilometers in length and width. This solution isapplied in data-processing steps such asmigration and stacking, eventually producing the type of seismic image that is familiar to most readers. Seismic interpreters use theseimages to determine the shape and depth of subsurface reflectors.
61459schD9R1.qxp:61459schD9R1 5/20/08 4:54 AM Page 43
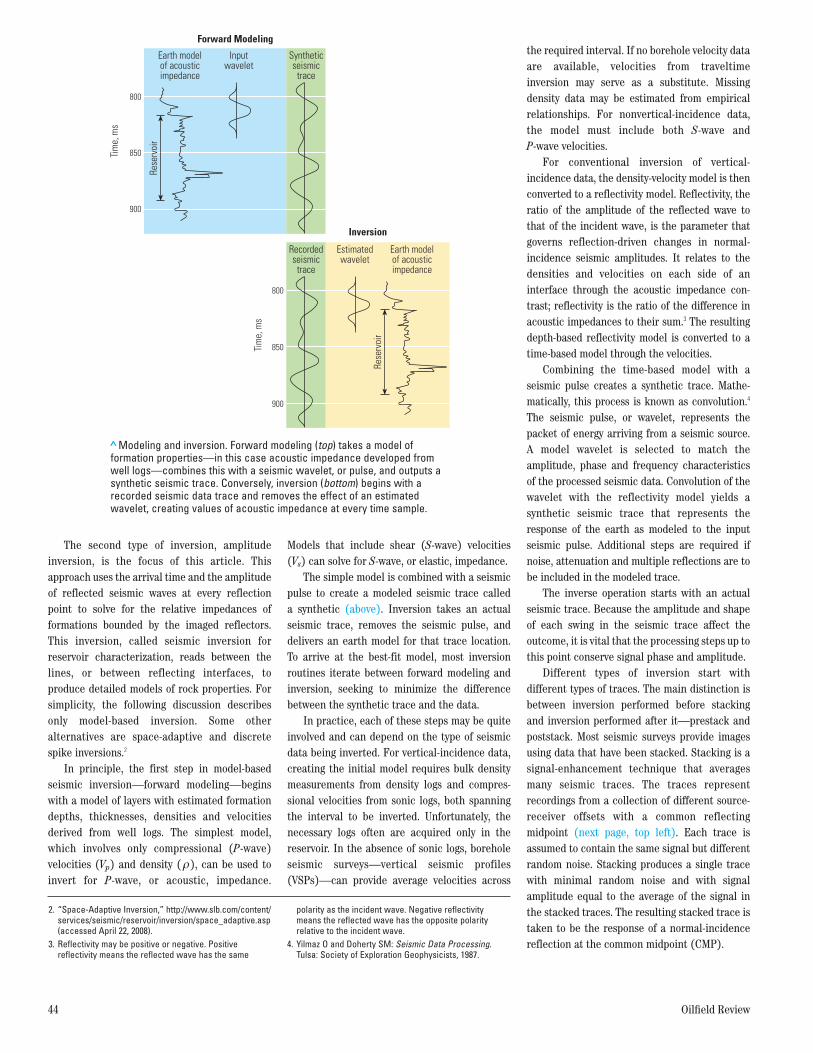
The second type of inversion, amplitudeinversion, is the focus of this article. Thisapproach uses the arrival time and the amplitudeof reflected seismic waves at every reflectionpoint to solve for the relative impedances offormations bounded by the imaged reflectors.This inversion, called seismic inversion forreservoir characterization, reads between thelines, or between reflecting interfaces, toproduce detailed models of rock properties. Forsimplicity, the following discussion describesonly model-based inversion. Some otheralternatives are space-adaptive and discretespike inversions.2
In principle, the first step in model-basedseismic inversion—forward modeling—beginswith a model of layers with estimated formationdepths, thicknesses, densities and velocitiesderived from well logs. The simplest model,which involves only compressional (P-wave)velocities (Vp) and density (ρ), can be used toinvert for P-wave, or acoustic, impedance.
Models that include shear (S-wave) velocities(Vs) can solve for S-wave, or elastic, impedance.
The simple model is combined with a seismicpulse to create a modeled seismic trace called a synthetic (above). Inversion takes an actualseismic trace, removes the seismic pulse, anddelivers an earth model for that trace location.To arrive at the best-fit model, most inversionroutines iterate between forward modeling andinversion, seeking to minimize the differencebetween the synthetic trace and the data.
In practice, each of these steps may be quiteinvolved and can depend on the type of seismicdata being inverted. For vertical-incidence data,creating the initial model requires bulk densitymeasurements from density logs and compres -sional velocities from sonic logs, both spanningthe interval to be inverted. Unfortunately, thenecessary logs often are acquired only in thereservoir. In the absence of sonic logs, boreholeseismic surveys—vertical seismic profiles(VSPs)—can provide average velocities across
the required interval. If no borehole velocity dataare available, velocities from traveltimeinversion may serve as a substitute. Missingdensity data may be estimated from empiricalrelationships. For nonvertical-incidence data,the model must include both S-wave and P-wave velocities.
For conventional inversion of vertical-incidence data, the density-velocity model is thenconverted to a reflectivity model. Reflectivity, theratio of the amplitude of the reflected wave tothat of the incident wave, is the parameter thatgoverns reflection-driven changes in normal-incidence seismic amplitudes. It relates to thedensities and velocities on each side of aninterface through the acoustic impedance con -trast; reflectivity is the ratio of the difference inacoustic impedances to their sum.3 The resultingdepth-based reflectivity model is converted to atime-based model through the velocities.
Combining the time-based model with aseismic pulse creates a synthetic trace. Mathe -matically, this process is known as convolution.4
The seismic pulse, or wavelet, repre sents thepacket of energy arriving from a seismic source. A model wavelet is selected to match theamplitude, phase and frequency characteristicsof the processed seismic data. Convolution of thewavelet with the reflectivity model yields asynthetic seismic trace that repre sents theresponse of the earth as modeled to the inputseismic pulse. Additional steps are required ifnoise, attenuation and multiple reflections are tobe included in the modeled trace.
The inverse operation starts with an actualseismic trace. Because the amplitude and shapeof each swing in the seismic trace affect theoutcome, it is vital that the processing steps up tothis point conserve signal phase and amplitude.
Different types of inversion start withdifferent types of traces. The main distinction isbetween inversion performed before stackingand inversion performed after it—prestack andpoststack. Most seismic surveys provide imagesusing data that have been stacked. Stacking is asignal-enhancement technique that averagesmany seismic traces. The traces representrecordings from a collection of different source-receiver offsets with a common reflectingmidpoint (next page, top left). Each trace isassumed to contain the same signal but differentrandom noise. Stacking produces a single tracewith minimal random noise and with signalamplitude equal to the average of the signal inthe stacked traces. The resulting stacked trace istaken to be the response of a normal-incidencereflection at the common midpoint (CMP).
44 Oilfield Review
2. “Space-Adaptive Inversion,” http://www.slb.com/content/services/seismic/reservoir/inversion/space_adaptive.asp(accessed April 22, 2008).
3. Reflectivity may be positive or negative. Positivereflectivity means the reflected wave has the same
polarity as the incident wave. Negative reflectivitymeans the reflected wave has the opposite polarityrelative to the incident wave.
4. Yilmaz O and Doherty SM: Seismic Data Processing.Tulsa: Society of Exploration Geophysicists, 1987.
>Modeling and inversion. Forward modeling (top) takes a model offormation properties—in this case acoustic impedance developed fromwell logs—combines this with a seismic wavelet, or pulse, and outputs asynthetic seismic trace. Conversely, inversion (bottom) begins with arecorded seismic data trace and removes the effect of an estimatedwavelet, creating values of acoustic impedance at every time sample.
Inversion
Forward Modeling
Tim
e, m
s
800
850
900
Earth modelof acousticimpedance
Inputwavelet
Syntheticseismic
trace
Rese
rvoi
r
Tim
e, m
s
800
850
900
Recordedseismic
trace
Estimatedwavelet
Earth modelof acousticimpedance
Rese
rvoi
r
61459schD9R1.qxp:61459schD9R1 5/20/08 4:54 AM Page 44
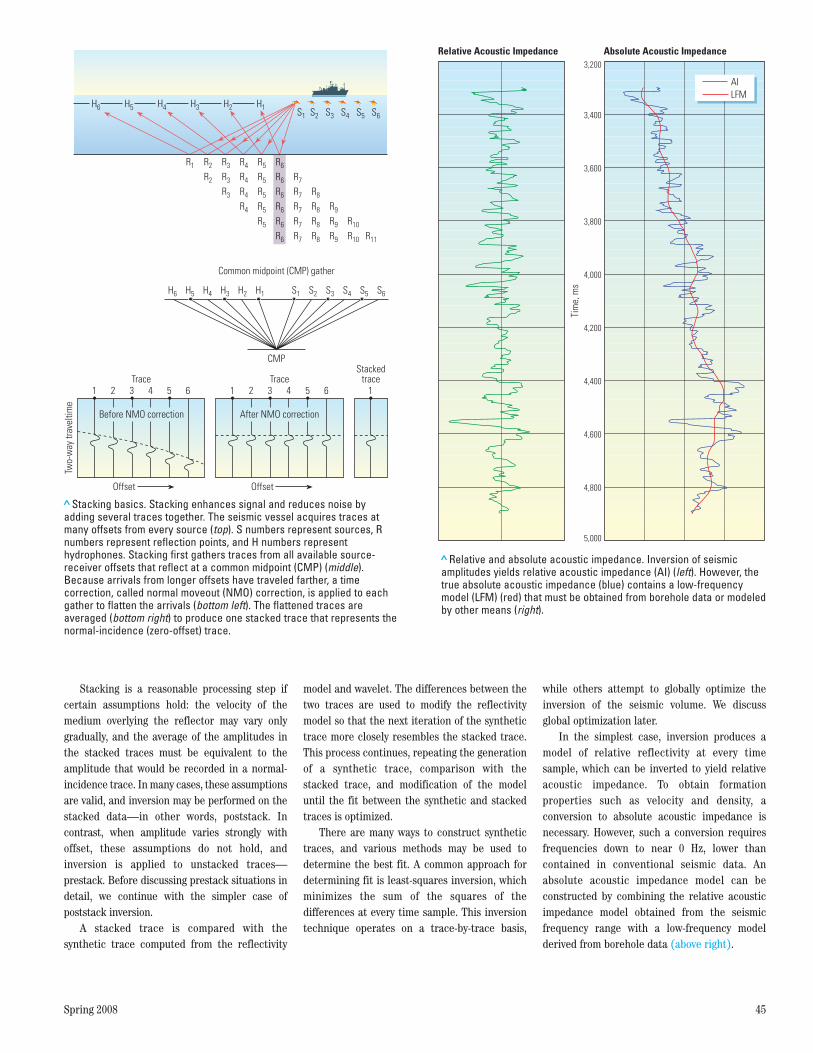
Spring 2008 45
Stacking is a reasonable processing step ifcertain assumptions hold: the velocity of themedium overlying the reflector may vary onlygradually, and the average of the amplitudes inthe stacked traces must be equivalent to theamplitude that would be recorded in a normal-incidence trace. In many cases, these assump tionsare valid, and inversion may be performed on thestacked data—in other words, poststack. Incontrast, when amplitude varies strongly withoffset, these assumptions do not hold, andinversion is applied to unstacked traces—prestack. Before discussing prestack situations indetail, we continue with the simpler case ofpoststack inversion.
A stacked trace is compared with thesynthetic trace computed from the reflectivity
model and wavelet. The differences between thetwo traces are used to modify the reflectivitymodel so that the next iteration of the synthetictrace more closely resembles the stacked trace.This process continues, repeating the generationof a synthetic trace, comparison with thestacked trace, and modification of the modeluntil the fit between the synthetic and stackedtraces is optimized.
There are many ways to construct synthetictraces, and various methods may be used todetermine the best fit. A common approach fordetermining fit is least-squares inversion, whichminimizes the sum of the squares of thedifferences at every time sample. This inversiontechnique operates on a trace-by-trace basis,
while others attempt to globally optimize theinversion of the seismic volume. We discussglobal optimization later.
In the simplest case, inversion produces amodel of relative reflectivity at every timesample, which can be inverted to yield relativeacoustic impedance. To obtain formationproperties such as velocity and density, aconversion to absolute acoustic impedance isnecessary. However, such a conversion requiresfrequencies down to near 0 Hz, lower thancontained in conventional seismic data. Anabsolute acoustic impedance model can beconstructed by combining the relative acousticimpedance model obtained from the seismicfrequency range with a low-frequency modelderived from borehole data (above right).
> Stacking basics. Stacking enhances signal and reduces noise byadding several traces together. The seismic vessel acquires traces atmany offsets from every source (top). S numbers represent sources, Rnumbers represent reflection points, and H numbers representhydrophones. Stacking first gathers traces from all available source-receiver offsets that reflect at a common midpoint (CMP) (middle).Because arrivals from longer offsets have traveled farther, a timecorrection, called normal moveout (NMO) correction, is applied to eachgather to flatten the arrivals (bottom left). The flattened traces areaveraged (bottom right) to produce one stacked trace that represents thenormal-incidence (zero-offset) trace.
CMP
Common midpoint (CMP) gather
H5 H2 H1 S1 S3 S5H4 H3 S2 S4H6 S6
H6 H5 H4 H3 H2 H1
R1 R2 R3 R4 R5 R6
R2 R3 R4 R5 R6 R7
R3 R4 R5 R6 R7 R8
R4 R5 R6 R7 R8 R9
R5 R6 R7 R8 R9 R10
R6 R7 R8 R9 R10 R11
S1 S2 S3 S4 S5 S6
Two-
way
trav
eltim
e
1Trace
2 3 4 5 6
Before NMO correction
Offset
1Trace
2 3 4 5 6
After NMO correction
Offset
1
Stackedtrace
> Relative and absolute acoustic impedance. Inversion of seismicamplitudes yields relative acoustic impedance (AI) (left). However, thetrue absolute acoustic impedance (blue) contains a low-frequencymodel (LFM) (red) that must be obtained from borehole data or modeledby other means (right).
3,600
Tim
e, m
s
3,800
4,000
4,200
4,400
4,600
3,400
4,800
5,000
3,200Relative Acoustic Impedance Absolute Acoustic Impedance
AILFM
61459schD9R1.qxp:61459schD9R1 5/20/08 4:54 AM Page 45

Relating seismically derived acoustic impe d -ances to formation properties makes use ofcorrelations between logging measurements. Forexample, crossplotting acoustic impedance andporosity measured in nearby wells establishes atransform that allows seismically measuredacoustic impedance to be converted to porosityvalues throughout the seismic volume. Anexample from a carbonate reservoir in Mexicodemonstrates the power of this technique.
Inversion for Porosity in MexicoFollowing the 2003 discovery of the Lobina field offshore Mexico, Pemex contracted withWesternGeco to obtain a seismic survey withbetter resolution than one acquired in 1996.Seismic data with increased frequency contentwould significantly enhance the ability ofinterpreters to map key reservoir layers. Thecompany’s objective was to identify high-porosityzones within two carbonate layers: the primaryJurassic San Andres (Jsa) limestone and theinferior shallower Cretaceous Tamaulipas (Kti)carbonate target.
A Q-Marine high-resolution 3D seismic surveyachieved a maximum frequency of 60 Hz,doubling that of the 1996 survey.5 Inversion of the new data generated porosity maps thathelped rank previously defined drilling locations,determine new potential locations and optimizedevelopment drilling.
Trace-by-trace inversion of the stackedseismic data allowed geophysicists to obtainrelative acoustic impedance at every tracethroughout the seismic volume. Key horizons thathad been interpreted as strong acoustic eventswere converted from time to depth by correlationwith formations seen in well logs. Thiscombination of interpreted horizons and values ofacoustic impedance at these points enabled thecreation of a low-frequency model to convert therelative acoustic impedance to an absolutemeasurement (above left).6
Crossplotting porosity with acoustic impe d -ance from logs and core data in the survey arearevealed a strong correlation between the twoproperties—an increase in porosity causes adecrease in velocity, a decrease in density, andtherefore a corresponding decrease in acousticimpedance (left). Porosity-acoustic impe d ancefunctions were created for the Jsa and Ktiformations separately. Applying these correla tionsto the seismically derived acoustic impedancevolume, geophysicists created fieldwide maps ofporosity. The seismic porosity results were
46 Oilfield Review
> Absolute acoustic impedance from poststack inversion. Inversion ofseismic amplitudes generated the color-coded panel, with low acousticimpedance in pink and red, and high acoustic impedance in blue and green.The acoustic impedance calculated from density and sonic logs, displayedat the well location in the middle of the panel, shows a good correlationwith the seismically derived values.
Two-
way
tim
e, s
2.00
2.05
2.10
2.15
2.20
2.25
2.30
2.35
2.40
2.45
2.50
Acoustic impedance
Common depth point (CDP)2,700 2,800
> Acoustic impedance and porosity. The strong correlation betweenporosity and acoustic impedance from logs and core data in the Jsaformation indicates a robust transform for application to seismic inversionresults. As in other carbonate rocks, an increase in acoustic impedance isrelated to a decrease in porosity. A separate porosity-acoustic impedancefunction was created for the Kti formation.
8
Effe
ctiv
e po
rosi
ty, %
10 12 14 16
Edited acoustic impedance (Zp), km/s . g/cm3
0
10
20
30Crossplot Analysis
0.70 0.93Water saturation
61459schD9R1.qxp:61459schD9R1 5/20/08 4:54 AM Page 46

Spring 2008 47
checked using “blind wells,” that is, wells thatwere not used in the inversion. The seismicallyderived porosity closely matched the blind-wellporosity logs, adding confidence to the seismicallycalculated results.
The porosity maps had a significant impact ondefining infill drilling locations. In the nearbyArenque field, covered by the same survey,Pemex upgraded four previously identifiedprospects. Increased priority was given to thetwo locations corresponding to higher porosity inthe seismic volume. In one area, the inversioncalculations allowed identification of undrilled,discrete porosity features (right). With theseresults, well placement could be designed tomaximize contact with high-porosity zones in theJsa formation.
In another area where seismic porosityresults were used to guide drilling, a wellproduced oil from the Jsa formation at2,000 bbl/d [318 m3/d]. The seismically derivedresults show excellent correlation with theporosity measured in the well (below right).
Inversion When Offset MattersIn many cases, the stacking process does notadequately preserve amplitude. For example,when traces exhibit amplitude variation withoffset (AVO), the trace that results from stackingdoes not have the same amplitudes as thevertical-incidence, or zero-offset, trace. Underthese conditions, inversion should be performedon data that have not been stacked. Moreover,the parameters that cause the amplitude tochange can be modeled and used to further theinversion process.
Data preparation for inversion of AVO tracesrequires steps similar to those for preparation forstacking. Traces reflecting at a common midpointare gathered and sorted by offset, which isrelated to incidence angle. Then, a velocitymodel is applied to each gather to flatten events
5. Salter R, Shelander D, Beller M, Flack B, Gillespie D,Moldoveanu N, Gonzalez Pineda F and Camara Alfaro J:“Using High-Resolution Seismic for Carbonate ReservoirDescription,” World Oil 227, no. 3 (March 2006): 57–66.
6. Salter R, Shelander D, Beller M, Flack B, Gillespie D,Moldoveanu N, Pineda F and Camara J: “The Impact ofHigh-Resolution Seismic Data on Carbonate ReservoirDescription, Offshore Mexico,” Expanded Abstracts,75th SEG Annual International Meeting and Exposition,Houston (November 6–11, 2005): 1347–1350.
> Identifying undrilled high-porosity targets. Inversion revealed a high-porosity interval (purple and red), helping Pemex delineate zones that couldbe reached with new wells. The black line is a possible well trajectory. Anexisting well is shown in gold.
2,200
Two-
way
tim
e, m
s
2,250
2,300
2,350
2,400
2,450
2,500
2,550
2,6001,100 1,125 1,150 1,175 1,200 1,225 1,250 1,275 1,3001,075
Crossline number
Porosity
> Results of drilling into a zone predicted to have high porosity. A wellpenetrated both the Cretaceous (Kti) and Jurassic (Jsa) reservoirs,encountering porosities that matched values predicted for the twocarbonate zones. The green circle marks the top of the Kti formation, andthe light blue circle marks the top of the Jsa formation. The porosity log,projected on the well path, has the same color-coding as the seismicallypredicted porosities.
Kti
Jp
Jsa
Bas
N
Poro
sity
61459schD9R1.qxp:61459schD9R1 5/20/08 4:54 AM Page 47
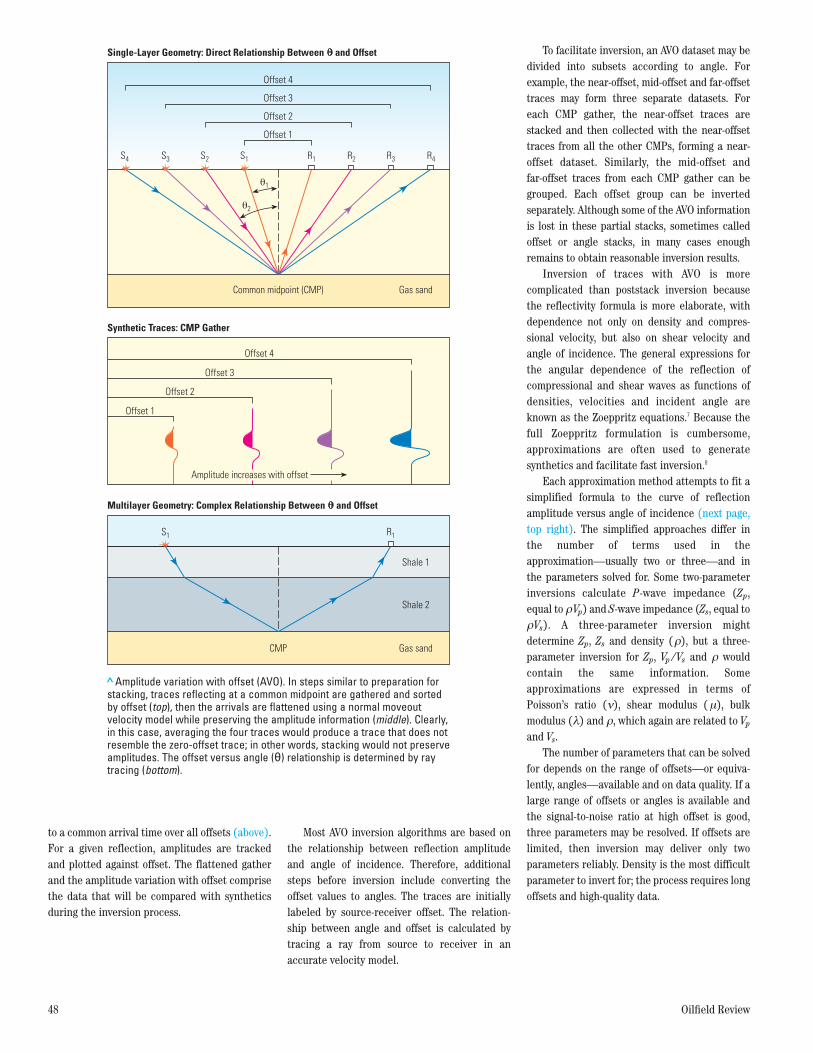
to a common arrival time over all offsets (above).For a given reflection, amplitudes are trackedand plotted against offset. The flattened gatherand the amplitude variation with offset comprisethe data that will be compared with syntheticsduring the inversion process.
Most AVO inversion algorithms are based onthe relationship between reflection amplitudeand angle of incidence. Therefore, additionalsteps before inversion include converting theoffset values to angles. The traces are initiallylabeled by source-receiver offset. The relation -ship between angle and offset is calculated bytracing a ray from source to receiver in anaccurate velocity model.
To facilitate inversion, an AVO dataset may bedivided into subsets according to angle. Forexample, the near-offset, mid-offset and far-offsettraces may form three separate datasets. Foreach CMP gather, the near-offset traces arestacked and then collected with the near-offsettraces from all the other CMPs, forming a near-offset dataset. Similarly, the mid-offset andfar-offset traces from each CMP gather can begrouped. Each offset group can be invertedseparately. Although some of the AVO infor mationis lost in these partial stacks, sometimes calledoffset or angle stacks, in many cases enoughremains to obtain reasonable inversion results.
Inversion of traces with AVO is morecomplicated than poststack inversion becausethe reflectivity formula is more elaborate, withdependence not only on density and compres -sional velocity, but also on shear velocity andangle of incidence. The general expressions forthe angular dependence of the reflection ofcompressional and shear waves as functions ofdensities, velocities and incident angle areknown as the Zoeppritz equations.7 Because thefull Zoeppritz formulation is cumbersome,approximations are often used to generatesynthetics and facilitate fast inversion.8
Each approximation method attempts to fit asimplified formula to the curve of reflectionamplitude versus angle of incidence (next page,top right). The simplified approaches differ inthe number of terms used in theapproximation—usually two or three—and inthe parameters solved for. Some two-parameterinversions calculate P-wave impedance (Zp,equal to ρVp) and S-wave impedance (Zs, equal toρVs). A three-parameter inversion mightdetermine Zp, Zs and density (ρ), but a three-parameter inversion for Zp, Vp /Vs and ρ wouldcontain the same information. Someapproximations are expressed in terms ofPoisson’s ratio (ν), shear modulus (μ), bulkmodulus (λ) and ρ, which again are related to Vp
and Vs.The number of parameters that can be solved
for depends on the range of offsets—or equiva -lently, angles—available and on data quality. If alarge range of offsets or angles is available andthe signal-to-noise ratio at high offset is good,three parameters may be resolved. If offsets arelimited, then inversion may deliver only twoparameters reliably. Density is the most difficultparameter to invert for; the process requires longoffsets and high-quality data.
48 Oilfield Review
> Amplitude variation with offset (AVO). In steps similar to preparation forstacking, traces reflecting at a common midpoint are gathered and sortedby offset (top), then the arrivals are flattened using a normal moveoutvelocity model while preserving the amplitude information (middle). Clearly,in this case, averaging the four traces would produce a trace that does notresemble the zero-offset trace; in other words, stacking would not preserveamplitudes. The offset versus angle (θ) relationship is determined by raytracing (bottom).
Offset 1
Offset 2
Offset 3
Offset 4
Amplitude increases with offset
Synthetic Traces: CMP Gather
Single-Layer Geometry: Direct Relationship Between and Offset
Offset 4
Offset 3
Offset 2
Offset 1
S4 S3 S2 S1 R1 R2 R3 R4
θ1
θ2
Gas sandCommon midpoint (CMP)
Multilayer Geometry: Complex Relationship Between and Offset
S1 R1
Shale 1
Shale 2
Gas sandCMP
61459schD9R1.qxp:61459schD9R1 5/20/08 4:54 AM Page 48
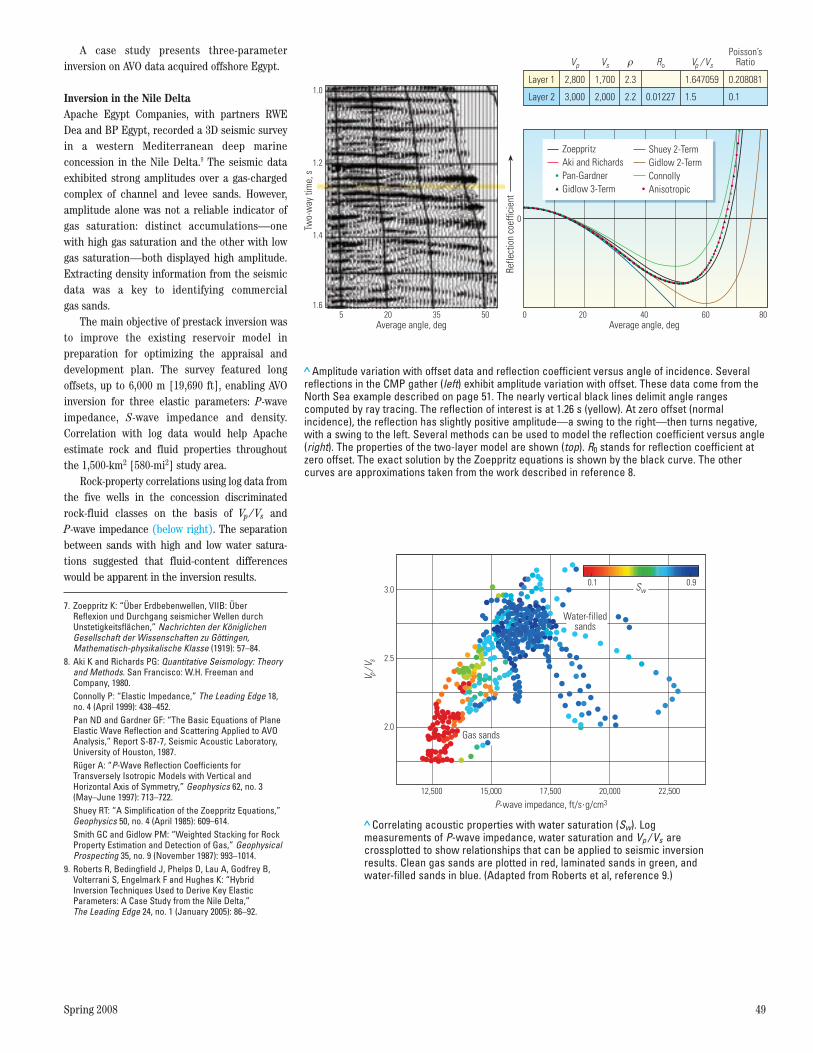
Spring 2008 49
A case study presents three-parameterinversion on AVO data acquired offshore Egypt.
Inversion in the Nile DeltaApache Egypt Companies, with partners RWEDea and BP Egypt, recorded a 3D seismic surveyin a western Mediterranean deep marineconcession in the Nile Delta.9 The seismic dataexhibited strong amplitudes over a gas-chargedcomplex of channel and levee sands. However,amplitude alone was not a reliable indicator ofgas saturation: distinct accumulations—onewith high gas saturation and the other with lowgas saturation—both displayed high amplitude.Extracting density information from the seismicdata was a key to identifying commercial gas sands.
The main objective of prestack inversion wasto improve the existing reservoir model inpreparation for optimizing the appraisal anddevelopment plan. The survey featured longoffsets, up to 6,000 m [19,690 ft], enabling AVOinversion for three elastic parameters: P-waveimpedance, S-wave impedance and density.Correlation with log data would help Apacheestimate rock and fluid properties throughoutthe 1,500-km2 [580-mi2] study area.
Rock-property correlations using log data fromthe five wells in the concession discrimi natedrock-fluid classes on the basis of Vp / Vs and P-wave impedance (below right). The separationbetween sands with high and low water satura -tions suggested that fluid-content differenceswould be apparent in the inversion results.
7. Zoeppritz K: “Über Erdbebenwellen, VIIB: Über Reflexion und Durchgang seismicher Wellen durchUnstetigkeitsflächen,” Nachrichten der KöniglichenGesellschaft der Wissenschaften zu Göttingen,Mathematisch-physikalische Klasse (1919): 57–84.
8. Aki K and Richards PG: Quantitative Seismology: Theoryand Methods. San Francisco: W.H. Freeman andCompany, 1980.Connolly P: “Elastic Impedance,” The Leading Edge 18,no. 4 (April 1999): 438–452.Pan ND and Gardner GF: “The Basic Equations of PlaneElastic Wave Reflection and Scattering Applied to AVOAnalysis,” Report S-87-7, Seismic Acoustic Laboratory,University of Houston, 1987.Rüger A: “P-Wave Reflection Coefficients forTransversely Isotropic Models with Vertical andHorizontal Axis of Symmetry,” Geophysics 62, no. 3(May–June 1997): 713–722.Shuey RT: “A Simplification of the Zoeppritz Equations,”Geophysics 50, no. 4 (April 1985): 609–614. Smith GC and Gidlow PM: “Weighted Stacking for RockProperty Estimation and Detection of Gas,” GeophysicalProspecting 35, no. 9 (November 1987): 993–1014.
9. Roberts R, Bedingfield J, Phelps D, Lau A, Godfrey B,Volterrani S, Engelmark F and Hughes K: “HybridInversion Techniques Used to Derive Key ElasticParameters: A Case Study from the Nile Delta,” The Leading Edge 24, no. 1 (January 2005): 86–92.
> Amplitude variation with offset data and reflection coefficient versus angle of incidence. Severalreflections in the CMP gather (left) exhibit amplitude variation with offset. These data come from theNorth Sea example described on page 51. The nearly vertical black lines delimit angle rangescomputed by ray tracing. The reflection of interest is at 1.26 s (yellow). At zero offset (normalincidence), the reflection has slightly positive amplitude—a swing to the right—then turns negative,with a swing to the left. Several methods can be used to model the reflection coefficient versus angle(right). The properties of the two-layer model are shown (top). R0 stands for reflection coefficient atzero offset. The exact solution by the Zoeppritz equations is shown by the black curve. The othercurves are approximations taken from the work described in reference 8.
Refle
ctio
n co
effic
ient
Average angle, deg
ZoeppritzAki and RichardsPan-GardnerGidlow 3-Term
Shuey 2-TermGidlow 2-TermConnollyAnisotropic
0 20 40 60 80
0
Two-
way
tim
e, s
1.0
1.2
1.4
1.6
Average angle, deg5 20 35 50
2,800
3,000
1,700
2,000
2.3
2.2 0.01227
1.647059
1.5
0.208081
0.1
Vp Vs Vp / Vsρ Ro
Poisson’sRatio
Layer 1
Layer 2
> Correlating acoustic properties with water saturation (Sw). Logmeasurements of P-wave impedance, water saturation and Vp / Vs arecrossplotted to show relationships that can be applied to seismic inversionresults. Clean gas sands are plotted in red, laminated sands in green, andwater-filled sands in blue. (Adapted from Roberts et al, reference 9.)
V p/V
s
2.0
2.5
3.0
12,500 15,000 17,500 20,000 22,500
P-wave impedance, ft/s.g/cm3
Water-filledsands
Gas sands
0.1 0.9Sw
61459schD9R1.qxp:61459schD9R1 6/25/08 8:09 PM Page 49
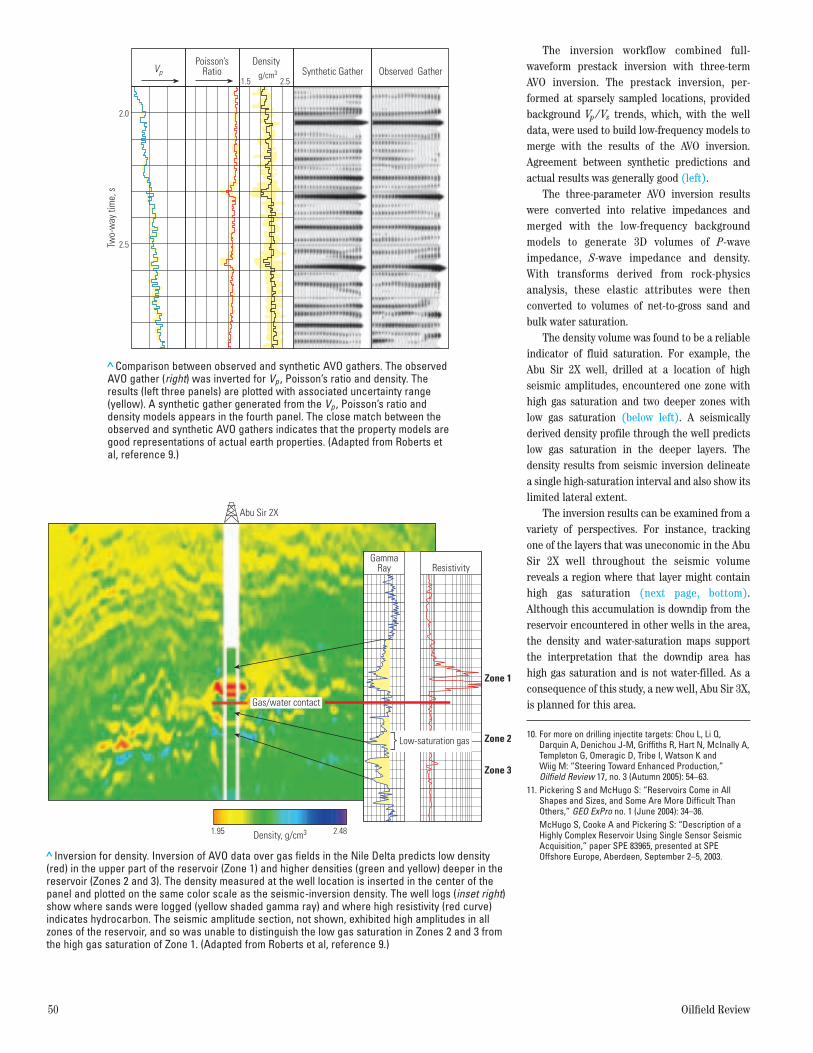
The inversion workflow combined full-waveform prestack inversion with three-termAVO inversion. The prestack inversion, per -formed at sparsely sampled locations, providedbackground Vp / Vs trends, which, with the welldata, were used to build low-frequency models tomerge with the results of the AVO inversion.Agreement between synthetic predictions andactual results was generally good (left).
The three-parameter AVO inversion resultswere converted into relative impedances andmerged with the low-frequency backgroundmodels to generate 3D volumes of P-waveimpedance, S-wave impedance and density.With transforms derived from rock-physicsanalysis, these elastic attributes were thenconverted to volumes of net-to-gross sand andbulk water saturation.
The density volume was found to be a reliableindicator of fluid saturation. For example, theAbu Sir 2X well, drilled at a location of highseismic amplitudes, encountered one zone withhigh gas saturation and two deeper zones withlow gas saturation (below left). A seismicallyderived density profile through the well predictslow gas saturation in the deeper layers. Thedensity results from seismic inversion delineatea single high-saturation interval and also show itslimited lateral extent.
The inversion results can be examined from avariety of perspectives. For instance, trackingone of the layers that was uneconomic in the AbuSir 2X well throughout the seismic volumereveals a region where that layer might containhigh gas saturation (next page, bottom).Although this accumulation is downdip from thereservoir encountered in other wells in the area,the density and water-saturation maps supportthe interpretation that the downdip area hashigh gas saturation and is not water-filled. As aconsequence of this study, a new well, Abu Sir 3X,is planned for this area.
50 Oilfield Review
10. For more on drilling injectite targets: Chou L, Li Q,Darquin A, Denichou J-M, Griffiths R, Hart N, McInally A,Templeton G, Omeragic D, Tribe I, Watson K andWiig M: “Steering Toward Enhanced Production,”Oilfield Review 17, no. 3 (Autumn 2005): 54–63.
11. Pickering S and McHugo S: “Reservoirs Come in AllShapes and Sizes, and Some Are More Difficult ThanOthers,” GEO ExPro no. 1 (June 2004): 34–36.McHugo S, Cooke A and Pickering S: “Description of aHighly Complex Reservoir Using Single Sensor SeismicAcquisition,” paper SPE 83965, presented at SPEOffshore Europe, Aberdeen, September 2–5, 2003.
> Comparison between observed and synthetic AVO gathers. The observedAVO gather (right) was inverted for Vp , Poisson’s ratio and density. Theresults (left three panels) are plotted with associated uncertainty range(yellow). A synthetic gather generated from the Vp , Poisson’s ratio anddensity models appears in the fourth panel. The close match between theobserved and synthetic AVO gathers indicates that the property models aregood representations of actual earth properties. (Adapted from Roberts etal, reference 9.)
Poisson’sRatio
Densityg/cm3
1.5 2.5Vp Synthetic Gather Observed Gather
2.0
2.5Two-
way
tim
e, s
> Inversion for density. Inversion of AVO data over gas fields in the Nile Delta predicts low density(red) in the upper part of the reservoir (Zone 1) and higher densities (green and yellow) deeper in thereservoir (Zones 2 and 3). The density measured at the well location is inserted in the center of thepanel and plotted on the same color scale as the seismic-inversion density. The well logs (inset right)show where sands were logged (yellow shaded gamma ray) and where high resistivity (red curve)indicates hydrocarbon. The seismic amplitude section, not shown, exhibited high amplitudes in allzones of the reservoir, and so was unable to distinguish the low gas saturation in Zones 2 and 3 fromthe high gas saturation of Zone 1. (Adapted from Roberts et al, reference 9.)
GammaRay Resistivity
Abu Sir 2X
Density, g/cm31.95 2.48
Low-saturation gas
Gas/water contact
Zone 1
Zone 2
Zone 3
61459schD9R1.qxp:61459schD9R1 5/20/08 4:54 AM Page 50
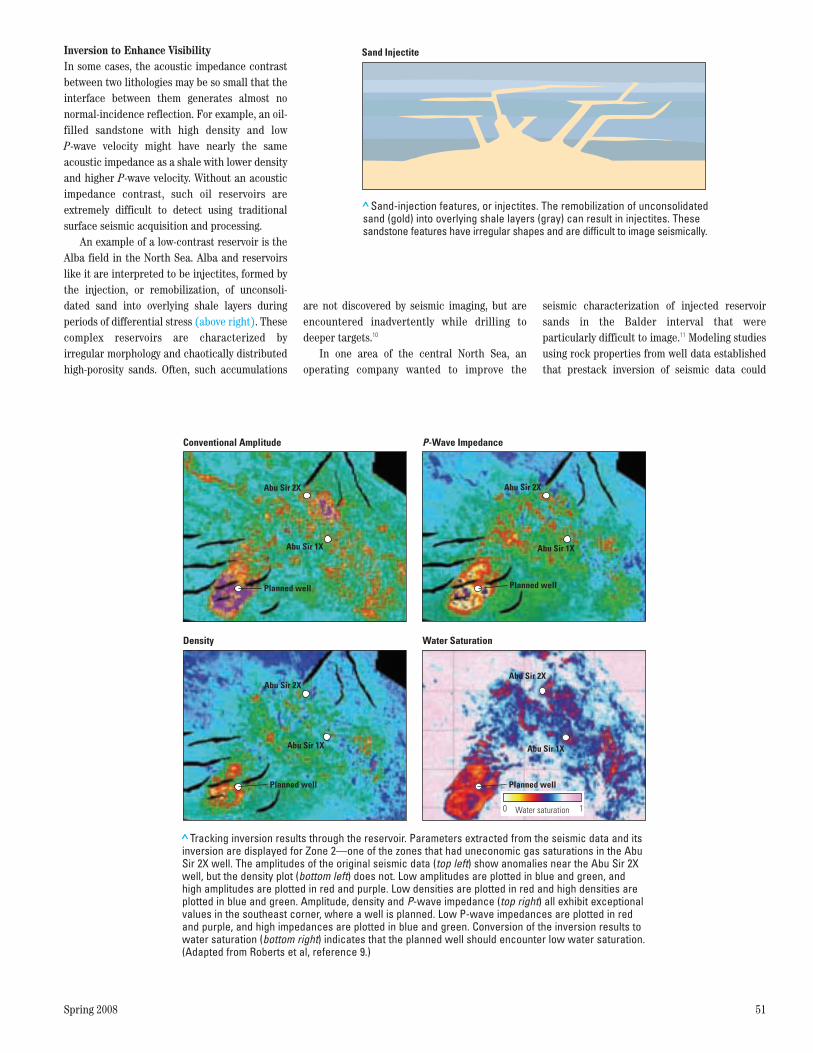
Spring 2008 51
Inversion to Enhance VisibilityIn some cases, the acoustic impedance contrastbetween two lithologies may be so small that theinterface between them generates almost nonormal-incidence reflection. For example, an oil-filled sandstone with high density and lowP-wave velocity might have nearly the sameacoustic impedance as a shale with lower densityand higher P-wave velocity. Without an acousticimpedance contrast, such oil reservoirs areextremely difficult to detect using traditionalsurface seismic acquisition and processing.
An example of a low-contrast reservoir is theAlba field in the North Sea. Alba and reservoirslike it are interpreted to be injectites, formed bythe injection, or remobilization, of unconsoli -dated sand into overlying shale layers duringperiods of differential stress (above right). Thesecomplex reservoirs are characterized byirregular morphology and chaotically distributedhigh-porosity sands. Often, such accumulations
are not discovered by seismic imaging, but areencountered inadvertently while drilling todeeper targets.10
In one area of the central North Sea, anoperating company wanted to improve the
seismic characterization of injected reservoirsands in the Balder interval that wereparticularly difficult to image.11 Modeling studiesusing rock properties from well data establishedthat prestack inversion of seismic data could
> Tracking inversion results through the reservoir. Parameters extracted from the seismic data and itsinversion are displayed for Zone 2—one of the zones that had uneconomic gas saturations in the AbuSir 2X well. The amplitudes of the original seismic data (top left) show anomalies near the Abu Sir 2Xwell, but the density plot (bottom left) does not. Low amplitudes are plotted in blue and green, andhigh amplitudes are plotted in red and purple. Low densities are plotted in red and high densities areplotted in blue and green. Amplitude, density and P-wave impedance (top right) all exhibit exceptionalvalues in the southeast corner, where a well is planned. Low P-wave impedances are plotted in redand purple, and high impedances are plotted in blue and green. Conversion of the inversion results towater saturation (bottom right) indicates that the planned well should encounter low water saturation.(Adapted from Roberts et al, reference 9.)
Conventional Amplitude
Abu Sir 2X
Abu Sir 1X
Planned well
P-Wave Impedance
Abu Sir 2X
Abu Sir 1X
Planned well
Density
Abu Sir 2X
Abu Sir 1X
Planned well
Water Saturation
Water saturation0 1
Planned well
Abu Sir 1X
Abu Sir 2X
> Sand-injection features, or injectites. The remobilization of unconsolidatedsand (gold) into overlying shale layers (gray) can result in injectites. Thesesandstone features have irregular shapes and are difficult to image seismically.
Sand Injectite
61459schD9R1.qxp:61459schD9R1 5/20/08 4:54 AM Page 51

potentially distinguish the clean sands from thesurrounding shales, but the existing surfaceseismic data were of insufficient resolution forthis purpose.
A new survey was designed to map the distri -bution and thickness of reservoir pay, delineate thegeometry of individual sand wings and assessreservoir connectivity. Acquisition with the Q-Marine system would allow accurate cablepositioning, fine spatial sampling and calibrationof sources and receivers. Together, these capabili -ties facilitate precision imaging, improved noiseattenuation, increased band width and preser -vation of amplitude and phase information—allimportant for successful inversion.
Log data from three wells intersecting thereservoir were analyzed for correlationsbetween P- and S-wave velocities, ρ, μ, λ,lithology and fluid saturation. For example,crossplotting Vp / Vs with the product μρ, andcolor-coding by lithology, showed that high sandcontent correlated with low Vp / Vs and high μρvalues (left). These relationships were thenapplied to Vp / Vs calculated from seismicinversion to map high sand content throughoutthe seismic volume.
The prestack seismic data were divided into seven angle stacks, each containingreflections in a 7° range of incidence angles outto 49° (next page, bottom). Three-parameter AVOinver sion generated estimates of P- and S-wavereflectivities and density contrast. These volumeswere inverted for P- and S-wave impedances anddensity, from which volumes of μρ, Vp / Vs and λ /μwere generated.
Crossplots of seismically derived Vp / Vs andμρ through the interval containing the injectedsands were color-coded by sand probability(left). Applying the color-coding to the rock-constant volumes obtained from seismicinversion yielded interpretable 3D cubes of sandprobability. A close-up of a section through thesand-probability volume highlights a steeplydipping sand-injection feature (next page, top).
The sand-probability volume can beilluminated by rendering the surroundingshales—lithologies with low probability of
52 Oilfield Review
> Correlating acoustic properties with lithology. A crossplot of Vp / Vs withthe product of shear modulus (�) and density (ρ) shows a trend related tosand volume: high sand content correlates with low Vp / Vs and high �ρvalues. Applying this relation to Vp / Vs and �ρ values obtained frominversion yields lithology maps of the subsurface.
V p/V
s
2.5
2.0
3.0
2 4 6 8 10 12 14
Log Data
0.05 0.95Volume of sand
Shear modulus . density ( ), GPa . g/cm3μρ
> Sand probability. The correlation between inversion outputs Vp / Vs and�ρ with sand probability shows a direct relationship: increasing �ρ anddecreasing Vp / Vs point to higher probability of sand. This relationship wasapplied to the seismic inversion results to obtain maps of sand probability.
V p/V
s
2.5
2.0
3.0
2 4 6 8 10 12 14
Seismic Values
Shear modulus . density ( ), GPa . g/cm3μρ
0 100Sand probability, %
61459schD9R1.qxp:61459schD9R1 5/20/08 4:54 AM Page 52
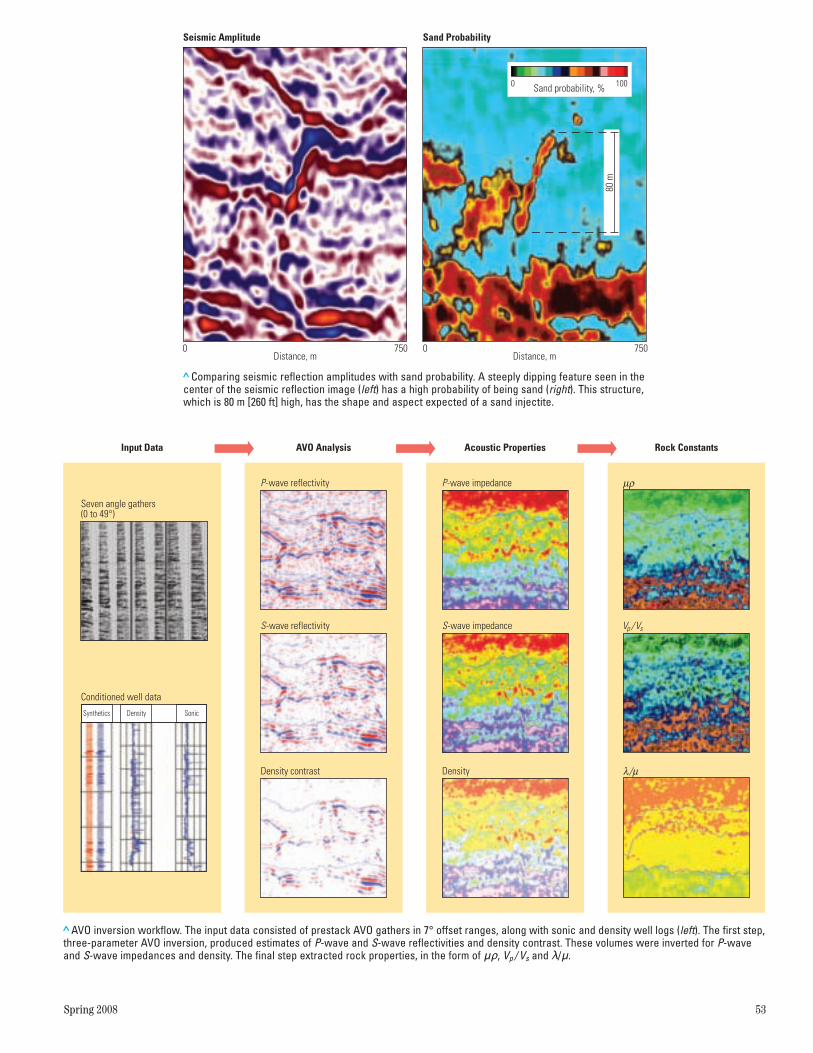
Spring 2008 53
> AVO inversion workflow. The input data consisted of prestack AVO gathers in 7° offset ranges, along with sonic and density well logs (left). The first step,three-parameter AVO inversion, produced estimates of P-wave and S-wave reflectivities and density contrast. These volumes were inverted for P-waveand S-wave impedances and density. The final step extracted rock properties, in the form of �ρ, Vp / Vs and λ/�.
Input Data AVO Analysis Acoustic Properties Rock Constants
P-wave impedance
S-wave impedance
Density
P-wave reflectivity
S-wave reflectivity
Density contrast
Synthetics Density Sonic
Seven angle gathers(0 to 49°)
Conditioned well data
μρ
Vp /Vs
λ/μ
> Comparing seismic reflection amplitudes with sand probability. A steeply dipping feature seen in thecenter of the seismic reflection image (left) has a high probability of being sand (right). This structure,which is 80 m [260 ft] high, has the shape and aspect expected of a sand injectite.
Distance, m Distance, m0 750 0 750
Seismic Amplitude Sand Probability
80 m
0 100Sand probability, %
61459schD9R1.qxp:61459schD9R1 5/20/08 4:54 AM Page 53
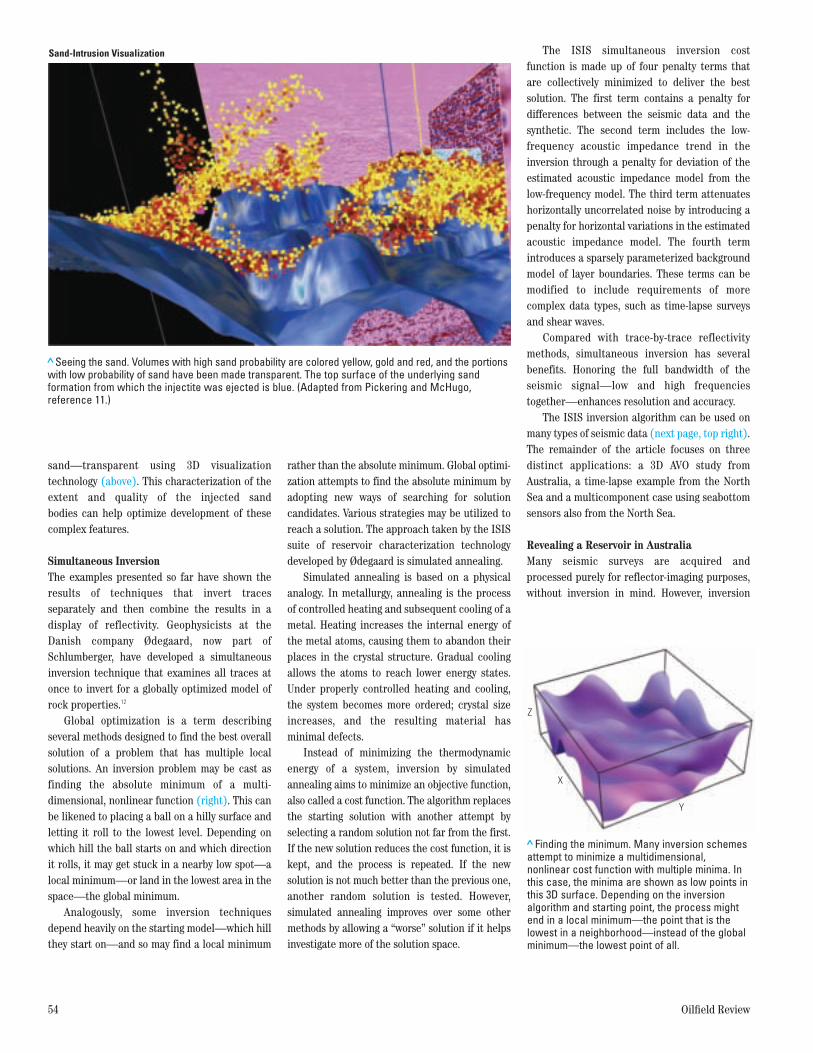
sand—transparent using 3D visualizationtechnology (above). This characterization of theextent and quality of the injected sand bodies can help optimize development of thesecomplex features.
Simultaneous InversionThe examples presented so far have shown theresults of techniques that invert tracesseparately and then combine the results in adisplay of reflectivity. Geophysicists at theDanish company Ødegaard, now part ofSchlumberger, have developed a simultaneousinversion technique that examines all traces atonce to invert for a globally optimized model ofrock properties.12
Global optimization is a term describingseveral methods designed to find the best overallsolution of a problem that has multiple localsolutions. An inversion problem may be cast asfinding the absolute minimum of a multi -dimensional, nonlinear function (right). This canbe likened to placing a ball on a hilly surface andletting it roll to the lowest level. Depending onwhich hill the ball starts on and which directionit rolls, it may get stuck in a nearby low spot—alocal minimum—or land in the lowest area in thespace—the global minimum.
Analogously, some inversion techniquesdepend heavily on the starting model—which hillthey start on—and so may find a local minimum
rather than the absolute minimum. Global optimi -zation attempts to find the absolute minimum byadopting new ways of searching for solutioncandidates. Various strategies may be utilized toreach a solution. The approach taken by the ISISsuite of reservoir characterization technologydeveloped by Ødegaard is simulated annealing.
Simulated annealing is based on a physicalanalogy. In metallurgy, annealing is the processof controlled heating and subsequent cooling of ametal. Heating increases the internal energy ofthe metal atoms, causing them to abandon theirplaces in the crystal structure. Gradual coolingallows the atoms to reach lower energy states.Under properly controlled heating and cooling,the system becomes more ordered; crystal sizeincreases, and the resulting material hasminimal defects.
Instead of minimizing the thermodynamicenergy of a system, inversion by simulatedannealing aims to minimize an objective function,also called a cost function. The algorithm replacesthe starting solution with another attempt byselecting a random solution not far from the first.If the new solution reduces the cost function, it iskept, and the process is repeated. If the newsolution is not much better than the previous one,another random solution is tested. However,simulated annealing improves over some othermethods by allowing a “worse” solution if it helpsinvestigate more of the solution space.
The ISIS simultaneous inversion costfunction is made up of four penalty terms thatare collectively minimized to deliver the bestsolution. The first term contains a penalty fordifferences between the seismic data and thesynthetic. The second term includes the low-frequency acoustic impedance trend in theinversion through a penalty for deviation of theestimated acoustic impedance model from thelow-frequency model. The third term attenuateshorizontally uncorrelated noise by introducing apenalty for horizontal variations in the estimatedacoustic impedance model. The fourth termintroduces a sparsely parameterized backgroundmodel of layer boundaries. These terms can bemodified to include requirements of morecomplex data types, such as time-lapse surveysand shear waves.
Compared with trace-by-trace reflectivitymethods, simultaneous inversion has severalbenefits. Honoring the full bandwidth of theseismic signal—low and high frequenciestogether—enhances resolution and accuracy.
The ISIS inversion algorithm can be used onmany types of seismic data (next page, top right).The remainder of the article focuses on threedistinct applications: a 3D AVO study fromAustralia, a time-lapse example from the NorthSea and a multicomponent case using seabottomsensors also from the North Sea.
Revealing a Reservoir in AustraliaMany seismic surveys are acquired andprocessed purely for reflector-imaging purposes,without inversion in mind. However, inversion
54 Oilfield Review
> Seeing the sand. Volumes with high sand probability are colored yellow, gold and red, and the portionswith low probability of sand have been made transparent. The top surface of the underlying sandformation from which the injectite was ejected is blue. (Adapted from Pickering and McHugo,reference 11.)
Sand-Intrusion Visualization
> Finding the minimum. Many inversion schemesattempt to minimize a multidimensional,nonlinear cost function with multiple minima. Inthis case, the minima are shown as low points inthis 3D surface. Depending on the inversionalgorithm and starting point, the process mightend in a local minimum—the point that is thelowest in a neighborhood—instead of the globalminimum—the lowest point of all.
Z
Y
X
61459schD9R1.qxp:61459schD9R1 5/20/08 4:54 AM Page 54
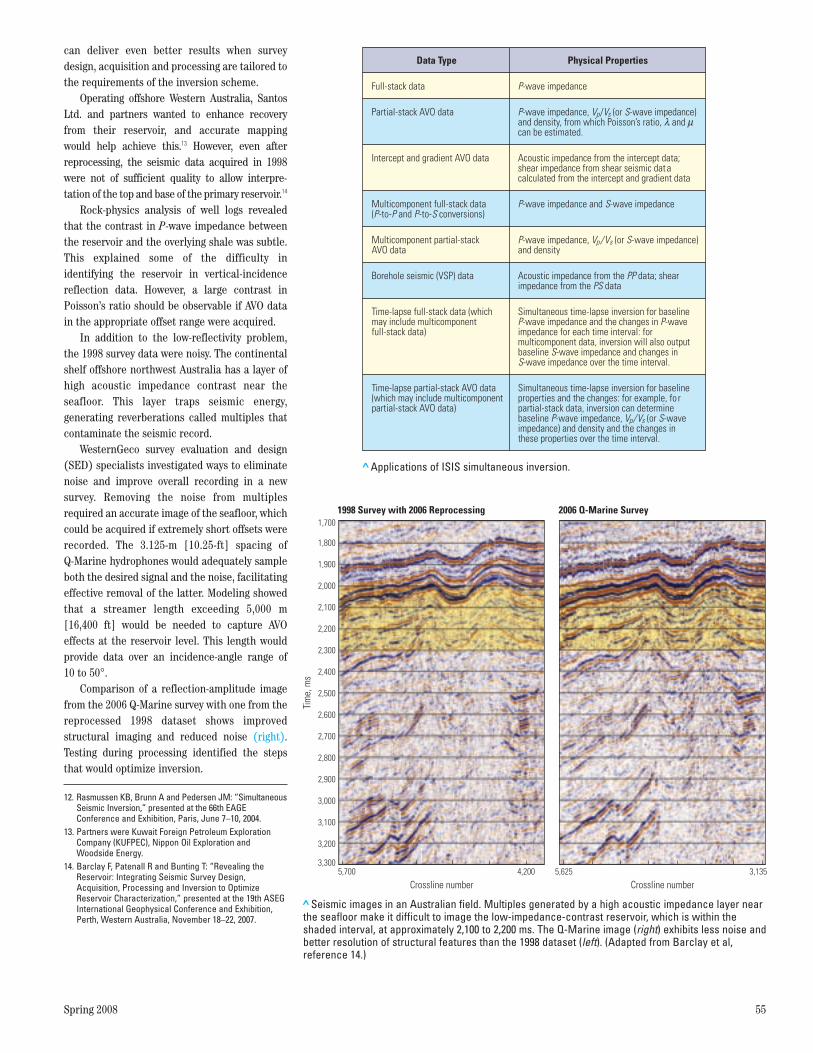
Spring 2008 55
can deliver even better results when surveydesign, acquisition and processing are tailored tothe requirements of the inversion scheme.
Operating offshore Western Australia, SantosLtd. and partners wanted to enhance recoveryfrom their reservoir, and accurate mapping would help achieve this.13 However, even afterreprocessing, the seismic data acquired in 1998were not of sufficient quality to allow inter pre -tation of the top and base of the primary reservoir.14
Rock-physics analysis of well logs revealedthat the contrast in P-wave impedance betweenthe reservoir and the overlying shale was subtle.This explained some of the difficulty inidentifying the reservoir in vertical-incidencereflection data. However, a large contrast inPoisson’s ratio should be observable if AVO datain the appropriate offset range were acquired.
In addition to the low-reflectivity problem,the 1998 survey data were noisy. The continentalshelf offshore northwest Australia has a layer ofhigh acoustic impedance contrast near theseafloor. This layer traps seismic energy,generating reverberations called multiples thatcontaminate the seismic record.
WesternGeco survey evaluation and design(SED) specialists investigated ways to eliminatenoise and improve overall recording in a newsurvey. Removing the noise from multiplesrequired an accurate image of the seafloor, whichcould be acquired if extremely short offsets wererecorded. The 3.125-m [10.25-ft] spacing of Q-Marine hydrophones would adequately sampleboth the desired signal and the noise, facilitatingeffective removal of the latter. Modeling showedthat a streamer length exceeding 5,000 m[16,400 ft] would be needed to capture AVOeffects at the reservoir level. This length wouldprovide data over an incidence-angle range of10 to 50°.
Comparison of a reflection-amplitude imagefrom the 2006 Q-Marine survey with one from thereprocessed 1998 dataset shows improvedstructural imaging and reduced noise (right).Testing during processing identified the stepsthat would optimize inversion.
12. Rasmussen KB, Brunn A and Pedersen JM: “SimultaneousSeismic Inversion,” presented at the 66th EAGEConference and Exhibition, Paris, June 7–10, 2004.
13. Partners were Kuwait Foreign Petroleum ExplorationCompany (KUFPEC), Nippon Oil Exploration andWoodside Energy.
14. Barclay F, Patenall R and Bunting T: “Revealing theReservoir: Integrating Seismic Survey Design,Acquisition, Processing and Inversion to OptimizeReservoir Characterization,” presented at the 19th ASEGInternational Geophysical Conference and Exhibition,Perth, Western Australia, November 18–22, 2007.
> Applications of ISIS simultaneous inversion.
Partial-stack AVO data
Intercept and gradient AVO data
Multicomponent partial-stackAVO data
Borehole seismic (VSP) data
Time-lapse full-stack data (whichmay include multicomponentfull-stack data)
Time-lapse partial-stack AVO data(which may include multicomponentpartial-stack AVO data)
Full-stack data
Multicomponent full-stack data(P-to-P and P-to-S conversions)
Data Type
P-wave impedance
P-wave impedance and S-wave impedance
Physical Properties
Acoustic impedance from the intercept data;shear impedance from shear seismic datacalculated from the intercept and gradient data
P-wave impedance, Vp/Vs (or S-wave impedance)and density
Acoustic impedance from the PP data; shearimpedance from the PS data
Simultaneous time-lapse inversion for baselineproperties and the changes: for example, fo rpartial-stack data, inversion can determinebaseline P-wave impedance, Vp/Vs (or S-waveimpedance) and density and the changes inthese properties over the time interval.
Simultaneous time-lapse inversion for baselineP-wave impedance and the changes in P-waveimpedance for each time interval: formulticomponent data, inversion will also outputbaseline S-wave impedance and changes inS-wave impedance over the time interval.
P-wave impedance, Vp/Vs (or S-wave impedance)and density, from which Poisson’s ratio, andcan be estimated.
λ μ
> Seismic images in an Australian field. Multiples generated by a high acoustic impedance layer nearthe seafloor make it difficult to image the low-impedance-contrast reservoir, which is within theshaded interval, at approximately 2,100 to 2,200 ms. The Q-Marine image (right) exhibits less noise andbetter resolution of structural features than the 1998 dataset (left). (Adapted from Barclay et al,reference 14.)
1998 Survey with 2006 Reprocessing 2006 Q-Marine Survey1,700
1,800
1,900
2,000
2,100
2,200
2,300
2,400
2,500
2,600
2,700
2,800
2,900
3,000
3,100
3,200
3,300
Tim
e, m
s
5,6254,2005,700 3,135
Crossline number Crossline number
61459schD9R1.qxp:61459schD9R1 5/20/08 4:54 AM Page 55

The inversion for P-wave impedance gavehigh-quality results that correlated strongly withvalues measured in four of the field’s wells (left).The subtle rise in acoustic impe d ance at the topof the reservoir, although significantly smallerthan those in the overlying layers, is accuratelydetected by the simul taneous inversion.
The P-wave impedance contrast at the top ofthe reservoir is small, but the contrast in Poisson’sratio is significant, and so is a potentially moreuseful indicator of reservoir quality. Poisson’s ratiois more accurately estimated by including largeincidence angles in the inversion. A comparison ofPoisson’s ratio obtained by incorporating differentranges of incidence angles showed greaterresolution and less noise when wider angles wereincluded (below).
Time-Lapse InversionSimultaneous inversion can incorporate datafrom various vintages to highlight time-lapsechanges in rock and fluid properties. Thisapproach has recently been tested on the Nornefield, where operator StatoilHydro is trying toincrease oil recovery from 40% to more than 50%.
The Norne field has had multiple time-lapse,or 4D, seismic surveys.15 The high-qualitysandstone reservoirs, with porosities of 25 to 32%
56 Oilfield Review
> Simultaneous inversion for P-wave impedance. Impedance sections from inversion show excellentcorrelation with values in four wells. In each panel, the impedances measured in the well are color-coded at the same scale as the inversion results and inserted in the middle of the panel. The top ofthe reservoir is marked with a nearly horizontal black line. The white curves are unscaled watersaturation logs, with water saturation decreasing to the left. To the right of each panel is a display ofthe log acoustic impedance (red) and the seismically estimated acoustic impedance at the welllocation (blue). (Adapted from Barclay et al, reference 14.)
Two-
way
tim
e, s
1.7
1.8
1.9
2.0
2.1
2.2
2.3
2.4
2.5
2.6
2.7
Acoustic impedance, km/s . g/cm35.7 8.2
> Inversion for Poisson’s ratio. In this field, Poisson’s ratio provides a better measure than acoustic impedance for assessing reservoir quality. LowPoisson’s ratio (green) is generally indicative of higher quality sand. Reflection amplitudes are more affected by Poisson’s ratio at larger angles ofincidence. When a larger range of angles (5 to 42°) is included in the inversion (right), the estimation of Poisson’s ratio shows less noise, and the regions ofsimilar Poisson’s ratio appear more continuous than when inversion uses a smaller range (5 to 35°) of angles (left). White circles are well locations.(Adapted from Barclay et al, reference 14.)
450 460 470 450 460 470
Poisson’s ratio0.34 0.43CrosslineCrossline
Inline
Inline
61459schD9R1.qxp:61459schD9R1 5/21/08 1:31 PM Page 56
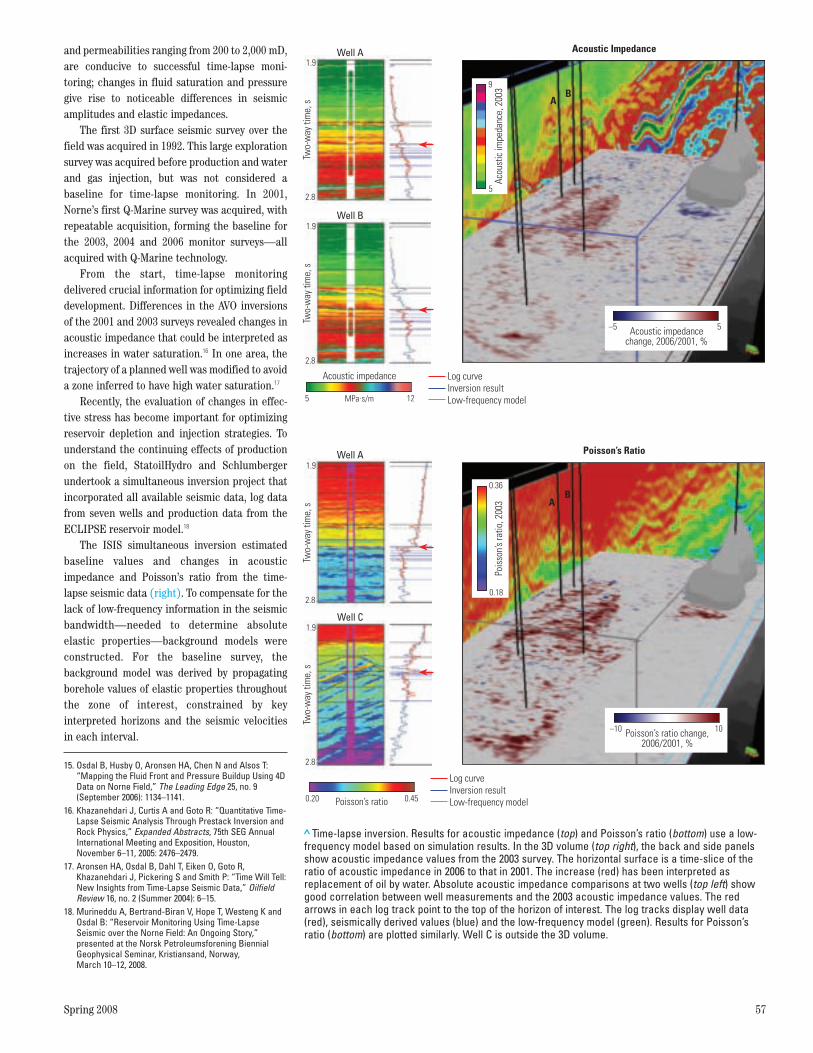
Spring 2008 57
and permeabilities ranging from 200 to 2,000 mD,are conducive to successful time-lapse moni -toring; changes in fluid saturation and pressuregive rise to noticeable differences in seismicamplitudes and elastic impedances.
The first 3D surface seismic survey over thefield was acquired in 1992. This large explorationsurvey was acquired before production and waterand gas injection, but was not considered abaseline for time-lapse monitoring. In 2001,Norne’s first Q-Marine survey was acquired, withrepeatable acquisition, forming the baseline forthe 2003, 2004 and 2006 monitor surveys—allacquired with Q-Marine technology.
From the start, time-lapse monitoringdelivered crucial information for optimizing fielddevelopment. Differences in the AVO inversionsof the 2001 and 2003 surveys revealed changes inacoustic impedance that could be interpreted asincreases in water saturation.16 In one area, thetrajectory of a planned well was modified to avoida zone inferred to have high water saturation.17
Recently, the evaluation of changes in effec -tive stress has become important for optimiz ingreservoir depletion and injection strategies. Tounderstand the continuing effects of productionon the field, StatoilHydro and Schlumbergerundertook a simultaneous inversion project thatincorporated all available seismic data, log datafrom seven wells and production data from theECLIPSE reservoir model.18
The ISIS simultaneous inversion estimatedbaseline values and changes in acousticimpedance and Poisson’s ratio from the time-lapse seismic data (right). To compensate for thelack of low-frequency information in the seismicbandwidth—needed to determine absoluteelastic properties—background models wereconstructed. For the baseline survey, thebackground model was derived by propagatingborehole values of elastic properties throughoutthe zone of interest, constrained by keyinterpreted horizons and the seismic velocitiesin each interval.
15. Osdal B, Husby O, Aronsen HA, Chen N and Alsos T:“Mapping the Fluid Front and Pressure Buildup Using 4DData on Norne Field,” The Leading Edge 25, no. 9(September 2006): 1134–1141.
16. Khazanehdari J, Curtis A and Goto R: “Quantitative Time-Lapse Seismic Analysis Through Prestack Inversion andRock Physics,” Expanded Abstracts, 75th SEG AnnualInternational Meeting and Exposition, Houston,November 6–11, 2005: 2476–2479.
17. Aronsen HA, Osdal B, Dahl T, Eiken O, Goto R,Khazanehdari J, Pickering S and Smith P: “Time Will Tell:New Insights from Time-Lapse Seismic Data,” OilfieldReview 16, no. 2 (Summer 2004): 6–15.
18. Murineddu A, Bertrand-Biran V, Hope T, Westeng K andOsdal B: “Reservoir Monitoring Using Time-LapseSeismic over the Norne Field: An Ongoing Story,”presented at the Norsk Petroleumsforening BiennialGeophysical Seminar, Kristiansand, Norway, March 10–12, 2008.
> Time-lapse inversion. Results for acoustic impedance (top) and Poisson’s ratio (bottom) use a low-frequency model based on simulation results. In the 3D volume (top right), the back and side panelsshow acoustic impedance values from the 2003 survey. The horizontal surface is a time-slice of theratio of acoustic impedance in 2006 to that in 2001. The increase (red) has been interpreted asreplacement of oil by water. Absolute acoustic impedance comparisons at two wells (top left) showgood correlation between well measurements and the 2003 acoustic impedance values. The redarrows in each log track point to the top of the horizon of interest. The log tracks display well data(red), seismically derived values (blue) and the low-frequency model (green). Results for Poisson’sratio (bottom) are plotted similarly. Well C is outside the 3D volume.
Poisson’s ratio 0.450.20
Log curveInversion resultLow-frequency model
Two-
way
tim
e, s
1.9
2.8
Two-
way
tim
e, s
1.9
2.8
Well A
Well C
Poisson’s ratio change,2006/2001, %
10–10
Poisson’s Ratio
Pois
son’s
ratio
, 200
30.36
0.18
AB
Acoustic impedance
125
Log curveInversion resultLow-frequency model
Two-
way
tim
e, s
1.9
2.8
Two-
way
tim
e, s
1.9
2.8
Well A
Well B
Acoustic impedancechange, 2006/2001, %
5–5
9
5
Acou
stic
impe
danc
e, 2
003
Acoustic Impedance
AB
MPa . s/m
61459schD9R1.qxp:61459schD9R1 5/20/08 4:54 AM Page 57
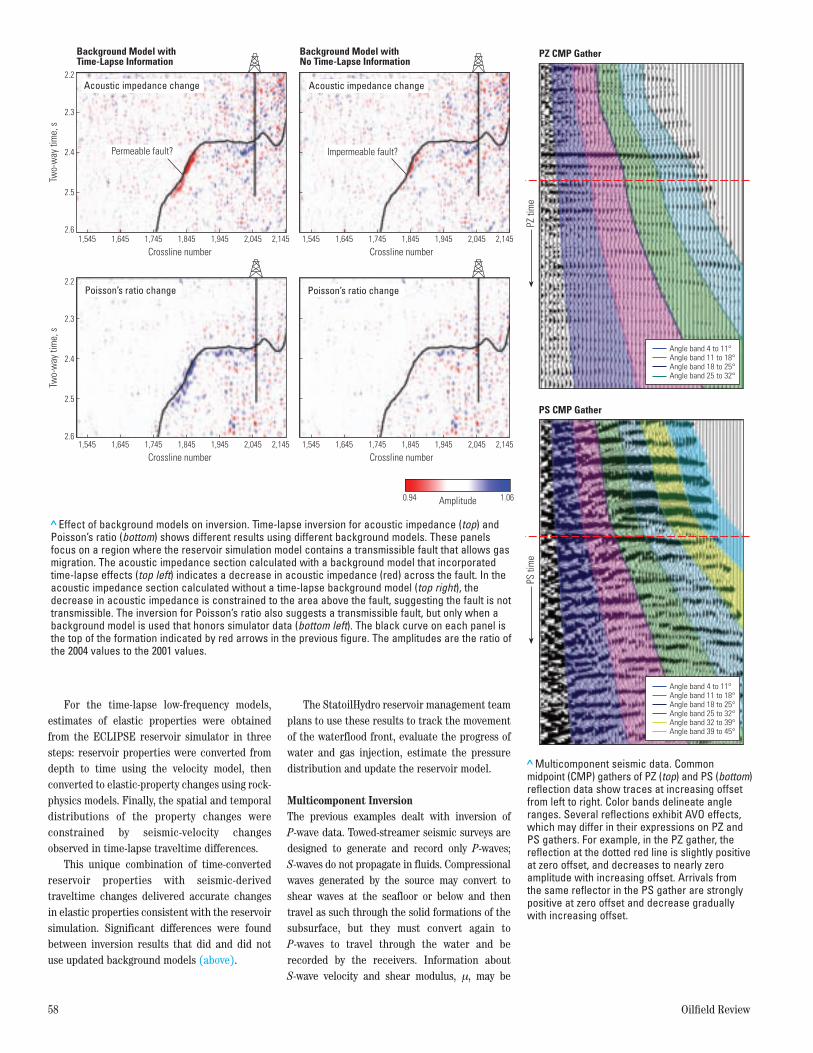
For the time-lapse low-frequency models,estimates of elastic properties were obtainedfrom the ECLIPSE reservoir simulator in threesteps: reservoir properties were converted fromdepth to time using the velocity model, thenconverted to elastic-property changes using rock-physics models. Finally, the spatial and temporaldistributions of the property changes wereconstrained by seismic-velocity changesobserved in time-lapse traveltime differences.
This unique combination of time-convertedreservoir properties with seismic-derivedtraveltime changes delivered accurate changesin elastic properties consistent with the reservoirsimulation. Significant differences were foundbetween inversion results that did and did notuse updated background models (above).
The StatoilHydro reservoir management teamplans to use these results to track the movementof the waterflood front, evaluate the progress ofwater and gas injection, estimate the pressuredistribution and update the reservoir model.
Multicomponent InversionThe previous examples dealt with inversion of P-wave data. Towed-streamer seismic surveys aredesigned to generate and record only P-waves; S-waves do not propagate in fluids. Compressionalwaves generated by the source may convert toshear waves at the seafloor or below and thentravel as such through the solid formations of thesubsurface, but they must convert again to P-waves to travel through the water and berecorded by the receivers. Information about S-wave velocity and shear modulus, μ, may be
58 Oilfield Review
> Effect of background models on inversion. Time-lapse inversion for acoustic impedance (top) andPoisson’s ratio (bottom) shows different results using different background models. These panelsfocus on a region where the reservoir simulation model contains a transmissible fault that allows gasmigration. The acoustic impedance section calculated with a background model that incorporatedtime-lapse effects (top left) indicates a decrease in acoustic impedance (red) across the fault. In theacoustic impedance section calculated without a time-lapse background model (top right), thedecrease in acoustic impedance is constrained to the area above the fault, suggesting the fault is nottransmissible. The inversion for Poisson’s ratio also suggests a transmissible fault, but only when abackground model is used that honors simulator data (bottom left). The black curve on each panel isthe top of the formation indicated by red arrows in the previous figure. The amplitudes are the ratio ofthe 2004 values to the 2001 values.
Two-
way
tim
e, s
2.2
2.3
2.4
2.5
2.61,545
Crossline number1,645 1,745 1,845 1,945 2,1452,045
Background Model withTime-Lapse Information
Acoustic impedance change
Permeable fault?
1,545
Crossline number1,645 1,745 1,845 1,945 2,1452,045
Background Model withNo Time-Lapse Information
Acoustic impedance change
Impermeable fault?
Two-
way
tim
e, s
1,545
Crossline number1,645 1,745 1,845 1,945 2,1452,045
2.2
2.3
2.4
2.5
2.6
Poisson’s ratio change
Amplitude 1.060.94
1,545
Crossline number1,645 1,745 1,845 1,945 2,1452,045
Poisson’s ratio change
>Multicomponent seismic data. Commonmidpoint (CMP) gathers of PZ (top) and PS (bottom)reflection data show traces at increasing offsetfrom left to right. Color bands delineate angleranges. Several reflections exhibit AVO effects,which may differ in their expressions on PZ andPS gathers. For example, in the PZ gather, thereflection at the dotted red line is slightly positiveat zero offset, and decreases to nearly zeroamplitude with increasing offset. Arrivals fromthe same reflector in the PS gather are stronglypositive at zero offset and decrease graduallywith increasing offset.
PZ CMP Gather
PZ ti
me
PS CMP Gather
PS ti
me
61459schD9R1.qxp:61459schD9R1 5/21/08 1:31 PM Page 58
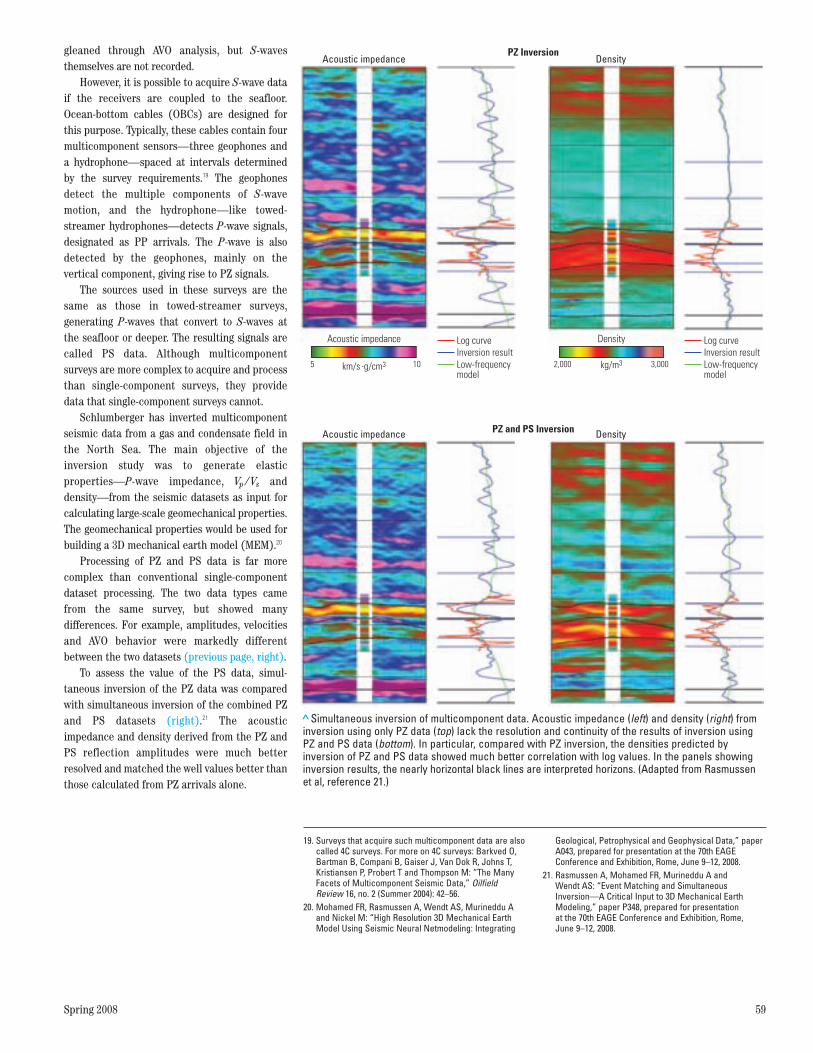
Spring 2008 59
gleaned through AVO analysis, but S-wavesthemselves are not recorded.
However, it is possible to acquire S-wave dataif the receivers are coupled to the seafloor.Ocean-bottom cables (OBCs) are designed forthis purpose. Typically, these cables contain fourmulticomponent sensors—three geophones anda hydrophone—spaced at intervals determinedby the survey requirements.19 The geophonesdetect the multiple components of S-wavemotion, and the hydrophone—like towed-streamer hydrophones—detects P-wave signals,designated as PP arrivals. The P-wave is alsodetected by the geophones, mainly on thevertical component, giving rise to PZ signals.
The sources used in these surveys are thesame as those in towed-streamer surveys,generating P-waves that convert to S-waves atthe seafloor or deeper. The resulting signals arecalled PS data. Although multicomponentsurveys are more complex to acquire and processthan single-component surveys, they providedata that single-component surveys cannot.
Schlumberger has inverted multicomponentseismic data from a gas and condensate field inthe North Sea. The main objective of theinversion study was to generate elasticproperties—P-wave impedance, Vp / Vs anddensity—from the seismic datasets as input forcalculating large-scale geomechanical properties.The geomechanical properties would be used forbuilding a 3D mechanical earth model (MEM).20
Processing of PZ and PS data is far morecomplex than conventional single-componentdataset processing. The two data types camefrom the same survey, but showed manydifferences. For example, amplitudes, velocitiesand AVO behavior were markedly differentbetween the two datasets (previous page, right).
To assess the value of the PS data, simul -taneous inversion of the PZ data was comparedwith simultaneous inversion of the combined PZand PS datasets (right).21 The acousticimpedance and density derived from the PZ andPS reflection amplitudes were much betterresolved and matched the well values better thanthose calculated from PZ arrivals alone.
19. Surveys that acquire such multicomponent data are alsocalled 4C surveys. For more on 4C surveys: Barkved O,Bartman B, Compani B, Gaiser J, Van Dok R, Johns T,Kristiansen P, Probert T and Thompson M: “The ManyFacets of Multicomponent Seismic Data,” OilfieldReview 16, no. 2 (Summer 2004): 42–56.
20. Mohamed FR, Rasmussen A, Wendt AS, Murineddu Aand Nickel M: “High Resolution 3D Mechanical EarthModel Using Seismic Neural Netmodeling: Integrating
Geological, Petrophysical and Geophysical Data,” paperA043, prepared for presentation at the 70th EAGEConference and Exhibition, Rome, June 9–12, 2008.
21. Rasmussen A, Mohamed FR, Murineddu A andWendt AS: “Event Matching and SimultaneousInversion—A Critical Input to 3D Mechanical EarthModeling,” paper P348, prepared for presentation at the 70th EAGE Conference and Exhibition, Rome, June 9–12, 2008.
> Simultaneous inversion of multicomponent data. Acoustic impedance (left) and density (right) frominversion using only PZ data (top) lack the resolution and continuity of the results of inversion usingPZ and PS data (bottom). In particular, compared with PZ inversion, the densities predicted byinversion of PZ and PS data showed much better correlation with log values. In the panels showinginversion results, the nearly horizontal black lines are interpreted horizons. (Adapted from Rasmussenet al, reference 21.)
PZ and PS InversionAcoustic impedance Density
PZ Inversion
Log curveInversion resultLow-frequencymodel
Log curveInversion resultLow-frequencymodel
Acoustic impedance Density
Acoustic impedance
km/s . g/cm3 105
Density
kg/m3 3,0002,000
61459schD9R1.qxp:61459schD9R1 5/20/08 4:54 AM Page 59

The acoustic impedances from seismic inver -sion improved the accuracy of the mechanicalearth model. In a blind-well test, acoustic impe d -ances predicted by inversion were comparedwith those measured in a well that had not beenused for inversion calibration (left). In the 10layers of the MEM, the well log acousticimpedances showed an extremely close matchwith impedances from the seismic inversion.Correlations with models built using conven -tional methods of generating geomechanicalproperties—methods that do not incorporateseismically calculated properties—did notmatch as well and exhibited large errors inseveral layers.
Looking Forward with InversionSeismic inversion is a powerful tool for extractingreservoir rock and fluid information from seismicdata. Although most seismic surveys are designedfor imaging alone, companies are increasinglyapplying inversion to get more out of theirinvestments in seismic data. Some companiesnow perform inversion on every seismic datasetand won’t drill without it.
Inversion for reservoir characterization is amultistep process that requires, in addition tothe inversion algorithm itself, careful datapreparation, seismic data processing, log editingand calibration, rock-property correlation andvisualization. Workflows are being developed tocombine these steps for optimal results.
The addition of new measurements from otherdisciplines, such as from deep electro magneticsensing, promises to bring enhance ments toseismic inversion results. Work on magneto -tellurics and controlled-source electromagneticsfor the marine environment is generatingconsiderable interest among geophysicists, andthese techniques may hold the key to detectingproperties that elude seismic surveys.
Another area of potential improvement lies inenhancing the data content in seismicrecordings. Low frequencies not contained inmost seismic data have to be obtained ormodeled from log data for inversion to absoluterock properties. However, in areas far from wells,this step may introduce unwanted bias into theresults. For example, when lithologies thin,thicken, disappear or appear between wells, datafrom wells might not form an accurate basis forseismic models.
A new seismic data-acquisition technique isbeing evaluated as a means of supplyingnecessary low-frequency information in theabsence of log data. Known as over/under
60 Oilfield Review
22. Camara Alfaro J, Corcoran C, Davies K, GonzalezPineda F, Hampson G, Hill D, Howard M, Kapoor J,Moldoveanu N and Kragh E: “Reducing ExplorationRisk,” Oilfield Review 19, no. 1 (Spring 2007): 26–43.Moldoveanu N, Combee L, Egan M, Hampson G,Sydora L and Abriel W: “Over/Under Towed-StreamerAcquisition: A Method to Extend Seismic Bandwidth toBoth Higher and Lower Frequencies,” The LeadingEdge 26, no. 1 (January 2007): 41–58.
23. Özdemir H: “Unbiased Seismic Inversion: Less Model,More Seismic,” presented at the Petroleum ExplorationSociety of Great Britain, Geophysical Seminar, London,January 30–31, 2008.
24. Özdemir H, Leathard M and Sansom J: “Lost FrequenciesFound—Almost: Inversion of Over/Under Data,” paperD028, presented at the 69th EAGE Conference andExhibition, London, June 11–14, 2007.
> Acoustic properties in a 3D mechanical earth model (MEM). Seismically derived acousticimpedances helped populate a 3D MEM with mechanical properties. The inset (right) shows one of 10layers in the model. Acoustic impedance (AI) values extracted along a wellbore (Well X) that had notbeen used in building the model (Track 1) are compared with values predicted by three methods:seismic inversion (Track 2), sequential Gaussian simulation (SGS) (Track 3) and kriging (Track 4). SGSand kriging do not use seismic data as input. Error bars (red) in each track display percentage error.The match with seismically derived acoustic impedance is significantly better than with results fromthe other two methods. (Adapted from Mohamed et al, reference 20.)
Dept
hOriginal New Workflow SGS Kriging
Error
0 100%
0 100%
Error
0 100%
Error
Well log andseismically derivedproperties
3 12 3 12 3 12 3 12
AI AI AI AI
Acoustic impedance
8.54.5 MPa . s/m
Well X
MPa.s/mMPa.s/m MPa.s/m MPa.s/m
>Wedge model of acoustic impedance. Layers thicken from left to right.Synthetic wells are shown as black curves at selected CDP numbers. Thecurves represent water saturations. This model was used to generatesynthetic seismic sections. The acoustic impedance at CDP 5 was the basisof the background model used to invert the synthetic sections.
Two-
way
tim
e, m
s
1,600
1,800
2,000
2,200
1 11 21 31 41 51 61 71 81CDPWedge Model
5
4,750 7,750
Acoustic impedance
m/s.g/cm3
61459schD9R1.qxp:61459schD9R1 5/20/08 4:54 AM Page 60
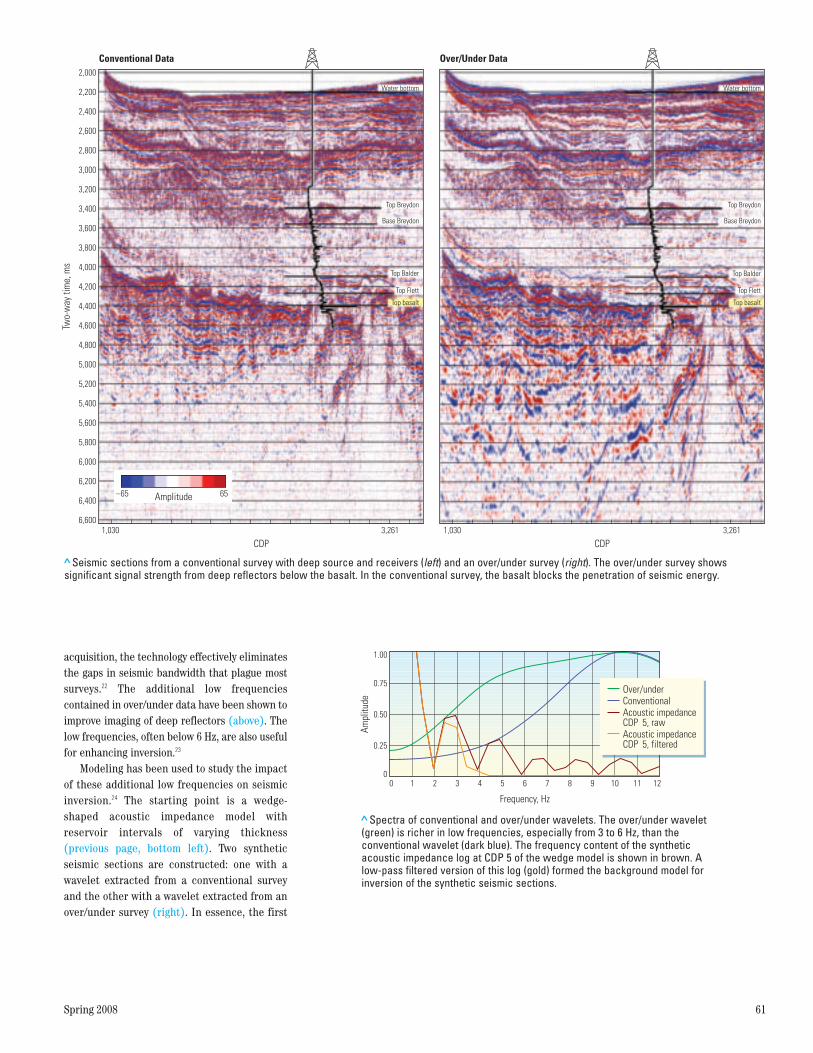
Spring 2008 61
acquisition, the technology effectively eliminatesthe gaps in seismic bandwidth that plague mostsurveys.22 The additional low frequenciescontained in over/under data have been shown toimprove imaging of deep reflectors (above). Thelow frequencies, often below 6 Hz, are also usefulfor enhancing inversion.23
Modeling has been used to study the impactof these additional low frequencies on seismicinversion.24 The starting point is a wedge-shaped acoustic impedance model withreservoir intervals of varying thickness(previous page, bottom left). Two syntheticseismic sections are constructed: one with awavelet extracted from a conventional surveyand the other with a wavelet extracted from anover/under survey (right). In essence, the first
> Seismic sections from a conventional survey with deep source and receivers (left) and an over/under survey (right). The over/under survey showssignificant signal strength from deep reflectors below the basalt. In the conventional survey, the basalt blocks the penetration of seismic energy.
Two-
way
tim
e, m
s2,000
3,400
5,000
6,600
6,400
6,200
6,000
5,800
5,600
5,400
5,200
2,200
2,400
2,600
2,800
3,000
3,200
3,600
3,800
4,000
4,200
4,400
4,600
4,800
1,030 3,2611,030 3,261
Conventional Data Over/Under Data
Top Breydon
Base Breydon
Top Balder
Top Flett
Top basalt
Water bottom
Top Breydon
Base Breydon
Top Balder
Top Flett
Top basalt
Water bottom
CDP CDP
Amplitude 65–65
> Spectra of conventional and over/under wavelets. The over/under wavelet(green) is richer in low frequencies, especially from 3 to 6 Hz, than theconventional wavelet (dark blue). The frequency content of the syntheticacoustic impedance log at CDP 5 of the wedge model is shown in brown. A low-pass filtered version of this log (gold) formed the background model forinversion of the synthetic seismic sections.
Ampl
itude
1.00
0.75
0.25
0
Frequency, Hz
0.50
Over/underConventionalAcoustic impedanceCDP 5, rawAcoustic impedanceCDP 5, filtered
0 1 2 3 4 5 6 7 8 9 10 11 12
61459schD9R1.qxp:61459schD9R1 6/27/08 2:35 PM Page 61
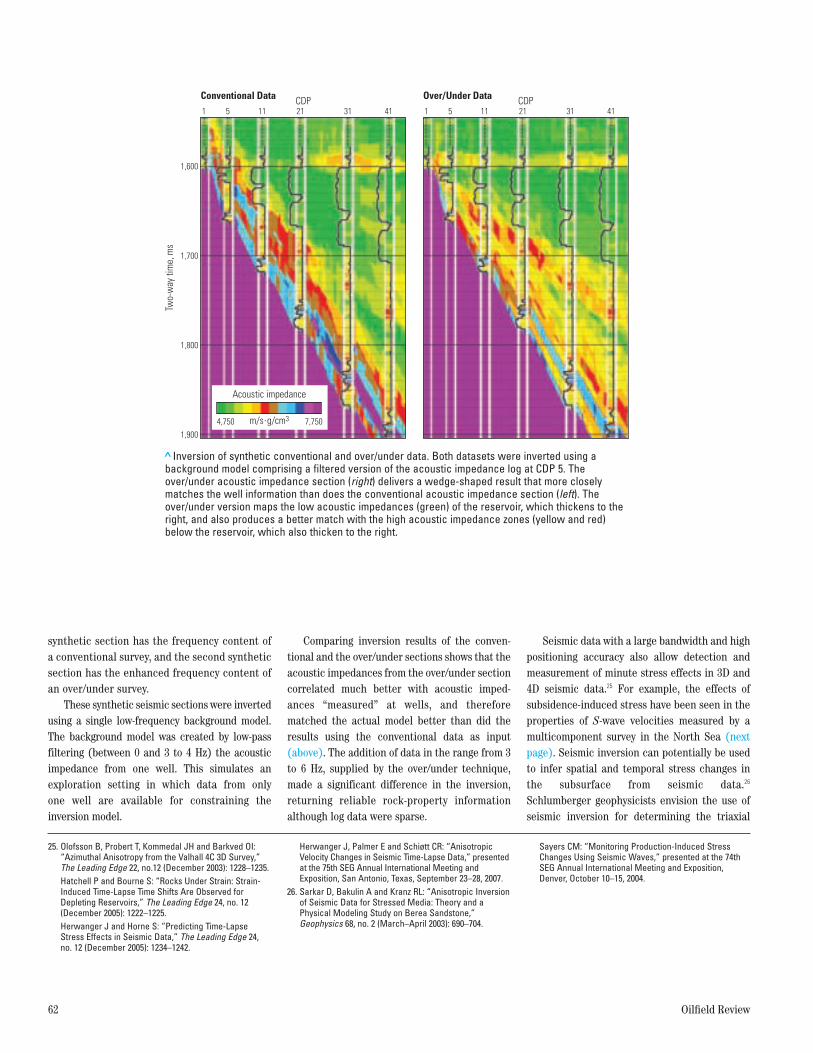
synthetic section has the frequency content ofa conventional survey, and the second syntheticsection has the enhanced frequency content ofan over/under survey.
These synthetic seismic sections were invertedusing a single low-frequency background model.The background model was created by low-passfiltering (between 0 and 3 to 4 Hz) the acousticimpedance from one well. This simulates anexploration setting in which data from only one well are available for constraining theinversion model.
Comparing inversion results of the conven -tional and the over/under sections shows that theacoustic impedances from the over/under sectioncorrelated much better with acoustic imped -ances “measured” at wells, and thereforematched the actual model better than did theresults using the conventional data as input(above). The addition of data in the range from 3to 6 Hz, supplied by the over/under technique,made a significant difference in the inversion,returning reliable rock-property informationalthough log data were sparse.
Seismic data with a large bandwidth and highpositioning accuracy also allow detection andmeasurement of minute stress effects in 3D and4D seismic data.25 For example, the effects ofsubsidence-induced stress have been seen in theproperties of S-wave velocities measured by amulticomponent survey in the North Sea (nextpage). Seismic inversion can potentially be usedto infer spatial and temporal stress changes inthe subsurface from seismic data.26
Schlumberger geophysicists envision the use ofseismic inversion for determining the triaxial
62 Oilfield Review
25. Olofsson B, Probert T, Kommedal JH and Barkved OI:“Azimuthal Anisotropy from the Valhall 4C 3D Survey,”The Leading Edge 22, no.12 (December 2003): 1228–1235.Hatchell P and Bourne S: “Rocks Under Strain: Strain-Induced Time-Lapse Time Shifts Are Observed forDepleting Reservoirs,” The Leading Edge 24, no. 12(December 2005): 1222–1225. Herwanger J and Horne S: “Predicting Time-LapseStress Effects in Seismic Data,” The Leading Edge 24,no. 12 (December 2005): 1234–1242.
Herwanger J, Palmer E and Schiøtt CR: “AnisotropicVelocity Changes in Seismic Time-Lapse Data,” presentedat the 75th SEG Annual International Meeting andExposition, San Antonio, Texas, September 23–28, 2007.
26. Sarkar D, Bakulin A and Kranz RL: “Anisotropic Inversionof Seismic Data for Stressed Media: Theory and aPhysical Modeling Study on Berea Sandstone,”Geophysics 68, no. 2 (March–April 2003): 690–704.
Sayers CM: “Monitoring Production-Induced StressChanges Using Seismic Waves,” presented at the 74thSEG Annual International Meeting and Exposition,Denver, October 10–15, 2004.
> Inversion of synthetic conventional and over/under data. Both datasets were inverted using abackground model comprising a filtered version of the acoustic impedance log at CDP 5. Theover/under acoustic impedance section (right) delivers a wedge-shaped result that more closelymatches the well information than does the conventional acoustic impedance section (left). Theover/under version maps the low acoustic impedances (green) of the reservoir, which thickens to theright, and also produces a better match with the high acoustic impedance zones (yellow and red)below the reservoir, which also thicken to the right.
Two-
way
tim
e, m
s
CDP
1,900
1,800
1,700
1,600
CDP1 5 11 21 31 41 1 5 11 21 31 41
Conventional Data Over/Under Data
4,750 7,750
Acoustic impedance
m/s.g/cm3
61459schD9R1.qxp:61459schD9R1 5/20/08 4:54 AM Page 62
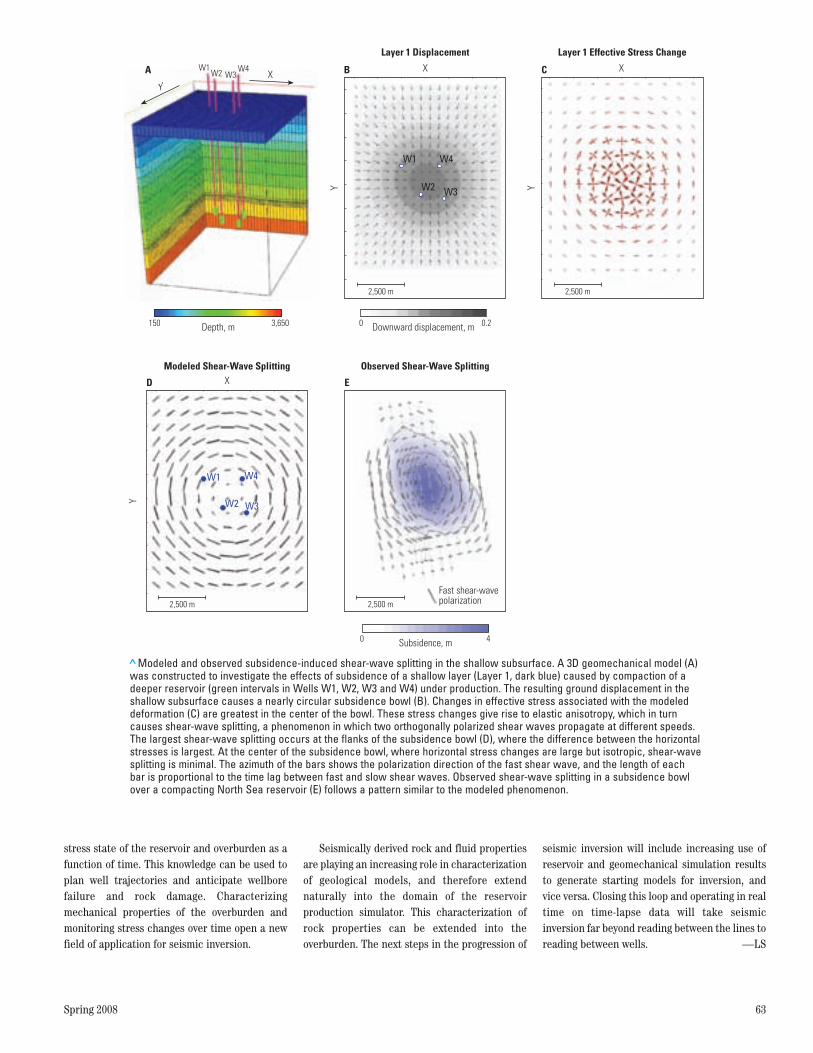
Spring 2008 63
stress state of the reservoir and overburden as afunction of time. This knowledge can be used toplan well trajectories and anticipate wellborefailure and rock damage. Characterizingmechanical properties of the overburden andmonitoring stress changes over time open a newfield of application for seismic inversion.
Seismically derived rock and fluid propertiesare playing an increasing role in characterizationof geological models, and therefore extendnaturally into the domain of the reservoirproduction simulator. This characterization ofrock properties can be extended into theoverburden. The next steps in the progression of
seismic inversion will include increasing use ofreservoir and geomechanical simulation resultsto generate starting models for inversion, andvice versa. Closing this loop and operating in realtime on time-lapse data will take seismicinversion far beyond reading between the lines toreading between wells. —LS
>Modeled and observed subsidence-induced shear-wave splitting in the shallow subsurface. A 3D geomechanical model (A)was constructed to investigate the effects of subsidence of a shallow layer (Layer 1, dark blue) caused by compaction of adeeper reservoir (green intervals in Wells W1, W2, W3 and W4) under production. The resulting ground displacement in theshallow subsurface causes a nearly circular subsidence bowl (B). Changes in effective stress associated with the modeleddeformation (C) are greatest in the center of the bowl. These stress changes give rise to elastic anisotropy, which in turncauses shear-wave splitting, a phenomenon in which two orthogonally polarized shear waves propagate at different speeds.The largest shear-wave splitting occurs at the flanks of the subsidence bowl (D), where the difference between the horizontalstresses is largest. At the center of the subsidence bowl, where horizontal stress changes are large but isotropic, shear-wavesplitting is minimal. The azimuth of the bars shows the polarization direction of the fast shear wave, and the length of eachbar is proportional to the time lag between fast and slow shear waves. Observed shear-wave splitting in a subsidence bowlover a compacting North Sea reservoir (E) follows a pattern similar to the modeled phenomenon.
Depth, m 3,650150
YX
W1W2 W3
W4A
2,500 m
Y
X
Downward displacement, m 0.20
W1
W2 W3
W4
Layer 1 Displacement
B
2,500 m
Y
X
Layer 1 Effective Stress Change
C
2,500 m
Y
X
W1
W2 W3
W4
Modeled Shear-Wave Splitting
D
2,500 m
Fast shear-wavepolarization
Subsidence, m 40
Observed Shear-Wave Splitting
E
61459schD9R1.qxp:61459schD9R1 5/20/08 4:54 AM Page 63

Frazer Barclay, Consulting Services Manager forSchlumberger Data & Consulting Services (DCS), isbased in Perth, Western Australia, Australia. He beganhis career in 1998 as a geophysicist with WesternGeophysical in London. He joined Ødegaard in 2000,completing reservoir characterization projects for vari-ous oil companies. In 2003, Frazer was appointed pro-ject manager with Ødegaard in Kuala Lumpur andtransferred to Perth in 2005 as business manager.When Ødegaard was acquired by WesternGeco, Frazerassumed the position of Reservoir Seismic Servicesmanager. He has a BS degree in geology fromUniversity of Glasgow, Scotland.
Mario Bellabarba works at the Schlumberger RiboudProduct Center (SRPC) in Clamart, France, where heis the Product Champion for FUTUR* active, set-cement technology. He began his career withSchlumberger in 1998 as a cementing field engineer inVenezuela. Prior to his current posting in France, heheld positions as an in-house engineer with Shell inThe Netherlands, cementing technical engineer inwestern Siberia and cementing manager for easternRussia. Mario earned a BS degree in civil engineeringat the University of Waterloo, Ontario, Canada.
Rashmi Bhavsar has been Advisor and MaterialsMétier Manager at the Schlumberger ReservoirCompletions Technology Center (SRC) in Rosharon,Texas, USA, since 2007. His main research interestsinclude material selection, corrosion and erosion resis-tance, failure analysis, welding development, swellableelastomers and high-pressure, high-temperature mate-rials. He joined Schlumberger in 1996 through theCamco acquisition as director of materials and weldingengineering for Schlumberger Completions Systems,Houston, and then served as principal engineer andmanager in materials engineering from 2000 to 2007.Before joining Schlumberger, he worked as a metallur-gical and quality assurance engineer in severalHouston companies. Rashmi holds an MS degree inmetallurgical engineering from The University of Texasat El Paso, and a BS degree in metallurgical engineer-ing from the University of Baroda, Gujarat, India.
Kenneth Brown is Principal Consultant withSchlumberger DCS in Pittsburgh, Pennsylvania, USA,where he manages the Gas Storage Technology prac-tice. He supervises projects in underground gas-stor-age (UGS) feasibility studies; full-field simulationstudies to evaluate UGS conversions; design, develop-ment and optimization of UGS field operations; inven-tory analyses; and assessment and modeling of UGSdeliverability. He also works on research projectsfunded by industry consortia and governmental agen-cies and provides expert witness testimony and litiga-tion support involving UGS fields. In 1997, he joinedS.A. Holditch & Associates (acquired in 1997 bySchlumberger) as a gas-storage engineer. Previously,he was with Michigan Consolidated Gas Company.Kenneth has also held positions as an independentconsultant, a reservoir engineer for Shell OilCompany, Inc. (Bakersfield, California, USA) and a
completion and production engineer for Marathon OilCompany (Lafayette, Louisiana, USA). He receivedBS and MS degrees in petroleum and natural gasengineering from The Pennsylvania State Universityin University Park.
Anders Bruun is Schlumberger Reservoir SeismicServices Business Manager for Scandinavia, based inCopenhagen, Denmark. He is responsible for salesand marketing of reservoir characterization inver-sion projects, and also lends his inversion expertiseto ongoing projects. Before this position, he wasØdegaard business manager for Norway. He beganhis career in 2000 as a processing geophysicist withWesternGeco in Stavanger. Anders has an MS degreein geophysics from University of Aarhus, Denmark,and a diploma in business administration fromCopenhagen Business School.
Hélène Bulte-Loyer is a Development Engineer withthe Well Integrity Technology/Cementing group atSchlumberger Riboud Product Center (SRPC) inClamart. She joined Schlumberger in 2003 as a chemi-cal engineer at the Schlumberger IntegratedProductivity and Conveyance Center, Sugar Land,Texas. She began in the Engineering ApplicationDepartment, working on Virtual Lab* geochemicalsimulation software. Hélène moved to SRPC in 2004 tobe part of the FUTUR team and developed the techni-cal side of the FUTUR technology. She obtained an MSdegree in chemistry from Ecole Nationale Supérieurede Chimie de Lille, and an MS degree in materialsengineering from the Université de Nice-SophiaAntipolis and Ecole Nationale Supérieure des Mines deParis, all in France.
Jose Camara Alfaro is Geophysical Interpreter,Coordination of Design for Exploitation, at Pemex inTampico, Tamaulipas, Mexico. He earned an engineer-ing degree in geophysical logging at the InstitutoTecnológico de Ciudad Madero, Tamaulipas. Jose has27 years of experience in geophysical data acquisition,interpretation and subsurface characterization.
Keith W. Chandler is Senior Vice President, EarthSciences and Reservoir Operations for Falcon GasStorage Company in Houston. His current assignment,which began in 2003, includes planning for reservoirdevelopment of gas-storage fields for UGS operations.A geologist for 52 years, he began his career in 1956with Stanolind Oil & Gas. He also spent 10 years onmine development of iron, copper, gold, water andmineral exploration in Australia, the western USA andCanada. Keith has been involved in exploration, devel-opment and evaluation, working as an independent inseveral depositional basins in the USA and interna-tionally. He holds a BS degree in geology fromOklahoma State University in Stillwater, USA.
Anthony Cooke, Business Manager for SchlumbergerReservoir Seismic Services in the UK, is based inAberdeen. He is responsible for business developmentand marketing of reservoir seismic opportunities inthe UK and Ireland. He joined WesternGeco in 2000 asa reservoir geoscientist based in London, where heworked on a variety of reservoir characterization stud-ies for reservoirs in the North Sea, North Africa,Middle East, North America and the Gulf of Mexico. In2004, he moved to WesternGeco Reservoir SeismicServices in Stavanger. Anthony received his BS degreein geology from the University of Durham, England,and his MS degree in petroleum geology from ImperialCollege of Science, Technology and Medicine,University of London.
Dennis Cooke is the Chief Geophysicist for Santos in Perth, Western Australia. He has been with the company for nine years. Before joining Santos, he wasa development and exploration geophysicist for Arcoin Indonesia, Alaska and other areas of the USA. Hiscurrent technical interests are reservoir characteriza-tion, imaging and stochastic modeling and inversion.Dennis has a PhD degree from the Colorado School ofMines, Golden, USA.
Benoit Froelich, who is an Advisor at theSchlumberger Riboud Product Center in Clamart, iscurrently involved in the development of an acousticcommunication system for downhole well testing.Since 1971, he has been active in the development oftools such as the Isolation Scanner* cement evaluationservice and other tools for measuring and evaluatingwell structures and their stability. His research hastaken him to France, Japan and the USA. Prior to hismost recent appointment, he was assigned to CasedHole Products at SRPC from 2000 to 2007. Benoitearned a PhD degree in physical chemistry at theUniversity of Paris and an undergraduate degree atEcole Supérieure de Physique et de ChimieIndustrielles (ESPCI), Paris.
Partha Ganguly is a Senior Research Scientist atSchlumberger-Doll Research (SDR) in Cambridge,Massachusetts, USA. His research interests focus onthe development and characterization of materials foroilfield application. He joined Schlumberger in 2004after a postdoctoral position at MassachusettsInstitute of Technology (MIT), Cambridge, working onconstitutive modeling of porous materials subjected tochemical and mechanical loading. Partha holds PhDand MS degrees in materials science and engineeringfrom the University of British Columbia, Vancouver,Canada, and a BS degree in metallurgical engineeringfrom the Indian Institute of Technology in Kharagpur,West Bengal, India.
Craig Gardner is a Consultant in Cementing andCement Team Leader at Chevron in Houston. Afterreceiving a BS degree in chemistry from the Universityof Houston, he worked for a major drilling fluids com-pany prior to joining Gulf Oil as a drilling supervisor in1980. He is involved in Chevron’s worldwide cementingoperations through technical services, technologydevelopment and training. Craig is a member of SPE,API and ISO and is a former chairman of the APISubcommittee on Well Cements.
Contributors
64 Oilfield Review
61459schD10R1.qxp:61459schD10R1 5/21/08 5:33 PM Page 64

Robert Godfrey, based in Gatwick, England, is cur-rently WesternGeco Fracture CharacterizationChampion, focusing on seismic applications for char-acterizing naturally fractured reservoirs. Prior to thisposition, he was inversion services manager, also in Gatwick. Robert began his career in 1979 as a geophysicist for Mobil in Dallas. In 1982, he became a research geophysicist with Digicon in London. Hejoined Geco in Calgary as geosupport manager in 1990,and since then has held a variety of research and busi-ness development positions. Robert has a BS degree in geological engineering from University of BritishColumbia, Vancouver, Canada, and a PhD degree ingeophysics from Stanford University, California.
Francisco Gonzalez Pineda is the ProspectCoordinator for Activo Integral Burgos at Pemex,Reynosa, Tamaulipas, Mexico. He has 24 years of expe-rience in oil exploration, primarily in the TampicoMisantla River basin. Francisco earned his geology andengineering degrees at the University of San LuísPotosí, Mexico.
Dominique Guillot, Schlumberger Well ServicesResearch Champion, specializes in defining newcementing markets at SDR in Cambridge,Massachusetts. He joined Dowell in 1981 in Saint-Etienne, France, as development engineer and sectionhead and later became section head and productteam manager on projects related to well cementing.In 1990, he became a cementing specialist in Houston,working on introduction of new technology. He subse-quently returned to Saint-Etienne as a cementingengineering specialist, working on cement mixing andcement job evaluation. He was section head of Processand Software and Field Support at SRPC from 1994 to1996. He has also served as cementing engineeringspecialist in Clamart, as InTouch knowledge cham-pion for the cementing segment and as well integritytechnology discipline manager. He is currently thetechnical editor of the SPE Drilling & CompletionEditorial Review Committee. A civil engineer,Dominique trained at the Ecole Nationale des Pontset Chaussées in Paris, and received a PhD degree ingeological engineering from Ecole NationaleSupérieure des Mines de Paris.
James Hawkins, who is based in Midland, Texas, isBorehole Geologist and Well Placement Engineer forthe Schlumberger DCS Group for United States Land(West, Northeast and Central) GeoMarket* region.James has worked in the Permian basin and EasternShelf area for the past 18 years as production chemist,environmental geologist, owner and president of a geo-chemical oil exploration company and independentprospecting geologist. He has BS and MS degrees ingeology from The University of Texas of the PermianBasin in Odessa.
Jorg Herwanger, Senior Geophysicist at theWesternGeco Houston Technology Center, specializesin the analysis of field seismic data for stress-inducedtime-lapse effects. His main focus is on providingcloser integration of time-lapse seismic imaging withreservoir modeling and reservoir geomechanics. Jorgbegan his career with WesternGeco in 2003 in Gatwick,England, as a Marie Curie Research Fellow. He was asenior geophysicist at Gatwick before moving to
Houston in 2006. He received a PhD degree in geo-physics from Imperial College, London, and an MSdegree in geophysics from Technische UniversitätClausthal, Germany.
John M. Hopper, President, CEO and cofounder ofFalcon Gas Storage in Houston, has significant experi-ence in all facets of the energy business, including nat-ural gas storage, gas transportation management andoptimization, storage project development, projectfinancing, trading and marketing, and energy law andregulation. Before founding Falcon, he was the presi-dent and CEO of Inventory Management andDistribution Company, Inc. (IMDCI) from 1994 to2000. Founded by John, IMDCI pioneered the commer-cial optimization of gas storage and transportationassets for local distribution companies during theearly phases of pipeline unbundling. He began hiscareer with Pennzoil Company in 1976 as a tax accoun-tant. In 1980, as co-owner and cofounder of AshExploration Company, he was active in generating oiland gas drilling prospects and property acquisitionplays in Texas, Arkansas, Louisiana, Mississippi,Michigan and New Mexico, USA. He was a member ofthe Butler & Binion law firm in its Houston andWashington, DC, offices from 1985 to 1989, specializingin oil and gas transactions and energy regulation. Heheld various executive positions with Tejas PowerCorporation (1989 to 1994) before he founded IMDCI.John holds a JD degree from South Texas College ofLaw in Houston, and a BBA degree from The Universityof Texas at Austin.
Alan Humphreys, based at SDR in Cambridge,Massachusetts, is a Senior Research Scientist in theMaterials and Mechanical Sciences Department. Hehas a PhD degree in metallurgical engineering fromthe University of Birmingham and an MA degree inmaterials science from the University of Oxford, bothin England. He has worked as a materials surveyor atLloyd’s Register, researching the structural integrity ofship steels, and also as a postdoctoral fellow in materi-als at McGill University, Montreal, Quebec, Canada.His research at Schlumberger focuses on tribology, orthe mechanisms of surface interactions (such as fric-tion and wear), under downhole conditions. Alan hasbeen coleader of the Schlumberger Eureka Materialscommunity since 2006.
Sylvaine Le Roy-Delage is Schlumberger ProjectManager and Principal for Well Integrity Technology atSRPC in Clamart. She has managed the FUTUR projectfrom concept to commercialization. She is now incharge of extension of the FUTUR platform. She beganher career at Schlumberger in 1990 at Melun, France,as a development engineer and later became a projectleader for reservoir fluid modeling. She was a develop-ment engineer and project leader on projects atClamart including equipment for drilling fluids,cement gas wells and cement sheath integrity(FlexSTONE* and DuraSTONE* advanced cementtechnologies). Sylvaine has a PhD degree in petroleumscience from the French Institute of Petroleum andEcole Nationale Supérieure du Pétrole et des Moteurs,both in Rueil Malmaison, France, and also holdsdegrees in chemical processing and chemical engineering from École Nationale Supérieure des Industries Chimiques in Nancy, France.
Dominic Lowden is the Reservoir Seismic DisciplineManager, responsible for coordinating WesternGecoResearch & Engineering (R&E) efforts, and is based inGatwick, England. After receiving a BS degree in geol-ogy from the University of Reading, England, and anMS degree in geology from the University of Guelph,Ontario, Canada, he worked as a petrophysicist withEnTec Energy Consultants in London in 1984, laterbecoming technical director of reservoir studies. Hejoined Western Atlas in 1996, responsible for reservoirseismic marketing, and then became business develop-ment manager for WesternGeco in 2001. Since then,Dominic has held several marketing and businessdevelopment management positions, and he wasrecently responsible for the integration of the newlyacquired Ødegaard company into WesternGeco.
Taoufik Manai is Schlumberger Principal ReservoirEngineer, responsible for deploying new reservoir simulation and production technologies and for coordi-nating service delivery for key and strategic accounts.Based in Paris, his current role involves overseeing thereservoir engineering practice and technical consul-tancy on Avocet* Integrated Asset Modeler projects.Taoufik has worked extensively on reservoir and production engineering projects worldwide and hascontributed to the design of underground gas-storagefacilities. He has an MS degree in mathematics fromthe Faculté des Sciences de Tunis in Tunisia, an MSdegree from Ecole des Mines de Nancy, France, and aPhD degree in petroleum engineering from UniversitéPierre et Marie Curie, Paris.
Steve McHugo is a Principal Geophysicist in theWesternGeco Integrated Solutions Group in Gatwick,England. In his present role as facilitator for Q* pro-jects, he provides a link between acquisition, process-ing and reservoir services groups to identifyopportunities for delivering integrated geophysicalsolutions to clients. After obtaining a degree in appliedphysics from Middlesex Polytechnic in England, Stevejoined Geophysical Services Inc. in 1975 as a process-ing geophysicist. During his career, he has held variouspositions relating to specialized processing of land andmarine seismic data. His main area of interest andexpertise is in developing strategies and workflows forstratigraphic inversion of seismic data, leading to seis-mically guided reservoir description.
Gareth H. McKinley is Professor of MechanicalEngineering, Director of the Hatsopoulos MicrofluidicsLaboratory and Director of the Program in PolymerScience and Technology in the Department ofMechanical Engineering at MIT. He is also executiveeditor of Journal of Non-Newtonian Fluid Mechanics.His main research interests are rheology, non-Newtonian fluid dynamics, hydrodynamic instabilitiesand extensional rheometry. He is currently working inthe Materials Group at SDR in Cambridge,Massachusetts, as an advisory consultant during hissabbatical from MIT. Gareth received a BA degree innatural sciences and MEng and MA degrees in chemi-cal engineering from the Downing College, Universityof Cambridge, England, and a PhD degree in chemicalengineering from MIT.
Spring 2008 65
61459schD10R1.qxp:61459schD10R1 5/21/08 5:33 PM Page 65

An asterisk (*) is used to denote a mark of Schlumberger.
Casing Drilling® is a registered trademark of Tesco Corporation.
Nevio Moroni is the Cementing Technical Leader inthe Drilling Technology Department of Eni E&P.Based at Eni headquarters in Milan, Italy, he joinedthe company in 1977 and is an authority on drillingfluids and cementing within the company. Nevio holdsa degree in chemistry from the Technical Institute S.Cannizzaro in Milan.
Andrea Murineddu is a Reservoir Geophysicist withSchlumberger in Stavanger. He is currently the tech-nical manager of the Reservoir Seismic Services team.He has been involved in several inversion projects,including the time-lapse prestack inversion of five vin-tages (1992, 2001, 2003, 2004 and 2006) of Norne fieldsurveys. Before moving with Schlumberger to Gatwickin 2003, Andrea was a geophysicist with EnTec EnergyConsultants and then with WesternGeco in Isleworth,England. He has a BS degree in electrical engineeringfrom the University of Cagliari, Italy.
Vladimir Onderka is the Manager of Engineering andUnderground Gas Storage Project Development inRWE Transgas Net, s.r.o. He also chairs WorkingCommittee 2 (WOC 2) for UGS of the InternationalGas Union. He has more than 20 years of experienceas a reservoir engineer, starting with VUGI (ResearchInstitute of Geological Engineering) in Brno, CzechRepublic. Vladimir was later the technical director ofGeoGas, a.s., and Duke Engineering & Services. Sincethe beginning of his career he has been involved inUGS development including reservoir engineering,well testing, simulation and expert systems on UGSfor RWE in the Czech Republic, reactive modeling of flow and transport for Diamo uranium mining company and other major projects. Vladimir is a graduate of Charles University, Prague, with an MS degree in geochemistry and a PhD degree in geochemistry and applied geophysics.
Hüseyin Özdemir is Principal Reservoir Geophysicistwith Schlumberger Reservoir Seismic Services inGatwick, England, promoting prestack inversion torock and reservoir properties for all marine and landseismic projects. He joined Schlumberger in 1985 as adivision geophysicist in Kuwait and the UAE, and fiveyears later moved to the Geco-Prakla reservoir char-acterization group in Norway. Before assuming hiscurrent position, he held various senior scientist andleadership positions within WesternGeco andSchlumberger. Prior to working for Schlumberger,Hüseyin was an associate professor in applied geo-physics at the Istanbul Technical University in Turkey,and a consultant to the Turkish PetroleumCorporation. He has a PhD degree in geophysics fromImperial College of Science, Technology andMedicine, University of London. He also holds a BSdegree from the University of Istanbul and an MSdegree from University of Birmingham, England, bothin geophysics.
Slavo Pastor is Schlumberger Oilfield ServicesGeoMarket Manager for south Russia, based inTyumen. He began his career with DowellSchlumberger in 1993 as a field engineer trainee. He
has held managerial positions within IntegratedProject Management, Oilfield Services andSchlumberger Information Solutions groups in Turkey,Romania, Bulgaria, Poland, Czech Republic, Germanyand the UK. Slavo received an MBA degree fromErasmus University, Rotterdam, The Netherlands. Healso holds an MS degree in computer engineering anda BS degree in mining engineering, both from theTechnical University of Košice, Slovakia.
Frederic Pauchet has been an Engineer in theMechanical Technology Group at SchlumbergerRiboud Product Center (SRPC) in Clamart, France,since 1994. He joined Schlumberger in 1988 and heldvarious engineering positions at SRPC. His researchinterests include materials science, mechanics andchemistry. Frederic has an engineering diploma fromÉcole Nationale Supérieure de Chimie de Paris, France.
Stephen Pickering, Project Manager, SchlumbergerCareer Management Initiative, and GeophysicsDomain Career Leader in Gatwick, England, focuseson the use of seismic studies to enhance reservoirmanagement. He began his career as a seismic dataanalyst with Western Geophysical. In 1981, he joinedHamilton Oil as seismic interpreter on North Seaacreage, including the Bruce field appraisal. From1989 to 1995, he was UK and Europe exploration man-ager for Hamilton Oil. After a move to BHP Petroleum,he became manager of exploration technology withprimary responsibility for prospect evaluation andportfolio management. He rejoined WesternGeophysical in 1999. In 2007, Stephen was presidentof the Petroleum Exploration Society of Great Britain;he was technical chairman of the society’s biennialPETEX-2004 Conference and Exhibition. Stephenreceived a BS degree in geology and an MS degree instratigraphy from University of London, and an MBAdegree from Open University in Milton, England.
Andreas Rasmussen, who is based in Stavanger, is a Schlumberger Reservoir Seismic ServicesGeophysicist. Recently, he worked on a 3D amplitudevariation with offset (AVO) multicomponent inver-sion project for StatoilHydro. In 2006, he joinedØdegaard in Copenhagen, where his main responsi-bilities included seismic inversion of 2D, 3D and 4Ddata using the ISIS* reservoir characterization soft-ware. Andreas has a BS degree in geology and an MS degree in earth sciences, both from University ofAarhus, Denmark.
Klaus Bolding Rasmussen is Research Manager forthe WesternGeco Reservoir Seismic R&E group inCopenhagen. As the developer of all the Ødegaardinversion-related algorithms, he continues to supportcommercial inversion projects performed by ReservoirSeismic Services using ISIS software. He began devel-oping algorithms for Ødegaard in 1991. Klaus has MSand PhD degrees in electronics engineering from theTechnical University of Denmark in Lyngby. He alsohas a bachelor’s degree in business administrationfrom Copenhagen Business School.
Ron Roberts is a Senior Geophysical Advisor forApache Canada, based in Calgary. Prior to this assign-ment, he was the geophysical manager for ApacheEgypt and was based in Cairo for six years. He has alsobeen a geophysical interpreter for both AmocoProduction Company and Texaco North America, hold-ing positions in New Orleans, Houston, London andDenver. Ron has been championing the use of inver-sion technology for the last 10 years. He received a BSdegree in geophysics from University of Delaware, anMS degree in applied physics from the University ofNew Orleans and an MBA degree from the Universityof Denver.
Agathe Robisson is a Senior Research Scientist atSDR in Cambridge, Massachusetts, where she is devel-oping and modeling new polymeric materials for high-temperature applications. She joined Schlumberger in2000 as a mechanical and materials engineer at theSchlumberger Riboud Product Center in Clamart.Agathe earned a PhD degree in materials at Ecole desMines de Paris, France, and an engineering diplomafrom Institut National des Sciences Appliquées inLyon, France.
Darren Salter, Senior Geophysicist with Santos, iscurrently working on Australian offshore developmentprojects. His previous experience includes explorationand development onshore Australia. Darren has beenwith Santos for 10 years and has a Bachelor of AppliedScience degree in geology from the University ofSouth Australia, Mawson Lakes.
Lowell Thronson is the Vice President of Engineeringand Construction for Falcon Gas Storage Company. Hehas more than 35 years of experience in engineeringand senior-level management for upstream and mid-stream oil and gas projects, providing expertise, lead-ership and direction for engineering and designservices; project management services; developmentplanning and marketing of engineering and construc-tion services to domestic and foreign energy-relatedcompanies. Before joining Falcon, he founded and wasprincipal engineer of TECORP International, PLLC,which provided development planning and engineer-ing for many natural gas–storage and oil and gas pro-jects around the world including underground naturalgas-storage projects and related pipeline facilities.From 1983 to 2001, Lowell was the founder, presidentand chief executive officer of Thronson EngineeringCorporation (a Houston 100 Company) and ThronsonInternacional de Venezuela, C.A. (TIVENCA), wherehe provided engineering, operations management,and planning and project development for the domes-tic and international oil and gas production, process-ing and petrochemical industries. He is a registeredprofessional engineer in petroleum and natural gassciences in Texas. Lowell received his BS degree inmechanical engineering from The University of Texasat Austin.
66 Oilfield Review
61459schD10R1.qxp:61459schD10R1 5/21/08 5:33 PM Page 66

Huilin Tu is a Research Scientist at SDR inCambridge, Massachusetts, where she is developinghigh-temperature polymers and swellable elastomers.She joined Schlumberger in 2006. Huilin has BS andMS degrees in chemistry from Peking University,China, and a PhD degree in materials science andengineering from the University of Illinois at Urbana-Champaign, USA.
Nitin Y. Vaidya is a Group Leader for Polymers at theSchlumberger Reservoir Completions TechnologyCenter (SRC) in Rosharon, Texas. He is an expert inswellable polymer technologies, high-temperaturepolymer applications, elastomer formulation and pro-cessing (molding and extrusion), structure-propertyrelationships in polymers and thermal analysis of poly-mers. He joined Schlumberger in 2000. Before movingto SRC in 2004, he was a polymer chemist and seniorR&D engineer with the Schlumberger LawrenceProduct Center in Kansas, USA. Nitin holds a PhDdegree in polymer engineering from the University ofAkron, Ohio, USA; an MS degree in chemical engineer-ing from the Indian Institute of Technology, Mumbai,Maharashtra; and a BS degree in chemical engineeringfrom the University of Mumbai.
Robert van Kuijk, Program Manager for iCoil* opticalfiber installed CT string, is assigned to SchlumbergerWell Services at SRPC in Clamart. He joinedSchlumberger in 1993 as project engineer at PraklaSeismos in Uetze, Hannover, Germany. Before assum-ing his current management responsibilities in 2007,he held posts as senior project engineer, section man-ager and project leader with Geco-Prakla OsloTechnology Center (OTC) in Norway and Geco-Praklain Sugar Land, Texas. Robert has also been projectmanager for Wireline at WesternGeco OTC and projectmanager for the Isolation Scanner tool at SRPC. Hehas an MS degree in electrical engineering and com-puter science from the University of Twente inEnschede, The Netherlands, where he specialized inmechatronics.
Stefano Volterrani is MultiMeasurement ReservoirDescription and Geology Product Champion forWesternGeco in Houston. He began his career as asenior processing analyst with Western Geophysical inthe UK in 1985. In 1988, he became a technical man-ager at EnTec Energy Consultants. He moved to Egyptin 2000 as technical supervisor of integrated servicesand held various management and product develop-ment positions until he assumed his current positionin 2006. Stefano holds a BS degree in geology from theUniversity of Pisa, Italy.
Joachim Wallbrecht joined BEB Erdgas und Erdöl 30years ago as a petroleum engineer. He is in charge ofAsset Management for BEB’s underground gas storagebusiness. Based in Hannover, Germany, he has workedin various oil and gas reservoir engineering projects, aswell as in gas demand and supply balancing. Duringthe last 17 years, Joachim has planned and developednew UGS facilities and has been active in gas reservoirand gas-storage management. He has an MS degree inpetroleum engineering from Technische UniversitätClausthal, Germany.
Nathan Wicks is a Research Scientist in Mechanicaland Materials Sciences at SDR in Cambridge,Massachusetts. His research interests are in drillingdynamics software, deployable structures andmechanical and materials sciences. He joinedSchlumberger in 2005. Nathan received BS and MSdegrees in mechanical engineering from YaleUniversity, New Haven, Connecticut, USA. He alsoreceived an MS degree in applied mathematics and aPhD degree in solid mechanics from HarvardUniversity, Cambridge, Massachusetts.
Augusto Zanchi is a Drilling and CompletionEngineer for Stogit, the Eni company responsible forgas storage. Currently based in Crema, Italy, Augustojoined Eni in 1990 and moved to Stogit when it wascreated in 2001. In addition to his current posting inItaly, he has worked for Eni in West Africa. Augustoholds a degree in chemistry from the TechnicalInstitute G. Galilei in Milan.
Georg Zangl is Technical Manager of SchlumbergerInformation Solutions (SIS) Technology Center inBaden, Austria. He is responsible for the consultinggroup of SIS Austria as well as the petroleum engineer-ing development concepts of DECIDE!* data miningbased production optimization software. With morethan 16 years of experience, he has worked on variousaspects of reservoir engineering. Georg has spentmany years on the development and commercializa-tion of reservoir simulation–related software and, since1996, has been an advocate of data mining technologiesin the petroleum industry. In the last five years, he hasbeen involved in the development of reservoir surveil-lance systems and applications. The results of his workhave been published in several international confer-ences and printed media. Georg is the author of thebook Data Mining: Applications in the PetroleumIndustry. He earned an MS degree in petroleum engi-neering at the University of Leoben, Austria.
Smaine Zeroug is Technology Center MarketingManager at the Schlumberger Riboud Product Centerin Clamart. Before this, he managed the production ofthe book Well Evaluation Conference–Algeria 2007, atwo-year project carried out with Algeria’s national oilcompany, Sonatrach. He moved to that project fromSDR in Cambridge, Massachusetts, where he began hiscareer in 1992. There, he held several positions includ-ing senior scientist, principal scientist and programmanager of the Modeling and Inversion ApplicationsProgram. His research activities have centered on thedevelopment of new-generation wireline ultrasonicimaging and borehole sonic logging technologies.Smaine holds a BS degree in solid-state physics fromthe University of Algiers (USTHB), Algeria, and MSand PhD degrees in electrophysics from PolytechnicUniversity, New York City. He received a Schlumbergerin-company MBA degree from Erasmus University,Rotterdam, The Netherlands. The author of numeroustechnical papers and holder of several patents, Smaineis a senior member of the IEEE and has served as asso-ciate editor of the IEEE Transactions on UFFC(Ultrasonics) since 2002.
Spring 2008 67
An asterisk (*) is used to denote a mark of Schlumberger.
61459schD10R1.qxp:61459schD10R1 5/21/08 5:33 PM Page 67

The emphasis on storytelling overconcepts, however, creates pedagogicalchallenges. For instance, the book is free of pictures and diagrams: a puzzling omission.
Similarly, many of the most exciting aspects of general relativity get short shrift.
Caveats aside, Girifalco is a fluidwriter, and his stories are compelling.This book about the force of gravityhas its feet firmly on the ground.Caroll S: Nature 451, no. 7175 (January 10, 2008): 130.
Super Volcano: The Ticking TimeBomb Beneath Yellowstone National ParkGreg BreiningVoyageur Press729 Prospect AvenueP.O. Box 1Osceola, Wisconsin 54020 USA2007. 256 pages. $24.95ISBN 0-7603-2925-7
Below Yellowstone National Park is one of the world’s five super volcanoes. Science writer Breining provides a solidintroduction to modern volcanology in this study of super volcanoes in general, and the Yellowstone caldera—potentially the most deadly active volcano on the planet—in particular. Inaddition to describing what is likely tohappen when Yellowstone erupts, thisbook describes how volcanoes functionand includes a time line of famous volcanic eruptions throughout history.
Contents:• The Big Blast • Yellowstone Today• Natural Wonders• Evolving Geology • The Yellowstone Puzzle • Distant Death• Most-Super Volcanoes• The Deadliest Volcanoes• The Next Big Blast• Glossary, References, Index
Coming in Oilfield Review
New Dimensions in Resistivity.Resistivity, perhaps the most funda-mental of petrophysical measure-ments, has been used to identify oil and gas deposits for more than80 years. Triaxial resistivity, madepossible because of increased pro-cessing power and sensor develop-ments, is changing the way hydro-carbon reservoirs are evaluated.Case studies from around the worldwill help demonstrate several impor-tant applications of this new tech-nology: accurate resistivity measure-ments in highly dipping beds or indeviated wells, laminated sand anal-ysis using vertical and horizontalresistivities, and structural formationdip from induction measurements.
Multistage Hydraulic Fracturing.Today’s new oil and gas productionis more likely to come from improvedrecovery of proven reserves thanfrom development of virgin reservoirs.For this reason, the upstream indus-try is drilling an increasing numberof high-angle wells to reach remotebut previously uneconomicaldeposits, to pierce thin reservoirhydrocarbon-bearing sands andshales and to improve reservoirdrainage. These same goals ofincreased production and greaterultimate reserve recovery have alsospurred renewed interest in hydraulicfracturing. This article looks at theconfluence of these trends and therole of coiled tubing in fracturingolder wells, openhole completionsand wells with multiple zones.
Groundwater Management.Groundwater constitutes an over-whelming share of our freshwaterresources. However, rapid populationgrowth, rising standards of living,changing weather patterns and pol-lution are imposing great demandson groundwater supplies. Managingthese reserves is key to achieving asustainable supply of fresh water.Advanced logging, sampling andmodeling techniques—some bor-rowed or modified from establishedoilfield applications—are provingvital for evaluating and managingthis precious resource.
68 Oilfield Review
NEW BOOKS
The Universal Force: Gravity—Creator of WorldsLouis A. GirifalcoOxford University Press198 Madison AvenueNew York, New York 10016 USA2007. 320 pages. $46.95ISBN 0-19-922896-5
Understanding gravity has challengedgenerations of great scientists, fromGalileo to Einstein. This book describesthe achievements of those who studiedthe nature of gravity, its origins and itseffects. The author weaves an interest-ing narrative from the complex historyof this field.
Contents:• The Seeker• The Giants• The First Modern Giant• The Grid• The Universal Force• The Laws• The System of the World• Force and Mass• Two More Giants• Ether• The Genius• Time and Space• It Really Is True• The Space-Time Continuum• Time Warps and Bent Space• It Stands Alone• This Too Is True• Crunch• Beyond Existence• Absolute Space?• Infinity • How Weird Can It Get? • Scientific Truth• The Meaning of Why • Final Comments
For anyone interested in the morehuman side of science, this work is avaluable contribution.
Super Volcano captures theessence, the excitement, and the deepand far-reaching influence of theworld's greatest heat anomaly.
Breining writes for the laypersonwith enthusiasm and informality, bring-ing the subjects to life with copiousquotes from naturalists, field leaders,and volcanologists.… A rare read!…Highly recommended.Grose TLT: Choice 45, no. 7 (March 2008): 1189.
Notes from the Holocene: A Brief History of the FutureDorion SaganChelsea Green Publishing Company85 North Main Street, Suite 120White River Junction, Vermont 05001USA2007. 224 pages. $14.95ISBN 1-933-39232-0
Operating on the precept that the uni-verse is much stranger than we mightimagine, Sagan—son of noted scientistsCarl Sagan and Lynn Margulis—useshis knowledge of philosophy, scienceand sleight-of-hand magic to exploresome of the deepest questions of life.He provides fresh insights on the natureof technology, the prognosis for human-ity, the living nature of our planet andan explanation on why our universe maybe just one of an infinite number.
Contents:• Earth• Water• Air• Fire• Afterword: Twelve Mysteries• Index
This whimsical book takes on thebig questions of the universe.… In the end, Sagan does not necessarilyanswer these big questions, but, moreimportantly, he encourages readers tobe thoughful and creative in their ownexplorations of truth.Oberle GD III: Choice 45, no. 7 (March 2008): 1190.
61459schD11R1.qxp:61459schD11R1 6/25/08 7:35 PM Page 68

08-OR-002-0
61459schD1R1.qxp:61459schD1R1 5/24/08 4:54 AM Page 2

Spring 2008
Intelligent Gas Storage
Zonal Isolation
Smart Materials
Seismic Inversion
Oilfield Review
SCHLUMBERGER OILFIELD REVIEW
SPRING 2008
VOLUME 20 N
UMBER 1
61459schD1R1.qxp:61459schD1R1 5/29/08 1:19 AM Page 1