Embed Size (px)
Citation preview

OIL STAINHow Dirty Crude Undercuts California’s Climate Progress
CENTER FOR BIOLOGICAL DIVERSITY • NOVEMBER 2017

Lead authors: Shaye Wolf, PhD and Kassie Siegel. Contributions from Brian Nowicki, Jean Su, Kevin Bundy, John Fleming, PhD, Rebecca Fuoco, and Patrick Sullivan. All are with the Center for Biological Diversity.
This report is dedicated to the memory of Rosemarie Braz, August 4, 1961-May 3, 2017. As the Center’s Climate Campaign Director from 2009 until her death, Rose launched and led campaigns to end fracking and oil production in California and fought for climate justice worldwide.
The Center for Biological Diversity is a national, nonprofit conservation organization dedicated to the protection of endangered species and wild places.
Design by Dipika Kadaba.
Map by Kara Clauser.
Cover and inset image: Inglewood Oil Field © Gary Kavanagh 2017.
November 2017.
Published by Center for Biological Diversity (www.biologicaldiversity.org).
Executive Summary
California has positioned itself as a global leader on climate change and is pushing its approach as a model for the rest of the world to follow. Yet few people realize that California is the nation’s third-largest oil-produc-
ing state and extracts vast quantities of some of the planet’s heaviest and most climate-polluting oil.
For this analysis, we used lifecycle emissions estimates for California crude oils and state oilfield data to answer two key questions:
• How dirty is California’s current crude oil production? • How dirty are California’s remaining crude oil reserves?
We found that three-quarters of the state’s current oil production is composed of very dirty crude that rivals Cana-da’s tar sands crude and diluted bitumen in terms of its lifecycle greenhouse gas emissions and climate impacts.
Nearly two-thirds of remaining oil reserves in 18 of the largest oil fields in the San Joaquin and Los Angeles Ba-sins are also very dirty, totaling 6.1 billion barrels of particularly climate-damaging crude.
A major reason why California’s heavy oil is so climate-damaging is that pumping it from the ground requires energy-intensive extreme-extraction techniques such as cyclic steaming, steam flooding, waterflooding, and fracking. Refining California’s heavy oils also produces large amounts of petcoke, a toxic byproduct that is worse for the climate than coal when burned.
California’s dirty oil production releases pollutants to the air, water, and soil that threaten the health of sur-rounding communities. Many of the state’s oil fields operate in densely populated areas, meaning that oil drill-ing occurs dangerously close to millions of Californians. Of particular concern, oil drilling in California occurs disproportionally in communities of color already suffering from severe environmental pollution.
To date, Governor Brown and California’s climate policies have not only failed to reduce dirty crude production but have actually incentivized oil production overall. From subsidizing oil and gas development to weak regula-tion, California has rolled out the red carpet for oil companies.
This report demonstrates how the Golden State’s laissez-faire approach to oil drilling stifles real climate progress. We lay out urgently needed steps to ramp down California’s dirty oil production.
California must develop a plan for a just transition to 100 percent clean energy that truly protects the climate and our vulnerable communities. Necessary changes include a halt to new drilling and oil field expansion, a ban on fracking and related extreme extraction techniques, establishing buffer zones that prohibit neighborhood drill-ing, and ending state subsidies to the oil industry.
These actions should be taken immediately, while working to phase out all oil and gas production within the next several decades. If implemented, these steps would provide a true model for climate leadership that could be adopted by other governments.
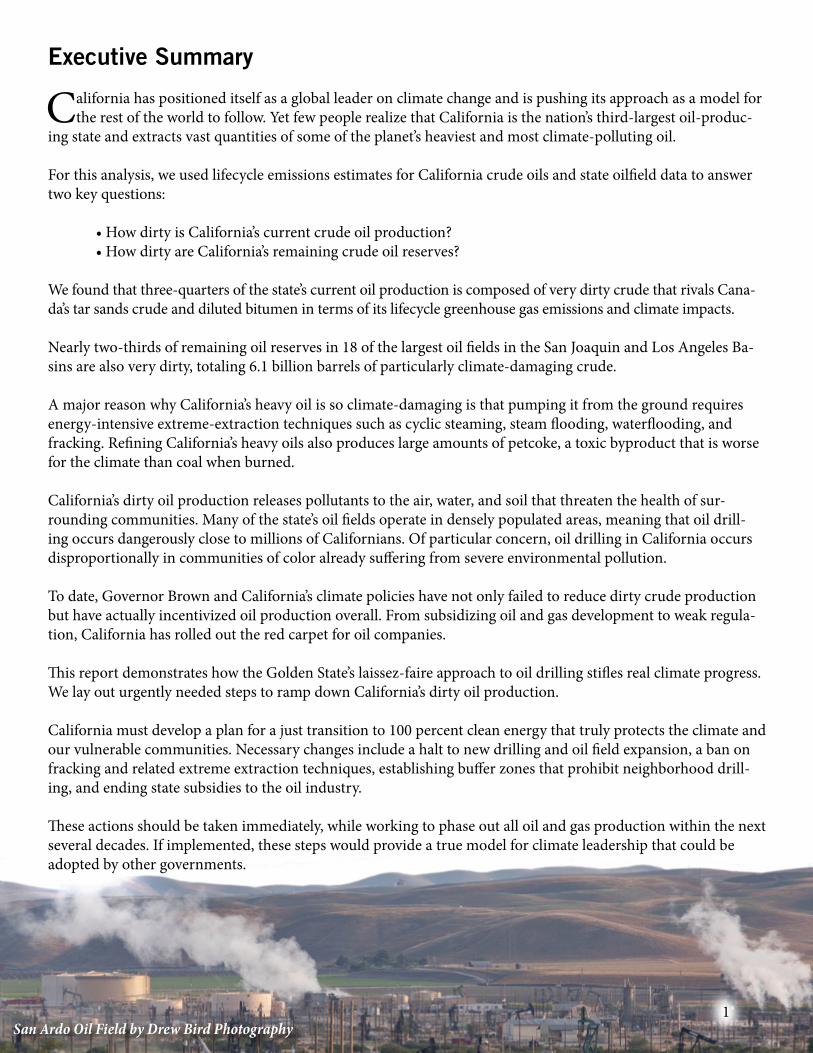
1San Ardo Oil Field by Drew Bird Photography
California’s Dirty Oil Problem
California is the nation’s third-largest oil-producing state.1 It produces about 200 million barrels of oil
per year.2 Despite the state’s climate policies, Califor-nia oil development is not slowing down. California oil regulators issued 3,303 drilling permits for oil and gas wells in 2015 alone.3 In 2015, Kern County — the state’s largest oil-producing county — projected the de-velopment of approximately 2,697 new wells per year for the next 20 years and beyond.4
Much of the remaining oil in California’s largest oil fields is extremely heavy and waterlogged, making it very energy-intensive to pump out of the ground, make flow, and refine. In fact, California is estimated to contain nearly one-half of the country’s heavy oil.5
Some California crudes are, barrel for barrel, as damaging for the climate as Canadian tar sands crude, according to estimates by experts at the Carnegie Endowment for International Peace.6 The Carnegie team estimated the lifecycle greenhouse gas emissions for 154 California crude oils including emissions produced during upstream production, midstream refining, and downstream end use of refined products.7 In a ranking of lifecycle emis-sions of 75 crudes from around the globe, crude from three of California’s largest oil fields — Mid-way-Sunset, South Belridge, and Wilmington —
made the top 10.8 California oils were the only U.S. oils in the top 10.
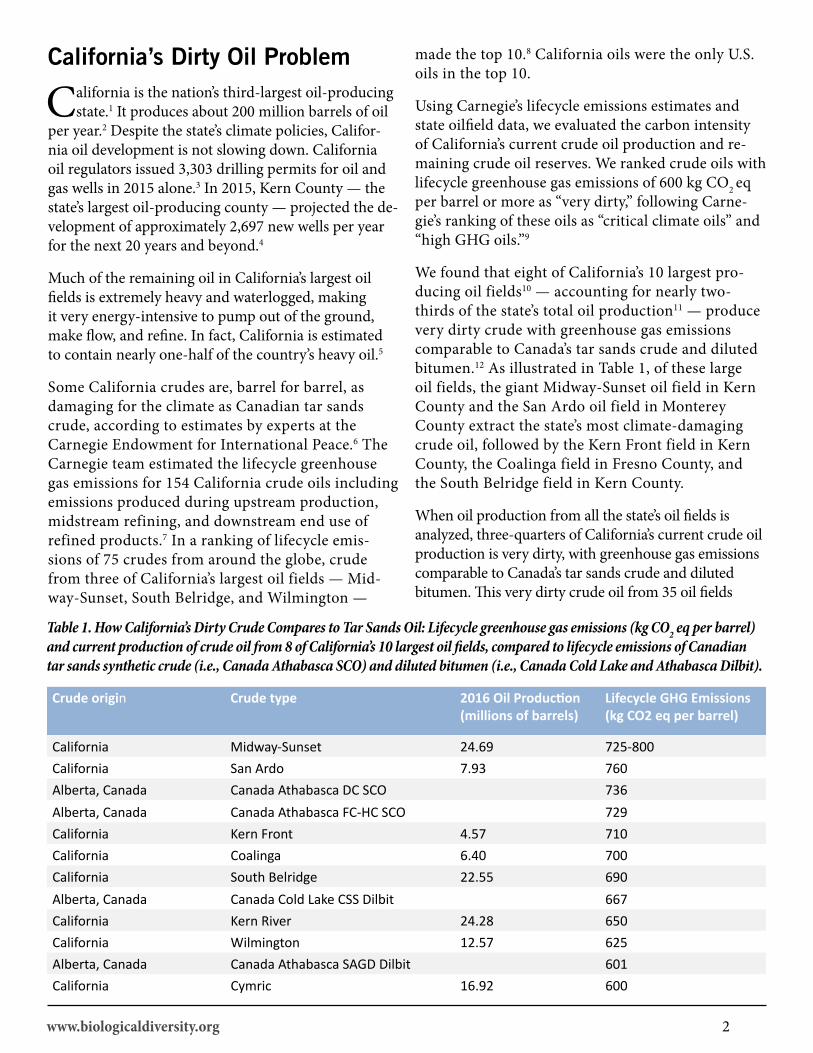
Using Carnegie’s lifecycle emissions estimates and state oilfield data, we evaluated the carbon intensity of California’s current crude oil production and re-maining crude oil reserves. We ranked crude oils with lifecycle greenhouse gas emissions of 600 kg CO2 eq per barrel or more as “very dirty,” following Carne-gie’s ranking of these oils as “critical climate oils” and “high GHG oils.”9
We found that eight of California’s 10 largest pro-ducing oil fields10 — accounting for nearly two-thirds of the state’s total oil production11 — produce very dirty crude with greenhouse gas emissions comparable to Canada’s tar sands crude and diluted bitumen.12 As illustrated in Table 1, of these large oil fields, the giant Midway-Sunset oil field in Kern County and the San Ardo oil field in Monterey County extract the state’s most climate-damaging crude oil, followed by the Kern Front field in Kern County, the Coalinga field in Fresno County, and the South Belridge field in Kern County.
When oil production from all the state’s oil fields is analyzed, three-quarters of California’s current crude oil production is very dirty, with greenhouse gas emissions comparable to Canada’s tar sands crude and diluted bitumen. This very dirty crude oil from 35 oil fields
Crude origin Crude type 2016 Oil Production (millions of barrels)
Lifecycle GHG Emissions (kg CO2 eq per barrel)
California Midway-Sunset 24.69 725-800California San Ardo 7.93 760Alberta, Canada Canada Athabasca DC SCO 736Alberta, Canada Canada Athabasca FC-HC SCO 729California Kern Front 4.57 710California Coalinga 6.40 700California South Belridge 22.55 690Alberta, Canada Canada Cold Lake CSS Dilbit 667California Kern River 24.28 650California Wilmington 12.57 625Alberta, Canada Canada Athabasca SAGD Dilbit 601California Cymric 16.92 600
Table 1. How California’s Dirty Crude Compares to Tar Sands Oil: Lifecycle greenhouse gas emissions (kg CO2 eq per barrel) and current production of crude oil from 8 of California’s 10 largest oil fields, compared to lifecycle emissions of Canadian tar sands synthetic crude (i.e., Canada Athabasca SCO) and diluted bitumen (i.e., Canada Cold Lake and Athabasca Dilbit).
2www.biologicaldiversity.org

3
Large California Oil Fields Producing the Dirtiest Crude These 15 California oil fields extract 1 million barrels or more of dirty crude each year that is as climate-dam-aging as Canadian tar sands crude and release pollutants that are dangerous to the health of surrounding communities. In 2016, these 15 fields extracted 136 million barrels of highly dirty crude.

comprised 72 percent of California’s total oil production in 2014, 73 percent in 2015, and 75 percent in 2016.13
Comprehensive estimates of recoverable oil reserves in California are not publicly available. However, recent estimates of the remaining recoverable oil reserves in nine of the largest oil fields in the San Joaquin Basin and nine of the largest oil fields in the Los Angeles Basin average 9.5 billion barrels.14 Of the remaining reserves in these 18 fields, nearly two-thirds — totaling 6.1 billion barrels — are very dirty, with greenhouse gas emissions, barrel for barrel, comparable to Cana-da’s tar sands crude and diluted bitumen.15
As illustrated in Table 2, the massive Midway-Sunset oil field in Kern County has the largest remaining volume of very dirty crude, estimated at 1.7 billion barrels, followed by 1.5 billion barrels of very dirty crude in South Belridge, 973 million barrels in Wilm-ington located in Los Angeles, and 705 million barrels in Coalinga in Fresno County.
Extreme Extraction and Dirty By-products
Many of California’s oils have such a high climate impact because it takes a lot of energy to extract
heavy crude oil from underground geologic forma-tions. As California’s oil fields have become more depleted and waterlogged over time, oil companies
Table 2. California’s Huge Reserves of Dirty Oil: Lifecycle greenhouse gas emissions (kg CO2 eq per barrel) and average remaining reserves in the 10 oil fields in the San Joaquin and Los Angeles Basins with the largest estimated remaining reserves. Crude oils that are particularly dirty (lifecycle emissions of 600 kg CO2 eq per barrel or more) are highlighted in bold.
California Oilfield County Remaining Reserves (millions of barrels)
Lifecycle GHG Emissions (kg CO2 eq per barrel)
Midway-Sunset Kern 1,655 725-800South Belridge Kern 1,504 690Lost Hills Kern 986 540Wilmington-Belmont Los Angeles 973 625Coalinga Fresno 705 700Elk Hills Kern 548 510Huntington Beach Orange 416 610Long Beach Los Angeles 410 510Kern River Kern 332 650Cymric-Welport Kern 269 600
San Ardo Oil Field by Drew Bird Photography
4www.biologicaldiversity.org

Extreme Extraction Techniques Common in California
Cyclic steam injection: Steam is repeat-edly injected into the oil well to heat the crude within the underground forma-tion, allowing it to flow more easily up the well. Cyclic steam injection requires steam generators — essentially huge boilers burning natural gas or other fos-sil fuels — and transportation of massive quantities of water.
Steam flooding and waterflooding: Large volumes of steam or water, respectively, are pumped into injection wells to loosen the oil and push it towards production wells.
Fracking: Large volumes of water, sand, and chemicals are pumped at high pres-sures into the rock formation, causing it to crack and release oil and gas.
have increasingly used extreme extraction techniques — involving high energy inputs and large volumes of water — to loosen this viscous, heavy crude and push it toward production wells.
Common extraction techniques — including cyclic steam injection, steam flooding, waterflooding, and fracking — are energy and water intensive. They’re also dangerous: an oil field worker was killed in the Mid-way-Sunset field in 2011 when he fell into a sinkhole created by cyclic steam injection.
The Midway-Sunset field — the state’s largest producer of dirty crude with the largest remaining reserves of dirty oil — illustrates the growth of extreme extraction in California. This field has been in production since 1894 and has required increasingly large volumes of steam to pump its heavy oil out of the ground. In 2017, more than three quarters of the field’s 20,081 active wells used cyclic steam injection (67 percent) or steam flooding (10 percent) for extraction.16
In the South Belridge field in Kern County, also a major source of dirty crude, 41 percent of active wells used cyclic steam injection, steam flooding or waterflooding in 2017.17 Not only does this field rely on large volumes of steam and water for oil recovery, but it also uses the most fracking of any oil field in California. In 2015 alone, 652 fracking events were reported in this field, representing 88 percent of total fracks in the state that year.18
As the use of extreme extraction techniques has grown, the energy intensity of oil production in California has risen significantly.19 Recent analyses found that green-house gas emissions (per megajoule of crude) from oil production have increased in the six major California oil fields analyzed: Coalinga, Huntington Beach, Kern River, Midway-Sunset, South Belridge, and Wilming-ton.20 In Midway-Sunset, the use of extreme extraction techniques has led to a four-fold increase in produc-tion emissions over the past fifty years.21 As Califor-nia’s oil fields age, the carbon intensity of the state’s oil production will continue to grow.22
Refining California’s heavy oil also produces large amounts of a dirty byproduct called petroleum coke, or petcoke.23 Petcoke is extremely toxic and climate dam-aging, emitting more carbon dioxide than coal when burned.24 Because air quality regulations effectively prohibit the burning of petcoke within the state, Cal-
ifornia’s oil industry exports petcoke abroad25 where it is burned, harming the climate and public health.26 Emissions from burning petcoke contribute to the high greenhouse gas footprint of California’s heavy oil.
Health Dangers to Vulnerable Communities
California’s dirty oil production not only fuels climate change but also releases pollutants to the
air, water, and soil that endanger surrounding com-munities. Harmful pollutants emitted by oil produc-tion include known cancer-causing chemicals like benzene, formaldehyde, and cadmium; smog-forming chemicals like nitrogen oxides, volatile organic com-pounds, and methane; and particulate matter includ-ing diesel exhaust and silica dust that cause lung and heart problems.27
Research has found that people living near drilling sites have a higher risk for developing cancer,28 in-creased asthma attacks,29 higher hospitalization rates,30 and more upper respiratory problems and rashes.31 Among pregnant women, living closer to drilling sites is associated with a higher risk of having babies with
5www.biologicaldiversity.org

birth defects,32 premature births and high-risk preg-nancies,33 and low-birthweight babies.34
The health threats from oil production are particu-larly alarming because many of California’s oil fields operate in densely populated areas, meaning that drilling occurs dangerously close to millions of Cali-fornians.35 Furthermore, drilling in California occurs disproportionally in low-income communities and communities of color already suffering from severe environmental pollution.36
A recent analysis found that 5.4 million Californians — 14 percent of the state’s population — live within a mile of at least one oil and gas well. 1.8 million people live in areas already heavily burdened by environmen-tal pollution, and nearly 92 percent of these residents are people of color.37 The two largest oil-producing regions in California — the San Joaquin and South Coast air basins — are notorious for having some of the worst ozone and particulate pollution in the nation that threatens the health of local residents.38
Inadequate Climate Policies
As the nation’s third-largest oil-producing state — extracting some of the most climate-polluting oil
on the planet — California cannot be a true climate change leader without addressing the dirty oil produc-tion within its borders. To date, however, Governor Brown and California policies have not only failed to
tackle our state’s oil drilling head on, but have actually encouraged production. These policies undermine our existing greenhouse gas reduction efforts, while hurt-ing our health and environment.
Because climate change is driven primarily by fossil fuel production and combustion, most of the world’s fossil fuels must stay in the ground to avoid the worst dangers of climate change.39 There are more than enough fossil fuels in already developed production fields globally to far exceed targets to limit warming to 1.5°C or even 2°C.40 Thus, new fossil fuel development and infrastructure is unsafe and unjustified, and fossil fuel production must be phased out globally within the next several decades.41 The world’s wealthiest econo-mies, like California, need to lead the way in ending fossil fuel production.
The production and consumption of fossil fuels are interdependent, as explained by economic principles of supply and demand. When oil production rises, prices tend to fall, demand for and consumption of oil tends to rise, and renewable energy is placed at a disadvantage. Global oil market economic analyses show that increasing oil production increases con-sumption, while leaving oil in the ground decreases global oil consumption.42
Unfortunately, both U.S. and California policies ag-gressively promote ever greater crude oil production. In 2005, Congress exempted fracking from the Safe
San Ardo Oil Field by Drew Bird Photography
6www.biologicaldiversity.org

Drinking Water Act in legislation known as the “Hall-iburton Loophole.” Thereafter, fracking spread rapidly and facilitated a dramatic increase in U.S. natural gas43 and crude oil production.44
Under intense pressure from the oil industry looking to offload the oil glut, Congress lifted the 40-year old crude oil export ban in December 2015. U.S. crude oil shipments have increased to one million barrels per day.45 U.S. exports of petcoke, one of the world’s dirtiest fuel sources, have also increased dramatically.46 Today the Energy Information Administration estimates that U.S. crude oil production will hit a record high 9.9 million barrels a day in 2018.47
U.S. subsidies are also spurring oil production. A recent study assessing the impact of major federal and state subsidies on oil production found that these subsidies push nearly half of new oil invest-ments into profitability, potentially increasing U.S. oil production by 17 billion barrels over the next few decades.48 This subsidy-dependent oil could make up as much as 20 percent of U.S. oil production through 2050 under a carbon budget consistent with limiting warming to 2°C.49
California policies are also extraordinarily favorable to the oil industry. California subsidizes oil and gas development in several ways, including most notably through the lack of an extraction (or “severance”) tax.50 California and Pennsylvania are the only two fossil-fuel producing states in the country that do not impose a severance tax.51 This both deprives the state
of funds needed to speed a just transition to clean energy, and makes it cheaper for oil companies to produce oil in California.52
In addition, California’s regulation of oil and gas ex-traction is in many ways the weakest in the nation.53 For example, California is one of only a handful of states that allow oil operators to dump wastewater from oil and gas production into dangerous, open, unlined pits.54
California regulators also fail to enforce the rules that are on the books. The state has violated the Safe Drink-ing Water Act for many years, including by allowing thousands of illegal and unsafe waste disposal wells to dump toxic oil waste directly into protected under-ground drinking water supplies.55 Currently, hundreds of illegal waste disposal wells continue to operate throughout the state.56
California’s inadequate oversight of oil and gas extraction encourages further production and benefits the oil industry at the expense of our air, water, and health. While California has fought climate change with one hand, with the other it has propped up the very same oil companies that use their vast profits to fight the state’s climate policies and fund climate denial.57
In short, phasing out the state’s dirty oil production will decrease oil consumption and associated green-house gas emissions, resulting in critical climate and health protections in California and beyond.
Signal Hill, Greater Los Angeles area, by Harrison Weinberg
7www.biologicaldiversity.org

At the same time, California must also greatly acceler-ate measures to reduce its oil consumption. California’s transportation sector accounts for most of its oil use and nearly 40 percent of the state’s greenhouse gas emissions.58 Currently adopted policies fall far short of meeting the state’s goal of cutting petroleum use 50 percent by 2030.59 Most notably, California has no plan to ban the sale of fossil fuel vehicles or phase out their use. The Golden State lags far behind other countries that have done so. Norway has banned the sale of petroleum vehicles starting in 2025,60 the Netherlands in 2030,61 and at least five other countries are in the process of doing so.62 Paris has announced that petro-leum vehicles will no longer be allowed to operate on city center streets in 2030.63
California should follow the lead of other countries by banning the sale of fossil fuel vehicles by 2025 and implementing a plan to rapidly phase out fossil fuel vehicle use thereafter.64 California must also greatly in-crease investment in public transportation that serves the people who need it most, reducing vehicle miles traveled and improving quality of life for its residents.
Phasing Out California’s Dirty Oil Production
Despite the state’s glaring dirty oil problem, California has no plan to
ramp down its oil production. This must change.
California cannot be a true climate leader, meet its climate goals, or
protect its people without phasing out oil production. California needs to develop a concrete and enforceable plan to end the state’s oil production within the next several decades.
Key steps to phase out the state’s dirty oil production include:
• An end to new oil development in the state through a halt to permits for new drilling, new fossil fuel infrastructure, and oil field expansion.
• A ban on fracking and related extreme tech-niques used to extract the state’s most cli-mate-polluting oil and other reserves that must stay in the ground.
• The creation of a health and safety buffer pro-hibiting oil and gas drilling in communities.
• An inventory and elimination of subsidies for oil companies which incentivize the production of oil that would otherwise stay in the ground. Because the money raised through the elimina-tion of these subsidies will decline along with fossil fuel production, these funds should be used for the just transition to clean energy.
These key steps are essential components of the just transition to 100 percent clean energy we urgently need. Without taking these steps, California cannot truly protect the climate or the state’s most vulnera-ble communities.
8
Lost Hills Oil Field by Jean Su

Supplemental InformationTable 1: Oil Production from California's 35 Dirtiest Oil Fields.
Table 2: Remaining Oil Reserves in 18 Large Oil Fields in the San Joaquin and Los Angeles Basins.
Endnotes1 U.S. Energy Information Administration, California State Profile and Energy Estimates (October 19, 2017), available at https://www.eia.gov/state/?sid=CA.
2 California oil fields produced 201.7 million barrels of oil in 2015, 205.4 million barrels in 2014, and 199.6 million bar-rels in 2013. Source: Division of Oil, Gas, and Geothermal Resources (DOGGR), 2015 Report of California Oil and Gas Production Statistics, Department of Conservation (April 2016), available at ftp://ftp.consrv.ca.gov/pub/oil/annual_re-ports/2015/PR03_2015.pdf.
3 Division of Oil, Gas, and Geothermal Resources (DOGGR), Weekly Summary, Notices Received and Permits Issued to Drill, Rework, and Abandon Wells, Issue No. 5226 (December 26, 2015). See Oil & Gas Permits Issued, Drill, Total to Date, 2015, OG, available at ftp://ftp.consrv.ca.gov/pub/oil/weekly_summary/2015/12-26-2015.pdf.
4 Kern County, Environmental Impact Report: Revisions to Kern County Zoning Ordinance – 2015(c), Volume 1 (July 2015) at 3-30, available at http://pcd.kerndsa.com/planning/environmental-documents/421-oil-gas-deir.
5 Independent Petroleum Association of America, The Story of California Crude (2017), available at http://oilindepen-dents.org/the-story-of-california-crude/.
6 Gordon, Deborah & Samuel Wojcicki, Need to Know: the Case for Oil Transparency in California, Carnegie Endowment for International Peace (March 15, 2017), available at http://carnegieendowment.org/2017/03/15/need-to-know-case-for-oil-transparency-in-california-pub-68166.
7 See reference 6.
8 The crude from California’s largest oil field, Midway-Sunset, ranked third out of 75, making it one of the world’s high-est greenhouse gas emitters, followed by South Belridge in sixth place and Wilmington in tenth place. Louisiana’s Lake Washington Field was the next closest, tied for 17th place. Source: Carnegie Endowment for International Peace, Oil-Cli-mate Index, Viewing Total Emissions, Total Estimated GHG Emissions and Production Volumes for 75 OCI Test Oils (2017), available at http://oci.carnegieendowment.org/#total-emissions. See also Profiling Emissions in the Supply Chain at http://oci.carnegieendowment.org/#supply-chain.
9 Gordon, Deborah & Samuel Wojcicki, Need to Know: the Case for Oil Transparency in California, Carnegie Endowment for International Peace (March 15, 2017), available at http://carnegieendowment.org/2017/03/15/need-to-know-case-for-oil-transparency-in-california-pub-68166.
10 We used oil field production volumes from the 2016 report on California oil and gas statistics from the Division of Oil, Gas, and Geothermal Resources (DOGGR). Source: Division of Oil, Gas, and Geothermal Resources (DOGGR), 2016 Report of California Oil and Gas Production Statistics, Department of Conservation (September 2017), available at ftp://ftp.consrv.ca.gov/pub/oil/annual_reports/2016/2016_Annual_Report_Final_Corrected.pdf.
11 In 2016 oil production from the 8 largest oil fields producing very dirty crude was 64 percent of total onshore and off-shore state oil production (119.91 million barrels out of 186.7 million barrels). Source: Division of Oil, Gas, and Geother-mal Resources (DOGGR), 2016 Report of California Oil and Gas Production Statistics, Department of Conservation (Sep-tember 2017), available at ftp://ftp.consrv.ca.gov/pub/oil/annual_reports/2016/2016_Annual_Report_Final_Corrected.pdf.
Similarly, in 2015, oil production from the 8 largest oil fields producing very dirty oil was 63 percent of total state oil production (126.6 million barrels out of 201.7 million barrels). Source: Division of Oil, Gas, and Geothermal Resources (DOGGR), 2015 Report of California Oil and Gas Production Statistics, Department of Conservation (April 2016), avail-able at ftp://ftp.consrv.ca.gov/pub/oil/annual_reports/2015/PR03_2015.pdf.

12 Bitumen produced from Canada’s tar sands must be diluted in order to flow through pipelines; the diluted bitumen prod-uct is called dilbit. Canadian tar sands synthetic crudes have lifecycle greenhouse gas emissions of 729 and 736 kg CO2 eq per barrel, while Canadian tar sands dilbits have lifecycle greenhouse gas emissions of 601 and 667 kg CO2 eq per barrel. Source: Carnegie Endowment for International Peace, Oil-Climate Index, Profiling Emissions in the Supply Chain (2017), available at http://oci.carnegieendowment.org/#supply-chain.
13 See Supplemental Table 1. Based on lifecycle emissions estimates, 35 of 154 California oil fields produce very dirty crude with lifecycle greenhouse gas emissions of 600 kg CO2 eq per barrel or more. Source: Gordon, Deborah & Sam-uel Wojcicki, Provisional OCI Results, California Oils (March 15, 2017), available at http://carnegieendowment.org/files/154_CA_Oils_Provisional_Results.pdf.
Using oil field production volumes from DOGGR annual reports, oil production from the 35 fields with very dirty crude totaled 139.7 million barrels in 2016 (75 percent of 186.7 million barrels total); 148.1 million barrels in 2015 (73 per-cent of 201.7 million barrels total); and 148.0 million barrels in 2014 (72 percent of 205.4 million barrels total). Sources: Division of Oil, Gas, and Geothermal Resources (DOGGR), 2014 Preliminary Report of California Oil and Gas Produc-tion Statistics, Department of Conservation (July 2015), available at ftp://ftp.consrv.ca.gov/pub/oil/annual_reports/2014/PR03_PreAnnual_2014.pdf; Division of Oil, Gas, and Geothermal Resources (DOGGR), 2015 Report of California Oil and Gas Production Statistics, Department of Conservation (April 2016), available at ftp://ftp.consrv.ca.gov/pub/oil/an-nual_reports/2015/PR03_2015.pdf; Division of Oil, Gas, and Geothermal Resources (DOGGR), 2016 Report of California Oil and Gas Production Statistics, Department of Conservation (September 2017), available at ftp://ftp.consrv.ca.gov/pub/oil/annual_reports/2016/2016_Annual_Report_Final_Corrected.pdf.
14 The U.S. Geological Survey provides recent estimates of remaining recoverable oil reserves in the following reports: Tennyson, Marilyn E. et al., Assessment of Remaining Recoverable Oil in Selected Major Oil Fields of the San Joa-quin Basin, California: U.S. Geological Survey Fact Sheet 2012–3050, 2 p. (2012), available at https://pubs.usgs.gov/fs/2012/3050; Gautier, Donald L. et al., Remaining Recoverable Petroleum in Ten Giant Oil Fields of the Los Angeles Basin, Southern California: U.S. Geological Survey Fact Sheet 2012–3120, v. 1.1, 2 p. (2012, revised 2013), available at https://pubs.usgs.gov/fs/2012/3120/. We excluded the Dominguez Hills oil field in the LA Basin from our analysis since lifecycle GHG emissions estimates are not available for the oil from this field.
15 See Supplemental Table 2. Crude oil reserves in 8 of 18 large fields were very dirty, with lifecycle greenhouse gas emissions of 600 kg CO2 eq per barrel or more, including the following fields: Midway-Sunset, South Belridge, Wilming-ton-Belmont, Coalinga, Huntington Beach, Kern River, Cymric-Welport, and McKittrick.
16 Division of Oil, Gas and Geothermal Resources (DOGGR), Well Search online database (2017), available at https://secure.conservation.ca.gov/WellSearch/. On September 26, 2017, data were downloaded for all active wells in the Mid-way-Sunset oil field, totaling 20,081 wells, using the DOGGR Well Search database. We searched under the “Pool Well-Types” field for the number of wells that used cyclic steam injection coded as “SC” or steam flooding coded as “SF.” We identified 13,410 wells (67 percent of total wells) classified as using cyclic steam injection and 2,089 wells (10 percent of total wells) classified as using steam flooding.
17 Division of Oil, Gas and Geothermal Resources (DOGGR), Well Search online database (2017), available at https://secure.conservation.ca.gov/WellSearch/. On September 26, 2017, data were downloaded for all active wells in the South Belridge oil field, totaling 12,944 wells, using the DOGGR Well Search database. We searched under the “Pool Well-Types” field for the number of wells that used cyclic steam injection coded as “SC,” steam flooding coded as “SF,” or waterflooding coded as “WF.” We identified 1,536 wells (12 percent of total wells) classified as using cyclic steam injec-tion; 2,142 wells (17 percent of total wells) classified as using steam flooding; and 1,618 wells (13 percent of total wells) classified as using waterflooding.
18 Division of Oil, Gas and Geothermal Resources (DOGGR), Well Stimulation Treatment Disclosure Search database (2017), available at https://secure.conservation.ca.gov/WSTDisclosure. On September 27, 2017, all data were download-ed from the state-mandated fracking disclosures database, starting in 2014. In the South Belridge oil field, 406 fracking events occurred in 2014 (62 percent of 655 total fracking events), 652 fracking events in 2015 (88 percent of 741 total events), and 137 fracking events in 2016 (93 percent of 147 total events).
19 Most of the increase in energy intensity is due to the increasing use of steam-based extraction, and to a lesser extent due

to the higher water content of oil which requires more energy for pumping and separating. Source: Brandt, Adam R, Oil Depletion and the Energy Efficiency of Oil Production: the Case of California, 3 Sustainability 1833 (2011).
20 Masnadi, Mohammad & Adam R. Brandt, Climate impacts of oil extraction increase significantly with oil field age, 7 Nature Climate Change 551 (2017).
21 Gordon, Deborah & Samuel Wojcicki, Drilling Down on Oil: The Case of California’s Complex Midway Sunset Field, Carnegie Endowment for International Peace (March 15, 2017), available at http://carnegieendowment.org/2017/03/15/drilling-down-on-oil-case-of-california-s-complex-midway-sunset-field-pub-68210.
22 Masnadi, Mohammad & Adam R. Brandt, Climate Impacts of Oil Extraction Increase Significantly With Oil Field Age, 7 Nature Climate Change 551 (2017).
23 Gordon, Deborah & Samuel Wojcicki, Need to Know: the Case for Oil Transparency in California, Carnegie Endow-ment for International Peace (March 15, 2017), available at http://carnegieendowment.org/2017/03/15/need-to-know-case-for-oil-transparency-in-california-pub-68166; Gordon, Deborah et al., Know Your Oil: Creating a Global Oil-Cli-mate Index, Carnegie Endowment for International Peace (March 11, 2015), available at http://carnegieendowment.org/2015/03/11/know-your-oil-creating-global-oil-climate-index-pub-59285.
24 Petroleum coke produces more CO2, CH4, and N2O per short ton than coal when combusted. Source: U.S. Environmen-tal Protection Agency, Emissions Factors for Greenhouse Gas Inventories, Last Modified 19 November 2015, v2 (2017), available at https://www.epa.gov/sites/production/files/2016-09/documents/emission-factors_nov_2015_v2.pdf.
25 The West Coast (PADD 5) in 2016 produced 54.3 million barrels of petroleum coke and exported 42.9 million barrels of petroleum coke. Source: U.S. Energy Information Administration, Petroleum Coke Supply and Disposition (2017), avail-able at https://www.eia.gov/dnav/pet/pet_sum_snd_a_eppc_mbbl_a_cur.htm.
26 Tao, Wang, Managing China’s Petcoke Problem, Carnegie-Tsinghua Center for Global Policy (May 31, 2015), available at http://carnegietsinghua.org/2015/05/31/managing-china-s-petcoke-problem-pub-60023.
27 McKenzie, Lisa M. et al., Human Health Risk Assessment of Air Emissions From Development of Unconventional Natural Gas Resources, 424 Science of the Total Environment 79 (2012); Shonkoff, Seth B.C. et al., Environmental Public Health Dimensions of Shale and Tight Gas Development, 122 Environmental Health Perspectives 787 (2014); Elliot, Elise G. et al., A Systematic Evaluation of Chemicals in Hydraulic-Fracturing Fluids and Wastewater for Reproductive and Developmental Toxicity, 27 Journal of Exposure Science and Environmental Epidemiology 90 (2016).
28 McKenzie, Lisa M. et al., Childhood Hematologic Cancer and Residential Proximity to Oil and Gas Development, 12 PLoS One e0170423 (2017).
29 Rasmussen, Sara G. et al., Association Between Unconventional Natural Gas Development in the Marcellus Shale and Asthma Exacerbations, 176 JAMA Internal Medicine 1334 (2016).
30 Jemielita, Thomas et al., Unconventional Gas and Oil Drilling Is Associated with Increased Hospital Utilization Rates, 10 PLoS ONE e0131093 (2015).
31 Rabinowitz, Peter M. et al., Proximity to Natural Gas Wells and Reported Health Status: Results of a Household Survey in Washington County, Pennsylvania, 123 Environmental Health Perspectives 21 (2015).
32 McKenzie, Lisa M. et al, Birth Outcomes and Maternal Residential Proximity to Natural Gas Development in Rural Colorado, 122 Environmental Health Perspectives 412 (2014).
33 Casey, Joan A. et al., Unconventional Natural Gas Development and Birth Outcomes in Pennsylvania, USA, 27 Epide-miology 163 (2016).
34 Stacy, Shaina L. et al., Perinatal Outcomes and Unconventional Natural Gas Operations in Southwest Pennsylvania. 10 PLoS ONE e0126425 (2015).
35 Srebotnjak, Tanya & Miriam Rotkin-Ellman, Drilling in California: Who’s at Risk?, Natural Resources Defense Council

(October 2014), available at https://www.nrdc.org/sites/default/files/california-fracking-risks-report.pdf; Czolowski, Eliza D. et al., Toward Consistent Methodology to Quantify Populations in Proximity to Oil and Gas Development: a National Spatial Analysis and Review, 125 Environmental Health Perspectives 086004 (2017).
36 Liberty Hill Foundation, Drilling Down: The Community Consequences of Expanded Oil Development in Los Ange-les (2015), available at https://www.libertyhill.org/sites/libertyhillfoundation/files/Drilling%20Down%20Report_1.pdf; Srebotnjak, Tanya & Miriam Rotkin-Ellman, Drilling in California: Who’s at Risk?, Natural Resources Defense Council (October 2014), available at https://www.nrdc.org/sites/default/files/california-fracking-risks-report.pdf.
37 Of the 1.8 million residents living within one mile of oil and gas development and in communities identified as most vulnerable by CalEnviroScreen 2.0, nearly 92 percent are people of color: 69 percent Hispanic/Latino, 10 percent African American, 11 percent Asian, and 2 percent Other. Source: Srebotnjak, Tanya & Miriam Rotkin-Ellman, Drilling in Califor-nia: Who’s at Risk?, Natural Resources Defense Council (October 2014), available at https://www.nrdc.org/sites/default/files/california-fracking-risks-report.pdf.
38 Brandt, Adam et al., Chapter Three: Air Quality Impacts from Well Stimulation, In California Council on Science and Technology, An Independent Assessment of Well Stimulation in California, Volume II (2015) at 237, available at http://ccst.us/publications/2015/160708-sb4-vol-II-3.pdf.
39 The Intergovernmental Panel on Climate Change estimates that global fossil fuel reserves exceed the remaining 270 GtC carbon budget (from 2012 onward) for staying below 2°C by 4 to 7 times, while fossil fuel resources exceed the carbon budget for 2°C by 31 to 50 times. Source: Bruckner, Thomas et al., 2014: Energy Systems, In Climate Change 2014: Mitigation of Climate Change. Contribution of Working Group III to the Fifth Assessment Report of the Intergov-ernmental Panel on Climate Change, Cambridge University Press, Cambridge, United Kingdom and New York, NY, USA, at Table 7.2, available at https://www.ipcc.ch/pdf/assessment-report/ar5/wg3/ipcc_wg3_ar5_chapter7.pdf. Other studies indicate that 80 percent (Carbon Tracker Initiative 2013), 76 percent (Raupach et al. 2014), and 68 percent (Oil Change International 2016) of global fossil fuel reserves must stay in the ground to limit warming to 2°C based on a 1,000 GtCO2 carbon budget from 2011 onward. Sources: Carbon Tracker Initiative, Unburnable Carbon – Are the World’s Financial Markets Carrying a Carbon Bubble? (2013), available at http://www.carbontracker.org/wp-content/uploads/2014/09/Un-burnable-Carbon-Full-rev2-1.pdf; Raupach, Michael et al., Sharing a Quota on Cumulative Carbon Emissions, 4 Nature Climate Change 873 (2014); Oil Change International, The Sky’s Limit: Why the Paris Climate Goals Require a Managed Decline of Fossil Fuel Production (September 2016), available at http://priceofoil.org/2016/09/22/the-skys-limit-report/.
40 Oil Change International, The Sky’s Limit: Why the Paris Climate Goals Require a Managed Decline of Fossil Fuel Pro-duction (September 2016), available at http://priceofoil.org/2016/09/22/the-skys-limit-report/.
41 A reasonable likelihood of limiting warming to 1.5° or 2°C requires global CO2 emissions to be phased out by mid-century and likely as early as 2040-2045. Source: Rogelj, Joeri et al., Energy System Transformations for Limiting End-of-century Warming to Below 1.5°C, 5 Nature Climate Change 519 (2015). The United States must phase out fossil fuel CO2 emissions even earlier—between 2025 and 2040—for a reasonable chance of staying below 2ºC. Source: Cli-mate Action Tracker, USA (last updated 18 September 2017), available at http://climateactiontracker.org/countries/usa.
42 Erickson, Peter & Michael Lazarus, Impact of the Keystone XL Pipeline on Global Oil Markets and Greenhouse Gas Emissions, 4 Nature Climate Change 778 (2014).
43 U.S. Energy Information Administration, Hydraulically fractured wells provide two-thirds of U.S. natural gas produc-tion (May 5, 2016), available at https://www.eia.gov/todayinenergy/detail.php?id=26112.
44 U.S. Energy Information Administration, Hydraulic fracturing accounts for about half of current U.S. crude oil produc-tion (March 15, 2016), available at https://www.eia.gov/todayinenergy/detail.php?id=25372.
45 Storrow, Benjamin, This Oil Law Was Sold As Climate Friendly, It Might Not Be, E&E News, July 27, 2017, available at https://www.eenews.net/climatewire/stories/1060057992/search?keyword=oil+exports+increase.
46 See reference 45.
47 U.S. Energy Information Administration, Short-term Energy Outlook, U.S. Liquid Fuels (October 11, 2017), available

at https://www.eia.gov/outlooks/steo/report/us_oil.cfm.
48 Erickson, Peter et al., Effect of Subsidies to Fossil Fuel Companies on United States Crude Oil Production, Nature Ener-gy doi: 10.1038/s41560-017-0009-8 (2017).
49 See reference 48.
50 Oil Change International (OCI), Dirty Energy Dominance: Dependent on Denial (October 2017) at 19 & 34, available at http://priceofoil.org/content/uploads/2017/10/OCI_US-Fossil-Fuel-Subs-2015-16_Final_Oct2017.pdf.
51 See reference 50 at 19.
52 See reference 50 at 19.
53 Zirogiannis, Nikolaos et al., State Regulation of Unconventional Oil and Gas Development in the U.S.: An Empirical Evaluation, 11 Energy Research & Social Science 142 (2016).
54 California Regional Water Quality Control Board Central Valley Region, Order R5-2017-0036 (2017), available at https://www.waterboards.ca.gov/centralvalley/board_decisions/adopted_orders/general_orders/r5-2017-0036.pdf. Table S.3 in Zirogiannis et al. (2016) indicates that only three states, including California, allow unlined pits. Source: Zirogi-annis, Nikolaos et al., State Regulation of Unconventional Oil and Gas Development in the U.S.: An Empirical Evalua-tion, 11 Energy Research & Social Science 142 (2016).
55 Horsley Witten Group, California Class II Underground Injection Control Program Review, Final Report, submitted to U.S. EPA Region IX (June 2011), available at http://www.conservation.ca.gov/dog/Documents/DOGGR%20USEPA%20consultant%27s%20report%20on%20CA%20underground%20injection%20program.pdf; Baker, David R., State Let Oil Companies Taint Drinkable Water in Central Valley, San Francisco Chronicle, January 31, 2015, available at http://www.sfchronicle.com/business/article/State-let-oil-companies-taint-drinkable-water-in-6054242.php.
56 Sommer, Lauren, California Says Oil Companies Can Keep Dumping Wastewater During State Review, KQED Science, January 17, 2017, available at https://ww2.kqed.org/science/2017/01/17/california-says-oil-companies-can-keep-dump-ing-wastewater-during-state-review/.
57 Supran, Geoffrey & Naomi Oreskes, Assessing ExxonMobil’s Climate Change Communications (1977-2014), 12 Envi-ronmental Research Letters 084019 (2017).
58 California Air Resources Board, California Greenhouse Gas Emissions Inventory for 2000-2015 – by Sector and Activi-ty (June 6, 2017), available at https://www.arb.ca.gov/cc/inventory/data/tables/ghg_inventory_sector_sum_2000-15.pdf.
59 California Air Resources Board, California’s 2030 Climate Commitments: Cutting Petroleum Use in Half by 2030, available at https://www.arb.ca.gov/newsrel/petroleum_reductions.pdf.
60 Lambert, Fred, Electric Cars Reach Record 42% of Norway’s Total New Car Sales With Boost From Tesla Model X, Electrek, July 4, 2017, available at https://electrek.co/2017/07/04/electric-car-norway-tesla-model-x/.
61 Lambert, Fred, The Dutch Government Confirms Plan to Ban New Petrol and Diesel Cars By 2030, Electrek, October 10, 2017, available at https://electrek.co/2017/10/10/netherlands-dutch-ban-petrol-diesel-cars-2030-electric-cars/.
62 Petroff, Alanna, These Countries Want to Ban Gas and Diesel Cars, CNN Money, September 11, 2017, available at http://money.cnn.com/2017/09/11/autos/countries-banning-diesel-gas-cars/index.html; Galeon, Dom, These 7 Countries Want to Say Goodbye to Fossil Fuel-Based Cars, Futurism, September 20, 2017, available at https://futurism.com/these-7-countries-want-to-say-goodbye-to-fossil-fuel-based-cars/.
63 Love, Brian, Paris Plans to Banish All Petrol and Diesel Vehicles From City Centre by 2030, Independent, October 12, 2017, available at http://www.independent.co.uk/environment/paris-petrol-diesel-car-ban-2030-gas-guzzlers-emissions-air-pollution-evs-france-a7996246.html.
64 In a 2014 roadmap outlining California’s pathway to a complete clean energy transition, experts estimated that battery

electric vehicles and hydrogen fuel cell vehicles could be the only new vehicles sold as early as 2020. Source: Jacobson, Mark et al., A Roadmap for Repowering California For All Purposes With Wind, Water, and Sunlight, 73 Energy 875 (2014), available at http://web.stanford.edu/group/efmh/jacobson/Articles/I/CaliforniaWWS.pdf. The California Air Resources Board suggested that California could be selling only electric vehicles as soon as 2030. Source: Beene, Ryan & John Lippert, California Considers Following China With Combustion-Engine Car Ban, Bloomberg, September 26, 2017, available at https://www.bloomberg.com/news/articles/2017-09-26/california-mulls-following-china-with-combustion-en-gine-car-ban.