Embed Size (px)
Citation preview

Monthly Oil Market ReportO P E C
10 December 2015
Feature article:Review of 2015, outlook for 2016
Oil market highlights
Feature article
Crude oil price movements
Commodity markets
World economy
World oil demand
World oil supply
Product markets and refi nery operations
Tanker market
Oil trade
Stock movements
Balance of supply and demand
1
3
5
11
16
35
44
69
76
80
88
96

Organization of the Petroleum Exporting Countries
Helferstorferstrasse 17, A-1010 Vienna, AustriaE-mail: [email protected]: www.opec.org
OPEC Monthly Oil Market Report 2016
P u b l i s h i n g s c h e d u l e f o r 2 0 1 6
Monday, 18 January
Wednesday, 10 February
Monday, 14 March
Wednesday, 13 April
Friday, 13 May
Monday, 13 June
Tuesday, 12 July
Wednesday, 10 August
Monday, 12 September
Wednesday, 12 October
Friday, 11 November
Wednesday, 14 December

OPEC Monthly Oil Market Report – December 2015 1
Oil market highlights Crude Oil Price Movements The OPEC Reference Basket declined by around 10% in November as lower refinery crude intake added to the oversupply in the market. The Basket lost $4.52 to stand at $40.50/b. Crude oil futures also fell, with ICE Brent averaging $45.93/b and Nymex WTI $42.92/b. The Brent-WTI spread widened marginally to $3.01/b.
World Economy World economic growth figures remain unchanged at 3.1% for the current year and 3.4% in 2016. With slightly stronger growth in the US and lower-than-expected growth in Japan in 3Q15, the OECD growth forecast remains at 2.0% for 2015 and 2.1% for 2016. The 2016 growth forecast for China remains unchanged at 6.4%, following estimated growth of 6.8% this year. India is expected to grow by 7.6% in 2016, unchanged from the previous report, while the growth estimate for the current year has been revised down to 7.3%.
World Oil Demand World oil demand is anticipated to increase by 1.53 mb/d this year, averaging around 92.88 mb/d. These projections are 30 tb/d higher than last month’s estimate, mainly as a result of better-than-expected consumption in OECD Europe and Other Asia. For 2016, global oil demand growth is expected to increase by around 1.25 mb/d, unchanged from the previous report, averaging 94.13 mb/d.
World Oil Supply Non-OPEC oil supply is estimated to grow by 1.00 mb/d in 2015 to average 57.51 mb/d. This represents an upward revision of 0.28 mb/d from the previous report, driven mainly by actual production data from the US, UK, Brazil, Russia and China. For 2016, non-OPEC oil supply is now expected to contract by 0.38 mb/d to average 57.14 mb/d, following a downward revision of 0.25 mb/d. OPEC NGLs are expected to grow by 0.17 mb/d in 2016, compared to an increase of 0.16 mb/d this year. In November, OPEC production according to secondary sources rose by 230 tb/d from the previous month to average 31.70 mb/d.
Product Markets and Refining Operations Product markets in the Atlantic Basin strengthened during November on the back of positive performance of the top of the barrel. Gasoline and naphtha were supported by strong regional demand amid export opportunities, which improved margins and offset the lack of winter support. Meanwhile, Asian margins remained healthy on the back of higher seasonal demand in the region and a stronger petrochemical sector.
Tanker Market Lower tonnage demand drove down average VLCC spot freights rates in November, while both Suezmax and Aframax freight rates increased, mainly on the back of delays in several ports. West of Suez activities provided some support to clean spot freight rates, while East of Suez rates slightly dropped. OPEC sailings increased in November by 0.26 mb/d to average 24.21 mb/d. Tanker arrivals in most regions were lower in November, except arrivals at North American ports. Stock Movements OECD commercial oil stocks fell in October to stand at 2,955 mb, but inventories were around 244 mb higher than the five-year average, with crude and products indicating a surplus of around 180 mb and 64 mb, respectively. In terms of days of forward cover, OECD commercial stocks stood at 63.5 days in October, 4.4 days higher than the five-year average.
Balance of Supply and Demand Demand for OPEC crude in 2015 is estimated to stand at 29.4 mb/d, an increase of 0.4 mb/d over last year and representing a downward revision of 0.2 mb/d compared to the previous report. In 2016, demand for OPEC crude is forecast at 30.8 mb/d, an increase of 1.5 mb/d over the current year and unchanged from the previous assessment.

2 OPEC Monthly Oil Market Report – December 2015

OPEC Monthly Oil Market Report – December 2015 3
Review of 2015, outlook for 2016 The global economy continued its moderate growth in 2015 and is now expected to expand at 3.1%. Some important economic developments marked this year’s growth. The OECD managed to accelerate its growth level again slightly. In the emerging economies, India saw stronger-than-expected growth and China’s momentum moderated, while Russia and Brazil experienced contractions. Lower oil prices provided support for consumers in the US, Euro-zone, China and India, but the shortfall in investments and the lower income from the oil sector in major oil producer countries has offset some of these positive effects (Graph 1). Monetary decisions have continued to play a key role in the global economy, not just in the OECD economies but also in China and India. An expected interest rate hike by the US Federal Reserve has affected capital flows and currencies, but the full impact will only be seen once the decision is taken. In the meantime, the increase in monetary stimulus in the Euro-zone and Japan has not been as effective in supporting these economies as planned. In contrast, China’s stimulus plans have achieved some success in supporting the country’s economy. The development of monetary policies will remain an influential factor in the coming year, including for the oil market. In 2016, the global economy is forecast to grow by 3.4%, with the growth risk slightly skewed to the downside. Graph 1: Industrial production, seasonally adjusted Graph 2: Revision to world oil demand and non-OPEC
supply growth, y-o-y
World oil demand in 2015 is estimated to grow by 1.53 mb/d, around 300 tb/d higher than the initial forecast in July 2014 (Graph 2). The upward revision has been supported by lower oil prices in the main demand centers, particularly OECD Americas and Europe. Motor fuel consumption in the US and Europe was encouraged by cheaper product prices, along with improving car sales data. Petrochemical consumption also contributed to the higher growth. In the non-OECD, oil demand growth came mainly from China, India and the Middle East. In contrast, Brazilian oil requirements slipped back into a contraction as economic momentum slowed. In 2016, world oil demand is expected to grow by 1.25 mb/d, partly supported by the improvement in global economic activities. The OECD region is anticipated to rise by 150 tb/d, led solely by the US, while Europe and Asia Pacific are seen declining. In the non-OECD region, growth is expected to be around 1.1 mb/d, with China showing slightly lower growth. Steady oil requirements are expected in Other Asia, the Middle East and Latin America. Nevertheless, the oil demand forecast for 2016 is subject to considerable uncertainties, depending on the pace of economic growth, development of oil prices, and weather conditions, as well as the impact of substitution and energy policy changes. Non-OPEC supply growth in 2015 has been revised down by 310 tb/d since the initial forecast to now stand at 1.00 mb/d. This has been mainly due to the impact of low oil prices and declining investments in the oil industry. The adjustment is also attributable to downward revisions in both the OECD and Developing Countries of 420 tb/d and 40 tb/d, respectively. Higher-than-expected growth in the UK, Malaysia, Russia, China and Colombia has been more than offset by lower-than-expected growth in Canada due to the wildfire in Alberta in 2Q15, the unexpectedly sharp decline in Mexico, and higher declines in Australia and from Caspian producers. US oil output increased by a lower-than-anticipated 810 tb/d. In 2016, non-OPEC oil supply is forecast to decline by 380 tb/d. Growth is seen coming mainly from Canada and Brazil, with declines also expected in the US, Mexico, Russia, Kazakhstan, the UK and Azerbaijan. OPEC NGLs are seen increasing by 170 tb/d in 2016, following growth of 160 tb/d in 2015. As a result of the current forecasts, the demand for OPEC crude in 2016 is expected at 30.8 mb/d, which represents an increase of 1.5 mb/d over the estimated level for 2015.
-12
-8
-4
0
4
8
Jul 1
4A
ug 1
4Se
p 14
Oct
14
Nov
14
Dec
14
Jan
15Fe
b 15
Mar
15
Apr
15
May
15
Jun
15Ju
l 15
Aug
15
Sep
15O
ct 1
5
% change y-o-y
Sources: FRB,StaCan, RSSRAR, ANFAVEA, INEGI and Haver Analytics.
MexicoUSCanadaRussia
Brazil
-0.50.00.51.01.52.0
Jul 1
4A
ug 1
4Se
p 14
Oct
14
Nov
14
Dec
14
Jan
15Fe
b 15
Mar
15
Apr
15
May
15
Jun
15Ju
l 15
Aug
15
Sep
15O
ct 1
5N
ov 1
5D
ec 1
5
mb/d
World oil demand Non-OPEC supply
2015E
2015E2016F
2016F
Note: E = estimate and F = forecast.Source: OPEC.

4 OPEC Monthly Oil Market Report – December 2015

Crude Oil Price Movements
OPEC Monthly Oil Market Report – December 2015 5
Crude Oil Price Movements The OPEC Reference Basket (ORB) declined by almost 10% in November to its lowest level in almost seven years. The ORB departed from three-month long levels of $45/b, as lower refinery crude intake amid planned and unplanned outages in October and November added to the persistent oversupply in the market. Month-on-month (m-o-m), the ORB dropped $4.52 to $40.50/b and remained lower y-o-y at $50.97/b. Crude oil futures weakened further. The decline was not only due to a supply concerns, but also to physical demand and storage glitches as well. ICE Brent ended the month down $3.36, or 6.8%, to stand at $45.93/b. Nymex WTI fell $3.37, or 7.3%, to stand at $42.92/b. Y-t-d, both contracts were lower at $49.86/b and $54.97/b, respectively. Hedge funds' bullish bets on Nymex WTI fell to a more than five-year low, while speculators bet for higher oil prices in ICE Brent, increasing net length positions. Brent’s premium over WTI rose slightly over the month amid higher inventories in Cushing, Oklahoma. The Brent-WTI spread widened to $3.01/b in November. OPEC Reference Basket The ORB plunged by almost 10% in November to its lowest monthly average in almost seven years, breaking away from the $45/b levels maintained for more than three months. A year-and-a-half long supply overhang in the market was exacerbated by lower refinery crude intake, as many refinery crude oil distillation units (CDUs) were down in October and November, either on maintenance, or suffering prolonged or unplanned outages. Total refinery outages in October and November were at 7.5 mb/d and 4.5 mb/d, respectively. On a monthly basis, the OPEC Reference Basket dropped by $4.52 to stand at $40.50/b, a m-o-m decrease on average of 10%. Compared with a year ago, the ORB value is lagging at $50.97/b versus its $99.57/b y-t-d value this time in 2014, its lowest y-t-d value since 2005. Graph 1.1: Crude oil price movement, 2015
Global oil benchmark values deteriorated by about 8% over the month, with Dated Brent, WTI and Dubai prices falling by $4.26/b, $3.59/b and $4.05/b, respectively.
30
35
40
45
50
55
60
65
30
35
40
45
50
55
60
65
01 J
un08
Jun
15 J
un22
Jun
29 J
un06
Jul
13 J
ul20
Jul
27 J
ul03
Aug
10 A
ug17
Aug
24 A
ug31
Aug
07 S
ep14
Sep
21 S
ep28
Sep
05 O
ct12
Oct
19 O
ct26
Oct
02 N
ov09
Nov
16 N
ov23
Nov
30 N
ov07
Dec
US$/bUS$/b
OPEC Basket WTI Brent Dated

Crude Oil Price Movements
6 OPEC Monthly Oil Market Report – December 2015
West African (WAF) crude oil price differentials remained under pressure as weaker refining margins in Europe weighed on demand for the substantial November-loading surplus. With more than 40 mb of Mediterranean and North Sea crudes seeking buyers, the prospects were not good for differentials. December official selling prices for Nigeria's crudes hit their lowest level in more than 10 years. Towards the end of the month, a larger-than-usual purchase from India's IOC supported West African crude oil, but a nagging backlog of cargoes kept a lid on any movement in differentials. Meanwhile, Middle East price differentials were underpinned by strong demand as refiners benefited from low oil prices and high naphtha cracks to secure cargoes. Medium grades tracked lighter grades as refiners rushed to secure cargoes amid tighter supply — as more Middle East crude flows to Europe — and low prices. Robust diesel and fuel oil cracks supported medium grades. Brent-related West and Northern African light sweet Basket components Saharan Blend, Es Sider, Girassol and Bonny Light saw their values decrease by $4.13 or 8.5% to $44.54/b in November. Middle Eastern spot component grades slipped by $3.86 to rest at $43.83/b, while multi-destination grades Arab Light, Basrah Light, Iran Heavy and Kuwait Export plunged $5.10 to stand at $39.16/b. Latin American ORB component Merey was down by $3.11 or 10.2% to stand at $30.17/b while Oriente declined by about $3.51 or 8.8% to reach $36.40/b. Table 1.1: OPEC Reference Basket and selected crudes, US$/b
On 9 December, the OPEC Reference Basket stood at $34.80/b.
ChangeOct 15 Nov 15 Nov/Oct 2014 2015
OPEC Reference Basket 45.02 40.50 -4.52 99.57 50.97Arab Light 45.37 40.64 -4.73 100.47 51.36Basrah Light 43.50 38.70 -4.80 97.70 49.34Bonny Light 49.16 44.81 -4.35 104.15 54.33Es Sider 47.56 43.30 -4.26 101.80 52.70Girassol 48.45 44.74 -3.71 102.52 54.37Iran Heavy 44.55 38.92 -5.63 99.49 50.39Kuwait Export 43.61 38.39 -5.22 98.62 49.69Marine 45.89 41.66 -4.23 99.67 52.23Merey 35.48 31.87 -3.61 90.06 42.67Murban 49.48 45.99 -3.49 102.76 55.24Oriente 39.91 36.40 -3.51 90.29 46.13Sahara Blend 49.51 45.30 -4.21 102.95 54.12Other CrudesBrent 48.56 44.30 -4.26 102.33 53.74Dubai 45.84 41.79 -4.05 99.96 52.46Isthmus 46.90 43.29 -3.61 96.67 52.40LLS 47.38 44.45 -2.93 100.13 53.66Mars 41.91 39.90 -2.01 96.11 49.49Minas 42.13 40.79 -1.34 102.13 50.63Urals 47.49 43.05 -4.44 101.34 53.29WTI 46.26 42.67 -3.59 96.26 49.80Differentials Brent/WTI 2.30 1.63 -0.67 6.07 3.94 Brent/LLS 1.18 -0.15 -1.33 2.20 0.08 Brent/Dubai 2.72 2.51 -0.21 2.38 1.28
Year-to-date
Note: Arab Light and other Saudi Arabian crudes as well as Basrah Light preliminarily based on AmericanCrude Market (ACM) and subject to revision.
Sources: Platt's, Direct Communication and Secretariat's assessments.

Crude Oil Price Movements
OPEC Monthly Oil Market Report – December 2015 7
The oil futures market Crude oil futures weakened significantly in November; this was not only due to oversupply, it was linked to physical demand and storage issues as well. Crude oil storage swelled on land to record levels. Refinery demand was low on prolonged outages. Oil markets have been dogged by oversupply, with an estimated 1.8 mb/d above demand being produced. Crude futures prices were also pressured as the dollar rallied to record highs and concerns faded that escalating tension in the Middle East could disrupt supply. A tumble in Chinese equities added pressure to an oversupplied market. The oil complex as a whole has been weakened by concerns that stockpiles of refined US oil products, such as heating oil, were also growing, with refineries ramping up output as they emerge from maintenance season amid milder-than-usual weather. The oil complex was also caught in a broader commodities sell-off. ICE Brent ended the month down $3.36 or 6.8% to stand at $45.93/b. Nymex WTI fell m-o-m by $3.37 or 7.3% to stand at $42.92/b. Compared with 2014, Nymex WTI and ICE Brent were $46.26 and $47.85 lower, reaching $49.86/b and $54.97/b, respectively. On 9 December, ICE Brent stood at $40.11/b and Nymex WTI at $37.16/b. Graph 1.2: Nymex WTI price vs. speculative activity, 2014-2015
Graph 1.3: ICE Brent price vs. speculative activity, 2014-2015
Hedge funds' bullish wagers on US crude oil have fallen to a more than five-year low. US Commodity Futures Trading Commission (CFTC) data at the end of November reflected concerns about a global supply glut. Money managers, including hedge funds and other big speculators, cut their net longs in Nymex WTI futures by 46,770 contracts compared with the end of October. That left the managed net long positions in Nymex WTI crude at 96,521 contracts, the lowest figure since September 2010. On the other hand, net length positions increased by 16,749 lots to 177,945 contracts in ICE Brent, InterContinental Exchange data showed. Meanwhile, total futures and options open interest volume in the two markets declined by 482,426 contracts to 4.80 million lots. The daily average traded volume during October for Nymex WTI contracts increased by 12,420 lots to average 807,128 contracts, while the ICE Brent daily traded volume decreased by 4,905 contracts to reach 672,935 lots. The daily aggregate traded volume in both crude oil futures markets increased by 7,515 lots to around 1.48 million futures contracts, equivalent to around 1.5 billion barrels per day. The total traded
50
100
150
200
250
300
350
30
40
50
60
70
80
90
Nov
14
Dec
14
Jan
15Fe
b 15
Mar
15
Apr 1
5M
ay 1
5Ju
n 15
Jul 1
5Au
g 15
Sep
15O
ct 1
5N
ov 1
5
US$/b
Managed money net long positions (RHS)WTI (LHS)
'000 Contracts
Source: CFTC.
050100150200250300350
30
40
50
60
70
80
90
Nov
14
Dec
14
Jan
15Fe
b 15
Mar
15
Apr
15
May
15
Jun
15Ju
l 15
Aug
15
Sep
15
Oct
15
Nov
15
US$/b
Managed money net long positions (RHS)ICE Brent (LHS)
'000 Contracts
Source: IntercontinentalExchange, Inc.

Crude Oil Price Movements
8 OPEC Monthly Oil Market Report – December 2015
volume in Nymex WTI was down to stand at 16.1 million contracts. Similarly, ICE Brent was lower, standing at 14.1 million lots. The futures market structure All three markets deepened their contango as crude oil oversupply continued in all regions, with the WTI market reaching super-contango amid concerns about available spare storage capacity. The build in US inventories, which has gone on for several consecutive weeks, continued in November, causing inventories to grow to record highs as refineries are still not fully back from maintenance and due to a rise in imports. The ninth-consecutive weekly build pushed crude stockpiles higher to 488.3 mb, within a hair of the modern-day record of 490.9 mb in April. Crude stocks at Cushing, Oklahoma, the delivery hub for US crude futures, rose by 1.8 mb to 58.7 mb. Total storage capacity for the site was at 71.4 mb as of 31 March, according to the US Energy Information Administration (EIA). The WTI further sharply widened its contango in November by almost a $1, when the M1–M3 spread increased to $2.30/b. This growing discount between front-month to forward contracts is encouraging traders to store crude in the hope of delivering at higher prices later.
Graph 1.4: Nymex WTI and ICE Brent forward curves, 2015
Amid overwhelming regional supplies, the Brent market contango widened by 25¢, with M1–M3 at $1.83/b. The North Sea front month was pressured by expectations of strong supply and the prospect of reduced flows to Asia amid closed arbitrage and new developments that could limit the flow of Forties to Asia. North Sea supply is expected to rise to a nearly two-year high in December amid a delay in maintenance at the Buzzard oilfield. South Korea will provide freight rebates for crude imports from regions other than the Middle East starting in 2016 only for shipments made under a term deal. North Sea oil was also competing with light sweet Nigerian crude, which has a big overhang of cargoes available for export. Likewise, the Middle East crude contango structure steepened further, despite healthy demand and reduced supplies of grades due to planned field maintenance and lower arbitrage flows to Asia; Brent's premium to Dubai swaps rose to over $3.10/b. The Dubai contango widened by about 35¢ for the month, when the M1 $1.90/b discount to M3 increased to around $2.25/b.
404244464850525456
404244464850525456
1FM 2FM 3FM 4FM 5FM 6FM 7FM 8FM 9FM 10FM 11FM 12FM
US$/bUS$/b
ICE Brent: 23 Oct 15 ICE Brent: 23 Nov 15Nymex WTI: 23 Oct 15 Nymex WTI: 23 Nov 15
FM = future month.

Crude Oil Price Movements
OPEC Monthly Oil Market Report – December 2015 9
Brent’s premium over WTI increased slightly over the month amid increasing inventories in Cushing, Oklahoma. Nevertheless, ample light sweet crude supplies in the Atlantic Basin continue to affect the Brent market, keeping the spread at its lowest level for the year. The Brent-WTI (transatlantic) spread inched up by about 1¢ from $3/b in October to reach $3.01/b. Table 1.2: Nymex WTI and ICE Brent forward curves, US$/b
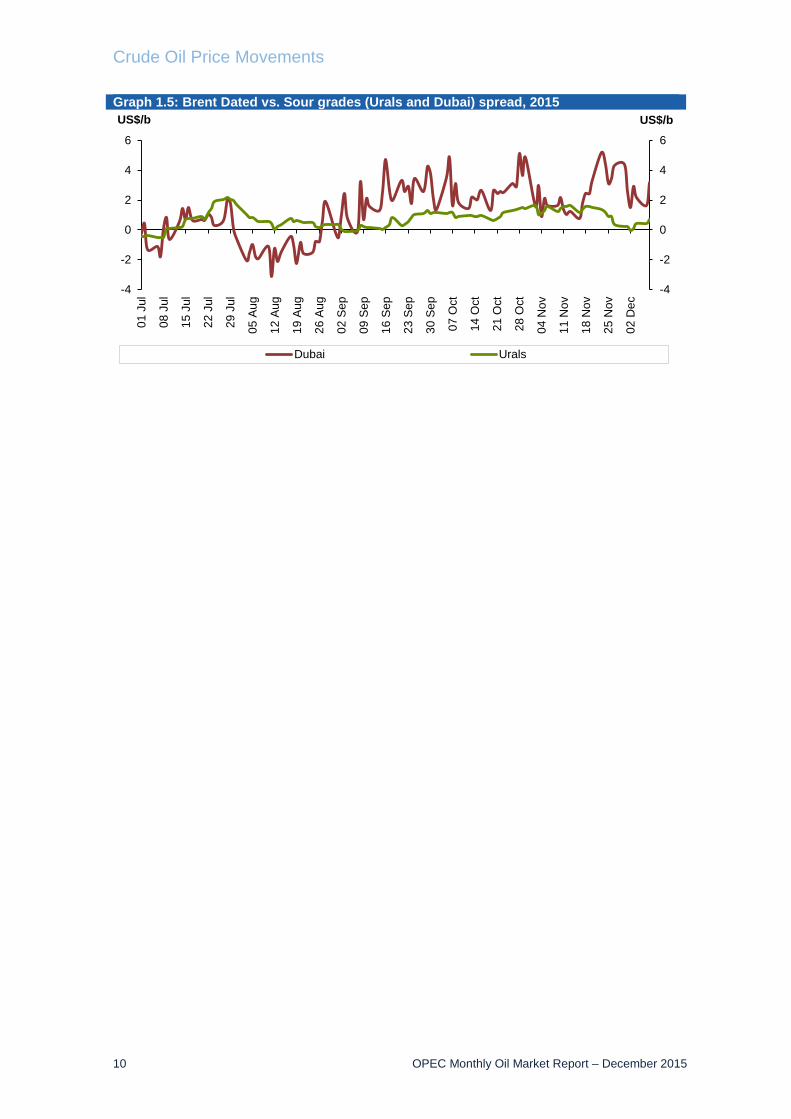
The light sweet/medium sour crude spread Sweet/sour differentials widened in Europe and Asia, but narrowed on the US Gulf Coast (USGC). In Asia, the Tapis/Dubai spread widened further as the Brent/Dubai spread continued to make local sweet crude, such as Tapis, more attractive compared with arbitrage volumes from outside the region. This has helped limit arbitrage movements of light sweet crudes from the Atlantic Basin, mainly West African crude, to the Asia Pacific region, supporting shorter-haul cargoes. In addition to a wider Brent/Dubai spread, robust refinery demand and high freight rates continued to support the Asia Pacific light sweet crude market. Meanwhile, medium sour Middle East crudes were under pressure amid ample supplies, despite healthy refining margins. The light sweet Tapis premium over medium sour Dubai increased by a hefty $1.80 to $6.75/b, levels seen at the beginning of the year. In Europe, Urals medium sour crude’s discount to Brent rose in November to its highest point since June 2014 on expectations of heavy Russian supplies that would worsen the crude glut in the region. A wide availability of alternative grades from the Middle East also helped pressure medium sour Urals values. On the other hand, limited arbitrage opportunities to Asia for light sweet oil from the North Sea supported the Brent market despite the oversupply in the region. The Med Urals discount of $1.10/b to Dated Brent in October inched up to $1.25/b in November, widening by about 15¢. On the USGC, the premium of Light Louisiana Sweet (LLS) over medium sour Mars fell heavily to $4.55/b, shrinking by 95¢. The relative strength of the sour Mars grade could have been the result of some refineries restarting units. Meanwhile, cracking margins for sour crudes have been better than for light sweet crudes over the month. On the other hand, bearish, light sweet sentiment at Cushing was also reflected in USGC light sweet grades.
Nymex WTI 1st FM 2nd FM 3rd FM 6th FM 12th FM
23 Oct 15 44.60 45.47 46.25 48.13 50.2723 Nov 15 41.75 43.15 44.29 46.37 48.70
ICE Brent1st FM 2nd FM 3rd FM 6th FM 12th FM
23 Oct 15 47.99 48.67 49.41 51.53 54.4923 Nov 15 44.83 45.55 46.20 48.65 51.89
FM = future month.
Crude Oil Price Movements
10 OPEC Monthly Oil Market Report – December 2015
Graph 1.5: Brent Dated vs. Sour grades (Urals and Dubai) spread, 2015
-4
-2
0
2
4
6
-4
-2
0
2
4
601
Jul
08 J
ul
15 J
ul
22 J
ul
29 J
ul
05 A
ug
12 A
ug
19 A
ug
26 A
ug
02 S
ep
09 S
ep
16 S
ep
23 S
ep
30 S
ep
07 O
ct
14 O
ct
21 O
ct
28 O
ct
04 N
ov
11 N
ov
18 N
ov
25 N
ov
02 D
ec
US$/bUS$/b
Dubai Urals

Commodity Markets
OPEC Monthly Oil Market Report – December 2015 11
Commodity Markets Average commodity prices declined in November, with a retreat seen in all major commodity groups. In the group of energy commodities, prices were down due to the drops in crude oil and natural gas prices. In the group of non-energy commodities, metals experienced a broad-based drop on the weakness of manufacturing activity in China while agriculture prices were also generally down. Precious metals showed their largest drop since 2013 on firmer expectations of interest rate hikes in the US. Trends in selected commodity markets Commodities were under pressure from the advancing US dollar on the increased market expectation for an interest rate hike in the US after continuing improvement in the labour market and ongoing economic expansion. This, in fact, increased medium and long-term real interest rate expectations, which triggered the largest monthly decline in precious metals since April 2013. Table 2.1: Commodity price data, 2015
Meanwhile, industrial metals experienced large declines under the pressure of weakening manufacturing prospects in China, the largest metal consumer and producer, albeit at a lower rate than the previous month, with manufacturing PMI at 48.6 versus 48.3 in that country. Readings of US manufacturing activity also pointed to contraction for the first time since November 2012, with the Institute of Supply Management Manufacturing PMI at 48.6, versus 50.1 the previous month. Aluminum showed the smallest price declines among base metals, gaining some support from the
Sep 15 Oct 15 Nov 15 Sep/Aug Oct/Sep Nov/Oct
Energy 59.6 59.7 55.2 0.3 0.0 -7.50Coal, Australia $/mt 54.7 52.3 52.5 -6.5 -4.5 0.4Crude oil, average $/bbl 46.3 47.0 43.1 1.3 1.5 -8.2Natural gas, US $/mmbtu 2.6 2.3 2.1 -4.2 -12.5 -9.3Non-energy 79.0 79.3 77.2 -1.1 0.3 -2.7Agriculture 85.9 86.9 85.8 -1.8 1.2 -1.3Food 86.2 87.7 86.1 -1.9 1.7 -1.8Soybean meal $/mt 386.0 380.0 346.0 -2.0 -1.6 -8.9Soybean oil $/mt 727.0 742.0 738.0 -0.4 2.1 -0.5Soybeans $/mt 368.0 376.0 369.0 -3.4 2.2 -1.9Grains 82.3 84.6 83.6 -1.9 2.8 -1.2Maize $/mt 165.6 171.4 166.2 1.9 3.5 -3.0Wheat, US, HRW $/mt 172.7 172.7 176.9 -4.0 0.0 2.4Sugar, world $/kg 0.3 0.3 0.3 3.1 17.3 4.3Base Metal 69.1 68.2 63.8 1.2 -1.2 -6.5Aluminum $/mt 1,589.6 1,516.5 1,468.0 2.7 -4.6 -3.2Copper $/mt 5,217.3 5,216.1 4,800.0 1.8 0.0 -8.0Iron ore, cfr spot $/dmtu 57.0 53.0 47.0 1.8 -7.0 -11.3Lead $/mt 1,684.3 1,720.1 1,618.0 -1.1 2.1 -5.9Nickel $/mt 9,937.6 10,316.8 9,244.0 -4.3 3.8 -10.4Tin $/mt 15,453.3 15,794.6 14,745.0 1.9 2.2 -6.6Zinc $/mt 1,720.2 1,724.3 1,583.0 -4.8 0.2 -8.2Precious MetalsGold $/toz 1,124.8 1,159.3 1,086.0 0.6 3.1 -6.3Silver $/toz 14.8 15.8 14.5 -1.3 7.2 -8.3
Source: World Bank, Commodity price data.
World Bank commodity price indices (2010 = 100)
UnitCommodity Monthly averages % Change

Commodity Markets
12 OPEC Monthly Oil Market Report – December 2015
announcement of output cuts by Alcoa, which could withdraw 500,000 metric tonnes from the market. Iron ore suffered steep losses on continuing weakness in steel output, which was down by 3.1% y-o-y in China and at a world level in October, according to the World Steel Association and the capacity expansions of major producing companies announced the previous month. Agricultural prices were down, mainly due to decreases in the prices of food and raw materials, while the US dollar appreciation added pressure to prices. During the month, the US Department of Agriculture increased its estimations of global ending stocks for corn – largely on higher estimations for China and the US, which, in conjunction with lower fuel cost, impacted prices. Meanwhile, it increased its forecast of soybean ending stocks in the US on record production, which weakened prices of soybeans, soy oil and soymeal. Sugar prices increased on data from the Brazil sugar industry association UNICA, showing lower output than the previous year, due to larger attractiveness of ethanol production. Energy prices retreated with drops in crude oil on persistent oversupply, while natural gas prices dropped both in Europe and the US. In the US, natural gas inventories reached record levels of 4.009 tcf during week ending 20 November, while at the same time, temperatures continue to be warmer than average due to the effect of El Niño. In Europe, spot prices were negatively affected by warmer-than-average weather, while natural gas EU-28 inventories were at 77% of capacity at the end of November versus 83% of capacity at the end of October, according to Gas Infrastructure Europe. Average energy prices declined by 7.5% on top of a 8.2% decline in crude oil. Natural gas prices declined in the US by 9.3% m-o-m, while average import prices in Europe were down by 3.6%. Agricultural prices declined by 1.3%, with drops of 1.8% and 0.8%, respectively, in the groups of food and raw materials (timber, cotton, rubber and tobacco), while prices advanced by 0.8% in beverages (cocoa, coffee and tea). Maize and soymeal decreased by 3.0% and 8.9%, respectively. Meanwhile, sugar prices continued their ascending trend, up by 4.3% on lower output in Brazil. In the group of raw materials, natural rubber declined by 6.6%. Graph 2.1: Major commodity price indices, 2013-2015
40
60
80
100
120
140
40
60
80
100
120
140
Nov
13
Dec
13
Jan
14
Feb
14
Mar
14
Apr
14
May
14
Jun
14
Jul 1
4
Aug
14
Sep
14
Oct
14
Nov
14
Dec
14
Jan
15
Feb
15
Mar
15
Apr
15
May
15
Jun
15
Jul 1
5
Aug
15
Sep
15
Oct
15
Nov
15
IndexIndex
Energy Non-energy Agriculture Food
Base metals HH natural gas Gold
Source: World Bank, Commodity price data.
Base year 2010 = 100

Commodity Markets
OPEC Monthly Oil Market Report – December 2015 13
Average base metal prices declined by 6.5%, with declines among all group components. Copper and nickel prices retreated by 8.0 and 10.5%, respectively, on lower-than-expected demand from China. Meanwhile, average iron ore prices declined by 11.3% m-o-m on continued oversupply. Precious metals had their largest monthly drop since 2013, with gold prices declining by 6.3% on average, pressured by the expectation of higher real interest rates in the US. Meanwhile, silver and platinum prices declined sharply by 8.3% and 9.4% m-o-m, respectively. Graph 2.2: Inventories at the LME
In November, the Henry Hub natural gas index decreased. The average price was down 24¢, or 10.3%, to $2.08 per million British thermal units (mmbtu) after trading at an average of $2.32/mmbtu the previous month.
The US Energy Information Administration (EIA) said utilities withdrew 53 billion cubic feet (Bcf) of gas from storage during the week ending 27 November. This was slightly higher than market expectations of an 49 Bcf decrease. Total working gas in storage stood at 3,956 Bcf, which was 16% higher than at the same time in the previous year and 7% higher than the previous five-year average. The EIA noted that temperatures during the reported week were “close to normal”.
0
1,000
2,000
3,000
4,000
5,000
0
200
400
600
800
1,000
Nov
14
Dec
14
Jan
15
Feb
15
Mar
15
Apr
15
May
15
Jun
15
Jul 1
5
Aug
15
Sep
15
Oct
15
Nov
15
'000 Tonnes'000 Tonnes
Copper Lead Nickel Tin Zinc Pr. Aluminium (RHS)
Sources: London Metal Exchange and Thomson Reuters.

Commodity Markets
14 OPEC Monthly Oil Market Report – December 2015
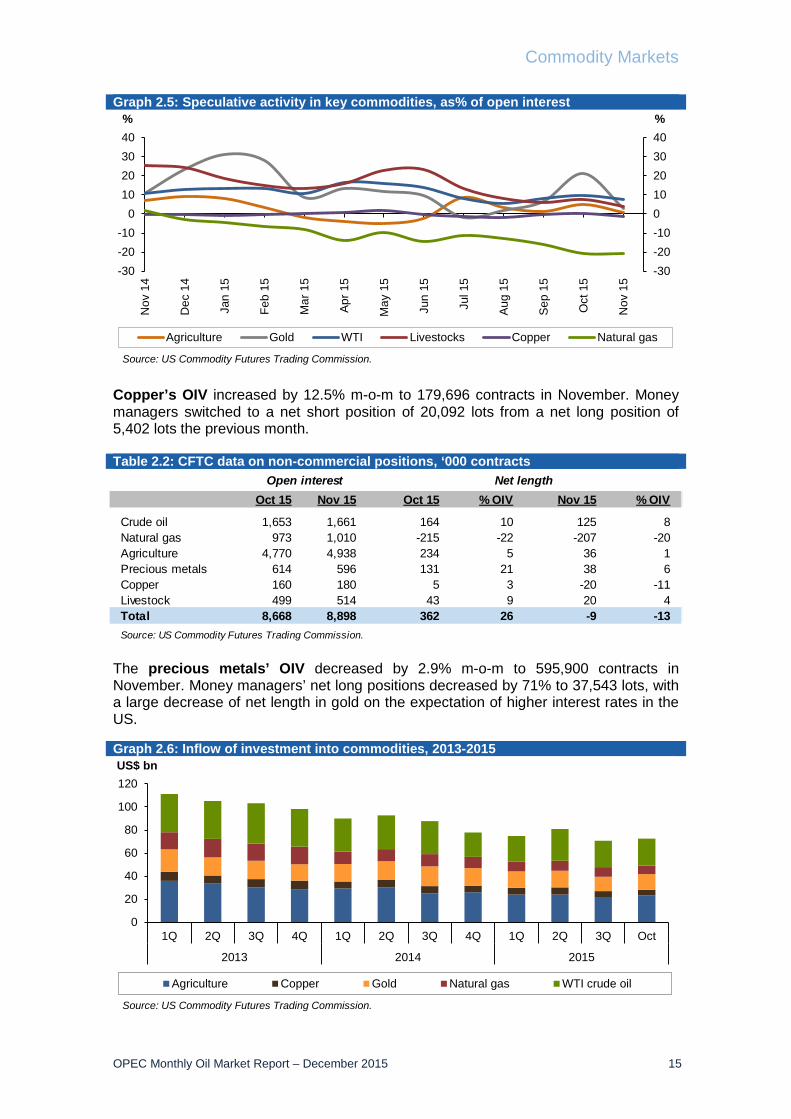
Investment flows into commodities Open interest volume (OIV) increased in November for select US commodity markets such as agriculture, crude oil, copper, natural gas and livestock, while it decreased for precious metals. Meanwhile, speculative net length positions decreased for agriculture, crude oil, copper, livestock and precious metals, while net short positions decreased for natural gas. Graph 2.3: Total open interest volume
Agriculture’s OIV increased by 3.5% m-o-m to 4,938,091 contracts in November. Meanwhile, money managers increased their net long positions by 84.6% to 35,878 lots, largely because of decreases in net length positions of corn and the soy complex. Graph 2.4: Speculative activity in key commodities, net length
Henry Hub’s natural gas OIV increased by 3.8% m-o-m to 1,009,800 contracts in November. Money managers decreased their net short positions slightly, by 3.8%, to reach 206,589 lots, but remained largely bearish on continuing expectations of warmer-than-normal winter weather.
7,000
7,500
8,000
8,500
9,000
7,000
7,500
8,000
8,500
9,000
Nov
14
Dec
14
Jan
15
Feb
15
Mar
15
Apr
15
May
15
Jun
15
Jul 1
5
Aug
15
Sep
15
Oct
15
Nov
15
'000 contracts
Source: US Commodity Futures Trading Commission.
'000 contracts
-400
-200
0
200
400
600
-400
-200
0
200
400
600
Nov
14
Dec
14
Jan
15
Feb
15
Mar
15
Apr 1
5
May
15
Jun
15
Jul 1
5
Aug
15
Sep
15
Oct
15
Nov
15
'000 contracts'000 contracts
Agriculture Gold WTI Natural gas Livestocks Copper
Source: US Commodity Futures Trading Commission.
Commodity Markets
OPEC Monthly Oil Market Report – December 2015 15
Graph 2.5: Speculative activity in key commodities, as% of open interest
Copper’s OIV increased by 12.5% m-o-m to 179,696 contracts in November. Money managers switched to a net short position of 20,092 lots from a net long position of 5,402 lots the previous month. Table 2.2: CFTC data on non-commercial positions, ‘000 contracts
The precious metals’ OIV decreased by 2.9% m-o-m to 595,900 contracts in November. Money managers’ net long positions decreased by 71% to 37,543 lots, with a large decrease of net length in gold on the expectation of higher interest rates in the US. Graph 2.6: Inflow of investment into commodities, 2013-2015
-30-20-10010203040
-30-20-10
010203040
Nov
14
Dec
14
Jan
15
Feb
15
Mar
15
Apr
15
May
15
Jun
15
Jul 1
5
Aug
15
Sep
15
Oct
15
Nov
15
%%
Agriculture Gold WTI Livestocks Copper Natural gas
Source: US Commodity Futures Trading Commission.
0
20
40
60
80
100
120
1Q 2Q 3Q 4Q 1Q 2Q 3Q 4Q 1Q 2Q 3Q Oct
2013 2014 2015
US$ bn
Agriculture Copper Gold Natural gas WTI crude oil
Source: US Commodity Futures Trading Commission.
Oct 15 Nov 15 Oct 15 % OIV Nov 15 % OIV
Crude oil 1,653 1,661 164 10 125 8Natural gas 973 1,010 -215 -22 -207 -20Agriculture 4,770 4,938 234 5 36 1Precious metals 614 596 131 21 38 6Copper 160 180 5 3 -20 -11Livestock 499 514 43 9 20 4Total 8,668 8,898 362 26 -9 -13Source: US Commodity Futures Trading Commission.
Open interest Net length

World Economy
16 OPEC Monthly Oil Market Report – December 2015
World Economy Global growth remains unchanged at 3.1% for the current year and at 3.4% for 2016. The dynamic of lower-than-anticipated growth in the 3Q in some major emerging economies, as well as Japan, point to the downside risk to the forecast. The OECD forecast remains at 2.0% for 2015 and 2.1% for the coming year. The 2015 growth forecast for both India and Brazil has been revised down by 0.1 and 0.5 percentage points (pp), respectively. While the growth forecasts for China and Russia remain unchanged, the near-term developments in both economies will need close monitoring. Beside the many ongoing country-specific economic challenges, geopolitical issues and their potential spill-over into the real economy remain a concern. Also, central bank policies will continue to constitute an influential factor, amid lower global inflation. Most importantly, a decision by the Fed to hike interest rates has also become more likely recently. Table 3.1: Economic growth rate and revision, 2015-2016, %
OECD OECD Americas US The latest upward revision in 3Q GDP growth has highlighted that the US economy continues to witness solid growth, while some forward-looking indicators point at challenges ahead, particularly in the industrial sector. In general, private household consumption is holding up well, also supported by low oil-product prices. The generally positive dynamic in the economy has again led to substantial improvements in November’s labour market numbers, which are now an important factor for the Fed to consider when it decides on key interest rates at its upcoming meeting in December. Supported by healthy domestic demand, 3Q15 GDP numbers have been revised up from a seasonally adjusted annualised rate (SAAR) of 1.5% q-o-q to a SAAR of 2.1% q-o-q. While it is substantially higher than in the first release, the magnitude of the revision and the relative big swings in quarterly growth since last year highlight that the extent of the current economic improvements remains uncertain to some degree. It is clear that improvements are underway, but it seems that structural issues are still important aspects to consider. One important issue is that the industrial sector is continuing to decelerate considerably, while the current underlying growth momentum is largely supported by the services sector. With labour market improvements now in place and expectations of a further recovery in the domestic market, it is increasingly likely that the Federal Open Market Committee (FOMC) will raise interest rates already in December – even more so as the
World OECD US Japan Euro-zone China India Brazil Russia
2015* 3.1 2.0 2.5 0.6 1.5 6.8 7.3 -2.7 -3.2
Change from previous month 0.0 0.0 0.1 0.2 0.0 0.0 -0.1 -0.5 0.0
2016* 3.4 2.1 2.5 1.2 1.5 6.4 7.6 -0.5 0.3
Change from previous month 0.0 0.0 0.0 0.0 0.0 0.0 0.0 0.0 0.0
*Forecast.

World Economy
OPEC Monthly Oil Market Report – December 2015 17
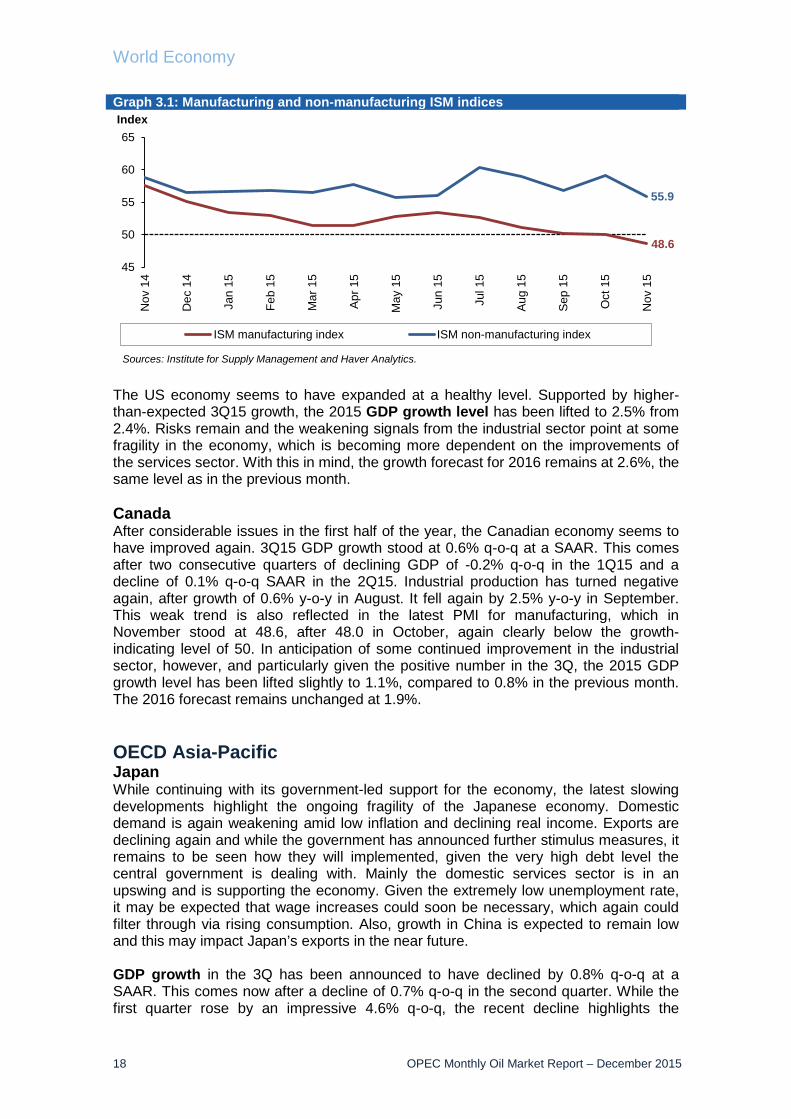
international dimension may be less sensitive now, given that China’s stock market turbulence and the surprise devaluation of the yuan may both have been overcome. India, which in 2013 had been widely affected by the taper-talks, is also doing much better. The second release of the 3Q US GDP figures provided a stronger-than-initially-estimated growth level of 2.1% q-o-q at a SAAR. While private household consumption was strong, it was mainly a decline in inventories and falling private investments, which were keeping GDP down. So, generally speaking, with solid momentum in the economy, it is expected that investments will rebound in the coming quarter and consumption will remain strong. Hence, growth in the coming quarter should again be higher and on a rebound. Personal consumption expenditures grew by 3.0% q-o-q, only slightly below the 2Q15 level of 3.6% q-o-q. Investments fell by only 0.3% q-o-q, much less than the -5.6% that were initially estimated. Also, the draw from inventories was much lower than initially estimated. While it was estimated in the advanced release to have negatively impacted GDP by 1.44 pp, it has been revised up to only 0.59 pp. However, it is important to note that in reference to the decline in investments in the energy sector, the negative dynamic has continued. Investments in mining, shafts and wells fell by 47.1% q-o-q at a SAAR in the 3Q15, after a decline of -68.0% q-o-q in the 2Q15. A major driver for the US economy is the continuously improving situation in the labour market. The unemployment rate remained at 5.0% in November for a second consecutive month, the lowest level since 2008. Non-farm payroll additions grew by a solid 211,000 in November, after increasing 298,000 in October. The share of long-term unemployed has declined again and reached the lowest level since March 2009 at 25.7%. The participation rate, however, remained at only 62.5% but 0.1 pp higher than in October. While GDP seems to be well supported by the services sector, industrial production remains weak. It rose only by 0.3% y-o-y in October, lower again than the already weak September growth level of 0.7% y-o-y. The important forward-looking lead indicator of manufacturing orders declined again by 4.7% y-o-y. However, this is a slight improvement from the weak September and October numbers, which were both declining by about 6.8% y-o-y. While the improvements in the labour market continue, consumer confidence fell again in November. The Conference Board’s Consumer Confidence Index declined to 90.4 from 99.1 in October and 102.6 in September. On the consumption side, retail trade was also slightly weaker in October, when it grew by only 1.7% y-o-y, after 2.2% y-o-y in September. Some weakening signs are also coming from the Purchasing Manager’s Index (PMI) for the manufacturing sector, as provided by the Institute of Supply Management (ISM). The ISM declined below the growth-indicating level of 50 for the first time since November 2012 and stands now at only 48.6, after reaching 50.1 in October. This is indeed an area that will need close monitoring in the near term. The services sector index performed better, but then fell back to 55.9 in November from 59.1 in October.
World Economy
18 OPEC Monthly Oil Market Report – December 2015
Graph 3.1: Manufacturing and non-manufacturing ISM indices
The US economy seems to have expanded at a healthy level. Supported by higher-than-expected 3Q15 growth, the 2015 GDP growth level has been lifted to 2.5% from 2.4%. Risks remain and the weakening signals from the industrial sector point at some fragility in the economy, which is becoming more dependent on the improvements of the services sector. With this in mind, the growth forecast for 2016 remains at 2.6%, the same level as in the previous month. Canada After considerable issues in the first half of the year, the Canadian economy seems to have improved again. 3Q15 GDP growth stood at 0.6% q-o-q at a SAAR. This comes after two consecutive quarters of declining GDP of -0.2% q-o-q in the 1Q15 and a decline of 0.1% q-o-q SAAR in the 2Q15. Industrial production has turned negative again, after growth of 0.6% y-o-y in August. It fell again by 2.5% y-o-y in September. This weak trend is also reflected in the latest PMI for manufacturing, which in November stood at 48.6, after 48.0 in October, again clearly below the growth-indicating level of 50. In anticipation of some continued improvement in the industrial sector, however, and particularly given the positive number in the 3Q, the 2015 GDP growth level has been lifted slightly to 1.1%, compared to 0.8% in the previous month. The 2016 forecast remains unchanged at 1.9%. OECD Asia-Pacific Japan While continuing with its government-led support for the economy, the latest slowing developments highlight the ongoing fragility of the Japanese economy. Domestic demand is again weakening amid low inflation and declining real income. Exports are declining again and while the government has announced further stimulus measures, it remains to be seen how they will implemented, given the very high debt level the central government is dealing with. Mainly the domestic services sector is in an upswing and is supporting the economy. Given the extremely low unemployment rate, it may be expected that wage increases could soon be necessary, which again could filter through via rising consumption. Also, growth in China is expected to remain low and this may impact Japan’s exports in the near future. GDP growth in the 3Q has been announced to have declined by 0.8% q-o-q at a SAAR. This comes now after a decline of 0.7% q-o-q in the second quarter. While the first quarter rose by an impressive 4.6% q-o-q, the recent decline highlights the
48.6
55.9
45
50
55
60
65N
ov 1
4
Dec
14
Jan
15
Feb
15
Mar
15
Apr
15
May
15
Jun
15
Jul 1
5
Aug
15
Sep
15
Oct
15
Nov
15
Index
ISM manufacturing index ISM non-manufacturing index
Sources: Institute for Supply Management and Haver Analytics.

World Economy
OPEC Monthly Oil Market Report – December 2015 19
ongoing fragility in the economy. Importantly, low inflation, still constitutes a drag on domestic consumption. Inflation stood at 0.3% y-o-y in October, after 0% y-o-y in September. While the deflationary pressures from energy, food and also from the situation in China are obvious challenges, the figures (without energy and food prices) remain low – at only 0.8% y-o-y in October, lower than the September level of 0.9% y-o-y. Amid low inflation, real income is declining further. Average monthly earnings fell by 0.5% y-o-y in October, compared to September’s level of -1.2%. This is the tenth consecutive month of decline. However, given the very tight labour market with an unemployment rate of only 3.1% in October, the lowest in 20 years, the expectation remains that this may soon turn positive. Japanese exports slowed down again significantly. They now even declined in October by 2.2% y-o-y on a non-seasonally adjusted base. This comes after an already low growth level in September of 0.6% y-o-y. Industrial production remained negative for the third consecutive month in October. It fell by -1.4% y-o-y on a non-seasonally adjusted base. Domestic demand has been weak in the past months but turned positive to a considerable level of 1.8% y-o-y in October, after a decline of 0.1% y-o-y in September. Graph 3.2: Japanese retail trade Graph 3.3: Japanese PMI indices
Positively, amid clear signals in the past months of some slow-down in the Japanese economy, the latest PMI numbers, as provided by Markit, point at a continued recovery in manufacturing activity. October’s manufacturing PMI rose to 52.6, compared to 52.4 in November. However, the important services sector momentum is slightly decelerating, according to the PMI. It retraced to 51.6 in November from 52.2 in October. Given the latest decline in the 2Q and the 3Q, the 2015 GDP growth forecast has been revised down to 0.6% from 0.8% in the previous month. While some upside from rising wages may support the economy, this remains to be seen. By anticipating some modest improvements in the coming year, the GDP growth estimate for 2016 remains unchanged at 1.2%. South Korea The economic performance in South Korea seems to have again gained traction. The GDP for the 3Q15 stood at 2.7% y-o-y, better than in the first half, when it grew by 2.3% on average, according to the latest revision by the statistical office. Industrial
1.8
-12-10
-8-6-4-20246
Oct
14
Nov
14
Dec
14
Jan
15Fe
b 15
Mar
15
Apr 1
5M
ay 1
5Ju
n 15
Jul 1
5Au
g 15
Sep
15O
ct 1
5
Sources: Ministry of Economy, Trade and Industry and Haver Analytics.
% change y-o-y
51.6
52.6
47
48
49
50
51
52
53
54
Nov
14
Dec
14
Jan
15Fe
b 15
Mar
15
Apr 1
5M
ay 1
5Ju
n 15
Jul 1
5Au
g 15
Sep
15O
ct 1
5N
ov 1
5
Index
Sources: Markit, Japan Materials Management Association and Haver Analytics.
Services PMI
Manufacturing PMI

World Economy
20 OPEC Monthly Oil Market Report – December 2015
production rose by 2.4% y-o-y in October, compared to 4.5% y-o-y in September. Exports turned slightly positive in November at 0.2% y-o-y, after a decline of 9.3% y-o-y in October. The latest PMI numbers for manufacturing are still mirroring a weak situation. The November PMI stood at the same level as in October at 49.1. All indicators of the past months were clearly below the growth-indicating level of 50. As some signs of improving domestic demand become apparent, the GDP growth forecast has been lifted for the current year to 2.5%, from 2.3% in the previous month. The GDP growth for 2016 remains unchanged at 2.7%. OECD Europe Euro-zone The situation in the Euro-zone continues improving and with the latest round of additional monetary stimulus by the European Central Bank (ECB), the development seems to be well supported. Positively, this improving economic dynamic is not only being seen in the major economies but also in the smaller peripheral countries, as well as in the recovering Italy and Spain, the third and fourth largest economies of the Euro-zone. As they are relatively broad-based, improvements have become visible domestically. Exports are also recovering, amid some weakness of the euro, particularly compared to the US dollar. Most indicators are pointing at a continuation of the current positive trend; but numerous challenges remain. These include the situation in Greece, which may remain challenging, and the soft balance sheet situation of many large banks, which will continue to keep debt-financed growth from rising quickly. Also, high unemployment, while improving, is still adding some fragility to the economic development of the Euro-zone. The positive underlying momentum so far has been reflected in the latest industrial production numbers. While they were slightly lower in October at a growth level of 1.2% y-o-y, they continued the positive trend. Moreover, retail sales performed very well, with a yearly growth rate of 2.4% in October, after 2.9% y-o-y in September. Challenges in the labour market, however, remain. The unemployment rate retraced to 10.7% in October, from 10.8% in September and August, but is still at a high level. The ECB announced an increase of its monetary stimulus. It will now extend the current programme of quantitative easing to March 2017 and, if necessary, beyond. Moreover, it has lowered the rate on deposits of banks at the ECB from -0.2% to -0.3%. A key concern of the central bank is the ongoing low inflation, which remained at 0.1% y-o-y in November, the same level as in October. Core inflation – excluding energy and food – remained relatively healthier at 0.9% y-o-y in November, slightly lower than in October, when it reached 1.0% y-o-y. Moreover, the stimulus of the ECB has been positive for credit supply. After a temporary slowdown in September, loan growth in October increased again considerably by 1.6% y-o-y, reaching the highest level since November 2011. The improvements are also reflected in the latest PMI indicators. The manufacturing PMI for November rose to a healthy 52.8 from 52.3 in October and 52.0 in September. The services PMI rose to 54.2 in November, after 54.1 in October.

World Economy
OPEC Monthly Oil Market Report – December 2015 21
Graph 3.4: Euro-zone PMI indices Graph 3.5: Euro-zone consumer price index and lending activity
While the recovery in the Euro-zone continues slowly, uncertainties remain. There might be some upside to the current forecast. However, it remains to be seen whether the ongoing positive developments will continue and the mentioned risks will not materialise. Taking all this into consideration, the forecast remains at 1.5% for both 2015 and 2016. UK Output data in the UK remains healthy. Industrial production increased by 1.1% y-o-y in September, after 1.8% y-o-y in August. Also, the headline series of retail sales increased by a strong 3.9% y-o-y in October, after an exceptional 6.1% y-o-y in September. The latest PMI numbers for the manufacturing sector remain at a high level but fell to 52.7 in November, after 55.2 in October. The services sector index increased to 55.9 in November, after an already high level of 54.9 in October. In general, GDP growth this year seems to be well supported. It is forecast – unchanged from last month – at 2.5% for both 2015 and 2016. Emerging and Developing Economies In Brazil, GDP contracted for the sixth consecutive quarter, shrinking by 4.5% in 3Q15 y-o-y. This signalled the sharpest drop ever in the economy. Increasing unemployment, coupled with rising inflation and soaring borrowing costs, and an accompanying drop in real income, together with public governance issues, have all hit the economy badly this year, particularly via the channels of lower household consumption and declining investment. GDP is forecast to contract by 2.7% in 2015 and by 0.5% in 2016. In Russia, the GDP flash estimate for 3Q15 pointed to a contraction of 4.1% y-o-y, following a decline of 4.6% and 1.9% in the previous two quarters, respectively. Inflation held somewhat steady, dropping to 15.6% y-o-y in October from 15.7% in the previous month, while the unemployment rate increased to 5.5% in October, up from 5.2% a month earlier. Russia’s GDP is expected to contract 3.2% in 2015, before posting subdued growth of 0.3% in 2016. India’s GDP growth accelerated to 7.4% y-o-y in 3Q15 from 7.0% in 2Q15 and compared to 8.4% in the same quarter last year. Improving investment demand and manufacturing activity boosted India's real GDP growth y-o-y during the July–
54.2
52.8
49
50
51
52
53
54
55N
ov 1
4D
ec 1
4Ja
n 15
Feb
15M
ar 1
5Ap
r 15
May
15
Jun
15Ju
l 15
Aug
15Se
p 15
Oct
15
Nov
15
Index
Sources: Markit and Haver Analytics.
Services PMI
Manufacturing PMI
-4.0-3.0-2.0-1.00.01.02.03.0
-1.0
0.0
1.0
2.0
3.0
4.0
Nov
10
May
11
Nov
11
May
12
Nov
12
May
13
Nov
13
May
14
Nov
14
May
15
Nov
15
CPI (LHS) MFI lending (RHS)
Sources: Statistical Office of the European Communities, European Central Bank and Haver Analytics.
% change y-o-y % change y-o-y

World Economy
22 OPEC Monthly Oil Market Report – December 2015
September quarter, the second quarter of the fiscal year 2015. This was up from 7.0% y-o-y in the first fiscal quarter. November’s PMI data pointed to tepid manufacturing growth across India, with gloomy domestic demand resulting in the weakest expansion in production in 25 months. Signs of the sector slowing have been prevalent, as the growth of both new orders and output eased in each of the past four months. In China, industrial profits dropped 2.0% y-o-y in the first 10 months of the year, compared to the 1.7% y-o-y decline in the first nine months of the year. In terms of monthly figures, total industrial profits fell 4.6% y-o-y in October, compared to a 0.1% y-o-y decline in September. The National Bureau of Statistics (NBS) highlighted that compared to the past few months, fluctuations in corporate profits have arisen due to a number of special factors, including the volatility of investment returns, foreign exchange losses and changes in corporate tax calculation due to accounting changes at some oil companies. Manufacturing output grew at a slower pace, new orders slipped into contraction and new export orders contracted at a faster pace. Input prices contracted at their fastest pace since April 2013. Table 3.2: Summary of macroeconomic performance of BRIC countries
Brazil GDP contracted for the sixth consecutive quarter in 3Q15, falling by 4.5% y-o-y, signalling the sharpest shrinkage ever in the economy. Private consumption, government expenditure and Gross Fixed Capital Formation (GFCF) all shrunk at a sharper pace, registering drops of 4.5%, 0.43% and 15.0%, respectively. Exports grew by their slowest rate this year in 3Q15 at 1.1% y-o-y. Imports on the other hand, declined 20% y-o-y in the same period. Graph 3.6: Brazilian quarterly GDP growth
-2.0-3.0
-4.5
1.93.0
0.1
-5.0-4.0-3.0-2.0-1.00.01.02.03.04.05.0
1Q 1
2
2Q 1
2
3Q 1
2
4Q 1
2
1Q 1
3
2Q 1
3
3Q 1
3
4Q 1
3
1Q 1
4
2Q 1
4
3Q 1
4
4Q 1
4
1Q 1
5
2Q 1
5
3Q 1
5
% change y-o-y
Sources: Instituto Brasileiro de Geografia e Estatística and Haver Analytics.
2015* 2016* 2015 2016 2015 2016 2015 2016 2015 2016
Brazil -2.7 -0.5 8.9 6.7 -70.1 -49.2 -9.5 -7.5 70.6 75.2Russia -3.2 0.3 15.4 8.2 65.1 71.6 -3.5 -3 13.7 16.1India 7.3 7.6 5.6 5.9 -30.5 -38.5 -4.0 -3.7 49.0 48.1China 6.8 6.4 1.6 2.3 410.9 361.0 -2.5 -2.8 16.7 18.5
*Forecast.
Sources: OPEC Secretariat, Consensus Economics, Economic Intelligence Unit, Financial Times and Oxford.
GDP growth rate
Consumer price index, % change
y-o-y
Current account balance, US$ bn
Government fiscal balance, % of GDP
Net public debt, % of GDP

World Economy
OPEC Monthly Oil Market Report – December 2015 23
The central bank of Brazil kept its benchmark interest rate unchanged in November at 14.25%, the highest level in nine years. With inflation reaching its highest level since December 2003, registering 10.3% y-o-y in October, the monetary tightening cycle that started in October 2014 has met with little success in preventing fast growth in consumer prices amid ongoing economic shrinkage. The inflation rate of 10.3% is far above the upper limit of 6.5% set by the central bank. The real exchange rate versus the dollar improved in November, appreciating by 2.7% m-o-m. The unemployment rate in October increased to 7.9% from 7.6% in the previous month. The latest reading is the highest since August 2009. Graph 3.7: Brazilian inflation vs. Interest rate
Graph 3.8: Brazilian unemployment rate
The manufacturing sector remained in recession last month with its respective PMI reaching an 80-month low of 43.8 in November compared to October’s 44.1. The survey showed production contracting at a steep rate amid a sharp drop in new business. Workforce numbers also fell at their sharpest rate since April 2009. The consumer confidence index posted its second consecutive increase in November, though still around a record-low reading. The index registered 78.7 last month, up from 78.0 in October. Graph 3.9: Brazilian manufacturing PMI Graph 3.10: Brazilian consumer confidence
index, NSA
10.97
14.25
10
11
12
13
14
15
56789
101112
Nov
14
Dec
14
Jan
15Fe
b 15
Mar
15
Apr 1
5M
ay 1
5Ju
n 15
Jul 1
5Au
g 15
Sep
15O
ct 1
5N
ov 1
5
National consumer price index (LHS)Selic rate (RHS)
Sources: Banco Central do Brasil, Instituto Brasileiro de Geografia e Estatística and Haver Analytics.
% change y-o-y % per annum
7.9
3.54.04.55.05.56.06.57.07.58.08.5
Oct
14
Nov
14
Dec
14
Jan
15Fe
b 15
Mar
15
Apr
15
May
15
Jun
15Ju
l 15
Aug
15
Sep
15
Oct
15
%
Sources: Instituto Brasileiro de Geografia e Estatística and Haver Analytics.
43.845.5
36384042444648505254
Nov
14
Dec
14
Jan
15Fe
b 15
Mar
15
Apr 1
5M
ay 1
5Ju
n 15
Jul 1
5Au
g 15
Sep
15O
ct 1
5N
ov 1
5
Index
Sources: HSBC, Markit and Haver Analytics.
Services PMI
Manufacturing PMI
78.7
70
75
80
85
90
95
100
105
Nov
14
Dec
14
Jan
15Fe
b 15
Mar
15
Apr 1
5M
ay 1
5Ju
n 15
Jul 1
5Au
g 15
Sep
15O
ct 1
5N
ov 1
5
Index
Sources: Fundação Getúlio Vargas and Haver Analytics.
World Economy
24 OPEC Monthly Oil Market Report – December 2015
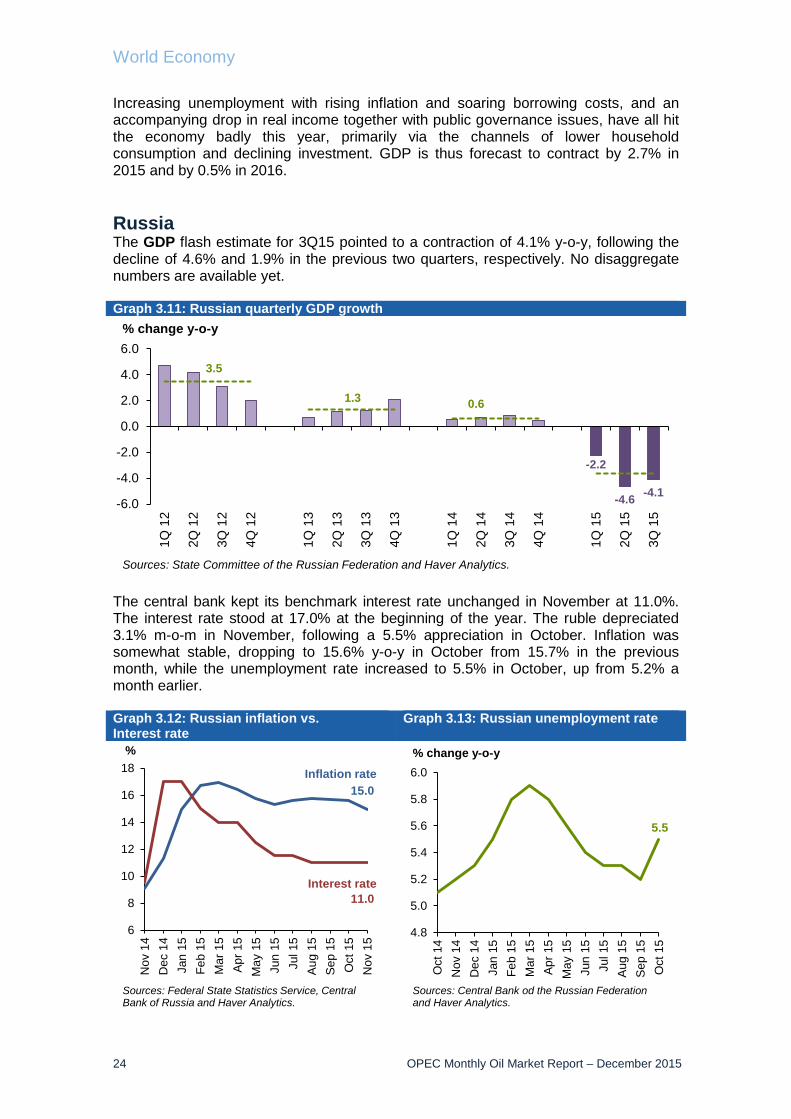
Increasing unemployment with rising inflation and soaring borrowing costs, and an accompanying drop in real income together with public governance issues, have all hit the economy badly this year, primarily via the channels of lower household consumption and declining investment. GDP is thus forecast to contract by 2.7% in 2015 and by 0.5% in 2016. Russia The GDP flash estimate for 3Q15 pointed to a contraction of 4.1% y-o-y, following the decline of 4.6% and 1.9% in the previous two quarters, respectively. No disaggregate numbers are available yet. Graph 3.11: Russian quarterly GDP growth
The central bank kept its benchmark interest rate unchanged in November at 11.0%. The interest rate stood at 17.0% at the beginning of the year. The ruble depreciated 3.1% m-o-m in November, following a 5.5% appreciation in October. Inflation was somewhat stable, dropping to 15.6% y-o-y in October from 15.7% in the previous month, while the unemployment rate increased to 5.5% in October, up from 5.2% a month earlier. Graph 3.12: Russian inflation vs. Interest rate
Graph 3.13: Russian unemployment rate
-2.2
-4.6 -4.1
3.5
1.3 0.6
-6.0
-4.0
-2.0
0.0
2.0
4.0
6.0
1Q 1
2
2Q 1
2
3Q 1
2
4Q 1
2
1Q 1
3
2Q 1
3
3Q 1
3
4Q 1
3
1Q 1
4
2Q 1
4
3Q 1
4
4Q 1
4
1Q 1
5
2Q 1
5
3Q 1
5
% change y-o-y
Sources: State Committee of the Russian Federation and Haver Analytics.
15.0
11.0
6
8
10
12
14
16
18
Nov
14
Dec
14
Jan
15Fe
b 15
Mar
15
Apr 1
5M
ay 1
5Ju
n 15
Jul 1
5Au
g 15
Sep
15O
ct 1
5N
ov 1
5
%
Sources: Federal State Statistics Service, Central Bank of Russia and Haver Analytics.
Inflation rate
Interest rate
5.5
4.8
5.0
5.2
5.4
5.6
5.8
6.0
Oct
14
Nov
14
Dec
14
Jan
15Fe
b 15
Mar
15
Apr 1
5M
ay 1
5Ju
n 15
Jul 1
5Au
g 15
Sep
15O
ct 1
5
Sources: Central Bank od the Russian Federation and Haver Analytics.
% change y-o-y

World Economy
OPEC Monthly Oil Market Report – December 2015 25
Operating conditions in the manufacturing sector were little changed in November with the manufacturing PMI posting 50.1, marginally down from October’s 50.2. The survey revealed that incoming new business rose in November by the highest rate in a year. This improvement was due to the increase in orders from the domestic market, while new export orders declined by their sharpest pace in seven months. Production also increased at its fastest pace in one year with some firms linking this increase to higher activity in the agricultural sector. Employment, however, increased in November for the 29th month in a row on the back of falling backlogs. In line with the manufacturing PMI readings, industrial production in October 2015 was 3.6% lower compared with 2014, while retail sales also declined for the tenth month in a row, dropping 11.7% y-o-y in October from 10.4% a month earlier. Graph 3.14: Russian industrial production Graph 3.15: Russian retail sales
Russia’s GDP is expected to contract 3.2% in 2015 before posting a subdued rate of growth of 0.3% in 2016. India India’s GDP growth accelerated to 7.4% y-o-y in 3Q15 from 7.0% in 2Q15 and compared to 8.4% in the same quarter last year. Improving investment demand and manufacturing activity boosted India's real GDP growth y-o-y during the second quarter of fiscal year 2015, July–September, up from 7.0% y-o-y in the first fiscal quarter. The new GDP figures accordingly prompted the Reserve Bank of India (RBI) to keep its monetary policy unchanged. On the negative side, weakness in external demand and weak rural growth will likely further limit the recovery this year. Fixed investment, albeit set to benefit from public spending, may also face a crunch given that private investment continues to struggle. On the demand side, both exports and imports showed yet another quarter of contraction, in both nominal and real terms. Real exports have remained negative for five consecutive quarters, suggesting that the current episode of weakness in exports is more severe than during the global financial crisis of 2008–09. Its geographic spread is also much wider, with weak demand registered across nearly all of India's export markets, including Northeast and Southeast Asia, South Asia and the Middle East, in addition to the US and EU markets. India’s monthly trade deficit narrowed further in October to $9.8 billion from $10.5 billion in September, which was below expectations.
-3.6-6
-4
-2
0
2
4
6
Oct
14
Nov
14
Dec
14
Jan
15Fe
b 15
Mar
15
Apr 1
5M
ay 1
5Ju
n 15
Jul 1
5Au
g 15
Sep
15O
ct 1
5
% change y-o-y
Sources: Federal State Statistics Service and Haver Analytics.
-11.7-14-12-10
-8-6-4-20246
Oct
14
Nov
14
Dec
14
Jan
15Fe
b 15
Mar
15
Apr 1
5M
ay 1
5Ju
n 15
Jul 1
5Au
g 15
Sep
15O
ct 1
5
% change y-o-y
Sources: Federal State Statistics Service and Haver Analytics.

World Economy
26 OPEC Monthly Oil Market Report – December 2015
On the supply side, performance has improved, compared with the previous quarter. The most positive development was the strong performance of the manufacturing sector, which showed the highest quarterly growth in three years. This is consistent with the monthly manufacturing output data for the July–September quarter but does not represent the most recent trends, which seem to point to another loss of momentum. Recent GDP figures are unlikely to change the central bank's strategy. With growth remaining in line with the RBI's forecast, and with inflation also following the RBI's projected path, the central bank left its monetary policy unchanged during its most recent meeting. Notably, in its policy statement, the RBI mentioned that less than half of the cumulative policy repo rate reduction of 125 basis points in 2015 has been transmitted by banks and that even though space for further policy easing remains, it would instead work on addressing the transmission mechanisms for banks before further cutting rates. Graph 3.16: Indian GDP growth, SAAR Graph 3.17: Indian inflation vs. Repo rate
The wholesale price index (WPI) in India registered its first sequential increase in five months in October, rising 0.6% m-o-m on a seasonally adjusted basis. This was underpinned by firmer food and oil prices. As anticipated, unfavourable base effects drove India's retail inflation further towards the central bank's January 2016 target of 6%. The largest increase was observed in food prices, with food inflation accelerating by a full percentage point in y-o-y to 5.3%. Fuel and transportation components, all strongly driven by oil prices, also proved more resilient in October, with transport deflation narrowing to 0.4% y-o-y, and with fuel and light inflation remaining unchanged at 5.3% y-o-y. On a m-o-m basis, CPI remained stable, particularly given typically stronger pressures on retail prices during the Indian autumnal holiday season. Even at a four-month high, India's CPI inflation is nearly half the average rate observed in the past five years. Also, it seems the October increase in inflation and the November excise-duty increase have both reaffirmed expectations that the RBI may now refrain from further actions for some time.
7.57.0
7.4
5.3
6.47.1
0123456789
1Q 1
22Q
12
3Q 1
24Q
12
1Q 1
32Q
13
3Q 1
34Q
13
1Q 1
42Q
14
3Q 1
44Q
14
1Q 1
52Q
15
3Q 1
5
Sources: National Informatics Centre (NIC) and Haver Analytics.
% change y-o-y
-10
-5
0
5
10
Nov
14
Dec
14
Jan
15Fe
b 15
Mar
15
Apr 1
5M
ay 1
5Ju
n 15
Jul 1
5Au
g 15
Sep
15O
ct 1
5N
ov 1
5
%
Repo rateConsumer price index (CPI)CPI lower target bondCPI higher target bondWholesale price index (WPI)WPI confort zone
Sources: Ministry of Commerce and Industry, Reserve Bank of India and Haver Analytics.

World Economy
OPEC Monthly Oil Market Report – December 2015 27
Graph 3.18: Indian GDP growth by demand side
Import weakness (excluding gold) rather than a pick-up in exports led the narrowing trade balance. However, exports were not as weak as the 17.5% y-o-y contraction in October would suggest. As indicated before, much of the drop in export values is a result of lower oil and commodity prices. Gold imports were valued at $2 billion in October, even lower than what the market expected. Imports (excluding oil and gold) declined 0.9% m-o-m on a seasonally adjusted basis, after a steep 4.4% increase in September. More generally, however, imports (excluding oil and gold) have been firming over the last few months, consistent with a cyclical recovery in consumption on the back of India’s sharp oil price driven terms-of-trade increase. Graph 3.19: Indian GDP growth by supply side
Industrial production growth averaged 4.7% y-o-y in 3Q15 compared with 3.1% y-o-y in 2Q15. Within this, manufacturing output growth accelerated to 4.5% y-o-y from 3.6% in 2Q15, while mining sector growth picked up to 2.9% from 0.2%. It seems service sector output reflects the strength in both financial and trade-related services. Aggregate real deposits and credit growth registered 14.8% y-o-y in 3Q15 accelerating from 12% in 2Q15. These should support a pick-up in financial services activity. A key positive message from the GDP data is that it indicates improving momentum in fixed investment, accompanied by sustained manufacturing growth. However, muted private consumption growth and persistent weakness in exports have kept overall aggregate demand below its potential, while risks to any further recovery remain.
-15
-10
-5
0
5
10
15
20
25
30
1Q 14 2Q 14 3Q 14 4Q 14 1Q 15 2Q 15 3Q 15
% change y-o-y
Imports
Exports
Fixed investment
Public consumption
Private consumption
Sources: Central Statistics Office and Haver Analytics.
-5
0
5
10
15
20
25
1Q 14 2Q 14 3Q 14 4Q 14 1Q 15 2Q 15 3Q 15
% change y-o-yAgriculture
Construction
Mining
Social and personal services
Manufacturing
Gas and water supply
Insurance, real estate andbusiness servicesTransport and communication
Sources: Central Statistics Office and Haver Analytics.

World Economy
28 OPEC Monthly Oil Market Report – December 2015
November’s PMI data points to tepid manufacturing growth across India, with gloomy domestic demand resulting in the weakest expansion in production in 25 months. Signs of the sector slowing have been building up, as growth in both new orders and output have eased in each of the past four months. This disappointing news was accompanied by a stagnant labour market in the sector. More precisely, the intermediate goods sub-sector has driven the deceleration in growth. In addition, new business inflows and output in this category fell for the first time since December 2013. While investment in producer goods saw a rebound in November, the consumer goods sector continued to be a bright spot. Weak inflationary pressures together with a slowdown in growth support further repo rate cuts. Falling for the fourth consecutive survey period to a 25-month low of 50.3 in November, compared with an October reading of 50.7, the seasonally adjusted PMI highlighted a marginal improvement in business conditions across the sector. Sub-sector data highlighted consumer goods as the best performing category, while operating conditions at intermediate goods companies deteriorated for the first time since December 2013. Graph 3.20: Indian PMIs Graph 3.21: Indian industrial production
breakdown
The GDP growth expectation for 2015 was adjusted from 7.4% to 7.3% and kept unchanged at 7.6% for 2016. China In China, industrial profits dropped 2.0% y-o-y in the first 10 months of the year, compared to the 1.7% y-o-y decline in the first nine months of the year. For the monthly figures, total industrial profits fell 4.6% y-o-y in October compared to the 0.1% y-o-y decline in September. The NBS highlighted that compared to the past few months, fluctuations in corporate profits have arisen from a number of special factors. These include the volatility of investment returns (related to equity market turbulence), foreign exchange losses (related to currency fluctuations) and changes in corporate tax calculations (due to accounting changes at some oil companies). There is no indication of a reversal in changes within the industry during October or November, and thus an outsized share of growth coming from services is likely to continue through year-end. One risk factor not covered in the sequential sentiments survey is that brokerages' y-o-y comparisons will worsen considerably for the next six months.
50.250.1
50.3
46
48
50
52
54
56
Nov
14
Dec
14
Jan
15Fe
b 15
Mar
15
Apr
15
May
15
Jun
15Ju
l 15
Aug
15
Sep
15
Oct
15
Nov
15
Index
CompositeServices business activityManufacturing
Sources: HSBC, Markit and Haver Analytics.
-15-10
-505
1015
Sep
14O
ct 1
4N
ov 1
4D
ec 1
4Ja
n 15
Feb
15M
ar 1
5Ap
r 15
May
15
Jun
15Ju
l 15
Aug
15Se
p 15
Total IP Manufacturing IPFood products IP
Sources: Central Statistical Organisation of India and Haver Analytics.
% change y-o-y

World Economy
OPEC Monthly Oil Market Report – December 2015 29
According to NBS data, housing market activity remained on the strong side in October. Home sales increased 5.9% y-o-y, slipping from 8.8% growth in September. In terms of value, home sales rose 16.1% y-o-y, after reaching 15.7% in September. Moreover, land sale revenue came in at 260.6 billion yuan, declining 3.1% y-o-y, down from 283.8 billion yuan and 3.5% y-o-y growth in September. In spite of the strong housing market, real estate investments fell for the third consecutive month in October, declining 2.8% y-o-y. New home starts fell 24.4% y-o-y, after 16.7% growth in September, although the drop was largely due to the base effect from 38.6% y-o-y starts growth in October 2014. Graph 3.22: Chinese GDP growth rate, SAAR
Graph 3.23: Contributions to Chinese GDP growth
Lingering weakness in industrial corporate performance reflects the current difficulties facing the overall Chinese economy. Slowing corporate sales revenue, slowing nominal GDP and manufacturing growth, elevated corporate debt – and, hence, financing costs – ongoing restructuring pressure in manufacturing sectors showing overcapacity and related PPI deflation pressure continue to restrain corporate profits – and, hence, the ability and willingness of corporations to invest. While manufacturing investment growth picked up somewhat to 8.3% y-o-y in October from 4.6% in September, manufacturing investment growth very likely will remain sluggish and in the single digits in 2016.
7.07.0 6.9
7.7 7.7
7.3
6.26.46.66.87.07.27.47.67.88.08.2
1Q 1
22Q
12
3Q 1
24Q
12
1Q 1
32Q
13
3Q 1
34Q
13
1Q 1
42Q
14
3Q 1
44Q
14
1Q 1
52Q
15
3Q 1
5
Sources: China's National Bureau of Statistics and Haver Analytics.
% change y-o-y
4.0
3.0
-0.1-202468
10
3Q 1
3
4Q 1
3
1Q 1
4
2Q 1
4
3Q 1
4
4Q 1
4
1Q 1
5
2Q 1
5
3Q 1
5
Net exports of goods and servicesGross capital formationFinal consumption expenditure
Sources: China National Bureau of Statistics andHaver Analytics.
% change y-o-y

World Economy
30 OPEC Monthly Oil Market Report – December 2015
Graph 3.24: Chinese consumer price index (CPI) vs. producer price index (PPI)
Graph 3.25: Chinese trade balance
The IMF published a press release confirming that the Chinese yuan will be included in the special drawing rights (SDR) basket starting on 1 October 2016. The weighting of the Chinese yuan in the basket will be 10.92%, higher than the weights for the Japanese yen or the British pound, according to an initial fact sheet published by the IMF. Currently, there are about $282.5 billion SDR-allocated, indicating that the Chinese yuan's 10.92% weight amounts to the equivalent of about $30.8 billion in additional demand for the Chinese yuan as a direct outcome. This is a rather trivial figure compared with annual trade and investment flows for China. Nevertheless, inclusion in the SDR should be viewed as an important milestone in China's financial sector reform and Chinese yuan internationalisation, rather than a predictor of its imminent rise. Graph 3.26: Chinese PMIs Graph 3.27: Chinese industrial production
China's official PMI contracted at a faster pace in November. Manufacturing output grew at a slower pace, new orders slipped into contraction and new export orders contracted at a faster pace. Input prices contracted at their fastest pace since April 2013. Official non-manufacturing PMI expanded at a faster rate, although orders expanded at a slower rate and new export orders continued to contract. Chinese
-10-505
1015
Nov
13
Jan
14M
ar 1
4M
ay 1
4Ju
l 14
Sep
14N
ov 1
4Ja
n 15
Mar
15
May
15
Jul 1
5Se
p 15
Nov
15
CPIPPIOfficial interest rateAverage house price in 100 cities
Sources: China Index Academy, China National Bureau of Statistics, Soufan and Haver Analytics.
% change y-o-y197
-143
54
-200-150-100
-500
50100150200250
Nov
14
Dec
14
Jan
15Fe
b 15
Mar
15
Apr 1
5M
ay 1
5Ju
n 15
Jul 1
5Au
g 15
Sep
15O
ct 1
5N
ov 1
5
US$ bn
Exports Imports Trade balance
Sources: China Customs and Haver Analytics.
50.5
48.6
46
47
48
49
50
51
52
53
Nov
14
Dec
14
Jan
15Fe
b 15
Mar
15
Apr 1
5M
ay 1
5Ju
n 15
Jul 1
5Au
g 15
Sep
15O
ct 1
5N
ov 1
5
Index
Sources: HSBC, Markit and Haver Analytics.
Composite PMI
Manufacturing PMI 5.6
5.0
5.5
6.0
6.5
7.0
7.5
8.0
8.5
Oct
14
Nov
14
Dec
14
Jan
15Fe
b 15
Mar
15
Apr 1
5M
ay 1
5Ju
n 15
Jul 1
5Au
g 15
Sep
15O
ct 1
5% change y-o-y
Sources: China National Bureau of Statistics and Haver Analytics.

World Economy
OPEC Monthly Oil Market Report – December 2015 31
manufacturing firms signalled that output stabilised in November, thereby ending a six-month sequence of reduction. Meanwhile, total new work continued to decline and at a similarly modest rate to that seen in October, despite a pick-up in new export business growth. Relatively soft overall client demand led firms to scale back their purchasing activity again in November, while inventories also declined. Deflationary pressures intensified over the month, as highlighted by sharper decreases in both input costs and output prices. The PMI for November continued to show signs of recovery, reaching 48.6, compared to October's 48.3. This indicates that pressure on economic growth has eased and fiscal policy has had a strong effect. Overall, the economy is still on track to become more stable. The Chinese GDP growth expectation remains unchanged at 6.8% this year and 6.4% for 2016. OPEC Member Countries The non-oil producing private sector in Saudi Arabia witnessed an improvement in growth last month with the PMI increasing to 56.3 in November, up from 55.7 in October. This was largely supported by a sharp rise in new business, which reached a three-month high due to a notable increase in export orders. This, in turn, contributed to a quick increase in output. As a reflection of robust overall business conditions, employment increased in November for the 20th month in a row. In the United Arab Emirates, growth in the non-oil private sector gained more strength last month. The PMI increased from 54.0 in October to 54.5 in November on quicker growth in economic activities and given the solid rate of expansion in new business. Graph 3.28: Saudi Arabia and UAE: PMIs
Other Asia In Indonesia, the central bank kept its benchmark interest rate on hold at 7.5% in November and decreased the reserve requirement by 50 bp to 7.5% effective from the beginning of December. The manufacturing sector decelerated further in November, with its respective PMI falling to a seven-month low reading of 46.9 from October’s 47.8.
56.3
54.5
52
54
56
58
60
62
Nov
13
Dec
13
Jan
14
Feb
14
Mar
14
Apr
14
May
14
Jun
14
Jul 1
4
Aug
14
Sep
14
Oct
14
Nov
14
Dec
14
Jan
15
Feb
15
Mar
15
Apr
15
May
15
Jun
15
Jul 1
5
Aug
15
Sep
15
Oct
15
Nov
15
Index
Saudi Arabia UAE
Sources: SAAB, HSBC, Markit and Haver Analytics.
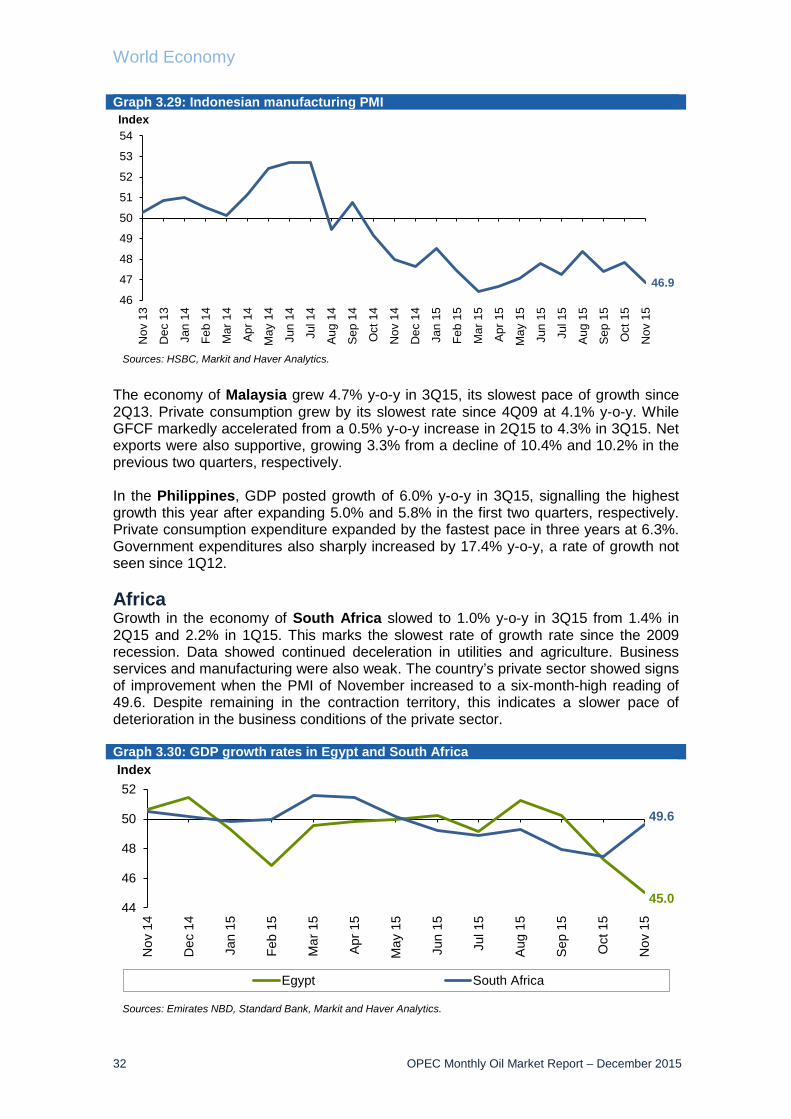
World Economy
32 OPEC Monthly Oil Market Report – December 2015
Graph 3.29: Indonesian manufacturing PMI
The economy of Malaysia grew 4.7% y-o-y in 3Q15, its slowest pace of growth since 2Q13. Private consumption grew by its slowest rate since 4Q09 at 4.1% y-o-y. While GFCF markedly accelerated from a 0.5% y-o-y increase in 2Q15 to 4.3% in 3Q15. Net exports were also supportive, growing 3.3% from a decline of 10.4% and 10.2% in the previous two quarters, respectively. In the Philippines, GDP posted growth of 6.0% y-o-y in 3Q15, signalling the highest growth this year after expanding 5.0% and 5.8% in the first two quarters, respectively. Private consumption expenditure expanded by the fastest pace in three years at 6.3%. Government expenditures also sharply increased by 17.4% y-o-y, a rate of growth not seen since 1Q12. Africa Growth in the economy of South Africa slowed to 1.0% y-o-y in 3Q15 from 1.4% in 2Q15 and 2.2% in 1Q15. This marks the slowest rate of growth rate since the 2009 recession. Data showed continued deceleration in utilities and agriculture. Business services and manufacturing were also weak. The country’s private sector showed signs of improvement when the PMI of November increased to a six-month-high reading of 49.6. Despite remaining in the contraction territory, this indicates a slower pace of deterioration in the business conditions of the private sector. Graph 3.30: GDP growth rates in Egypt and South Africa
46.946
47
48
49
50
51
52
53
54N
ov 1
3
Dec
13
Jan
14
Feb
14
Mar
14
Apr
14
May
14
Jun
14
Jul 1
4
Aug
14
Sep
14
Oct
14
Nov
14
Dec
14
Jan
15
Feb
15
Mar
15
Apr
15
May
15
Jun
15
Jul 1
5
Aug
15
Sep
15
Oct
15
Nov
15
Index
Sources: HSBC, Markit and Haver Analytics.
45.0
49.6
44
46
48
50
52
Nov
14
Dec
14
Jan
15
Feb
15
Mar
15
Apr
15
May
15
Jun
15
Jul 1
5
Aug
15
Sep
15
Oct
15
Nov
15
Index
Egypt South Africa
Sources: Emirates NBD, Standard Bank, Markit and Haver Analytics.

World Economy
OPEC Monthly Oil Market Report – December 2015 33
In Egypt, the contraction in the country’s non-oil private sector deepened in November as suggested by the PMI, which fell to 45.0, its lowest reading in 26 months, from 47.2 in October. It has been reported that output and new orders sharply declined, which were accompanied with a record fall in employment. Latin America The economy of Argentina posted markedly higher growth in the first half of this year, with GDP growing 2.1% and 2.3% in the first two quarters, respectively, whereas growth stood at only 0.5% y-o-y for the whole of 2014. This improvement was on the back of a return to growth in private consumption expenditure after a year of contraction in 2014. Private consumption grew 0.8% y-o-y in the first half 2015. Government expenditures jumped by 10.3% y-o-y in 2Q15, while GFCF was also back to growth this year. Transition region In November, the manufacturing sector in the Czech Republic reversed its recent deceleration, with the manufacturing PMI posting its first increase since July. The index registered 54.2 last month, slightly up from 54.0 in October, indicating strong overall growth. The survey showed a solid rise in production and employment, while new orders grew by a slower pace. It also revealed a decrease in the sector’s input prices for the third month in a row. In Poland, the manufacturing PMI continued posting a robust reading in November at 51.1, from 52.2 in October. This signalled an ongoing improvement in the sector’s business conditions. The survey showed that production and new orders had increased last month by the fastest rate in four months. Another boost to the index came from the job creation segment where employment increased a record 28 months in a row. Oil prices, US dollar and inflation The US dollar continued rising against all major currency counterparts on average, in November. It was particularly strong against the euro, which fell by 4.3% m-o-m versus the US dollar. The Swiss franc also declined considerably in November. It declined by 3.9% m-o-m versus the US dollar. Compared to the Japanese yen, the US dollar gained 2.1% m-o-m and rose by 0.8% m-o-m versus the pound sterling. Compared to the euro it reached €1.0749/$ on average in November. Principal support for the US dollar came from expectations of near-term monetary tightening in the US. In addition, there was a low inflation/deflation scenario in both the Euro-zone and Japan, with ongoing and unprecedented monetary stimulus programmes in both, as well as in China. Overall, the US dollar was well supported and is forecast to remain strong, at least in the short-term. After its notable decline in August and September, the Chinese yuan in October rose by 0.3% compared to the US dollar on a monthly average, while its latest development in November again showed some weakening. It declined by 0.2% m-o-m on average in November. After a multi-month decline, the Brazilian real continued its slight appreciation for the second consecutive month in November. It rose by 2.3% m-o-m versus the US dollar. After some recovery in October, the Russian ruble continued to decline in November, when it again fell by 3.1% against the US dollar.

World Economy
34 OPEC Monthly Oil Market Report – December 2015
In nominal terms, the price of the OPEC Reference Basket (ORB) fell by a monthly average of $4.52, or 10%, from $45.02/b in September to $40.50/b in November. In real terms, after accounting for inflation and currency fluctuations, the ORB declined by 7.7%, or $2.35, to $28.01/b from $30.36/b (base June 2001=100). Over the same period, the US dollar gained 2.6% against the import-weighted modified Geneva I + US dollar basket*, while inflation remained flat. Graph 3.31: Impact of inflation and currency fluctuations on the spot OPEC Reference Basket price*
* The ‘modified Geneva I+US$ basket’ includes the euro, the Japanese yen, the US dollar, the pound sterling and the Swiss franc, weighted according to the merchandise imports of OPEC Member Countries from the countries in the basket.
020406080
100120140
Jan
12
Mar
12
May
12
Jul 1
2
Sep
12
Nov
12
Jan
13
Mar
13
May
13
Jul 1
3
Sep
13
Nov
13
Jan
14
Mar
14
May
14
Jul 1
4
Sep
14
Nov
14
Jan
15
Mar
15
May
15
Jul 1
5
Sep
15
Nov
15
US$/b
Nominal Reference Basket price Real Reference Basket price
Source: OPEC Secretariat.
Base: June 2001 = 100$40.50/b
$28.01/b

World Oil Demand
OPEC Monthly Oil Market Report – December 2015 35
World Oil Demand Global oil demand growth has been revised up 30 tb/d since the previous report, largely to reflect better-than-expected oil consumption in OECD Europe and Other Asia. World oil demand growth currently stands at 1.53 mb/d to average 92.88 mb/d. For 2016, projected oil demand growth has been kept unchanged at 1.25 mb/d, averaging 94.13 mb/d. World oil demand in 2015 and 2016 Table 4.1: World oil demand in 2015, mb/d
Graph 4.1: Quarterly world oil demand growth
-1,000
-500
0
500
1,000
1,500
2,000
1Q 2Q 3Q 4Q 1Q 2Q 3Q 4Q 1Q 2Q 3Q 4Q
2014 2015forecast
2016forecast
tb/d
OECD Non-OECD Total world
2014 1Q15 2Q15 3Q15 4Q15 2015 Growth %Americas 24.18 24.25 24.12 24.81 24.99 24.54 0.36 1.49 of which US 19.43 19.60 19.47 19.99 20.15 19.81 0.38 1.93Europe 13.40 13.48 13.60 13.87 13.46 13.60 0.20 1.52Asia Pacific 8.16 8.77 7.72 7.61 8.16 8.06 -0.10 -1.21Total OECD 45.74 46.49 45.44 46.29 46.61 46.21 0.46 1.02Other Asia 11.42 11.46 11.95 11.86 11.75 11.76 0.34 2.94 of which India 3.79 4.01 3.98 3.88 4.04 3.98 0.19 5.03Latin America 6.60 6.40 6.66 6.90 6.64 6.65 0.05 0.72Middle East 8.14 8.24 8.21 8.74 8.15 8.34 0.19 2.37Africa 3.78 3.88 3.87 3.79 3.94 3.87 0.09 2.38Total DCs 29.95 29.99 30.68 31.29 30.48 30.61 0.67 2.22FSU 4.54 4.39 4.23 4.63 4.94 4.55 0.01 0.20Other Europe 0.65 0.66 0.62 0.66 0.75 0.67 0.02 2.79China 10.46 10.44 11.06 10.69 11.16 10.84 0.37 3.58Total "Other regions" 15.66 15.49 15.91 15.98 16.84 16.06 0.40 2.57
Total world 91.35 91.97 92.03 93.56 93.94 92.88 1.53 1.68Previous estimate 91.35 91.97 92.04 93.44 93.96 92.86 1.50 1.65Revision 0.00 0.00 -0.01 0.12 -0.02 0.02 0.03 0.03
Totals may not add up due to independent rounding.
Change 2015/14

World Oil Demand
36 OPEC Monthly Oil Market Report – December 2015
OECD Americas Monthly US data for September 2015 shows stagnant oil demand as compared to the same month in 2014. Gasoline demand showed a huge gain of 0.45 mb/d, or more than 5% y-o-y, the strongest monthly increase in volume since 1983 and the second in all-time history. Gasoline demand was especially supported by a healthy growing economy, a lower fuel price environment and the solid increase in auto sales which gained by approximately 18% y-o-y. Distillate demand also rose in September 2015, increasing by 0.08 mb/d, or 2% y-o-y, marking the strongest monthly growth in 2015. Jet fuel requirements also gained in line with the overall positive development of the economy. In contrast, strong declines have been observed in propane/propylene and other products requirements and have offset gains. Preliminary weekly data for November 2015 imply an overall positive trend in demand with improvements of 0.2 mb/d, y-o-y, following a minor increase in October. An important element, which is worth highlighting, despite the preliminary nature of the data, is continuing strong gasoline demand. Available data for eleven months in 2015 – monthly data through September, and preliminary weekly data for October and November – show US oil demand growing solidly by around 0.4 mb/d. Gasoline and jet fuel take the largest share in gains in this, compared with the same period in 2014, and are partly offset by declines in the demand for distillates, residual fuel oil and propane/propylene. The overall risk for the development of 2016 US oil demand remains balanced since last month. The upside risks relate to the development of the overall economy and the price environment, while some downside risks – such as fuel substitution and vehicle efficiencies – continue to exist. Graph 4.2: US oil consumption, y-o-y changes
Following some recovery in the 3Q15 and after several continuously declining monthly figures in the first two quarters of 2015, Mexico’s oil demand remained stagnant in October 2015 y-o-y, with a diverse picture as far as the main product categories are concerned. Gasoline and residual fuel oil demand in the road and industrial sectors grew and have been offset by declines in the demand for distillates and LPG. The risk for 2016, Mexican oil demand is slightly skewed to the upside and depends mainly on the development of the overall economy.
-800-600-400-200
0200400600800
1,0001,200
Nov
13
Dec
13
Jan
14
Feb
14
Mar
14
Apr
14
May
14
Jun
14
Jul 1
4
Aug
14
Sep
14
Oct
14
Nov
14
Dec
14
Jan
15
Feb
15
Mar
15
Apr
15
May
15
Jun
15
Jul 1
5
Aug
15
Sep
15
Oct
15
Nov
15
tb/d
All other Distllates Gasoline Total oil
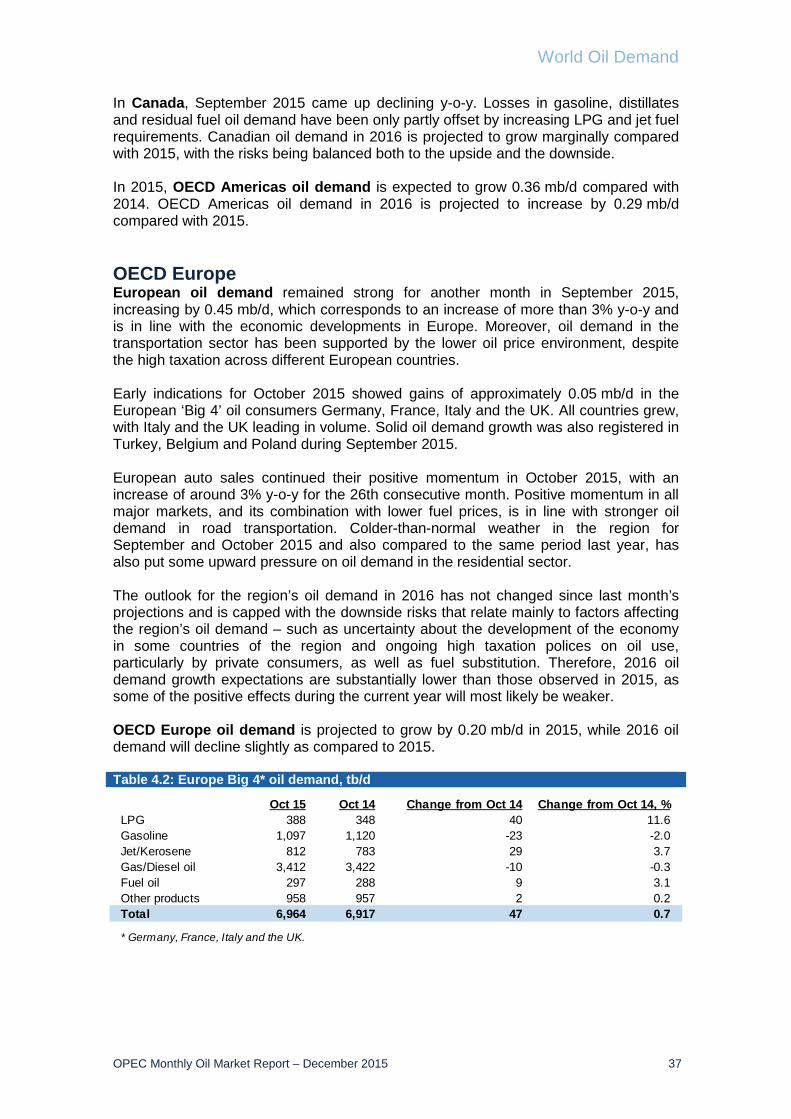
World Oil Demand
OPEC Monthly Oil Market Report – December 2015 37
In Canada, September 2015 came up declining y-o-y. Losses in gasoline, distillates and residual fuel oil demand have been only partly offset by increasing LPG and jet fuel requirements. Canadian oil demand in 2016 is projected to grow marginally compared with 2015, with the risks being balanced both to the upside and the downside. In 2015, OECD Americas oil demand is expected to grow 0.36 mb/d compared with 2014. OECD Americas oil demand in 2016 is projected to increase by 0.29 mb/d compared with 2015. OECD Europe European oil demand remained strong for another month in September 2015, increasing by 0.45 mb/d, which corresponds to an increase of more than 3% y-o-y and is in line with the economic developments in Europe. Moreover, oil demand in the transportation sector has been supported by the lower oil price environment, despite the high taxation across different European countries. Early indications for October 2015 showed gains of approximately 0.05 mb/d in the European ‘Big 4’ oil consumers Germany, France, Italy and the UK. All countries grew, with Italy and the UK leading in volume. Solid oil demand growth was also registered in Turkey, Belgium and Poland during September 2015. European auto sales continued their positive momentum in October 2015, with an increase of around 3% y-o-y for the 26th consecutive month. Positive momentum in all major markets, and its combination with lower fuel prices, is in line with stronger oil demand in road transportation. Colder-than-normal weather in the region for September and October 2015 and also compared to the same period last year, has also put some upward pressure on oil demand in the residential sector. The outlook for the region’s oil demand in 2016 has not changed since last month’s projections and is capped with the downside risks that relate mainly to factors affecting the region’s oil demand – such as uncertainty about the development of the economy in some countries of the region and ongoing high taxation polices on oil use, particularly by private consumers, as well as fuel substitution. Therefore, 2016 oil demand growth expectations are substantially lower than those observed in 2015, as some of the positive effects during the current year will most likely be weaker. OECD Europe oil demand is projected to grow by 0.20 mb/d in 2015, while 2016 oil demand will decline slightly as compared to 2015. Table 4.2: Europe Big 4* oil demand, tb/d
Oct 15 Oct 14 Change from Oct 14 Change from Oct 14, %LPG 388 348 40 11.6Gasoline 1,097 1,120 -23 -2.0Jet/Kerosene 812 783 29 3.7Gas/Diesel oil 3,412 3,422 -10 -0.3Fuel oil 297 288 9 3.1Other products 958 957 2 0.2Total 6,964 6,917 47 0.7
* Germany, France, Italy and the UK.

World Oil Demand
38 OPEC Monthly Oil Market Report – December 2015
OECD Asia Pacific Preliminary October 2015 data recorded a contraction in Japanese oil demand following increases in August, September and the overall third quarter of 2015. Oil demand growth declined by around 63 tb/d, or around 2% y-o-y, and total consumption for the month October hovered around 3.46 mb/d. Gasoline, LPG and distillate usage were increasing, while naphtha and fuel oil requirements declined, the latter a result of less fuel burning implied by warmer than normal weather during October 2015. The outlook risks for 2016 Japanese oil demand remain skewed towards the downside, largely depending on the development of the economy and the number of nuclear power plants that would re-start operations during 2016. Currently two reactors are operating, while another few could most likely start operating in the first half of 2016. The outlook for 2016 Japanese oil demand remains unchanged from last month’s forecasts with the risks continuing to be skewed towards the downside. Table 4.3: Japanese domestic sales, tb/d
In South Korea, September 2015 came up with a strong increase in oil demand requirements. Almost all main product categories increased, particularly distillates, jet fuel and gasoline, with the exception of LPG. The outlook for South Korean oil consumption during 2016 remained unchanged in positive territory as compared to last month’s projections. OECD Asia Pacific oil demand is expected to fall by 0.10 mb/d in 2015, while the decline will continue also in 2016 by 0.14 mb/d, y-o-y. Other Asia In October 2015, Indian oil demand remained elevated, rising by a record of 0.59 mb/d, or around 17%, y-o-y. All products picked up momentum, without exception, with large gains across the barrel. LPG demand rose more than 13% y-o-y growing by more than 77 tb/d, the largest level of gains in 2015. The government’s push on households to use LPG in lieu of kerosene has resulted in an expansion in LPG supply infrastructure projects making more LPG available to end users at subsidised prices. Additionally, for the transportation sector, gasoline usage grew above last year’s level by close to 19% y-o-y, supported by increases in both vehicle sales data and higher vehicle miles travelled. The overall passenger vehicles sales recorded a growth of more than 21% in October with the two-wheeler segment registering a solid 13% rise y-o-y.
Oct 15 Change from Oct 14 Change from Oct 14, %LPG 355 10 2.8Gasoline 895 6 0.7Naphtha 764 -39 -4.8Jet fuel 82 0 -0.2Kerosene 206 6 3.0Gasoil 606 17 2.8Fuel oil 397 -64 -14.0Other products 59 -6 -8.9Direct crude burning 95 7 8.5
Total 3,459 -63 -1.8

World Oil Demand
OPEC Monthly Oil Market Report – December 2015 39
Graph 4.3: Changes in Indian oil demand, y-o-y
Jet/kerosene and gasoil demand also remained elevated rising by more than 4% and 14% y-o-y, respectively. Jet/kerosene received its usual support from the aviation sector while diesel oil gained momentum as usage in the irrigation systems was upbeat due to lower rainfall levels during the monsoon season this year. Additional support also stemmed from the construction sector and industrial activities. Indian oil demand growth in 2015 year-to-date is solidly above the five-year average by more than 0.1 mb/d with LPG and gasoline demand supporting growth. Table 4.4: Indian oil demand by main products, tb/d
For the majority of the remaining oil consuming countries in the region, oil demand was also bullish, based on up-to-date data in 2015 y-o-y, with the only exception being Thailand and Taiwan, both of which showed stagnant oil requirements as compared to the same period in 2014. In Indonesia, demand in all main petroleum categories grew, with the exception of residual fuel oil, which declined slightly. Strength was evident in the road transportation, residential and industrial sectors – notably, in electricity generation – implying solid gains in requirements for LPG, gasoline, and kerosene and gas diesel oil. Indonesian oil demand grew by around 1.4% y-t-d in 2015, in line with rising industrial and manufacturing activities, and the overall health of the country’s growing economy. In Taiwan, rising gasoline and jet/fuel requirements during the first nine months of 2015 have been offset by strongly declining LPG demand, mainly as a result of fuel substitution.
-300-200-100
0100200300400500600
Oct
13
Nov
13
Dec
13
Jan
14
Feb
14
Mar
14
Apr
14
May
14
Jun
14
Jul 1
4
Aug
14
Sep
14
Oct
14
Nov
14
Dec
14
Jan
15
Feb
15
Mar
15
Apr
15
May
15
Jun
15
Jul 1
5
Aug
15
Sep
15
Oct
15
tb/d
LPG Gasoline Kerosene Diesel oil Fuel oil Other products
Oct 15 Oct 14 Change Change, %LPG 657 580 77 13.3Gasoline 542 457 86 18.8Kerosene 323 309 14 4.5Diesel oil 1,404 1,224 180 14.7Fuel oil 290 232 58 25.0Other products 839 666 172 25.9
Total oil demand 4,054 3,468 587 16.9

World Oil Demand
40 OPEC Monthly Oil Market Report – December 2015
Oil demand in Thailand also remained stagnant during the first nine months of 2015 y-o-y, with losses, particularly for naphtha and fuel oil. Losses have been offset, however, by gains especially in gasoline, gas diesel oil and jet/fuel kerosene. The risks for Other Asia oil demand growth in 2016 are hinting towards the upside. In India, oil demand is expected to be once more dominated by transportation fuels, particularly gasoline, while the falling trend in fuel oil requirements in the agricultural sector, as a result of fuel substitution to natural gas, is projected to continue during the year. Oil demand in the region is projected to rise by 0.34 mb/d during 2015, while in 2016 it is foreseen to rise by around 0.29 mb/d. Latin America In Brazil, oil demand declined in October 2015 y-o-y, dipping by around 0.16 mb/d or around 6% y-o-y. This decline seemed to be a reflection of the creeping pace of the economic momentum. Total oil demand stood at 2.54 mb/d in October. All products performed far lower than expected, with exception of ethanol. Ethanol consumption continued to increase in October, rising by more than 0.11 mb/d which equates to a strong 44% rise y-o-y. Gasoline, on the other hand, fell sharply by around 0.11 mb/d, or more than 13% decrease y-o-y, as more drivers switched ethanol for gasoline in October mainly to take advantage of the price differential between the two products. Diesel oil also lost momentum during the month of October, dropping by more than 0.11 mb/d, which equates to around 10% y-o-y. This sharp decline is in line with slower economic activities in the country, marking the fourth consecutive monthly drop in oil demand growth. Similar to the previous month’s report, 2015 oil demand in Brazil is skewed to the negative as slower economic momentum in the country is anticipated to adversely impact oil requirements. Table 4.5: Brazilian inland deliveries, tb/d
Oil demand was also on the decline during the first nine months of 2015 in Ecuador – by as much as 7% y-o-y. Gasoline, gasoil and fuel oil demand all fell as a result of the low international oil price environment. Oil demand was similarly sluggish in Venezuela during the first nine months of 2015. In Argentina, 2015 oil demand growth levels were high, strongly increasing by 40 tb/d, or 5.6%, y-o-y. Almost all product categories showed strong demand, with gasoline, gas diesel oil and residual fuel oil requirements on the rise, while demand for the remaining product categories remained flat. In 2016, expectations for oil demand growth in Latin America are similar to last month projection with a somewhat better outlook for the economy as compared to 2015. Moreover, some support should emerge from transportation fuels as Olympic Games are planned to take place in Brazil during the summer of 2016.
Oct 15 Oct 14 Change Change, %LPG 222 235 -13 -5.6Gasoline 706 813 -107 -13.2Jet/Kerosene 124 128 -4 -3.0Diesel 1,051 1,163 -112 -9.6Fuel oil 81 112 -31 -27.5Alcohol 354 245 109 44.6
Total 2,539 2,696 -158 -5.8

World Oil Demand
OPEC Monthly Oil Market Report – December 2015 41
Oil demand growth in the region is projected to be around 50 tb/d during 2015, while the current outlook foresees oil demand growing by 0.13 mb/d in 2016. Middle East In the Middle East, solid oil demand requirements have been registered during the month of October with oil demand growth in Saudi Arabia hitting the highest level in 2015. Oil demand in Saudi Arabia continues its positive momentum, growing by around than 0.34 mb/d or around 15% y-o-y. All products recorded positive gains during the month, without exception. Direct crude burning recording highest gains in both percentage and volumetric basis. Transportation, industrial fuels and direct crude burning were the contributing elements in rising Saudi Arabian oil demand in 2015, which continues to be the pattern of consumption during the month of October. Oil demand grew solidly also in Kuwait, particularly lifting road transportation and industrial fuels, gasoline and gas diesel oil. Iraqi oil demand continued its positive growth trend which started in June 2015, with most gains being observed in fuel oil and gasoline. Oil demand grew strongly in Qatar and the UAE. In both countries, transportation fuels – notably gasoline – dominated the increases. Graph 4.4: Oil demand growth in the Middle East, y-o-y
In 2016, Middle East oil demand growth may be challenged by some downside risks, which relate to the continuing geopolitical turbulence in some countries. Oil demand is nevertheless expected to grow firmly in Saudi Arabia, IR Iran, UAE, Kuwait, Qatar, and Jordan and Iraq, with transportation fuels – especially gasoline and industrial fuels (i.e. diesel and residual fuel oil) – playing a significant part in the overall oil demand growth for another year. Oil demand growth in the region is projected to reach 0.19 mb/d in 2015, while in 2016 it is anticipated to record around 0.21 mb/d of growth.
-100
0
100
200
300
400
500
-100
0
100
200
300
400
500
1Q 2Q 3Q 4Q 1Q 2Q 3Q 4Q 1Q 2Q 3Q 4Q 1Q 2Q 3Q
2012 2013 2014 2015
tb/dtb/d
Saudi Arabia Iran, I.R. Kuwait UAE Others

World Oil Demand
42 OPEC Monthly Oil Market Report – December 2015
China Chinese oil demand was at projected level of growth of around 0.30 mb/d, or 3.0%, during the month of October 2015, softer than the robust growth experienced in previous months. Oil demand growth was determined by rising gasoline and jet fuel, while diesel oil and the “other products” categories were slowing down. In addition to the week-long national holidays, which contributed to additional gasoline demand, passenger car sales rose steadily in October. According to an analysis from the China Association of Automobile Manufacturers (CAAM), automobile sales were at 1.94 million units, reflecting a more than 13% increase y-o-y. Year-to-date figures, in turn, with data for the past ten months, also highlight a significant increase in car sales with total units sold reaching 16.48 million units. This reflects an increase of 4% compared to the same period in 2014. In October, gasoline consumption grew by around 0.28 mb/d – more than 11% as compared to October 2014. The moderate increase in LPG requirements can be attributed to maintenance activities in some LPG cracking units as LPG grew only by 50 tb/d, which translates into more than 4% y-o-y. Jet fuel rose by 0.15 tb/d, or by more than 37% y-o-y, driven by growth in air traffic activities and lower fares, which led to growth of more than 12% in domestic revenue passenger kilometer. On the other hand, diesel oil dipped by around 0.15 mb/d, or around 4% y-o-y, continuing its slower momentum from the previous month. Fuel oil also edged higher during the month of October gaining 2 tb/d, or around 0.4%, from the level recorded in October 2015. Graph 4.5: Changes in Chinese apparent oil demand, y-o-y changes
The overall 2016 outlook remains fairly unchanged since last month with similar dynamics pointing to the downside mainly focused on a possible economic slowdown and implementation of measures in order to limit transportation fuels consumption. The healthy petrochemical segment and expansions in refining capacity could both, on the other hand, be considered factors that could push 2016 oil demand estimates higher. For 2015, Chinese oil demand is anticipated to grow by 0.37 mb/d. In 2016, it is projected to increase again by 0.30 mb/d.
-600-400-20002004006008001,000
-600-400-200
0200400600800
1,000
Jan Feb Mar Apr May Jun Jul Aug Sep Oct Nov Dec
tb/dtb/d
Historical range 2014 2015* 2016*
* Forecast.

World Oil Demand
OPEC Monthly Oil Market Report – December 2015 43
Table 4.6: World oil demand in 2016, mb/d
2015 1Q16 2Q16 3Q16 4Q16 2016 Growth %Americas 24.54 24.54 24.44 25.09 25.25 24.84 0.29 1.19 of which US 19.81 19.86 19.75 20.24 20.38 20.06 0.25 1.26Europe 13.60 13.49 13.59 13.85 13.43 13.59 -0.01 -0.08Asia Pacific 8.06 8.62 7.58 7.48 8.03 7.93 -0.14 -1.69Total OECD 46.21 46.65 45.61 46.42 46.72 46.35 0.15 0.31Other Asia 11.76 11.76 12.24 12.15 12.04 12.05 0.29 2.48 of which India 3.98 4.16 4.12 4.02 4.19 4.12 0.15 3.65Latin America 6.65 6.55 6.79 7.02 6.78 6.79 0.13 2.01Middle East 8.34 8.45 8.42 8.96 8.36 8.55 0.21 2.55Africa 3.87 3.97 3.96 3.88 4.04 3.96 0.10 2.49Total DCs 30.61 30.73 31.42 32.00 31.22 31.35 0.73 2.40FSU 4.55 4.45 4.29 4.68 4.99 4.60 0.05 1.14Other Europe 0.67 0.68 0.64 0.68 0.77 0.69 0.02 2.98China 10.84 10.77 11.35 10.99 11.45 11.14 0.30 2.80Total "Other regions" 16.06 15.89 16.28 16.34 17.21 16.44 0.38 2.34
Total world 92.88 93.28 93.31 94.77 95.15 94.13 1.25 1.35Previous estimate 92.86 93.28 93.31 94.65 95.17 94.11 1.25 1.35Revision 0.02 0.00 -0.01 0.12 -0.02 0.02 0.00 0.00
Change 2016/15
Totals may not add up due to independent rounding.

World Oil Supply
44 OPEC Monthly Oil Market Report – December 2015
World Oil Supply Preliminary data indicates that global oil supply increased by 0.37 mb/d to average 95.58 mb/d in November compared with the previous month. Non-OPEC oil supply is expected to grow by 1.0 mb/d to average 57.51 mb/d in 2015, revised up by 0.28 mb/d over the previous month’s estimation. The main reasons for this growth were the upward revisions in the US, the UK, Brazil, Russia and China, mostly in 3Q15 as well as revision in 4Q15 forecast . It is expected that growth from OECD Americas, OECD Europe, Other Asia, Latin America, FSU and China will be partially offset by declines in OECD Asia Pacific, the Middle East and Africa. Growth in 2015 is expected at potentially higher output levels in 4Q15 from the US, Canada and Russia. Non-OPEC oil supply in 2016 has been revised down by 0.25 mb/d to an average of 57.14 mb/d, a contraction of 0.38 mb/d from 2015 levels. Contributing factors include expected steeper production declines in US shale plays, legacy wells outnumbering newly drilled wells as well as the negative effects of capex cuts in different regions of the world. Production of OPEC NGLs was revised down by 30 tb/d to grow by 0.16 mb/d and 0.17 mb/d to average 5.99 mb/d and 6.16 mb/d in 2015 and 2016, respectively. In November, OPEC production increased by 230 tb/d compared to the previous month to average 31.70 mb/d, according to secondary sources.
Forecast for 2015 Non-OPEC supply Non-OPEC oil supply growth is expected to be much lower in 2015 than the tremendous growth of 2.23 mb/d achieved in 2014. Annual growth in 2015 y-o-y − based on the latest actual data of historical production and the producing fields’ performances as well as the expected new volumes coming from implemented projects (either new startups or ramp-ups of old projects) − was revised up by 0.28 mb/d to 1.0 mb/d for an average of 57.51 mb/d. This upward revision includes 0.18 mb/d in OECD Americas, 0.04 mb/d in OECD Europe, 0.01 mb/d in OECD Asia Pacific, 0.03 mb/d in Latin America, 0.01 mb/d in FSU and 0.02 mb/d in China. A minor downward revision by 0.01 mb/d in Other Asia was also applied in the new estimation. The contributors for this month’s revisions are mentioned in Table 5.1. Graph 5.1: Regional non-OPEC supply growth, y-o-y
-0.4
0.0
0.4
0.8
1.2
1.6
2.0
-0.4
0.0
0.4
0.8
1.2
1.6
2.0
OECDAmerica
OECDEurope
OECD AsiaPacific
OtherAsia
LatinAmerica
Middle East Africa FSU
mb/dmb/d
14/13 15/14 16/15
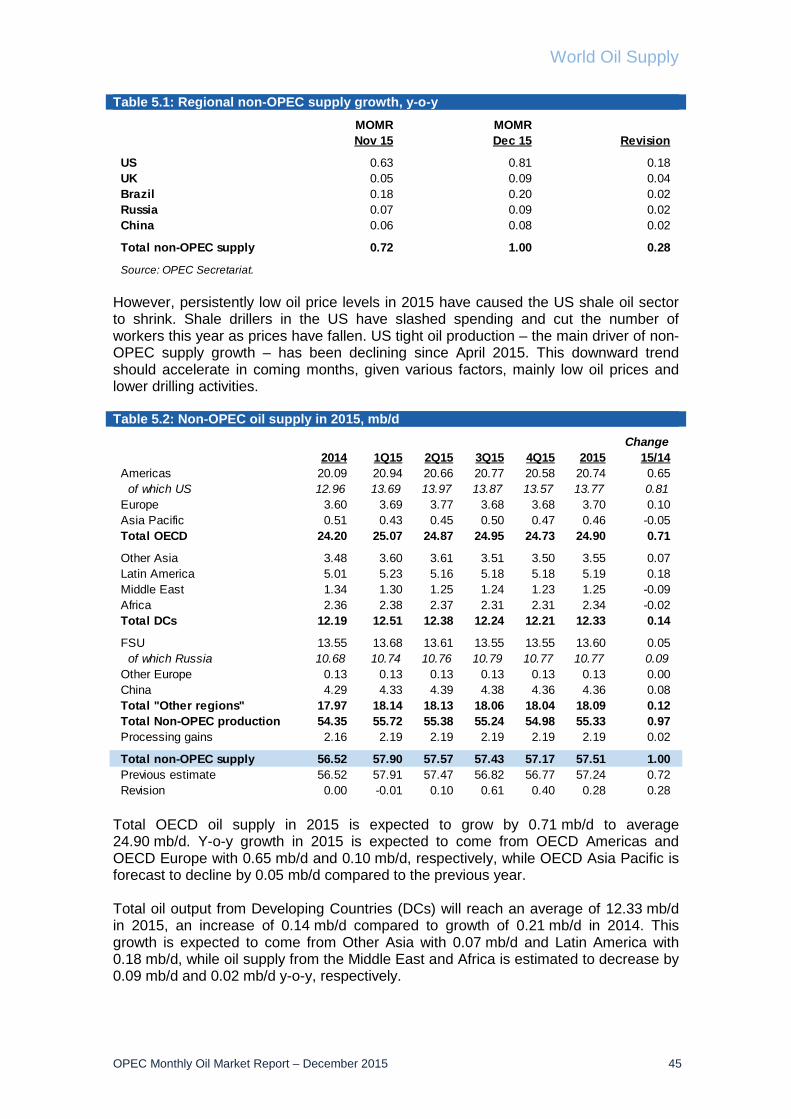
World Oil Supply
OPEC Monthly Oil Market Report – December 2015 45
Table 5.1: Regional non-OPEC supply growth, y-o-y
However, persistently low oil price levels in 2015 have caused the US shale oil sector to shrink. Shale drillers in the US have slashed spending and cut the number of workers this year as prices have fallen. US tight oil production – the main driver of non-OPEC supply growth – has been declining since April 2015. This downward trend should accelerate in coming months, given various factors, mainly low oil prices and lower drilling activities. Table 5.2: Non-OPEC oil supply in 2015, mb/d
Total OECD oil supply in 2015 is expected to grow by 0.71 mb/d to average 24.90 mb/d. Y-o-y growth in 2015 is expected to come from OECD Americas and OECD Europe with 0.65 mb/d and 0.10 mb/d, respectively, while OECD Asia Pacific is forecast to decline by 0.05 mb/d compared to the previous year. Total oil output from Developing Countries (DCs) will reach an average of 12.33 mb/d in 2015, an increase of 0.14 mb/d compared to growth of 0.21 mb/d in 2014. This growth is expected to come from Other Asia with 0.07 mb/d and Latin America with 0.18 mb/d, while oil supply from the Middle East and Africa is estimated to decrease by 0.09 mb/d and 0.02 mb/d y-o-y, respectively.
MOMR MOMRNov 15 Dec 15 Revision
US 0.63 0.81 0.18UK 0.05 0.09 0.04Brazil 0.18 0.20 0.02Russia 0.07 0.09 0.02China 0.06 0.08 0.02
Total non-OPEC supply 0.72 1.00 0.28
Source: OPEC Secretariat.
Change2014 1Q15 2Q15 3Q15 4Q15 2015 15/14
Americas 20.09 20.94 20.66 20.77 20.58 20.74 0.65 of which US 12.96 13.69 13.97 13.87 13.57 13.77 0.81Europe 3.60 3.69 3.77 3.68 3.68 3.70 0.10Asia Pacific 0.51 0.43 0.45 0.50 0.47 0.46 -0.05Total OECD 24.20 25.07 24.87 24.95 24.73 24.90 0.71
Other Asia 3.48 3.60 3.61 3.51 3.50 3.55 0.07Latin America 5.01 5.23 5.16 5.18 5.18 5.19 0.18Middle East 1.34 1.30 1.25 1.24 1.23 1.25 -0.09Africa 2.36 2.38 2.37 2.31 2.31 2.34 -0.02Total DCs 12.19 12.51 12.38 12.24 12.21 12.33 0.14
FSU 13.55 13.68 13.61 13.55 13.55 13.60 0.05 of which Russia 10.68 10.74 10.76 10.79 10.77 10.77 0.09Other Europe 0.13 0.13 0.13 0.13 0.13 0.13 0.00China 4.29 4.33 4.39 4.38 4.36 4.36 0.08Total "Other regions" 17.97 18.14 18.13 18.06 18.04 18.09 0.12Total Non-OPEC production 54.35 55.72 55.38 55.24 54.98 55.33 0.97Processing gains 2.16 2.19 2.19 2.19 2.19 2.19 0.02
Total non-OPEC supply 56.52 57.90 57.57 57.43 57.17 57.51 1.00Previous estimate 56.52 57.91 57.47 56.82 56.77 57.24 0.72Revision 0.00 -0.01 0.10 0.61 0.40 0.28 0.28

World Oil Supply
46 OPEC Monthly Oil Market Report – December 2015
Total FSU oil supply in 2015 is expected to increase by 0.05 mb/d, while Other Europe’s supply will remain steady at 0.13 mb/d and China’s supply is expected to grow by 0.08 mb/d over the previous year, to stand at 4.36 mb/d. OECD Total OECD oil supply in 2015 is expected to grow by 0.71 mb/d to average 24.90 mb/d, revised up by 0.23 mb/d from the previous MOMR. Y-o-y growth in 2015 is expected to come from OECD Americas and OECD Europe with 0.65 mb/d and 0.10 mb/d, respectively, while OECD Asia Pacific is forecast to decline by 0.05 mb/d compared to last year. On a quarterly basis, total OECD supply in 2015 is estimated to average 25.07 mb/d, 24.87 mb/d, 24.95 mb/d and 24.73 mb/d, respectively. OECD Americas OECD Americas’ oil supply in 2015 is estimated to average 20.74 mb/d, showing growth of 0.65 mb/d y-o-y. Supply in the US and Canada is expected to grow in 2015, while in Mexico, it is slated to decline. On a quarterly basis, OECD Americas’ oil supply in 2015 is expected to average 20.94 mb/d, 20.66 mb/d, 20.77 mb/d and 20.58 mb/d, respectively. US US oil output was growing at its fastest rate on record, adding around 1 mb/d of new supply each year, thanks to the introduction of new drilling techniques that have released oil and gas from shale formations. However, recent data shows that US output has already begun to decline after reaching a peak of 9.6 mb/d in April 2015. Nevertheless, US total oil supply is anticipated to grow by 0.81 mb/d to average 13.77 mb/d in 2015, representing an upward revision of 0.18 mb/d from the previous MOMR. The average of US crude oil production at 9.35 mb/d in August, based on the EIA monthly report, indicates a decline of 29 tb/d compared to the average output of July, and volumes continued to decline in September. Therefore, it is estimated that US liquids production in 3Q15 declined by 0.09 mb/d over 2Q15 to average 13.87 mb/d. Shale drillers in the US have slashed spending and cut the number of workers this year as prices have fallen. For instance, the Chesapeake Energy Corporation, the second-largest producer of natural gas and the eleventh largest producer of combined oil and natural gas liquids in the US, has cut 15% of its workforce. According to EIA definition; “tight oil” refers to oil found within reservoirs with very low permeability, including, but not limited to, shale. Permeability is the ability for fluid, such as oil and gas, to move through a rock formation. In 2014, around 80% of US tight oil production came from three basins: the Eagle Ford in South Texas (1.37 mb/d or 33.6% of total US tight oil production), the Bakken Shale in North Dakota and Montana (1.07 mb/d or 26.1% of total US tight oil production) and finally, the Permian in North Texas (including Delaware, Midland and NW Shelf), which produced 0.83 mb/d in 2014 or 20.2% of total US tight oil production. Tight oil production in the US represents 89% of all North American tight oil production, with the remaining 11% (0.36 mb/d) coming from Canada. 2015 tight crude production is estimated to grow by 0.44 mb/d to average 4.40 mb/d, while 2016 growth is expected to decline by 170 tb/d, to average 4.23 mb/d. This forecast is based on the current oil price environment, meaning producers have shifted focus to their cash flows. Total US tight liquids (tight crude and

World Oil Supply
OPEC Monthly Oil Market Report – December 2015 47
unconventional NGLs) production from US shale in 2014 was 5.6 mb/d and is estimated at 6.2 mb/d in 2015, declining to 6.0 mb/d in 2016. Graph 5.2: US annual liquids production and annual growth
Oil production from the Eagle Ford shale, based on Texas Railroad Commission (RRC) data, declined by 66 tb/d m-o-m to 1.2 mb/d in August. The total tight crude production from this shale play in 2014 was 1.37 mb/d, and it is expected to reach 1.49 mb/d in the current year, but will decline to 1.45 mb/d in 2016. Tight crude output in December 2014 peaked at 1.48 mb/d, while the number of oil rigs declined by 4 rigs to 62 in November m-o-m, dropping y-o-y by 134 rigs. $18.3 bn is expected to be spent for drilling and completion at Eagle Ford in 2015. According to the latest drilling productivity report (DPR) of EIA, new well productivity in this play reached the highest level, at 795 b/d, in November 2015. The number of drilled but uncompleted (DUC) wells dropped to 747 in October 2015. Graph 5.3: Eagle Ford oil production, 2010-to-date
Tight crude production from the Bakken/Three Forks shale formation in North Dakota decreased by 25 tb/d to average 1.16 mb/d in September. The decline comes as the number of producing wells fell by 21, although the number of completions rose m-o-m by eight to 123. The backlog of DUC wells rose by 98 units m-o-m to 1,091, but declined again in October to 946 uncompleted wells. Crude production in the Bakken/Three Forks shale peaked at 1.22 mb/d in December 2014, and the number of
13.77 13.60
0.81
-0.17 -4%-2%0%2%4%6%8%10%12%14%16%18%
-202468
10121416
2009 2010 2011 2012 2013 2014 2015(forecast)
2016(forecast)
Percentagemb/d
US annual production Y-o-y growth % change y-o-y growth (RHS)
Source: OPEC Secretariat.
0
200
400
600
800
1,000
1,200
1,400
1,600
Jan
10
Apr
10
Jul 1
0
Oct
10
Jan
11
Apr
11
Jul 1
1
Oct
11
Jan
12
Apr
12
Jul 1
2
Oct
12
Jan
13
Apr
13
Jul 1
3
Oct
13
Jan
14
Apr
14
Jul 1
4
Oct
14
Jan
15
Apr
15
Jul 1
5
Oct
15
tb/d
Source: OPEC Secretariat.
1,482 tb/d peaked in Dec 14

World Oil Supply
48 OPEC Monthly Oil Market Report – December 2015
oil rigs in Williston basin in November decreased by 1 rig to average 63 rigs m-o-m, while it dropped by 127 rigs a year ago. According to the latest DPR published by EIA, new well productivity in December 2015 in this shale play was 717 b/d. The total tight crude production in 2014 was 1.07 mb/d and is expected to reach 1.14 mb/d in the current year, while in 2016, it will decline to 1.1 mb/d. Graph 5.4: Bakken oil production, 2010-to-date
Oil production from the Permian shale plays in Delaware, Midland and North West Shelf declined by 31 tb/d m-o-m to 1.05 mb/d in August. The total tight crude production in 2014 was 0.84 mb/d and is expected to reach 0.98 mb/d in 2015. Tight crude output in May 2015 peaked at 1.12 mb/d, while the number of rigs declined by 8 rigs to 221 rigs in November, m-o-m while the yearly decline registered at 339 rigs. An estimated $18.7 bn will be spent for drilling and completion at the Permian in 2015. According to the latest EIA DPR, new well productivity at this play reached the highest level at 412 b/d in December 2015. The number of DUC wells dropped to 747 in October 2015. One of the biggest drivers of growth in the Permian has been Pioneer Natural Resources, which has benefitted from one of the largest hedge books in the industry, valued at $850 million as of September. After the price rally in 2Q15, the company announced plans to add two rigs per month until the end of the year, but the price fall since then has meant even the bigger players, which are less constrained financially, have scaled back their ambitions and drilling plans. Graph 5.5: Permian (Delaware & Midland) oil production, 2010-to-date
0
200
400
600
800
1,000
1,200
1,400
Jan
10
Apr
10
Jul 1
0
Oct
10
Jan
11
Apr
11
Jul 1
1
Oct
11
Jan
12
Apr
12
Jul 1
2
Oct
12
Jan
13
Apr
13
Jul 1
3
Oct
13
Jan
14
Apr
14
Jul 1
4
Oct
14
Jan
15
Apr
15
Jul 1
5
Oct
15
tb/d
Source: OPEC Secretariat.
1,217 tb/d peaked in Dec 14
0
200
400
600
800
1,000
1,200
Jan
10
Apr
10
Jul 1
0
Oct
10
Jan
11
Apr
11
Jul 1
1
Oct
11
Jan
12
Apr
12
Jul 1
2
Oct
12
Jan
13
Apr
13
Jul 1
3
Oct
13
Jan
14
Apr
14
Jul 1
4
Oct
14
Jan
15
Apr
15
Jul 1
5
Oct
15
tb/d
Source: OPEC Secretariat.
1,123 tb/d peaked in May 15

World Oil Supply
OPEC Monthly Oil Market Report – December 2015 49
Tight crude production from the Niobrara play, located in Colorado, averaged 0.22 mb/d in 2014. Average output in 2015 is likely to increase to 0.26 mb/d, then decline to 0.24 mb/d in 2016. The EIA DPR forecasts new well productivity in December at 667 b/d and declines in production were due to legacy declines stepping up, with the agency expecting a 20 tb/d decline in November. A relatively high proportion of condensate has been found in liquids output, and this has forced some companies to move into more oil-rich acreage such as in the eastern liquid-rich Denver-Julesburg (DJ) basin, where the Niobrara and Codell formations are generating greater revenue. Oil production from the Niobrara shale declined by 10 tb/d m-o-m to 0.27 mb/d in August. Tight crude output in May 2015 peaked at 0.30 mb/d, while the number of rigs declined to 23 in November, dropping y-o-y by 22 rigs. An estimated $5.4 bn will be spent on drilling and completion at the Niobrara shale formation in 2015. Graph 5.6: Niobrara oil production, 2010-to-date
Moreover, tight crude production in other regions, including Haynesville, Marcellus and Utica will increase by around 70 tb/d to average 0.66 mb/d in 2015 and then decrease to 0.64 mb/d in 2016. Gulf of Mexico (GOM) production is running higher y-o-y by 0.12 mb/d in the year-to-August, benefitting from several 2H14 and early 2015 startups. In August, GOM output was pegged at 1.65 mb/d, higher m-o-m by 63 tb/d. In 3Q15, strong operational performance registered at the Mars platform (Mars, Ursa and West Delta 143 fields). August was, however, impacted by the Mad Dog field going offline due to planned works for 10 days, although the field ramped up to pre-shutdown levels of 37 tb/d within a day. In September, output was supported by a ramp-up of Delta House FPSO, which came on stream in April. The field had ramped up to 62 tb/d from seven wells, and the eighth well was due to come on at the end of October, which would help take output close to nameplate capacity of 80 tb/d. Peak output is expected a year later after three additional wells come online, taking output to 0.1 mb/d. October saw maintenance at the Atlantis field for three days which reduced output by around 50 tb/d for the three/four days. The Marco Polo platform was also shut for a week in early October but returned to normal operations as of mid-month. Finally, the end of October saw the early startup of the Big Bend development with the single well in operation expected to ramp-up to just under 20 tb/d by mid-November. The operator company has also accelerated the Dantzler development and now expects first production in early November. Both will be tie-backs to the Thunder Hawk production facility. Growth of 0.17 mb/d and 0.10 mb/d in 2015 and 2016, respectively, is expected.
0
50
100
150
200
250
300
350
Jan
10
Apr
10
Jul 1
0
Oct
10
Jan
11
Apr
11
Jul 1
1
Oct
11
Jan
12
Apr
12
Jul 1
2
Oct
12
Jan
13
Apr
13
Jul 1
3
Oct
13
Jan
14
Apr
14
Jul 1
4
Oct
14
Jan
15
Apr
15
Jul 1
5
Oct
15
tb/d
Source: OPEC Secretariat.
298 tb/d peaked in May 15

World Oil Supply
50 OPEC Monthly Oil Market Report – December 2015
US oil rig count According to Baker Hughes’ latest weekly report on 4 December 2015, the total drilling rig count in the US dropped by 1,183 rigs (-61.6%) y-o-y, to 737 rigs. More than 96% of this decline was in onshore fields. With regard to the split, rigs working in oil fields dropped by 65.4% from the same period a year earlier, while the number of active rigs working in US gas fields declined by 44.2%. In total, there was a 61.4% decline on average in the rig count in the tight oil regions. This was more or less in line with the decline in horizontal drilling at -58.4% y-o-y. Table 5.3: US rotary rig count
Comparison details of US rig activities from different aspects registered on 2 December 2015 can be seen in Table 5.3, followed by the charts below. Moreover, Graph 5.8 also shows US weekly oil rig count activity compared to crude oil production up to 4 December 2015. Graph 5.7: US total rig count by selected basin
Graph 5.8: US weekly oil rig count vs. Crude oil production
Oil and gas split 4 Dec 15 W-o-w M-o-m Y-o-y Y-o-y, % Oil 545 -10 -27 -1,030 -65 Gas 192 3 -7 -152 -44
Location Land 712 -2 -27 -1,150 -62 Offshore 25 -5 -7 -33 -57
Drilling type Directional 64 -2 -17 -134 -68 Horizontal 569 0 -16 -799 -58 Vertical 104 -5 -1 -250 -71
US drilling total 737 -7 -34 -1,183 -62
Source: Baker Hughes.
Change
0
100
200
300
400
500
600
7 N
ov 1
45
Dec
14
2 Ja
n 15
30 J
an 1
527
Feb
15
27 M
ar 1
524
Apr
15
22 M
ay 1
519
Jun
15
17 J
ul 1
514
Aug
15
11 S
ep 1
59
Oct
15
6 N
ov 1
54
Dec
15
Eagle Ford Permian Williston
Source: Baker Hughes.
Rig count
7.0
7.5
8.0
8.5
9.0
9.5
10.0
0
500
1,000
1,500
2,000
Jan
14M
ar 1
4M
ay 1
4Ju
l 14
Sep
14N
ov 1
4Ja
n 15
Mar
15
May
15
Jul 1
5Se
p 15
Nov
15
mb/dRigs
US weekly oil rig count (LHS)Crude oil production (RHS)
Sources: Baker Hughes and EIA.

World Oil Supply
OPEC Monthly Oil Market Report – December 2015 51
Graph 5.9: US oil rig count for selected basins
On a quarterly basis, US oil supply in 2015 is expected to average 13.69 mb/d, 13.97 mb/d, 13.87 mb/d and 13.57 mb/d, respectively. US liquids q-o-q changes compared to other non-OPEC supply can be seen in Graph 5.10. Graph 5.10: US liquids vs. non-OPEC supply, q-o-q growth
Canada and Mexico Oil supply in Canada is expected to grow by 0.05 mb/d in 2015 to average 4.36 mb/d y-o-y, unchanged from the last MOMR. Final June data shows conventional output fell by 0.17 mb/d y-o-y to 1.19 mb/d, the lowest level since August 2012, suggesting conventional declines have continued. Moreover, output of NGLs declined to 0.69 mb/d. The number of active rigs in Canada in November 2015 fell to just 178 units, lower y-o-y by 243 rigs, with 74 units (41%) working in oil fields and 104 rigs active in gas fields. Out of the total rig count in November, 115 rigs are active in Alberta State, mostly for oil sands production. In June, output from Canada’s oil sands increased by 0.43 mb/d to settle at 2.41 mb/d, driven by a 90 tb/d y-o-y increase in Syncrude joint venture upgrader production. Estimates place July Canadian output higher m-o-m by 0.22 mb/d to average
0
100
200
300
400
500
600Ja
n 14
Feb
14M
ar 1
4A
pr 1
4M
ay 1
4Ju
n 14
Jul 1
4A
ug 1
4S
ep 1
4O
ct 1
4N
ov 1
4D
ec 1
4Ja
n 15
Feb
15M
ar 1
5A
pr 1
5M
ay 1
5Ju
n 15
Jul 1
5A
ug 1
5S
ep 1
5O
ct 1
5N
ov 1
5D
ec 1
5
Rigs
Source: Baker Hughes.
PermianEagle FordWillistonCana WoodfordMississippianGranite Wash
0.00
0.28 -0.09-0.30
-0.11
0.11
0.03
0.170.09
-0.62
-0.04
0.04 -0.01
-0.24
0.04
0.45
0.09
-0.34
-0.14 -0.26 -0.12-0.13
0.07
0.62
-1.0-0.8-0.6-0.4-0.20.00.20.40.60.8
1Q15 2Q15 3Q15 4Q15 1Q16 2Q16 3Q16 4Q16
mb/d
US liquids growth Non-OPEC supply excl. US Total liquids growth
Source: OPEC Secretariat.

World Oil Supply
52 OPEC Monthly Oil Market Report – December 2015
4.29 mb/d. Oil sands output reached successive record highs also in July and August, as ExxonMobil’s Nabiye and Kearl expansion projects ramped up. The two projects have already added a combined 0.12 mb/d of extra heavy crude supply, and are expected to add a further 30 tb/d by year-end, weighing sharply on Canadian heavy crude prices. While August saw Canadian bitumen output remain flat m-o-m, production from the Syncrude 0.33 mb/d upgrader likely declined by 0.2 mb/d due to an unplanned outage. Preliminary September data indicates Canadian oil production fell by 0.14 mb/d y-o-y to just over 4.0 mb/d. Preliminary September Syncrude output also fell to just 63 tb/d, lower by 0.21 mb/d y-o-y due to a fire at the facility. This took total Canadian oil sands production to 2.2 mb/d, higher y-o-y by just 17 tb/d, the slowest pace of growth since May 2013. Conventional oil output offshore and onshore, including tight oil, continued falling, down by over 0.15 mb/d y-o-y across 3Q15, as the onshore rig count fell to just 70 rigs by the end of September, lower y-o-y by 152. Indeed, September Canadian oil production fell by 0.14 mb/d y-o-y to just over 0.4 mb/d. The y-o-y declines were driven by falling conventional production, which dropped by 0.17 mb/d to 1.2 mb/d. Canadian output in 2Q15 was 4.13 mb/d, which was lower y-o-y by 60 tb/d while representing a huge decline of 0.47 mb/d compared to 1Q15. This decline was due not only to the seasonal pattern, but also to a wildfire in Alberta. On a quarterly basis, Canada’s oil supply in 2015 is expected to average 4.60 mb/d, 4.13 mb/d, 4.29 mb/d and 4.42 mb/d, respectively. Graph 5.11: Canada’s annual liquids production and annual growth
Mexico’s liquids production in 2015 is expected to decline significantly by 0.21 mb/d to average 2.60 mb/d. Liquids output in 3Q15 increased by 10 tb/d to average 2.60 mb/d, where preliminary data shows that crude output increased by 40 tb/d to average 2.26 mb/d in the same quarter, although output in August and September declined slightly compared to July. September has seen crude output remain broadly flat m-o-m, with the y-o-y decline easing to 0.12 mb/d. Mexico’s oil supply in 3Q15 declined by more than 6%, or 170 tb/d, over the same quarter a year earlier. Mexican liquids output was also more or less steady m-o-m at 2.61 mb/d in October, with y-o-y declines easing to 0.12 mb/d, as renewed weakness in production from September 2014 onwards provided a low base. Mexico also produced 0.33 mb/d of NGLs in 3Q15. Output from the Ku-Maloob-Zaap cluster (KMZ) fell below 0.77 mb/d y-o-y, down by 85 tb/d, the steepest decline in over 10 years. The same condition was seen in
4.36 4.48
0.05 0.120%
2%
4%
6%
8%
0
1
2
3
4
5
2009 2010 2011 2012 2013 2014 2015(forecast)
2016(forecast)
Percentagemb/d
Canada annual production Y-o-y growth % change y-o-y growth (RHS)
Source: OPEC Secretariat.

World Oil Supply
OPEC Monthly Oil Market Report – December 2015 53
Cantarell and Ligero Marino. With rigs falling to their lowest levels since June 2003, at just 35 rigs by November, declines are likely to step up next year. On a quarterly basis, Mexico’s oil supply in 2015 is seen to average 2.65 mb/d, 2.55 mb/d, 2.60 mb/d and 2.58 mb/d, respectively. Graph 5.12: Mexico’s annual liquids production and annual growth
OECD Europe Total OECD Europe oil supply, which grew by 20 tb/d to average 3.60 mb/d in 2014, is expected to grow again this year – by 100 tb/d – to average 3.70 mb/d. This is due to the exploitation of new projects that have started up as well as from several field ramp-ups in Norway and the UK. OECD Europe in 2015 is estimated to see quarterly supply of 3.69 mb/d, 3.77 mb/d, 3.68 mb/d and 3.68 mb/d, respectively. Norway’s oil supply is expected to increase by 30 tb/d from the previous year to average 1.92 mb/d in 2015. Norwegian October liquids output picked up m-o-m to 1.95 mb/d, led by a 53 tb/d m-o-m increase in NGLs. According to data from the Norwegian Petroleum Directorate (NPD), preliminary production figures for October 2015 show an average daily production of about 1.95 mb/d of oil, NGLs and condensate, which is 85 tb/d (about 4.5%) more than in September 2015. The average daily liquids production in September was: 1.57 mb/d of oil, 0.33 mb/d of NGLs and 0.04 mb/d of condensate. The NPD also mentioned that oil production was about 0.5% below the figure seen in October of last year. October saw the return of the 70 tb/d Skarv field, which had been offline for the last 10 days of September. The start of Eni’s 0.1 mb/d Goliat field has been delayed as the regulator found the FPSO to have eight nonconformities relating to electrical safety. Overall, 0.28 mb/d of new fields (if Goliat starts by year-end) and less maintenance should keep y-o-y output growth positive for the second straight year in 2015, although a high base will keep growth flat in 4Q15 at 1.92 mb/d. A new field, Edvard Grieg, started producing in the North Sea on Saturday, 28 November. This field is the Lundin operating company's first major development project on the Norwegian shelf. Expected recoverable resources from the field total 182 mboe, mainly oil. The field's startup is in accordance with the Plan for
2.60 2.47
-0.21 -0.13 -8%-7%-6%-5%-4%-3%-2%-1%0%
-0.50.00.51.01.52.02.53.03.5
2009 2010 2011 2012 2013 2014 2015(forecast)
2016(forecast)
Percentagemb/d
Mexico annual production Y-o-y growth % change y-o-y growth (RHS)
Source: OPEC Secretariat.

World Oil Supply
54 OPEC Monthly Oil Market Report – December 2015
Development and Operation (PDO). Development costs have increased somewhat, but the increase is within the uncertainty range of plus/minus 20% in the PDO’s investment estimate. The field is developed with a fixed platform, resting on the seabed. The oil is transported by pipeline (EGOP) to the Grane oil pipeline and on to the Sture terminal north of Bergen. The gas is transported in a separate pipeline (UHGP), which is tied in to the pipeline network on the UK side (SAGE). On a quarterly basis, Norway’s oil production in 2015 is seen to average 1.93 mb/d, 1.93 mb/d, 1.91 mb/d and 1.92 mb/d, respectively. Graph 5.13: Norway’s annual liquids production and annual growth
The UK’s oil supply is estimated to grow by 90 tb/d to an average of 0.94 mb/d in 2015 y-o-y. Preliminary estimates for 3Q15 show a drop of 0.10 mb/d compared with 2Q15, but nevertheless higher by 0.20 mb/d than in the same quarter last year. With lower maintenance at Buzzard than during last year, output remained higher y-o-y (+0.35 mb/d) for the fifth consecutive month. September output rebounded to 1.0 mb/d, with the Forties loading programme rising by 91 tb/d m-o-m to 0.44 mb/d. Meanwhile, planned works at Buzzard have been postponed from October to November, pushing October output to a two-year high. The Cladhan field, expected to produce around 17 tboe/d, was slated to achieve first oil in October. UK liquids production was pegged at 0.95 mb/d in October, lower m-o-m by 50 tb/d. This decline was due to an outage at Buzzard on 15 October with production at the field taking several days to ramp back up after a four-day closure. In November, the field operated at reduced rates for a number of days due to technical issues, which would have weighed on output. Buzzard’s recent problems are reflected in the number of cargo deferrals, with one cargo scheduled for December dropped, while six more December cargoes have seen postponements. Recent outages have occurred in the wake of several delays to planned maintenance at the field (originally due in June), with works now postponed until 2016. The timing and duration of Buzzard’s maintenance is unconfirmed, but given the significant cutbacks in maintenance capex by major oil companies, it is likely to occur when there is a large unplanned outage. On a quarterly basis, UK oil output in 2015 is estimated to average 0.93 mb/d, 1.00 mb/d, 0.95 mb/d and 0.95 mb/d, respectively.
1.92 1.94
0.03 0.02
-10%
-8%
-6%
-4%
-2%
0%
2%
4%
-0.5
0.0
0.5
1.0
1.5
2.0
2.5
2009 2010 2011 2012 2013 2014 2015(forecast)
2016(forecast)
Percentagemb/d
Norway annual production Y-o-y growth % change y-o-y growth (RHS)
Source: OPEC Secretariat.

World Oil Supply
OPEC Monthly Oil Market Report – December 2015 55
Graph 5.14: UK annual liquids production and annual growth
OECD Asia Pacific OECD Asia Pacific’s oil supply is expected to decline by 50 tb/d in 2015, averaging 0.46 mb/d. On a quarterly basis, total OECD Asia Pacific oil supply in 2015 is expected to average 0.43 mb/d, 0.45 mb/d, 0.50 mb/d and 0.47 mb/d, respectively. Australia’s oil supply is slated to decline this year by 50 tb/d to average 0.38 mb/d. According to the latest information from Australian Petroleum Statistics in July, crude oil and condensate production from six basins is declining. Total annual output of these six basins during 2010-14 declined from 161 mb to 120 mb. Developing Countries Total oil output from Developing Countries (DCs) will reach an average of 12.33 mb/d in 2015, an increase of 0.14 mb/d compared to growth of 0.21 mb/d in 2014. On a quarterly basis, total oil supply in DCs in 2015 is estimated to average 12.51 mb/d, 12.38 mb/d, 12.24 mb/d and 12.21 mb/d, respectively. Graph 5.15: Developing Countries’ quarterly production
Graph 5.16: Developing Countries’ quarterly production, annual comparison
0.96 0.91
0.09
-0.05-20%
-15%
-10%
-5%
0%
5%
10%
15%
-0.4-0.20.00.20.40.60.81.01.21.41.6
2009 2010 2011 2012 2013 2014 2015(forecast)
2016(forecast)
Percentagemb/d
UK annual production Y-o-y growth % change y-o-y growth (RHS)
Source: OPEC Secretariat.
11.8
11.9
12.0
12.1
12.2
12.3
12.4
12.5
12.6
1Q13
2Q13
3Q13
4Q13
1Q14
2Q14
3Q14
4Q14
1Q15
2Q15
3Q15
4Q15
1Q16
2Q16
3Q16
4Q16
mb/d
11.8
11.9
12.0
12.1
12.2
12.3
12.4
12.5
12.6
1Q 2Q 3Q 4Q
mb/d
2013 20142015 2016

World Oil Supply
56 OPEC Monthly Oil Market Report – December 2015
Other Asia Other Asia’s oil production is predicted to increase by 70 tb/d in 2015 to average 3.55 mb/d. Oil output in Malaysia, Thailand, Vietnam and Asia others is expected to grow by 0.11 mb/d, while production in India and Indonesia will likely decrease by 20 tb/d and 10 tb/d, respectively. Brunei’s output is expected to remain steady. India In India, output over the first three quarters of 2015 has been in line with 2014 levels at 760 tb/d, which is slightly lower compared to 2-3 years ago when production was close to 770-780 tb/d. Recently, declines in onshore production have been countered by increases in production from offshore fields. In particular, Cairn, India, managed to grow output at its two offshore fields, Ravva and Cambay, recently; output at its major Rajasthan block, however, has been declining. The company plans to use enhanced recovery methods to boost production back up to 200 tb/d from the current 170-180 tb/d. On a quarterly basis, Other Asia’s oil supply in 2015 is estimated to stand at 3.60 mb/d, 3.61 mb/d, 3.51 mb/d and 3.50 mb/d, respectively. Latin America Latin America’s oil supply is estimated to grow by 0.18 mb/d to average 5.19 mb/d in 2015. Latin America was the second-highest driver of growth in 2014 among all non-OPEC regions. Brazil is the main driver of growth in 2015 by 0.20 mb/d, along with a small increase in Colombia, while oil production in other Latin American countries is expected to decline by 30 tb/d. On a quarterly basis, Latin America’s oil supply in 2015 is expected to stand at 5.23 mb/d, 5.16 mb/d, 5.18 mb/d and 5.18 mb/d, respectively. Brazil’s liquids supply is expected to average 3.06 mb/d in 2015, an increase of 0.20 mb/d over the previous year. A record level of liquids output was pegged at 3.17 mb/d in August of the current year. The increase came from the ramp-up of the 0.15 mb/d FPSO Cidade de Itaguaí in the Lula field, while the return of platforms from maintenance also helped. In the year-to-August, production growth has averaged 0.27 mb/d, compared to 0.24 mb/d for all of 2014. Brazilian crude oil and NGL production in September fell m-o-m by 0.15 mb/d to 2.40 mb/d due to large platforms shutting down for maintenance, in particular the P-52 platform in the Roncador field. Pre-salt output reached 0.9 mb/d during the month, although average output across September declined by more than 30 tb/d. Thus, y-o-y growth eased to just 27 tb/d, the lowest since January 2014. While October output was flat m-o-m, November could see production decline by 0.1-0.3 mb/d across the month due to Brazil’s largest workers union (FUP) starting a strike to protest against asset sales by Petrobras. Even before the strike, Brazilian output would have struggled to grow strongly as the sharp drop in maintenance capex will likely lead to a decline in Campos basin output. Biofuel output in September was steady at 0.53 mb/d. On a quarterly basis, Brazil’s oil supply in 2015 is estimated to stand at 3.06 mb/d, 3.02 mb/d, 3.09 mb/d and 3.09 mb/d, respectively.

World Oil Supply
OPEC Monthly Oil Market Report – December 2015 57
Graph 5.17: Brazil’s annual liquids production and annual growth
Middle East Middle East oil supply is estimated to decrease by 0.09 mb/d in 2015 from the previous year to average 1.25 mb/d. Oman’s oil production is expected to grow by 30 tb/d to average 0.98 mb/d, while Bahrain and Yemen are expected to see declines of 20 tb/d and 0.10 mb/d to average 0.21 mb/d and 0.04 mb/d, respectively, in 2015. On a quarterly basis, Middle East oil supply in 2015 is seen to average 1.30 mb/d, 1.25 mb/d, 1.24 mb/d and 1.23 mb/d, respectively. Africa Africa’s oil supply is projected to average 2.34 mb/d in 2015, a decline of 20 tb/d y-o-y. In 2015, oil production from Equatorial Guinea and the Sudans is expected to grow by 10 tb/d each, to average 0.29 mb/d. While Chad, Congo and Africa Others will see supply declines, other countries, such as Egypt, Gabon and South Africa, will see steady production in 2015. On a quarterly basis, Africa’s oil supply in 2015 is expected to average 2.38 mb/d, 2.37 mb/d, 2.31 mb/d and 2.31 mb/d, respectively. FSU, other regions Total FSU oil supply is expected to increase by 50 tb/d in 2015 to an average of 13.60 mb/d. In 2015, oil production in Russia will increase, while output in Kazakhstan, Azerbaijan and FSU others is expected to decrease. On a quarterly basis, total FSU oil supply in 2015 is seen to average 13.68 mb/d, 13.61 mb/d, 13.55 mb/d and 13.55 mb/d, respectively.
3.06 3.17
0.20 0.11
-2%
0%
2%
4%
6%
8%
10%
12%
-0.50.00.51.01.52.02.53.03.5
2009 2010 2011 2012 2013 2014 2015(forecast)
2016(forecast)
Percentagemb/d
Brasil annual production Y-o-y growth % change y-o-y growth (RHS)
Source: OPEC Secretariat.

World Oil Supply
58 OPEC Monthly Oil Market Report – December 2015
Russia Russian oil supply in 2015 is expected to grow by 90 tb/d to average 10.77 mb/d. October and November output rose to a post-Soviet record of 10.90 mb/d and 10.88 mb/d, respectively. The increase continues to be led by Gazprom, Bashneft and PSA operators, as their output is biased towards condensate, while Lukoil’s and Rosneft’s output continued to fall, with Lukoil’s output down y-o-y by 2.9% and Rosneft’s by 0.9%. In 2015, the regions seeing the biggest supply additions are Northern Russia and East Siberia, while West Siberia recorded the biggest losses overall on a y-o-y basis. Graph 5.18: Russia’s annual liquids production and annual growth
On a quarterly basis, Russia’s 2015 oil supply is expected to average 10.74 mb/d, 10.76 mb/d, 10.79 mb/d and 10.77, mb/d, respectively. Graph 5.19: Russia’s quarterly production Graph 5.20: Russia’s quarterly production,
annual comparison
10.77 10.70
0.09
-0.06 -1.0%-0.5%0.0%0.5%1.0%1.5%2.0%2.5%3.0%
-2
0
2
4
6
8
10
12
2009 2010 2011 2012 2013 2014 2015(forecast)
2016(forecast)
Percentagemb/d
Russia annual production Y-o-y growth % change y-o-y growth (RHS)
Source: OPEC Secretariat.
10.4
10.5
10.6
10.7
10.8
10.9
1Q13
2Q13
3Q13
4Q13
1Q14
2Q14
3Q14
4Q14
1Q15
2Q15
3Q15
4Q15
1Q16
2Q16
3Q16
4Q16
mb/d
10.4
10.5
10.6
10.7
10.8
10.9
1Q 2Q 3Q 4Q
mb/d
2013 20142015 2016

World Oil Supply
OPEC Monthly Oil Market Report – December 2015 59
Caspian Kazakhstan’s oil supply is expected to decrease by 40 tb/d over the previous year to average 1.59 mb/d in 2015. Kazakhstan’s August output declined m-o-m by a steep 86 tb/d to 1.51 mb/d, the lowest level since October 2014. This was due to a 0.1 mb/d decline in Tengiz output. Preliminary supply data for 3Q15 indicates a decline by 50 tb/d to 1.55 mb/d. Lower investment in mature onshore fields, such as Uzen and Emba, is weighing on the country’s operations. Indeed, evidence suggests some smaller Kazakh producers have already shut in wells due to poor economics. The latest guidance from Eni suggests the Kashagan field is on track for a late 2016 startup, so the contribution to supplies next year is likely to be minimal. Azeri oil supply is anticipated to decline by 10 tb/d to average 0.86 mb/d in 2015, indicating steady production during the year. Azerbaijan’s August output fell by 20 tb/d m-o-m to 0.84 mb/d as the country’s largest field, BP’s ACG complex, entered into decline. Planned maintenance at the Chirag platform for 20 days starting 20-22 October will also weigh in 4Q15. Year-end sees lower output from Azerbaijan due to maintenance at the ACG complex for 25 days from 10 November. Other Europe’s oil supply remained unchanged to average 0.14 mb/d in 2015, indicating steady production during the year. China China’s oil supply is expected to grow by 80 tb/d over the previous year to average 4.36 mb/d in 2015, due to strong output in 2Q15, continuing into 3Q15. Chinese crude production in October eased m-o-m by 58 tb/d to 4.27 mb/d, the lowest since April. The y-o-y growth eased to just 36 tb/d, the slowest since February. On a quarterly basis, China’s oil supply in 2015 is estimated to average 4.33 mb/d, 4.39 mb/d, 4.38 mb/d and 4.36 mb/d, respectively. Graph 5.21: China’s annual liquids production and annual growth
4.36 4.37
0.08 0.01
-1%0%1%2%3%4%5%6%7%8%
-0.50.00.51.01.52.02.53.03.54.04.55.0
2009 2010 2011 2012 2013 2014 2015(forecast)
2016(forecast)
Percentagemb/d
China annual production Y-o-y growth % change y-o-y growth (RHS)
Source: OPEC Secretariat.

World Oil Supply
60 OPEC Monthly Oil Market Report – December 2015
Forecast for 2016 Non-OPEC supply Non-OPEC oil supply in 2016 is expected to contract by 0.38 mb/d over the current year to average 57.14 mb/d. It has been revised down by 0.25 mb/d from the previous MOMR. This revision is due to downward revisions in some countries’ production forecasts as mentioned in the table below, mostly due to the expected higher declines. The weak growth trend estimated in some countries for 2015 is expected to persist, leading to a contraction in 2016, which is supported by declines from the OECD at -0.25 mb/d and FSU at -0.19 mb/d. Table 5.4: 2016 non-OPEC supply growth revision from November MOMR, mb/d
On a regional basis, OECD Americas will decline by 0.18 mb/d, OECD Europe by 0.07 mb/d, the Middle East at 0.02 mb/d, Africa by 0.03 mb/d and FSU by 0.19 mb/d in 2016. The other regions – Other Asia, Latin America and China – are expected to be the main contributors of non-OPEC incremental growth with 0.06 mb/d, 0.03 mb/d and 0.01 mb/d, respectively. Oil production in OECD Asia Pacific is forecast to be stagnant in 2016. Table 5.5: Non-OPEC oil supply in 2016, mb/d
MOMR MOMRNov 15 Dec 15 Revision
US -0.06 -0.17 -0.11UK 0.00 -0.05 -0.04Mexico -0.09 -0.13 -0.04Kazakhstan -0.03 -0.06 -0.03Australia 0.04 0.02 -0.02
Total non-OPEC supply -0.13 -0.38 -0.25
Source: OPEC Secretariat.
Change2015 1Q16 2Q16 3Q16 4Q16 2016 16/15
Americas 20.74 20.43 20.47 20.53 20.79 20.56 -0.18 of which US 13.77 13.46 13.57 13.60 13.77 13.60 -0.17Europe 3.70 3.71 3.61 3.54 3.68 3.63 -0.07Asia Pacific 0.46 0.45 0.47 0.47 0.45 0.46 0.00Total OECD 24.90 24.60 24.54 24.54 24.91 24.65 -0.25
Other Asia 3.55 3.56 3.60 3.65 3.66 3.62 0.06Latin America 5.19 5.13 5.16 5.23 5.35 5.22 0.03Middle East 1.25 1.24 1.24 1.23 1.22 1.23 -0.02Africa 2.34 2.32 2.32 2.31 2.29 2.31 -0.03Total DCs 12.33 12.25 12.32 12.42 12.52 12.38 0.04
FSU 13.60 13.53 13.36 13.32 13.42 13.41 -0.19 of which Russia 10.77 10.75 10.67 10.66 10.73 10.70 -0.06Other Europe 0.13 0.13 0.13 0.13 0.13 0.13 0.00China 4.36 4.35 4.36 4.37 4.42 4.37 0.01Total "Other regions" 18.09 18.01 17.86 17.82 17.97 17.91 -0.18Total Non-OPEC production 55.33 54.85 54.72 54.78 55.40 54.94 -0.39Processing gains 2.19 2.20 2.20 2.20 2.20 2.20 0.01
Total non-OPEC supply 57.51 57.05 56.92 56.98 57.60 57.14 -0.38Previous estimate 57.24 56.98 56.87 56.94 57.64 57.11 -0.13Revision 0.28 0.07 0.05 0.04 -0.04 0.03 -0.25

World Oil Supply
OPEC Monthly Oil Market Report – December 2015 61
On a quarterly basis, non-OPEC oil supply in 2016 is projected to stand at 57.05 mb/d, 56.92 mb/d, 56.98 mb/d and 57.60 mb/d, respectively. The forecast for non-OPEC supply in 2016 is associated with a high level of risk. OECD Total OECD oil supply in 2016 is expected to decline by 0.25 mb/d to average 24.65 mb/d, an upward revision in absolute supply by 10 tb/d, while the growth was revised down by 0.21 mb/d from the last MOMR. The y-o-y decline in the OECD in 2016 is expected to come from OECD Americas by 180 tb/d and OECD Europe by 70 tb/d, while OECD Asia Pacific is expected to remain unchanged compared to the previous year. On a quarterly basis, total OECD supply in 2016 is estimated to average 24.60 mb/d, 24.54 mb/d, 24.54mb/d and 24.91 mb/d, respectively. OECD Americas OECD Americas’ oil supply in 2016 is estimated to average 20.56 mb/d, showing a decline of 180 tb/d y-o-y and representing a decline of 0.83 mb/d from the expected growth in 2015. The US and Mexico are both expected to see declines, while Canada’s supply is forecast to grow by 0.12 mb/d. On a quarterly basis, OECD Americas’ oil supply in 2016 is expected to average 20.43 mb/d, 20.47 mb/d, 20.53 mb/d and 20.79 mb/d, respectively. US US total oil supply is anticipated to decline by 0.17 mb/d to average 13.60 mb/d in 2016, representing a decline of 0.98 mb/d from the expected growth of 0.81 mb/d in 2015. US liquids production for 2016, based on 2015 output assumptions, is shown in the Table 5.6 and Graph 5.22. Table 5.6: US liquids production breakdown in 2014-2016
According to US field development in onshore fields both conventional and tight oil as well as new project startups in GOM in 2016, assuming the latest output trend in 3Q15, US total liquids production is expected to decline by 0.17 mb/d in the next year. The breakdown indicates that the main component of US oil output – tight crude – will decline from the last estimated growth of around 0.44 mb/d in 2015 to contract by
2014 2015* Change 2016** Change 2014mb/d mb/d Y-o-y, tb/d mb/d Y-o-y, tb/d share
Unconventional sourcesTight crude 3.96 4.40 436 4.23 -170Unconventional NGL 1.59 1.78 190 1.75 -30 6.79 mb/dBiofuels + Other liquids 1.24 1.26 20 1.26 0 52%
Conventional sourcesConv. NGL 1.42 1.45 30 1.45 0Gulf of Mexico crude 1.40 1.57 170 1.67 100 6.17 mb/dConventional crude 3.36 3.32 -40 3.25 -70 48%
12.96 13.77 810 13.60 -170
* 2015 = estimate and 2016 = forecast.Sources: EIA and OPEC Secretariat.
Production type
US total liquids production

World Oil Supply
62 OPEC Monthly Oil Market Report – December 2015
0.17 mb/d in 2016, affected by the low oil price environment. Out of total new planned oil production capacity from six new projects expected to come on stream in 2016 in GOM, only 100 tb/d are expected to be added to GOM’s output in the next year. Production of NGLs from unconventional sources of tight formations and conventional crude oil particularly in Alaska are also expected to decline by 30 tb/d and 70 tb/d in 2016, respectively. A total of 19 permits were issued in GOM in October 2015, up from 13 in September, but down from 21 a year ago; eight permits were issued for new wells, including three deepwater, four midwater and one ultra-deepwater. Five permits were issued for side tracks while six were issued for bypasses and eight for new wells. A total of 154 new permits have been issued y-t-d, down 42% versus 2014, driven by sharply lower bypass and new well permits. Only 58 new well permits have been issued y-t-d, compared with 105 as of this time last year. While the number of ultra-deepwater and midwater new well permits has been largely resilient over the past year, only 18 deepwater and 12 shallow-water new well permits have been issued y-t-d, down 18% and 76%, respectively, from a year ago. Meanwhile, the number of new oil and gas exploration plans filed in GOM was steady month-to-month, with operators filing five plans to drill a total of 22 wells, versus five plans to drill 14 wells in September. No development plans were filed to drill in October, and development of the Lower Tertiary appears to remain a long ways off as the industry has filed few development plans y-t-d. Graph 5.22: Trend of US oil production components, 2005 - August 2015
On a quarterly basis, total US supply in 2016 is estimated to average 13.46 mb/d, 13.57 mb/d, 13.60 mb/d and 13.77 mb/d, respectively. Canada and Mexico Oil supply in Canada is expected to grow by 0.12 mb/d in 2016 to average 4.48 mb/d y-o-y, a decline of 20 tb/d from the initial forecast. This is partially due to higher expected declines in conventional output and uncertainties over the materialization of new projects. Around 0.2 mb/d − mostly from project ramp-ups, new oil sands production from the 28 tb/d Mackay River phase 1 and some other small projects, such as Foster Creek phase G, Edam East and West, Vawm and Jackfish − are expected to come on stream in 2016.
02,0004,0006,0008,000
10,00012,00014,00016,000
2005 2006 2007 2008 2009 2010 2011 2012 2013 2014 2015
tb/d
Conventional crude Gulf of Mexico crude Other NGL
Biofuels + other liquids Unconventional NGL Tight crude
Sources: EIA and OPEC Secretariat.
Conventionalsources
(48%)
Unconventionalsources
(52%)

World Oil Supply
OPEC Monthly Oil Market Report – December 2015 63
On a quarterly basis, total Canadian oil supply on 2016 is estimated to average 4.45 mb/d, 4.44 mb/d, 4.47 mb/d and 4.57 mb/d, respectively. Mexican oil production in 2016 is expected to decline at a slower pace of 130 tb/d to average 2.47 mb/d, compared to the expected heavy decline of 0.21 mb/d in 2015. On a quarterly basis, total Mexican oil supply in 2016 is estimated to average 2.52 mb/d, 2.45 mb/d, 2.46 mb/d and 2.53 mb/d, respectively. OECD Europe Total OECD Europe oil supply is expected to decline by 70 tb/d to average 3.63 mb/d in 2016, a decrease of 60 tb/d from the initial forecast. This is mainly due to the downward revision in Norway and the UK’s future output. OECD Europe is estimated to see quarterly oil supply in 2016 of 3.71 mb/d, 3.61 mb/d, 3.54 mb/d and 3.68 mb/d, respectively. Norway’s oil supply is expected to grow by 20 tb/d from the previous year to average 1.94 mb/d in 2016. Around 0.24 mb/d is expected to be added at the peak to Norway’s 2016 production mostly through project ramp-ups, for example from Gudrun, Aasgard LP, Valemo, the infill drilling project of Troll, Goliat, Knarr and other small schemes. There are only two projects scheduled to start in 2016 (totalling 51 tb/d), including the Edward Grieg field, which started production in late November 2015. Field maintenance will likely be heavier than in 2015, when it saw some of the lowest levels on record. Moreover, lower maintenance capex is likely to result in higher base declines. Also, production will be suspended at Njord Future Projects’ fields in 2Q16, and are due to resume in 2019, with the Njord A facility to be towed ashore in the summer. Norway sees 2015 oil investment falling y-o-y by 11.3%, 2016 falling by 8.1% and 2017 falling by 5.5% (NOK terms). While output in 1H16 will benefit from late 2015 startups—namely Goliat and Edvard Grieg, negligible new additions along with reduced infill drilling will probably lead to output declines in 2H16, which will likely accelerate in 2017. On a quarterly basis, total Norwegian oil supply in 2016 is estimated to average 1.96 mb/d, 1.93 mb/d, 1.90 mb/d and 1.96 mb/d, respectively. The UK’s oil production in 2016 is expected to decline by 50 tb/d compared to higher-than-expected growth in 2015, averaging 0.91 mb/d, revised down by 50 tb/d due to a base change in 2015. It is expected that around 0.15 mb/d of new volume will be added from oil field ramp-ups as well as from new small production sites, such as Cygnus, Alder, Stella, Cayley, Shaw, Barra, Morrone, Ythan and Aviat as they come on stream, supporting output growth next year. However, a higher base, heavier maintenance next year and accelerating decline rates will keep production declining in 2016. On a quarterly basis, total UK oil supply in 2016 is estimated to average 0.94 mb/d, 0.88 mb/d, 0.86 mb/d and 0.95 mb/d, respectively. OECD Asia Pacific OECD Asia Pacific’s oil supply is expected to be stagnant in 2016 with an average of 0.46 mb/d, a downward revision of 20 tb/d from the last MOMR. Australia’s oil supply will grow by 20 tb/d to average 0.41 mb/d.

World Oil Supply
64 OPEC Monthly Oil Market Report – December 2015
On a quarterly basis, total OECD Asia Pacific oil supply in 2016 is estimated to average 0.45 mb/d, 0.47 mb/d, 0.47 mb/d and 0.45 mb/d, respectively. Developing Countries Total DCs’ oil output will grow by 40 tb/d to average 12.38 mb/d in 2016, unchanged from the last MOMR. On a quarterly basis, total DCs’ oil supply in 2016 is estimated to average 12.25 mb/d, 12.32 mb/d, 12.42 mb/d and 12.52 mb/d, respectively. Other Asia’s oil production is predicted to increase by 60 tb/d in 2016 to average 3.62 mb/d, with growth revised down by 10 tb/d from the last MOMR. Oil output in Malaysia, Indonesia and Asia others is expected to increase, while production in Vietnam and Brunei is forecast to decline. Oil production in India and Thailand is slated to be stagnant during the year. On a quarterly basis, Other Asia’s oil supply in 2016 is expected to stand at 3.56 mb/d, 3.60 mb/d, 3.65 mb/d and 3.66 mb/d, respectively. Latin America’s oil supply is estimated to grow by 30 tb/d to average 5.22 mb/d in 2016, a downward revision of 10 tb/d from the last MOMR. Latin America has been the second-highest driver of growth in recent years among all non-OPEC regions, but due to few Brazilian projects coming online in 2016, remarkable growth is not foreseen. Despite this, Brazil is still forecast to be the main driver of growth in this region in 2016, while oil production in other Latin American countries is expected to decline. On a quarterly basis, Latin America’s oil supply in 2016 is expected to stand at 5.13 mb/d, 5.16 mb/d, 5.23 mb/d and 5.35 mb/d, respectively. The pace of growth in Brazil is expected to slow substantially in 2016 by 0.11 mb/d to average 3.17 mb/d as the pullback in investment in the mature Campos Basin by Petrobras weighs, along with an already high base. In fact, some of the largest fields in the Campos region are already registering steep declines. For example, the Marlin field, which produced 0.24 mb/d in 2014, has declined by more than 30% in 2015, which was partly maintenance-related. Nineteen new production units will be installed in the Santos Basin pre-salt area by the end of 2018. Between January 2013 and March 2014 alone, Petrobras made 49 new discoveries, including 15 in pre-salt. Petrobras’ strong results in pre-salt exploration are due to its in-depth knowledge and technological excellence in ultra-deep water exploration. To illustrate the challenges facing Petrobras, in its 3Q15 earnings call earlier today, the company signaled further reductions to upstream activity that are likely to result in delays to projects scheduled to startup next year. The company indicated it is reducing its fleet of drill ships and platforms as contracts expire and is cutting its 2016 well drilling programme. The company indicated it may have to adjust its 2020 production outlook, which is currently set at 2.8 mb/d following a 1.4 mb/d cut already made at the end of June. At present, three projects are due to startup next year with a combined capacity of 0.38 mb/d — two in 1Q16 and one in 3Q16. The wording of the announcement is vague but suggests more than one project may be delayed. If several startups are delayed into 2017, then it will have significant consequences for Brazilian production next year, particularly as only one project came on stream this year (the 0.15 mb/d

World Oil Supply
OPEC Monthly Oil Market Report – December 2015 65
FPSO Cidade de Itaguai in Iracema Norte in August), compared to four in 2014 (total 0.66 mb/d). Any delays to new projects will come at a time when decline rates at existing fields step-up due to sharp reductions in maintenance capex. If some or all of the three planned startups do not come online as planned, then Brazil may struggle to record any growth at all. Brazil’s biofuel production is expected to grow by only 20 tb/d in 2016, although average production in 2015 will reach 0.58 mb/d, indicating 40 tb/d growth. On a quarterly basis, oil supply in Brazil in 2016 is expected to stand at 3.07 mb/d, 3.11 mb/d, 3.22 mb/d and 3.29 mb/d, respectively. Middle East oil supply is estimated to decrease by 20 tb/d in 2016 from the previous year to average 1.23 mb/d, revised down by 10 tb/d from the last MOMR due to a better production performance and the expected growth of 10 tb/d for the next year in Oman. There is no expectation for growth or decline in oil supply in Bahrain and Syria, while oil output in Yemen is expected to decline by 30 tb/d in 2016. Moreover, the Middle East supply forecast is associated with a very high level of risk, mainly due to political factors, which could dramatically change the outlook in either direction. On a quarterly basis, Middle East oil supply in 2016 is seen to average 1.24 mb/d, 1.24 mb/d, 1.23 mb/d and 1.22 mb/d, respectively. Africa’s oil supply is projected to decline by 30 tb/d to average 2.31 mb/d in 2016 y-o-y, unchanged from last month’s prediction. Oil production in Congo and Africa others is expected to grow, while others are forecast to decline, with the exception of South Africa, which should remain steady. On a quarterly basis, Africa’s oil supply in 2016 is forecast to average 2.32 mb/d, 2.32 mb/d, 2.31 mb/d and 2.29 mb/d, respectively. FSU and other regions Total FSU oil supply is expected to decline by 0.19 mb/d in 2016 to average 13.41 mb/d, revised down by 30 tb/d from the last MOMR. Oil production in Russia, Kazakhstan, Azerbaijan and FSU others will decrease in 2016. On a quarterly basis, total FSU oil supply in 2016 is seen to average 13.53 mb/d, 13.36 mb/d, 13.32 mb/d and 13.42 mb/d, respectively. Russian oil supply is expected to decrease by 0.06 mb/d to average 10.70 mb/d in 2016. On a quarterly basis, total oil supply from Russia in 2016 is seen to average 10.75 mb/d, 10.67 mb/d, 10.66 mb/d and 10.73 mb/d, respectively. Caspian Oil production in Kazakhstan is forecast to decline by 60 tb/d to average 1.53 mb/d in 2016, a downward revision of 30 tb/d from last month’s prediction. Different sources have said that the giant Kashagan project is unlikely to start production before mid-2017. Azerbaijan’s oil production is predicted to decline by 40 tb/d to average 0.82 mb/d in 2016, unchanged since the last MOMR. Lower prices are likely to accelerate declines in Azeri production in 2016 compared to 2015.

World Oil Supply
66 OPEC Monthly Oil Market Report – December 2015
FSU others’ oil production, mainly in Turkmenistan, will decline by 30 tb/d in 2016 to average 0.36 mb/d. Other Europe’s oil supply is estimated to remain flat from 2012 to average 0.14 mb/d and continue at this level in 2016. China China’s oil supply is expected to grow by 10 tb/d over the previous year to average 4.37 mb/d in 2016. Expected growth was revised down by 10 tb/d from the last MOMR. With sharp capex cutbacks, particularly by Sinopec and PetroChina, output is set to decline in these two companies’ operations in 2016. On a quarterly basis, total oil supply from China in 2016 is seen to average 4.35 mb/d, 4.36 mb/d, 4.37 mb/d and 4.42 mb/d, respectively. OPEC NGLs and non-conventional oils Output of OPEC natural gas liquids (NGLs) and non-conventional liquids is estimated to average 5.99 mb/d in 2015, representing growth of 0.16 mb/d over the previous year and revised down by 30 tb/d compared to the last estimations. In 2016, production of OPEC NGLs and non-conventional liquids is projected to average 6.16 mb/d, an increase of 0.17 mb/d over 2015, unchanged in growth from the last month’s forecast. Table 5.7: OPEC NGLs + non-conventional oils, 2013-2016
Change Change Change2013 2014 14/13 1Q15 2Q15 3Q15 4Q15 2015 15/14 2016 16/15
Total OPEC 5.65 5.83 0.18 5.86 5.94 6.01 6.13 5.99 0.16 6.16 0.17

World Oil Supply
OPEC Monthly Oil Market Report – December 2015 67
OPEC crude oil production According to secondary sources, total OPEC crude oil production in November increased by 0.23 mb/d over the previous month to average 31.70 mb/d. Crude oil output increased mostly in Iraq, by around 248 tb/d, to average 4.3 mb/d. According to secondary sources, November OPEC crude oil production, not including Iraq, stood at 27.39 mb/d, a decrease of 17 tb/d over the previous month. Table 5.8: OPEC crude oil production based on secondary sources, tb/d
Table 5.9: OPEC crude oil production based on direct communication, tb/d
2013 2014 1Q15 2Q15 3Q15 Sep 15 Oct 15 Nov 15 Nov/OctAlgeria 1,159 1,151 1,112 1,107 1,109 1,113 1,113 1,113 0.0Angola 1,738 1,660 1,746 1,716 1,759 1,756 1,736 1,760 24.4Ecuador 516 542 551 546 541 544 545 548 2.9Iran, I.R. 2,673 2,766 2,779 2,828 2,860 2,869 2,876 2,876 0.0Iraq 3,037 3,265 3,454 3,868 4,159 4,208 4,060 4,307 247.5Kuwait 2,822 2,774 2,748 2,726 2,721 2,732 2,696 2,722 25.9Libya 928 473 382 450 381 373 426 405 -20.9Nigeria 1,912 1,911 1,886 1,814 1,860 1,923 1,950 1,925 -24.7Qatar 732 716 679 667 659 665 668 668 0.0Saudi Arabia 9,586 9,683 9,809 10,253 10,266 10,197 10,155 10,130 -25.2UAE 2,741 2,761 2,817 2,838 2,880 2,882 2,872 2,872 0.0Venezuela 2,389 2,373 2,367 2,376 2,368 2,365 2,369 2,369 0.0
Total OPEC 30,231 30,075 30,330 31,190 31,562 31,627 31,465 31,695 230.1OPEC excl. Iraq 27,194 26,809 26,877 27,322 27,403 27,420 27,406 27,388 -17.5
Totals may not add up due to independent rounding.
2013 2014 1Q15 2Q15 3Q15 Sep 15 Oct 15 Nov 15 Nov/OctAlgeria 1,203 1,193 1,141 1,147 1,159 1,163 1,172 1,181 9.0Angola 1,701 1,654 1,766 1,784 1,777 1,806 1,762 1,722 -40.0Ecuador 526 557 550 544 538 539 538 .. ..Iran, I.R. 3,576 3,117 3,017 3,103 3,170 3,200 3,280 3,310 30.0Iraq 2,980 3,110 3,064 3,351 3,744 3,755 3,659 3,747 88.0Kuwait 2,922 2,867 2,850 2,838 2,870 2,900 2,800 2,900 100.0Libya 993 480 411 .. .. .. .. .. ..Nigeria 1,754 1,807 1,762 1,622 1,780 1,818 1,812 1,607 -205.3Qatar 724 709 687 647 640 663 660 683 23.2Saudi Arabia 9,637 9,713 9,878 10,401 10,285 10,226 10,276 10,186 -89.9UAE 2,797 2,794 2,948 2,973 3,030 3,002 2,971 3,033 61.5Venezuela 2,786 2,683 2,722 2,683 2,631 2,595 2,601 2,587 -13.4
Total OPEC 31,599 30,682 30,793 .. .. .. .. .. ..OPEC excl. Iraq 28,619 27,572 27,729 .. .. .. .. .. ..
Totals may not add up due to independent rounding... Not availab le.

World Oil Supply
68 OPEC Monthly Oil Market Report – December 2015
World oil supply Preliminary data indicates that global oil supply increased by 0.37 mb/d to average 95.58 mb/d in November, compared to the previous month. The increase was due to growth of 0.14 mb/d in non-OPEC supply and 0.23 mb/d in OPEC crude production. According to Baker Hughes, the rotary rig count in North America declined by 37 rigs while it increased by 16 rigs in the Middle East in November 2015, m-o-m. The number of world’s active rotary drilling rigs decreased by 39 rigs to 2,047 rigs m-o-m, in November 2015, while it dropped by 1,623 rigs from last November. Since 2008, the share of OPEC crude in global supply has declined. However, the first 11 months of 2015 show an average of 32.9%, higher by 0.4 pp than the previous year. This share reached at 33.2% in November 2015. Estimates are based on preliminary data for non-OPEC supply and OPEC NGLs, while OPEC crude production is reported according to secondary sources. Graph 5.23: OPEC and world oil supply
89
90
91
92
93
94
95
96
25
26
27
28
29
30
31
32
Dec
13
Jan
14
Feb
14
Mar
14
Apr
14
May
14
Jun
14
Jul 1
4
Aug
14
Sep
14
Oct
14
Nov
14
Dec
14
Jan
15
Feb
15
Mar
15
Apr
15
May
15
Jun
15
Jul 1
5
Aug
15
Sep
15
Oct
15
Nov
15
mb/dmb/d
OPEC crude production (LHS) World supply (RHS)

Product Markets and Refinery Operations
OPEC Monthly Oil Market Report – December 2015 69
Product Markets and Refinery Operations Product markets in the Atlantic Basin strengthened in November on the back of positive performance at the top of the barrel. Gasoline and naphtha were supported by strong regional demand amid export opportunities, thus supporting margins and offsetting the lack of winter support. Meanwhile, Asian margins exhibited a strong recovery on the back of higher winter seasonal demand for heating fuels in the region and stronger petrochemical sector support at the top of the barrel. Graph 6.1: Refinery margins, 2014-2015
US product markets strengthened slightly during November despite pressure from the supply side with refineries increasing runs and inventories on the high side. Stronger gasoline demand amid some temporary tightening sentiment lent support to the top of the barrel, which offset the weakening seen at the middle of the barrel due to the lack of winter support, allowing the margins to recover. The positive performance seen at the top of the barrel, along with export opportunities to Latin America allowed the USGC refinery margin for WTI crude to gain 50¢ to average around $3.3/b in November. Meanwhile, the margins for Light Louisiana Sweet (LLS) crude averaged $7/b in November, continuing at a similar level seen in the previous month. Product markets in Europe exhibited a recovery in November on the back of strong gasoline demand and tightening sentiment along with strong export opportunities to the petrochemical sector, giving support to the top of the barrel. In addition, the middle distillates market exhibited a recovery on the back of a balanced market with reduced inflows into the region. The refinery margin for Brent crude in Northwest Europe showed a sharp gain of more than $2 versus the previous month to average $5/b in November. Asian product markets showed a recovery during November on the back of stronger winter seasonal demand, which lent support to middle distillate crack spreads. This, along with the positive performance seen in naphtha with the healthier petrochemical sector in the region, allowed refinery margins to strengthen. Refinery margins in Singapore increased by $2 to average $6.7/b in November.
-5
0
5
10
15
20
-5
0
5
10
15
20
Nov
14
Dec
14
Jan
15
Feb
15
Mar
15
Apr 1
5
May
15
Jun
15
Jul 1
5
Aug
15
Sep
15
Oct
15
Nov
15
US$/bUS$/b
WTI (US Gulf) Arab Heavy (US Gulf) Brent (Rotterdam)Dubai (Singapore) LLS (US Gulf)

Product Markets and Refinery Operations
70 OPEC Monthly Oil Market Report – December 2015
Refinery operations Refinery utilization rates returned to a rising trend worldwide following the peak of the heavy maintenance season in several regions during October, which put more than 8 mb/d of capacity offline during the month. Refinery utilization in the US averaged above 90% in November, corresponding to 16.1 mb/d, a level that is 650 tb/d higher than a month earlier. This recovery in the refinery runs was mainly in the USGC and mid-continent. Higher refinery runs have caused product inventories to be on the rise again, thus keeping the market under pressure. Graph 6.2: Refinery utilisation rates, 2014-2015
European refinery runs averaged around 90.6% of refining capacity in October, corresponding to a throughput of 10.6 mb/d, up by 20 tb/d from the previous month, and more than 450 tb/d higher than the same month a year ago. European refineries have continued to increase throughputs, taking advantage of healthy margins and export opportunities. Asian refinery utilization dropped during October with refinery turnarounds in several countries, however, since mid-November, some of them are back online. Chinese independent refineries have reportedly been increasing runs above 80 pct despite only being allowed to serve the domestic market. Refinery runs in Singapore for October averaged around 80%, around 3 pp lower than a month earlier. Meanwhile, Japanese throughputs increased to 81% of capacity in November, which is around 3 pp higher than a month ago. With the end of autumn maintenance approaching in the region, refinery runs should be on the rise to catch up with the seasonal increase in demand in the coming months. US market US gasoline demand stood at around 9.2 mb/d in November, around 40 tb/d lower than the previous month and 240 tb/d higher than in the same month a year earlier. US gasoline demand remained stronger y-o-y, allowing the gasoline crack spread to strengthen despite pressure from the supply side with refineries increasing runs following the maintenance season and inventories on the rise amid several secondary units resuming operations after the resolution of some operational issues both in the Midwest and the US Gulf Coast (USGC).
60
70
80
90
100
60
70
80
90
100
Nov
14
Dec
14
Jan
15
Feb
15
Mar
15
Apr 1
5
May
15
Jun
15
Jul 1
5
Aug
15
Sep
15
Oct
15
Nov
15
%%
US EU-16 Japan Singapore

Product Markets and Refinery Operations
OPEC Monthly Oil Market Report – December 2015 71
Some support came from temporary tightening sentiment fueled by the prolonged maintenance activities at Irving Oil’s St. John refinery in Eastern Canada. Additional support came from export opportunities to Latin America, mainly to Mexico, with rising seasonal demand. The gasoline crack spread gained more than $1 versus the previous month’s level to average $18.4/b in November. Graph 6.3: US Gulf crack spread vs. WTI, 2014-2015
Middle distillate demand stood at around 3.9 mb/d in November, around 100 tb/d lower than in the previous month and around 100 tb/d lower than in the same month a year earlier. The middle distillate market continued to be pressured from the supply side with increased production amid high inventories. Middle distillate inventories recovered their upward trend with an increase of around 4 mb during the month of November, thus remaining above the five-year average level and keeping pressure on the market. The demand side has not supported the market as the end of the harvest season has been pressuring demand in the US midcontinent. Meanwhile, heating fuel demand remained thin in the US East Coast (USEC) where warm weather has dented heating oil demand. The USGC gasoil crack lost 50¢ versus the previous month to average around $11.6 /b in November. At the bottom of the barrel, the fuel oil market recovered some ground in November on the back of stronger domestic demand, mainly as refinery feedstock for secondary units in the USGC boosted demand for vacuum gasoil (VGO) amid the return of several catalytic cracker units. The fuel oil crack on the USGC gained more than $1 in November. Demand of fuel oil from Mexico has been reported on the rise while, in South America, it has been slowing with the Brazilian fuel oil demand weakened due to falling power
-10
0
10
20
30
40
50
60
-10
0
10
20
30
40
50
60
Nov
14
Dec
14
Jan
15
Feb
15
Mar
15
Apr
15
May
15
Jun
15
Jul 1
5
Aug
15
Sep
15
Oct
15
Nov
15
US$/bUS$/b
Prem.Gasoline Unl.93 Jet/Kero Gasoil/Diesel (0.05%S) Fuel oil (180c)
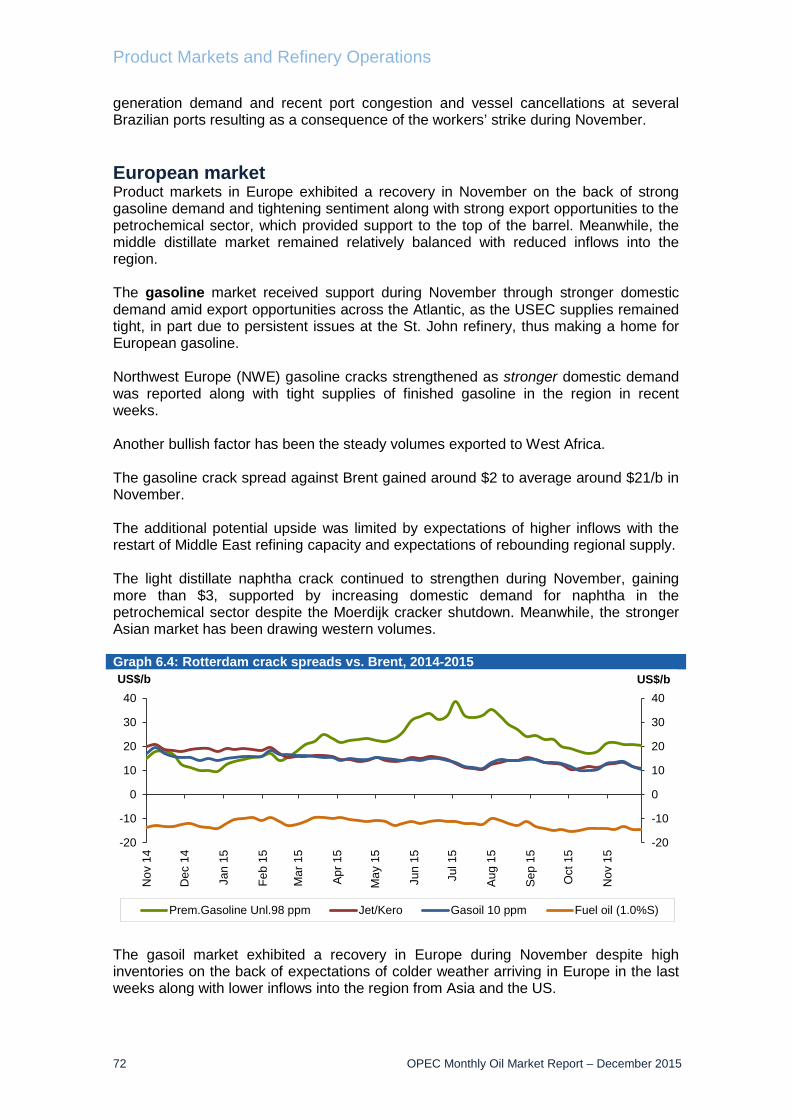
Product Markets and Refinery Operations
72 OPEC Monthly Oil Market Report – December 2015
generation demand and recent port congestion and vessel cancellations at several Brazilian ports resulting as a consequence of the workers’ strike during November. European market Product markets in Europe exhibited a recovery in November on the back of strong gasoline demand and tightening sentiment along with strong export opportunities to the petrochemical sector, which provided support to the top of the barrel. Meanwhile, the middle distillate market remained relatively balanced with reduced inflows into the region. The gasoline market received support during November through stronger domestic demand amid export opportunities across the Atlantic, as the USEC supplies remained tight, in part due to persistent issues at the St. John refinery, thus making a home for European gasoline. Northwest Europe (NWE) gasoline cracks strengthened as stronger domestic demand was reported along with tight supplies of finished gasoline in the region in recent weeks. Another bullish factor has been the steady volumes exported to West Africa. The gasoline crack spread against Brent gained around $2 to average around $21/b in November. The additional potential upside was limited by expectations of higher inflows with the restart of Middle East refining capacity and expectations of rebounding regional supply. The light distillate naphtha crack continued to strengthen during November, gaining more than $3, supported by increasing domestic demand for naphtha in the petrochemical sector despite the Moerdijk cracker shutdown. Meanwhile, the stronger Asian market has been drawing western volumes. Graph 6.4: Rotterdam crack spreads vs. Brent, 2014-2015
The gasoil market exhibited a recovery in Europe during November despite high inventories on the back of expectations of colder weather arriving in Europe in the last weeks along with lower inflows into the region from Asia and the US.
-20
-10
0
10
20
30
40
-20
-10
0
10
20
30
40
Nov
14
Dec
14
Jan
15
Feb
15
Mar
15
Apr
15
May
15
Jun
15
Jul 1
5
Aug
15
Sep
15
Oct
15
Nov
15
US$/bUS$/b
Prem.Gasoline Unl.98 ppm Jet/Kero Gasoil 10 ppm Fuel oil (1.0%S)

Product Markets and Refinery Operations
OPEC Monthly Oil Market Report – December 2015 73
Arrivals from the US have been limited as arbitrage is working better for the Caribbean and South America. Meanwhile, the strengthening seen in Singapore gasoil crack spreads has encouraged more Asian barrels to remain within the East of Suez. ARA hub gasoil inventories have remained at record-high levels, fuelling bearish sentiment to the market, however rising water levels on the Rhine allowed more products to flow inland, easing the pressure in the last weeks. The gasoil crack spread against Brent crude at Rotterdam gained around $2 versus the previous month to average around $13/b in November. At the bottom of the barrel, despite lower domestic demand, the fuel oil market showed a slight recovery as VGO requirements for cracking units in the US and Europe along with some arbitrage to Asia lent some support to the fuel oil market. The NWE fuel oil crack recovered 60¢ versus the previous month’s level to average around minus $14/b in November. The fuel oil market continued to be pressured by bearish fundamentals with ARA inventories on the high side amid increasing Russian exports. Asian market The Asian market showed a positive performance during November supported by strong demand seen at the top of the barrel. In addition, increasing requirements for seasonal heating provided a boost to winter demand. Furthermore, the maintenance season was still impacting some countries in the region, resulting in tightening sentiment in the market. The gasoline market remained supported on the back of strong demand in several countries, such as in Vietnam and India, thus offsetting the lower buying interest seen in Indonesia, which has seen an increase in domestic gasoline output with the start-up of new refining facilities during the last months. Singapore’s gasoline crack remained almost flat during November in a relatively balanced market with the tightening environment being fuelled by the maintenance season, which is still impacting some countries in the region such as Taiwan, where conversion units remained with limited gasoline production, although this situation is expected to ease in the coming weeks with the end of maintenance. The gasoline crack spread against Dubai crude in Singapore averaged around $14.7/b in November, a similar level to the previous month. The Singapore naphtha crack continued to improve over the month, gaining more than $4/b, supported by stronger demand from the petrochemical sector, with several cracker units returning from maintenance amid naphtha’s discount versus LPG, which continued to widen significantly, thus encouraging feedstock switching, which is typical at this time of the year.

Product Markets and Refinery Operations
74 OPEC Monthly Oil Market Report – December 2015
Graph 6.5: Singapore crack spread vs. Dubai, 2014-2015
At the middle of the barrel, the gasoil market exhibited a vibrant recovery during November as the market was supported by strong regional winter gasoil requirements amid tightening sentiment fuelled by the maintenance season. Additional support came from strong demand reported from Vietnam and the higher gasoil requirements for post-monsoon industrial activity in India and Pakistan. The gasoil crack spread in Singapore against Dubai gained more than $2 versus the previous month to average around $17/b in November. The additional gains were capped by reduced arbitrage to Europe, causing some cargoes to be diverted from South Korea to Singapore. In the Asian fuel oil market, support came from the continued drop in Singapore’s inventories amid expectations of slower inflows into the region, with delays being reported in the arrival of several cargoes and the Middle Eastern fuel oil balance being seasonally tightened. Additional support came from stronger demand reported from South Korea, which offset falling demand in Japan. The fuel oil crack spread in Singapore against Dubai recovered around $2 to average approximately minus $6.6/b in November.
-20
-10
0
10
20
30
-20
-10
0
10
20
30N
ov 1
4
Dec
14
Jan
15
Feb
15
Mar
15
Apr
15
May
15
Jun
15
Jul 1
5
Aug
15
Sep
15
Oct
15
Nov
15
US$/bUS$/b
Prem.Gasoline Unl.92 Jet/Kero Gasoil 50 ppm Fuel oil 180 CST

Product Markets and Refinery Operations
OPEC Monthly Oil Market Report – December 2015 75
Table 6.1: Refined product prices, US$/b
Table 6.2: Refinery operations in selected OECD countries
Change ChangeSep 15 Oct 15 Nov 15 Nov/Oct Sep 15 Oct 15 Nov 15 Nov/Oct
US 16.20 15.48 16.13 0.65 90.66 86.68 90.30 3.62France 1.24 1.26 - - 82.27 83.53 - -Germany 1.86 1.90 - - 82.86 84.37 - -Italy 1.34 1.31 - - 65.40 63.88 - -UK 1.17 1.18 - - 88.59 89.28 - -Euro-16 10.58 10.60 - - 90.39 90.57 - -Japan 3.24 3.07 3.18 0.11 82.16 77.68 80.57 2.89
Sources: OPEC statistics, Argus, Euroilstock inventory report, IEA, EIA/DoE, METI and PAJ.
Refinery throughput, mb/d Refinery utilization, %
ChangeOct 15 Nov 15 Nov/Oct 2014 2015
Naphtha* 52.62 52.78 0.16 104.92 60.60Premium gasoline (unleaded 93) 63.27 61.03 -2.25 123.52 79.90Regular gasoline (unleaded 87) 55.00 52.76 -2.24 112.33 69.37Jet/Kerosene 59.28 56.67 -2.61 117.41 66.42Gasoil (0.2% S) 58.24 54.30 -3.95 115.03 65.68Fuel oil (1.0% S) 35.14 33.51 -1.63 93.81 44.92Fuel oil (3.0% S) 34.64 31.59 -3.04 85.77 42.37
Naphtha 47.36 46.13 -1.23 95.91 51.55Premium gasoline (unleaded 98) 66.73 65.27 -1.46 118.85 77.07Jet/Kerosene 59.68 56.78 -2.90 118.33 68.06Gasoil/Diesel (10 ppm) 59.23 57.06 -2.16 116.05 67.76Fuel oil (1.0% S) 33.89 30.20 -3.69 90.50 41.66Fuel oil (3.5% S) 34.43 30.68 -3.75 86.76 42.29
Naphtha 45.25 44.06 -1.19 93.49 48.72Premium gasoline** 58.98 58.77 -0.20 114.42 70.96Jet/Kerosene 57.65 55.29 -2.35 115.62 65.46Gasoil/Diesel** 61.26 65.24 3.98 116.51 70.14Fuel oil (1.0% S) 36.20 32.83 -3.37 91.43 43.42Fuel oil (3.5% S) 34.97 30.02 -4.96 86.64 42.12
Naphtha 48.92 48.95 0.02 97.87 53.30Premium gasoline (unleaded 95) 63.39 59.10 -4.29 114.53 70.48Regular gasoline (unleaded 92) 60.55 56.42 -4.14 111.69 67.37Jet/Kerosene 59.28 57.46 -1.82 115.62 66.35Gasoil/Diesel (50 ppm) 60.65 58.74 -1.91 116.99 67.85Fuel oil (180 cst 2.0% S) 38.32 36.11 -2.21 91.27 47.51Fuel oil (380 cst 3.5% S) 36.99 34.98 -2.01 89.55 45.83
Sources: Platts and Argus Media.
Year-to-date
* Barges.** Cost, insurance and freight (CIF).
US Gulf (Cargoes FOB):
Rotterdam (Barges FoB):
Mediterranean (Cargoes FOB):
Singapore (Cargoes FOB):

Tanker Market
76 OPEC Monthly Oil Market Report – December 2015
Tanker Market In November, tanker spot freight rates for both dirty and clean vessels varied. In the dirty tanker market, spot freight rates for the VLCC class were lower than in the previous month across all reported routes. Low activity, combined with ample tonnage availability during the month, drove freight rates down by 13%, on average, despite the fluctuation of rates often seen. The total number of VLCC fixtures in November was lower than the previous month. Suezmax and Aframax freight rates saw growth in November, mainly on the back of high tonnage demand and weather delays witnessed in many ports. In the clean tanker segment, spot freight rates east of Suez dropped by 4%, on average, but went up by 4% in west of Suez. Clean tanker market activity was thin in November, while chartering requirements were limited in general. The only exception was in clean freight rates for tankers operating on the Northwest Europe-to-US route, which rose by 20% as a result of severe weather delays and multiple replacements. Spot fixtures In November, OPEC spot fixtures increased by 1.2% from the previous month to average 11.71 mb/d, according to preliminary data. Higher spot fixtures were seen in the Middle East-to-West routes, which rose by 0.25 mb/d, and outside the Middle East region, where fixtures were up by 0.01 mb/d. Middle East-to-East fixtures were down from the previous month by 0.13 mb/d. Table 7.1: Tanker chartering, sailings and arrivals, mb/d
Sailings and arrivals OPEC sailings increased by 0.26 mb/d, or 1.1%, in November to stand at 24.21 mb/d, supported by an increase in Middle East sailings, which rose by a similar amount – or 1.5% over the previous month – to average 17.60 mb/d. Crude oil arrivals increased in November only at North American ports, while arrivals at European, Far Eastern and West Asian ports declined by 4.6%, 0.8% and 0.1%, respectively, compared with the previous month.
ChangeSep 15 Oct 15 Nov 15 Nov 15/Oct 15
Spot CharteringAll areas 15.76 15.99 16.58 0.59OPEC 10.97 11.57 11.71 0.14Middle East/East 5.13 5.53 5.41 -0.13Middle East/West 2.40 2.73 2.98 0.25Outside Middle East 3.44 3.31 3.33 0.01
SailingsOPEC 23.61 23.95 24.21 0.26Middle East 17.02 17.34 17.60 0.26
ArrivalsNorth America 9.93 9.79 10.56 0.77Europe 12.32 12.68 12.09 -0.59Far East 8.37 8.29 8.22 -0.07West Asia 4.85 4.81 4.81 0.00
Sources: Oil Movements and Lloyd's Marine Intelligence Unit.

Tanker Market
OPEC Monthly Oil Market Report – December 2015 77
Spot freight rates VLCC In the dirty market, VLCC spot freight rates lost 13%, on average, in November, compared with the previous month, to stand at WS57 points. This drop came as a result of lower freight rates registered on all reported routes. VLCC Middle East-to-West spot freight rates showed the highest drop, reversing the gain registered a month ago and dropping by 18% in November to stand at WS38 points. Freight rates for VLCC operating on Middle East-to-East experienced a similar decline, falling by 15% from the previous month to average WS64 points. The declines in VLCC rates were driven by low activities in several markets, despite fluctuating rates often being balanced with the total number of chartering requirements, which were below the level seen a month before. Freight rates registered for tankers trading on the West Africa-to-East route also declined, falling by 8% to average WS68 points. Despite the monthly drop in rates, VLCC spot freight rates remain 17% higher than the same month last year. Graph 7.1: Monthly averages of crude oil spot freight rates
Suezmax In contrast to VLCC performance, Suezmax spot freight rates saw gains in November from the previous month, rising on average by 11% in October, compared with the previous month, to average WS76 points, the highest Suezmax freight rate levels seen in several months. The average increase came mainly on the back of higher freight rates registered both in West Africa and Northwest Europe. Suezmax spot freight rates for tankers operating on the West Africa-to-US route increased by 9% in November to stand at WS85 points, and rates on the Northwest Europe-to-US route increased by 13% to stand at WS66 points. Freight rates for both routes benefited from a decent amount of activity, mainly seen at the beginning of the month while tonnage supply thinned. The active Suezmax market supported rates in many regions, which included the Caribbean and Mediterranean. Delays at Turkish straits and in Brazilian ports added to a temporary increase in rates before dropping as market activity waned and tanker offers increased.
20406080100120140160180
20406080
100120140160180
Nov
14
Dec
14
Jan
15
Feb
15
Mar
15
Apr
15
May
15
Jun
15
Jul 1
5
Aug
15
Sep
15
Oct
15
Nov
15
WorldscaleWorldscale
Mediterranean/Northwest Europe (Aframax) West Africa/USGC (Suezmax)Middle East/Far East (VLCC)

Tanker Market
78 OPEC Monthly Oil Market Report – December 2015
Table 7.2: Spot tanker crude freight rates, Worldscale
Aframax The Aframax class showed the highest gain in freight rates among other tanker sizes in November. Rates rose by 25% and stood at WS124 points on average. The Aframax market was active in several areas, and market activity supported Aframax rates in the Baltics and North Sea. Weather conditions and port delays seen in Italian ports and elsewhere made tonnage availability tighter in an already active market, in addition to vessels being tied up in other ports due to ullage problems. The prolonged transit time at Turkish straits further supported the gains in freight rates for this class. Spot freight rates for Aframax operating on the Caribbean-to-US route registered their highest gains over other reported routes, standing at WS171 points. This was up by 50% from one month before, mainly on the back of delays in the US Gulf, which led to a tighter positions list. Spot freight rates on the Mediterranean-to-Mediterranean and Mediterranean-to-Northwest Europe routes increased by 18% and 19%, respectively, from the previous month to stand at WS112 points and WS107 points. As seen on other routes, freight rates on the Indonesia-to-East route also increased, although to a lesser degree, as they went up by 8% compared with one month earlier to stand at WS103 points. Clean spot freight rates On average, clean tanker spot freight rates showed minimal changes from the previous month, rising by a slight WS2 points to stand at WS115 points. Medium-range tanker activity remained mostly moderate during the month, while the market in several areas was balanced. The only exception was the increase in freight rates for vessels operating on the Northwest Europe-to-US route, due to weather delays in the Caribbean, which rose by 20% compared with the previous month, to average WS122 points. Freight rates for other routes in West-of-Suez remained mostly stable, while clean spot freight rates on the Mediterranean-to-Mediterranean and Mediterranean-to-Northwest Europe routes dropped slightly by 2% each. East-of-Suez rates were mixed with no increase in activity as the market was quiet, mostly reporting no significant changes. In the East, spot freight rates for tankers operating on the Middle East-to-East route increased by WS3 points from the previous month, mainly because demand remained stable in the clean tonnage market. In contrast, freight rates on the Singapore-to-East route declined by WS10 points from one month earlier to average WS111 points in November, as chartering activity on this route remained insufficient to push rates up.
Size Change1,000 DWT Sep 15 Oct 15 Nov 15 Nov 15/Oct 15
CrudeMiddle East/East 230-280 55 76 64 -11Middle East/West 270-285 33 46 38 -8West Africa/East 260 56 74 68 -6West Africa/US Gulf Coast 130-135 67 78 85 7Northwest Europe/US Gulf Coast 130-135 55 59 66 8Indonesia/East 80-85 97 95 104 9Caribbean/US East Coast 80-85 110 114 171 57Mediterranean/Mediterranean 80-85 73 96 113 17Mediterranean/Northwest Europe 80-85 68 91 108 17
Sources: Galbraith’s tanker market report and Platts.

Tanker Market
OPEC Monthly Oil Market Report – December 2015 79
Graph 7.2: Monthly average of clean spot freight rates
Table 7.3: Spot tanker product freight rates, Worldscale
50
100
150
200
250
50
100
150
200
250N
ov 1
4
Dec
14
Jan
15
Feb
15
Mar
15
Apr
15
May
15
Jun
15
Jul 1
5
Aug
15
Sep
15
Oct
15
Nov
15
WorldscaleWorldscale
Middle East/Far East Northwest Europe/USEC Mediterranean/Mediterranean
Size Change1,000 DWT Oct 15 Oct 15 Nov 15 Nov 15/Oct 15
ProductsMiddle East/East 30-35 106 80 83 3Singapore/East 30-35 145 121 111 -11Northwest Europe/US East Coast 33-37 110 102 122 20Mediterranean/Mediterranean 30-35 137 127 125 -2Mediterranean/Northwest Europe 30-35 147 137 135 -2
Sources: Galbraith’s tanker market report and Platts.

Oil Trade
80 OPEC Monthly Oil Market Report – December 2015
Oil Trade Preliminary data for November shows that US crude oil imports increased to an average of 7.4 mb/d, up by 173 tb/d from the previous month and 60 tb/d from one year ago. US monthly product imports declined in November by 73 tb/d or 4% to average 1.6 mb/d. In an annual comparison, product imports declined by 80 tb/d. Japanese crude oil imports dropped in October by 141 tb/d or 4% to average 3.1 mb/d, and 188 tb/d or 6% y-o-y. Product imports dropped in October by 101 tb/d to average 570 tb/d, the lowest level for Japanese product imports since June 2015, reflecting a drop of 15% m-o-m, but a gain of 11% y-o-y. In October, China’s crude imports declined following higher levels in the previous month, dropping by 597 tb/d or 9% to average 6.2 mb/d. Chinese petroleum product imports also declined in October, down by 15% m-o-m, though remaining higher than the same month one year ago by 159 tb/d or 17%. India’s crude imports declined by 176 tb/d or 5% from the previous month to average 3.7 mb/d. Crude imports showed an annual drop of 147 tb/d or 4%. India’s product imports in October increased by 30 tb/d or 5% m-o-m to average 647 tb/d, while increasing y-o-y by 209 tb/d. US Preliminary data for November shows that US crude oil imports increased to an average of 7.4 mb/d, up by 173 tb/d from the previous month and 60 tb/d from one year ago. On a y-t-d basis, imports were down in November by 52 tb/d. Graph 8.1: US imports of crude and petroleum products
US monthly product imports declined in November by 73 tb/d or 4% to average 1.6 mb/d. In an annual comparison, they declined by 80 tb/d. Meanwhile, US product exports in November reached a total of 3.9 mb/d, up by 56 tb/d from a month ago. Annually, product exports were higher by 100 tb/d or 3%. As a result, US total net imports were higher by 86 tb/d than the previous month to average 4.6 mb/d, though showing a drop of 71 tb/d from the year before.
4.55.05.56.06.57.07.58.0
0.0
0.5
1.0
1.5
2.0
2.5
Nov
14
Dec
14
Jan
15
Feb
15
Mar
15
Apr
15
May
15
Jun
15
Jul 1
5
Aug
15
Sep
15
Oct
15
Nov
15
mb/dmb/d
Others* Propane/propylene GasolineJet fuel/kerosene Fuel oil Crude (RHS)
*Others: Contains natural gas liquids, liquefied refinery gases (LRG's), other liquids and all finished petroleum productsexcept gasoline, jet fuel/kerosene, fuel oil and propane/propylene.

Oil Trade
OPEC Monthly Oil Market Report – December 2015 81
Graph 8.2: US exports of crude and petroleum products
In September, the first and second lead suppliers to the US maintained the same order as seen the previous month, with Canada holding its top position, accounting for 45% of total US crude imports, though monthly volumes dropped by 126 tb/d from the previous month. Saudi Arabia kept its spot as second-largest supplier to the US in September, though its exports also declined in September from the previous month by 143 tb/d or 14%. Venezuela came in as the third-top supplier, accounting for 11% of total US crude imports with a drop from a month before by 23 tb/d or 3%. Crude imports from OPEC Member Countries rose in September from one month earlier by 98 tb/d or 4%, accounting for 36% of total US crude imports. US product imports from OPEC Member Countries in September were almost stable from the previous month, up by a slight 6 tb/d or 2%. Canada and Russia maintained their positions as first and second product suppliers to the US, accounting for 24% and 16%, respectively, though exports from both countries were slightly lower in September. The United Kingdom was the third-top US supplier, increasing exports by 41 tb/d or 29% from the previous month. US crude imports by region were broken down as follows in September: those from North America topped the chart with an average of 3.3 mb/d, followed by Latin America and the Middle East, which came in as second- and third-top regions with 2.2 mb/d and 1.3 mb/d, respectively. Imports from North America were higher than the same month a year ago, while imports from Latin America and the Middle East were lower annually. Table 8.1: US crude and product net imports, tb/d
Regarding crude imports by PADD: the highest imports to the East Coast in PADD 1 were sourced from North America at 195 tb/d, followed by Africa, which averaged 192 tb/d. Crude imports from Africa were higher in September by 47 tb/d or 32% m-o-m, while those from North America dropped by 86 tb/d. Imports from PADD 2 were also mainly sourced from North America, averaging 2.1 mb/d, though this figure is lower than the previous month’s number of 112 tb/d. The Middle East only exported 38 tb/d to PADD 2 in September. PADD 3 mainly sourced its imports from
0100200300400500600
0
1,000
2,000
3,000
4,000
5,000
Nov
14
Dec
14
Jan
15
Feb
15
Mar
15
Apr
15
May
15
Jun
15
Jul 1
5
Aug
15
Sep
15
Oct
15
Nov
15
tb/dtb/d
Others* Propane/propylene GasolineJet fuel/kerosene Fuel oil Crude (RHS)
*Others: Contains natural gas liquids, liquefied refinery gases (LRG's), other liquids and all finished petroleum productsexcept gasoline, jet fuel/kerosene, fuel oil and propane/propylene.
ChangeSep 15 Oct 15 Nov 15 Nov 15/Oct 15
Crude oil 6,813 6,666 6,882 216Total products -2,362 -2,168 -2,298 -129Total crude and products 4,451 4,498 4,584 86

Oil Trade
82 OPEC Monthly Oil Market Report – December 2015
Latin America, followed by the Middle East and North America. Imports to PADD 3 were down from Latin America and OECD Europe. As seen before, PADD 4 continued to import only from North America, averaging 280 tb/d in September, down by 41 tb/d from the month before. In PADD 5, imports to the West Coast increased from the Middle East and West Africa over the previous month, while imports from other regions declined from the month before. Japan Japan’s crude oil imports dropped in a monthly comparison in October by 141 tb/d or 4% to average 3.1 mb/d; they also fell in a y-o-y comparison, declining in October by 188 tb/d or 6%. Saudi Arabia and the UAE remained as before the main suppliers to Japan, with shares of 34% and 22%, respectively, while Russia held the third position in October with a share of 11%. Saudi Arabian and UAE volumes exported to Japan were less than the previous month by 65 tb/d and 125 tb/d, respectively. Graph 8.3: Japan’s imports of crude and petroleum products
Product imports dropped in October by 101 tb/d to average 570 tb/d, their lowest level since June 2015, reflecting a drop of 15% m-o-m but a gain of 11% y-o-y. Product sales rose by 1.8% from the previous year. Japanese product exports in October dropped by 26 tb/d or 4% to average 593 tb/d. Y-o-y they rose by 73 tb/d from a year before. Graph 8.4: Japan’s exports of petroleum products
0
1
2
3
4
5
0
200
400
600
800
1,000
1,200
Oct
14
Nov
14
Dec
14
Jan
15
Feb
15
Mar
15
Apr 1
5
May
15
Jun
15
Jul 1
5
Aug
15
Sep
15
Oct
15
mb/dtb/d
Others* LPG Naphtha Fuel oil Crude oil
*Others: Contains gasoline, jet fuel, kerosene, gasoil, asphalt and paraffin wax.
0
100
200
300
400
500
600
700
0
100
200
300
400
500
600
700
Oct
14
Nov
14
Dec
14
Jan
15
Feb
15
Mar
15
Apr
15
May
15
Jun
15
Jul 1
5
Aug
15
Sep
15
Oct
15
tb/dtb/d
Fuel oil Gasoil Jet fuel Others*
*Others: Contains LPG, gasoline, naphtha, kerosene, lubricating oil, asphalt and paraffin wax.

Oil Trade
OPEC Monthly Oil Market Report – December 2015 83
Accordingly, Japanese net imports went down in October by 217 tb/d to average 3.1 mb/d, reflecting a monthly drop of 7% and annual loss of 6%. Table 8.2: Japan’s crude and product net imports, tb/d
China In October, China’s crude oil imports declined, following a high level in the month before, falling by 597 tb/d or 9% to average 6.2 mb/d. At the same time, Chinese stocks were down from a month before. In an annual comparison, China’s crude imports were higher than in the same period the previous year by 534 tb/d or 9%. On a y-t-d basis, this shows a gain of 551 tb/d or 9%. China’s petroleum product imports also declined in October, dropping by 15% m-o-m, yet remaining higher than the same month of the previous year by 159 tb/d or 17%. In terms of supplier share, Saudi Arabia, Angola and Russia were the top suppliers to China in October accounting for 15%, 14% and 13%, respectively. Graph 8.5: China’s imports of crude and petroleum products
China’s imports from Saudi Arabia’s declined by 23 tb/d from a month before. Imports from Russia declined by 180 tb/d, while imports from Angola increased by 157 tb/d. Oman came in as the fourth-largest supplier to China in October, with lower imports by 101 tb/d from a month before.
01,0002,0003,0004,0005,0006,0007,0008,000
0200400600800
1,0001,2001,4001,600
Oct
14
Nov
14
Dec
14
Jan
15
Feb
15
Mar
15
Apr
15
May
15
Jun
15
Jul 1
5
Aug
15
Sep
15
Oct
15
tb/dtb/d
Others LPG Naphtha Gasoline Jet fuelDiesel Fuel oil Asphalt Crude (RHS)
ChangeAug 15 Sep 15 Oct 15 Oct 15/Sep 15
Crude oil 3,494 3,263 3,122 -141Total products -56 52 -23 -76Total crude and products 3,438 3,315 3,098 -217
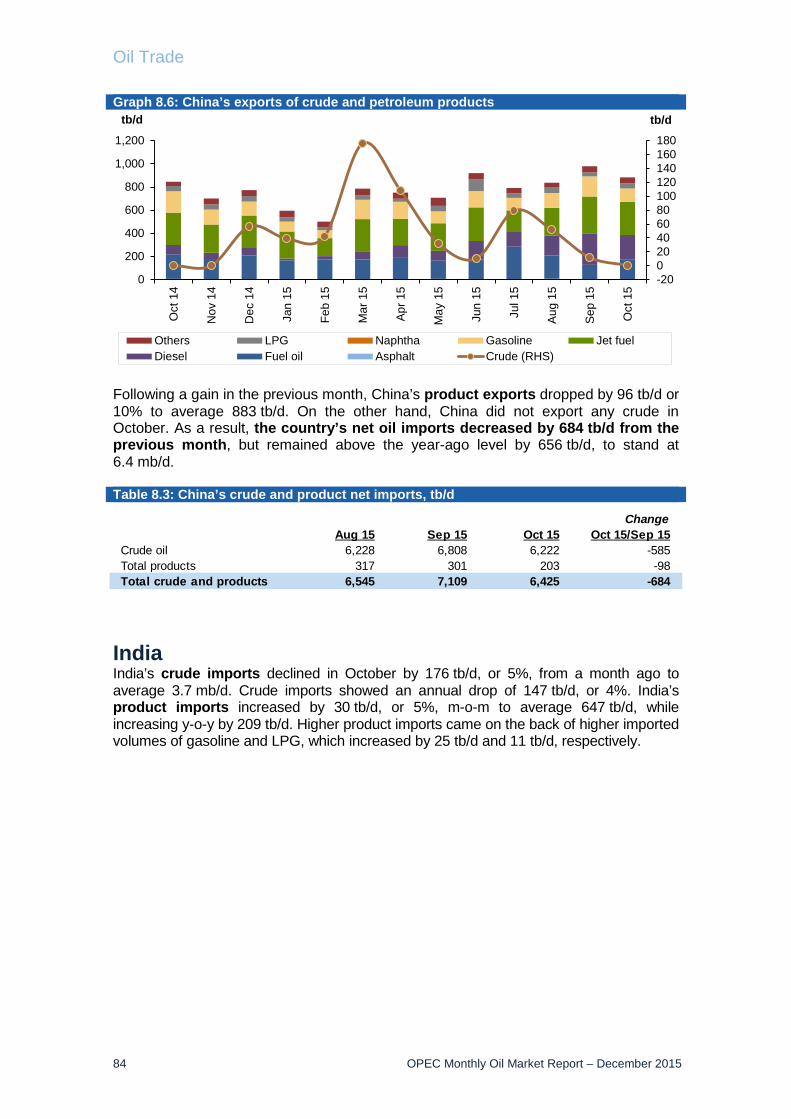
Oil Trade
84 OPEC Monthly Oil Market Report – December 2015
Graph 8.6: China’s exports of crude and petroleum products
Following a gain in the previous month, China’s product exports dropped by 96 tb/d or 10% to average 883 tb/d. On the other hand, China did not export any crude in October. As a result, the country’s net oil imports decreased by 684 tb/d from the previous month, but remained above the year-ago level by 656 tb/d, to stand at 6.4 mb/d. Table 8.3: China’s crude and product net imports, tb/d
India India’s crude imports declined in October by 176 tb/d, or 5%, from a month ago to average 3.7 mb/d. Crude imports showed an annual drop of 147 tb/d, or 4%. India’s product imports increased by 30 tb/d, or 5%, m-o-m to average 647 tb/d, while increasing y-o-y by 209 tb/d. Higher product imports came on the back of higher imported volumes of gasoline and LPG, which increased by 25 tb/d and 11 tb/d, respectively.
-20020406080100120140160180
0
200
400
600
800
1,000
1,200
Oct
14
Nov
14
Dec
14
Jan
15
Feb
15
Mar
15
Apr 1
5
May
15
Jun
15
Jul 1
5
Aug
15
Sep
15
Oct
15
tb/dtb/d
Others LPG Naphtha Gasoline Jet fuelDiesel Fuel oil Asphalt Crude (RHS)
ChangeAug 15 Sep 15 Oct 15 Oct 15/Sep 15
Crude oil 6,228 6,808 6,222 -585Total products 317 301 203 -98Total crude and products 6,545 7,109 6,425 -684

Oil Trade
OPEC Monthly Oil Market Report – December 2015 85
Graph 8.7: India’s imports of crude and petroleum products
India’s product exports dropped in October by 239 tb/d or 18% to average 1.1 mb/d, the lowest level since April 2015. Y-o-y, product exports showed a higher drop, declining by 389 tb/d. A monthly product export drop came on the back of lower diesel, naphtha and fuel oil exports, which declined by 98 tb/d, 60 tb/d and 35 tb/d, respectively, from the previous month. Graph 8.8: India’s exports of petroleum products
Consequentially, India’s net imports increased by 93 tb/d to average 3.2 mb/d, reflecting a gain of 3% m-o-m and a 451 tb/d or 16% gain y-o-y. Table 8.4: India’s crude and product net imports, tb/d
0
1,000
2,000
3,000
4,000
5,000
0100200300400500600700800
Oct
14
Nov
14
Dec
14
Jan
15
Feb
15
Mar
15
Apr 1
5
May
15
Jun
15
Jul 1
5
Aug
15
Sep
15
Oct
15
tb/dtb/d
Others LPG Naphtha GasolineKerosene Gasoil Fuel oil Crude (RHS)
02004006008001,0001,2001,4001,600
0200400600800
1,0001,2001,4001,600
Oct
14
Nov
14
Dec
14
Jan
15
Feb
15
Mar
15
Apr
15
May
15
Jun
15
Jul 1
5
Aug
15
Sep
15
Oct
15
tb/dtb/d
Fuel oil Gasoil Jet fuel Gasoline Naphtha Others
ChangeAug 15 Sep 15 Oct 15 Oct 15/Sep 15
Crude oil 4,070 3,852 3,676 -176Total products -733 -734 -465 269Total crude and products 3,336 3,118 3,211 93
Note: India data tab le does not include information for crude import and product export by Reliance Industries.

Oil Trade
86 OPEC Monthly Oil Market Report – December 2015
FSU Total crude oil exports in October from the former Soviet Union (FSU) increased by 1.2 mb/d or 21% following a drop the month before to average 6.5 mb/d. Crude exports through Russian pipelines rose by 121 tb/d or 3% to average 4.3 mb/d. Total Black Sea shipments increased by 47 tb/d or 8% to average 637 tb/d, mainly as those from Novorossiysk port terminal rose over the previous month. Total Baltic Sea exports dropped by 42 tb/d in October, mostly due to less shipments from Primorsk port terminal, which declined by 45 tb/d on average. Total shipments through the Druzhba pipeline averaged 1.1 mb/d in October, showing higher exports by 56 tb/d from the previous month. Kozmino shipments increased by 51 tb/d or 9% to average 650 tb/d, while exports through the Lukoil system dropped in October from the previous month by 22 tb/d. In other routes, Black Sea total exports increased by 566 tb/d as exports through Novorossiyk port terminal (CBC) increased by 553 tb/d. Additionally, Batumi port terminal exports rose by 16 tb/d from a month before. In the Mediterranean Sea, BTC supplies increased by 463 tb/d from the previous month to average 605 tb/d. FSU total product exports all increased, with the exception of VGO, which went down by 53 tb/d. As a result, total FSU product exports averaged 3 mb/d in October.

Oil Trade
OPEC Monthly Oil Market Report – December 2015 87
Table 8.5: Recent FSU exports of crude and petroleum products by source, tb/d
Transneft system 2013 2Q 15 3Q 15 Sep 15 Oct 15
Europe Black sea total 739 561 594 590 637 Novorossiysk port terminal - total 739 561 594 590 637 of which: Russian oil 535 421 433 402 540 Others 204 139 160 188 97
Baltic sea total 1,546 1,427 1,358 1,545 1,503 Primorsk port terminal - total 1,083 917 836 940 895 of which: Russian oil 1,007 917 836 940 895 Others 76 0 0 0 0 Ust-Luga port terminal - total 463 510 522 605 608 of which: Russian oil 342 367 356 411 398 Others 121 143 166 193 210
Druzhba pipeline total 1,032 1,078 1,058 1,091 1,147 of which: Russian oil 1,000 1,045 1,026 1,058 1,115 Others 32 32 32 33 32
Asia Pacific ocean total 434 637 592 598 650 Kozmino port terminal - total 434 637 592 598 650
China (via ESPO pipeline) total 321 315 338 325 334 China Amur 321 315 338 325 334
4,071 4,018 3,939 4,150 4,271
Lukoil system 2013 2Q 15 3Q 15 Sep 15 Oct 15
Barents sea total 111 138 137 157 135 Varandey offshore platform 111 138 137 157 135
Europe Baltic sea total 19 14 15 19 19 Kalinigrad port terminal 19 14 15 19 19
Other routes 2013 2Q 15 3Q 15 Sep 15 Oct 15
Asia Russian Far East total 259 324 301 303 367 Aniva bay port terminal 114 111 105 87 112 De Kastri port terminal 145 213 196 216 255
Central Asia total 239 232 217 259 225 Kenkiyak-Alashankou 239 232 217 259 225
Europe Black sea total 853 993 736 336 902 Novorossiysk port terminal (CPC) 704 903 649 259 812 Supsa port terminal 76 69 79 71 69 Batumi port terminal 53 20 8 6 22 Kulevi port terminal 20 0 0 0 0
Mediterranean sea total 641 606 471 142 605 BTC 641 606 471 142 605
Russian rail 2013 2Q 15 3Q 15 Sep 15 Oct 15Russian rail 198 16 13 12 10 of which: Russian oil 9 7 8 8 7 Others 189 8 4 4 3
6,392 6,342 5,829 5,379 6,533
Products 2013 2Q 15 3Q 15 Sep 15 Oct 15Gasoline 122 200 115 79 150Naphtha 390 476 457 513 564Jet 11 37 29 13 25Gasoil 857 1,061 888 838 897Fuel oil 1,415 1,475 1,253 1,201 1,222VGO 263 250 270 270 211
3,058 3,499 3,012 2,914 3,069
Total FSU oil exports 9,450 9,841 8,842 8,293 9,602
Sources: Argus Nefte Transport and Argus Global Markets.
Total Russian crude exports
Europe and North America
Total FSU crude exports
Total FSU product exports
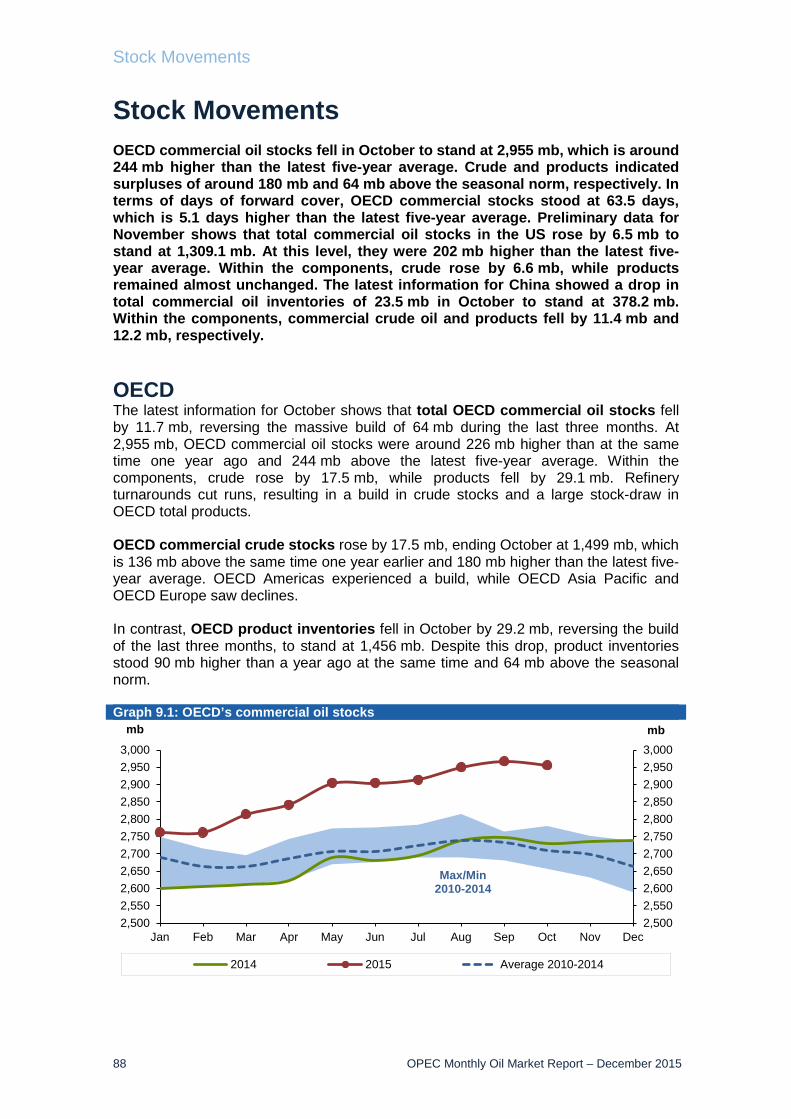
Stock Movements
88 OPEC Monthly Oil Market Report – December 2015
Stock Movements OECD commercial oil stocks fell in October to stand at 2,955 mb, which is around 244 mb higher than the latest five-year average. Crude and products indicated surpluses of around 180 mb and 64 mb above the seasonal norm, respectively. In terms of days of forward cover, OECD commercial stocks stood at 63.5 days, which is 5.1 days higher than the latest five-year average. Preliminary data for November shows that total commercial oil stocks in the US rose by 6.5 mb to stand at 1,309.1 mb. At this level, they were 202 mb higher than the latest five-year average. Within the components, crude rose by 6.6 mb, while products remained almost unchanged. The latest information for China showed a drop in total commercial oil inventories of 23.5 mb in October to stand at 378.2 mb. Within the components, commercial crude oil and products fell by 11.4 mb and 12.2 mb, respectively. OECD The latest information for October shows that total OECD commercial oil stocks fell by 11.7 mb, reversing the massive build of 64 mb during the last three months. At 2,955 mb, OECD commercial oil stocks were around 226 mb higher than at the same time one year ago and 244 mb above the latest five-year average. Within the components, crude rose by 17.5 mb, while products fell by 29.1 mb. Refinery turnarounds cut runs, resulting in a build in crude stocks and a large stock-draw in OECD total products. OECD commercial crude stocks rose by 17.5 mb, ending October at 1,499 mb, which is 136 mb above the same time one year earlier and 180 mb higher than the latest five-year average. OECD Americas experienced a build, while OECD Asia Pacific and OECD Europe saw declines. In contrast, OECD product inventories fell in October by 29.2 mb, reversing the build of the last three months, to stand at 1,456 mb. Despite this drop, product inventories stood 90 mb higher than a year ago at the same time and 64 mb above the seasonal norm. Graph 9.1: OECD’s commercial oil stocks
2,5002,5502,6002,6502,7002,7502,8002,8502,9002,9503,000
2,5002,5502,6002,6502,7002,7502,8002,8502,9002,9503,000
Jan Feb Mar Apr May Jun Jul Aug Sep Oct Nov Dec
mbmb
2014 2015 Average 2010-2014
Max/Min2010-2014

Stock Movements
OPEC Monthly Oil Market Report – December 2015 89
In terms of days of forward cover, OECD commercial stocks fell by 0.1 days in October from the previous month to stand at 63.5 days, which is 4.4 days above a year ago at the same time and 5.1 days higher than the latest five-year average. Within the regions, OECD Americas’ days of forward cover were 7.0 days higher than the historical average to stand at 64.1 days in October. OECD Asia Pacific stood 3.3 days above the seasonal average to finish the month at 51.0 days. At the same time, OECD Europe indicated a surplus of 2.9 days above the seasonal norm, averaging 70.7 days in October. Commercial stocks in OECD Americas fell by 3.6 mb in October to end the month at 1,571 mb, which represents a surplus of 161 mb above a year ago and nearly 200 mb higher than the seasonal norm. Within the components, crude stocks rose by 22.0 mb, while product inventories fell by 25.6 mb. At the end of October, commercial crude oil stocks in OECD Americas stood at 830 mb, which was 101 mb above the same time one year ago and 143 mb above the latest five-year average. The build was mainly driven by lower refinery runs in the US, which fell by around 600,000 b/d to average 15.5 mb/d. Refineries were running at around 87.2% of operable capacity in October, which is 3.2 pp lower than in the previous month. In contrast, product stocks in OECD Americas declined by 25.6 mb to end October at 1,456 mb, which is 53 mb above the same time one year ago and 56 mb higher than the seasonal norm. The drop came mainly from lower refinery output combined with increased US demand. OECD Europe’s commercial stocks declined by 6.9 mb in October to stand at 939 mb, which is 57.3 mb higher than the same time a year ago and 24 mb above the latest five-year average. Both crude and product stocks fell by 4.2 mb and 2.7 mb, respectively. OECD Europe’s commercial crude stocks fell in October to stand at 402 mb, which is 15.5 mb above the same period a year earlier and 8.6 mb higher than the latest five-year average. Higher crude runs were behind the decline. OECD Europe’s commercial product stocks also fell by 2.7 mb in October, ending the month at 537 mb, which is 41.8 mb higher than a year ago at the same time and 15.4 mb higher than the seasonal norm. This drop was mainly driven by higher product demand in the region, especially for middle distillates. OECD Asia Pacific commercial oil stocks fell by 1.2 mb in October to end the month at 442 mb, which is 8.1 mb higher than a year ago and 21.1 mb above the five-year average. Within the components, crude and product stocks fell by 0.3 mb and 0.9 mb, respectively. Crude inventories ended the month of October at 267 mb, which is 13.2 mb higher than a year ago and 28.5 mb above the seasonal norm. OECD Asia Pacific’s total product inventories ended October at 175 mb, which is a deficit of 5.1 mb below a year ago and 7.4 mb lower than the seasonal norm. Table 9.1: OECD’s commercial stocks, mb
ChangeAug 15 Sep 15 Oct 15 Oct 15/Sep 15 Oct 14
Crude oil 1,470 1,481 1,499 17.5 1,363Products 1,481 1,486 1,456 -29.2 1,367Total 2,950 2,967 2,955 -11.7 2,729
Days of forward cover 63.7 63.6 63.5 -0.1 59.1

Stock Movements
90 OPEC Monthly Oil Market Report – December 2015
EU plus Norway Preliminary data for October shows that total European stocks fell by 6.9 mb following a build of 10.4 mb in September. At 1,111.9 mb, European stocks were 57.0 mb, or 5.4%, above the same time a year ago and 43.2 mb, or 4.0%, higher than the latest five-year average. Both crude and product stocks fell by 4.2 mb and 2.6 mb, respectively. European crude inventories fell in October to stand at 485.3 mb, which is 12.3 mb, or 2.6%, above the same period a year ago and 22 mb, or 4.8%, higher than the seasonal norm. The fall in crude oil stocks was driven by higher refinery runs, which increased by 20,000 b/d over the previous month, to average 10.6 mb/d in October. European product stocks also fell by 2.6 mb in October to stand at 626.6 mb, which is 44.7 mb, or 7.7%, above the same time a year ago and 21.1 mb, or 3.5%, above the seasonal norm. Within products, the picture was mixed, with the bulk of the stock-draw coming from distillate inventories. Graph 9.2: EU-15 plus Norway’s total oil stocks
Gasoline stocks rose slightly by 0.2 mb in October to stand at 106.5 mb, which was 2.4 mb, or 2.3%, above a year earlier, but remained 1.3 mb, or 1.2%, less than the seasonal norm. In contrast, distillate stocks fell by 3.1 mb to end October at 420.7 mb, reversing the build of the last three months. Despite this stock-draw, distillate stocks were 38.5 mb, or 10.1%, higher than the previous year at the same time and 39.7 mb, or 10.4%, above the latest five-year average. This fall could be attributed to higher middle distillate demand in the region as well as lower distillate output. Residual fuel oil stocks rose marginally by 0.3 mb in October, reversing the drop of last month, to settle at 76.1 mb, which is 7.1 mb, or 10.3%, above the same month a year ago but 11.8 mb, or 13.4.%, lower than the latest five-year average. Naphtha stocks remained unchanged in October to end the month at 23.3 mb, which is 3.3 mb, or 12.3%, less than the same time a year ago and 5.5 mb, or 19.2%, lower than the seasonal average.
1,040
1,060
1,080
1,100
1,120
1,140
1,160
1,180
1,040
1,060
1,080
1,100
1,120
1,140
1,160
1,180
Jan Feb Mar Apr May Jun Jul Aug Sep Oct Nov Dec
mbmb
2014 2015 Average 2010-2014
Max/Min2010-2014

Stock Movements
OPEC Monthly Oil Market Report – December 2015 91
Table 9.2: EU-15 plus Norway’s total oil stocks, mb
US Preliminary data for November shows that total commercial oil stocks in the US rose by 6.7 mb, reversing the fall of last year to end the month at 1,309.1 mb. At this level, they were 158.3 mb, or 13.8%, above the same period a year ago and 202.2 mb, or 18.3%, higher than the latest five-year average. Within the components, crude rose by 6.6 mb, while products remained almost unchanged. US commercial crude stocks rose in November to stand at 489.4 mb. Commercial crude stocks finished the month at 101.9 mb, or 26.3%, above the same time last year and 123.7 mb, or 33.8%, above the latest five-year average. Commercial crude stocks have risen for 10 consecutive weeks, defying expectations that inventories would start to fall once refineries exited the seasonal maintenance. Refinery runs rose in November by nearly 700,000 b/d, reaching 16.1 mb/d, raising the utilization rate to more than 90% in November from 86.7% in October. A build in crude oil imports contributed to the build in crude oil commercial inventories. Indeed, crude oil imports increased by 173,000 b/d to stand at 7.36 mb/d in November. Crude at Cushing, Oklahoma, also saw a stock build of 5.7 mb in November, ending the month at 59.0 mb. Graph 9.3: US weekly commercial crude oil stocks
Total product stocks remained almost unchanged in November, following a massive drop of 25.6 mb in October. At 819.7 mb, US product stocks were at around 56.4 mb or 7.4% above the level seen at the same time a year ago, showing a surplus of 78.6 mb or 10.6% above the seasonal norm. Within products, the picture was mixed. All the major products saw builds, while other unfinished products experienced draws.
300320340360380400420440460480500
300320340360380400420440460480500
1 4 7 10 13 16 19 22 25 28 31 34 37 40 43 46 49 52
mbmb
2014 2015 Average 2010-2014
Max/Min2010-2014
ChangeAug 15 Sep 15 Oct 15 Oct 15/Sep 15 Oct 14
Crude oil 483.6 489.5 485.3 -4.2 473.0Gasoline 105.6 106.3 106.5 0.2 104.2Naphtha 24.2 23.3 23.3 0.0 26.6Middle distillates 425.5 423.8 420.7 -3.1 382.2Fuel oils 77.2 75.9 76.1 0.3 69.0Total products 632.5 629.3 626.6 -2.6 581.9Total 1,116.1 1,118.8 1,111.9 -6.9 1,054.9
Sources: Argus and Euroilstock.

Stock Movements
92 OPEC Monthly Oil Market Report – December 2015
Gasoline stocks rose by 1.5 mb in November, reversing the fall of the previous month to stand at 216.9 mb. At this level, gasoline stocks were 2.2 mb, or 1.0%, lower than the same period a year ago, but remained in line with the latest five-year average. The build came mainly from higher gasoline production, which increased by around 30,000 b/d. Lower gasoline demand also contributed to the build in gasoline inventories. Distillate stocks also rose by 3.7 mb in November, ending the month at 144.4 mb. At this level, they still indicated a surplus of 18.3 mb, or 14.5%, from the same period a year ago, and stood 10.2 mb, or 7.6%, above the latest five-year average. The build in middle distillate stocks was driven by lower demand, which declined by around 100,000 b/d to average 3.9 mb/d. Higher distillate fuel output also contributed to this build. Graph 9.4: US weekly gasoline stocks
Residual fuel oil inventories rose by 1.0 mb to 43.5 mb, which was 7.2 mb, or 19.8%, higher than last year over the same period and 5.7 mb, or 15.1%, above the seasonal norm. Jet fuel stocks rose slightly, ending November at 38.1 mb. At this level, jet fuel stocks stood 2.2 mb, or 6.2%, higher than in the same month a year ago, but were 1.9 mb, or 4.8%, below the latest five-year average. Table 9.3: US onland commercial petroleum stocks, mb
195200205210215220225230235240245
195200205210215220225230235240245
1 4 7 10 13 16 19 22 25 28 31 34 37 40 43 46 49 52
mbmb
2014 2015 Average 2010-2014
Max/Min2010-2014
ChangeSep 15 Oct 15 Nov 15 Nov 15/Oct 15 Nov 14
Crude oil 460.8 482.8 489.4 6.6 389.0Gasoline 225.1 215.3 216.9 1.5 219.6Distillate fuel 148.8 140.8 144.4 3.7 126.2Residual fuel oil 41.3 42.5 43.5 1.0 36.3Jet fuel 40.4 38.0 38.1 0.1 36.0Total 1,306.0 1,302.5 1,309.1 6.7 1,153.5SPR 695.1 695.1 695.1 0.0 691.0
Source: US Energy Information Administration.

Stock Movements
OPEC Monthly Oil Market Report – December 2015 93
Japan In Japan, total commercial oil stocks fell by 1.2 mb in October, reversing the build of the last three months, to settle at 169 mb, which is 10.6 mb or 5.9% below a year ago at the same time and 4.2 mb, or 2.4%, below the latest five-year average. Within the components, both crude and product inventories fell by 0.3 mb and 0.9 mb, respectively. Japanese commercial crude oil stocks fell in October to stand at 99.5 mb, which is 6.9 mb, or 6.4%, below a year ago at the same time yet 1.9 mb above the seasonal norm. The drop was driven by lower crude imports, which declined by about 141,000 b/d or 4.3%, averaging 3.1 mb/d. Lower crude oil throughput limited further declines in crude oil stocks. Indeed, crude oil throughput fell by around 163,000 b/d or 5.1% in October from the previous month to stand at 3.1 mb/d, which is 1.1% higher than a year ago at the same time. Graph 9.5: Japan’s commercial oil stocks
Japan’s total product inventories also fell by 0.9 mb in October, reversing the build of the last three months, to stand at 69.5 mb, which is 3.8 mb or 5.1% below the same time a year ago and 6.1 mb or 8.1% under the five-year average. The decline was driven mainly by lower refinery output, which fell by around 50,000 b/d or 1.9%, to stand at 2.95 mb/d. The decline in domestic sales limited a further drop in inventories. Indeed, domestic sales fell by around 20,000 b/d to average 3.0 mb/d, which is 2.5% lower than a year ago at the same time. Within products, the picture was mixed; gasoline and residual fuel oil stocks rose, while distillates and naphtha experienced stock draws. Gasoline stocks rose by 0.1 mb in October to end the month at 10.2 mb, which is 0.4 mb, or 3.8%, below the same time a year ago and 2.2 mb, or 17.7%, less than the latest five-year average. This build was driven mainly by higher gasoline output, which rose by 1.6%, however, higher gasoline sales limited further builds in gasoline inventories. Total residual fuel oil stocks also rose by 0.2 mb in October to stand at 15.4 mb, which is 0.3 mb, or 1.8%, below a year ago and 0.6 mb, or 3.9%, lower than the latest five-year average. Within the fuel oil components, fuel oil A and fuel B.C stocks rose by 2.8% and 0.6%, respectively. This build was driven by higher production. In contrast, distillate stocks fell by 1.0 mb in October to stand at 33.4 mb, which is 2.0 mb, or 5.8%, below the same period a year ago and 2.5 mb, or 7.1%, below the
140
150
160
170
180
190
140
150
160
170
180
190
Jan Feb Mar Apr May Jun Jul Aug Sep Oct Nov Dec
mbmb
2014 2015 Average 2010-2014
Max/Min2010-2014

Stock Movements
94 OPEC Monthly Oil Market Report – December 2015
seasonal average. Within distillate components, jet fuel and gasoil inventories fell by 10.7% and 13.4%, respectively, while kerosene stocks rose by 8.4%. Naphtha inventories also fell by 0.1 mb in October to stand at 10.5 mb, which was 1.0 mb, or 8.9%, below a year ago at the same time and 0.7 mb, or 6.5%, less than the seasonal norm. This fall was driven mainly by lower output combined with reduced imports. However, lower domestic sales limited further stock-draws. Table 9.4: Japan’s commercial oil stocks*, mb
China The latest information for China showed a drop in total commercial oil inventories of 23.5 mb in October following a 5.6 mb stock-draw in September. At 378.2 mb, Chinese oil inventories were around 13 mb below the previous year at the same time. Within the components, crude commercial oil and products fell by 11.4 mb and 12.2 mb, respectively. At 247.0 mb, commercial crude stocks showed a deficit of around 18.1 mb below the same period one year earlier. The decline could be attributed to both lower crude oil imports, which declined by around 600,000 b/d to average 6.2 mb/d, as well as to an increase in crude oil throughputs. However, higher crude oil output, which increased by 1.95%, limited further drops in crude oil stocks. Table 9.5: China’s commercial oil stocks, mb
Total product stocks in China also fell by 12.2 mb, ending October at 131.2 mb, which is 5.1 mb higher than a year ago at the same time. All product stocks declined, with the bulk coming from diesel inventories, which dropped by 10.4 mb to end the month of October at 64.2 mb, which is 7.9 mb higher than a year ago at the same time. Gasoline stocks also fell by 0.5 mb to stand at 51.8 mb in October, which is 4.0 mb below last year at the same time. Kerosene stocks fell by 1.2 mb to end the month of October at 15.2 mb, which is 1.2 mb over a year ago. The decline was attributed to higher demand
ChangeAug 15 Sep 15 Oct 15 Oct 15/Sep 15 Oct 14
Crude oil 99.2 99.8 99.5 -0.3 106.3Gasoline 9.7 10.1 10.2 0.1 10.6Naphtha 11.7 10.6 10.5 -0.1 11.5Middle distillates 33.5 34.4 33.4 -1.0 35.4Residual fuel oil 14.4 15.2 15.4 0.2 15.7Total products 69.3 70.4 69.5 -0.9 73.3Total** 168.5 170.2 169.0 -1.2 179.6
* At end of month.** Includes crude oil and main products only.Source: Ministry of Economy, Trade and Industry, Japan.
ChangeAug 15 Sep 15 Oct 15 Oct 15/Sep 15 Oct 14
Crude oil 252.4 258.4 247.0 -11.4 265.1Gasoline 51.1 52.3 51.8 -0.5 55.8Diesel 88.5 74.6 64.2 -10.4 56.3Jet kerosene 15.4 16.4 15.2 -1.2 14.0Total products 155.0 143.4 131.2 -12.2 126.2
Total 407.4 401.8 378.2 -23.5 391.3
Source: OPEC Secretariat analysis.

Stock Movements
OPEC Monthly Oil Market Report – December 2015 95
as consumption increased in early October resulting from increased travel in connection with the observance of the National Day Holiday. Singapore and Amsterdam-Rotterdam-Antwerp (ARA) At the end of October, product stocks in Singapore fell by 3.1 mb, reversing the build of 0.2 mb in September, to stand at 50.2 mb, which is 8.1 mb or 19.2% above the same period a year ago. All products experienced stock-draws. Light distillate stocks fell by 1.5 mb to stand at 10.5 mb, which is 0.8 mb or 7.1% below the previous year at the same time. Middle distillate stocks also fell by 0.1 mb to finish the month of October at 13.2 mb, which is 1.8 mb or 15.5% above the same time a year ago. The drop was mainly driven by higher demand in the region. Residual fuel oil stocks fell by 1.5 mb in October to end the month at 26.5 mb, which is 7.1 mb or 36.6% higher than the same time a year ago. Product stocks in Amsterdam-Rotterdam-Antwerp (ARA) fell by 2.5 mb in October, following a stock-draw of 1.1 mb in September, to settle at 47.3 mb, which is 13.0 mb or 37.8% higher than the same time a year ago. The drop was mainly driven by ongoing low water levels on the Rhine, which has reduced exports to the ARA hub. With the exception of a stock-build in jet fuel, all other products witnessed draws. Gasoil fell by 0.4 mb to end the month of October at 25.9 mb, which is 6.0 mb or 30.1% higher than the same month last year. Gasoline and fuel oil stocks fell by 0.9 mb 0.4 mb, respectively. At 7.0 mb, gasoline stocks remained 2.6 mb or 61% above last year at the same time. Fuel oil stocks also indicated a surplus of 3.1 mb or 84% above a year ago. In contrast, jet oil rose by 0.2 mb to end October at 6.2 mb, which is 1.5 mb or 33% above a year ago at the same time.

Balance of Supply and Demand
96 OPEC Monthly Oil Market Report – December 2015
Balance of Supply and Demand Demand for OPEC crude in 2015 was revised down by 0.2 mb/d from the previous month’s report to stand at 29.4 mb/d, which is 0.4 mb/d higher than the 2014 level. In 2016, demand for OPEC crude is projected at 30.8 mb/d, unchanged from last month’s report and around 1.5 mb/d higher than in the current year. Forecast for 2015 Demand for OPEC crude in 2015 was revised down by 0.2 mb/d from the previous month’s report to stand at 29.4 mb/d. This represents an increase of 0.4 mb/d over the previous year. The last two quarters of the year were revised down by 0.4 mb/d, while 1Q15 and 2Q15 remained almost unchanged. This downward revision mainly reflects the upward adjustment in non-OPEC supply. The first quarter fell by 0.6 mb/d, while 2Q15 grew by 0.2 mb/d. The third and further quarters are expected to see growth of 0.4 mb/ and 1.5 mb/d, respectively, versus the same quarters last year. Table 10.1: Summarized supply/demand balance for 2015, mb/d
Forecast for 2016 Demand for OPEC crude in 2016 remained unchanged from the previous month. For 1Q16, demand for OPEC crude was revised down by 0.1 mb/d, while 3Q16 was revised up by 0.1 mb/d. The second and fourth quarters remain unchanged from the previous assessment. Overall, demand for OPEC crude for next year is projected to increase by 1.5 mb/d to average 30.8 mb/d. The first and second quarters are expected to increase by 1.9 mb/d and 1.7 mb/d, respectively, while 3Q16 and 4Q16 are projected to rise by 1.5 mb/d and 0.7 mb/d, respectively. Table 10.2: Summarized supply/demand balance for 2016, mb/d
2014 1Q15 2Q15 3Q15 4Q15 2015(a) World oil demand 91.35 91.97 92.03 93.56 93.94 92.88 Non-OPEC supply 56.52 57.90 57.57 57.43 57.17 57.51 OPEC NGLs and non-conventionals 5.83 5.86 5.94 6.01 6.13 5.99(b) Total non-OPEC supply and OPEC NGLs 62.35 63.76 63.51 63.44 63.29 63.50
Difference (a-b) 29.00 28.21 28.52 30.12 30.64 29.38OPEC crude oil production 30.07 30.33 31.19 31.56Balance 1.07 2.12 2.67 1.45
Totals may not add up due to independent rounding.
2015 1Q16 2Q16 3Q16 4Q16 2016(a) World oil demand 92.88 93.28 93.31 94.77 95.15 94.13 Non-OPEC supply 57.51 57.05 56.92 56.98 57.60 57.14 OPEC NGLs and non-conventionals 5.99 6.14 6.14 6.16 6.21 6.16(b) Total non-OPEC supply and OPEC NGLs 63.50 63.18 63.05 63.14 63.81 63.30
Difference (a-b) 29.38 30.10 30.26 31.63 31.35 30.84
Totals may not add up due to independent rounding.

Balance of Supply and Demand
OPEC Monthly Oil Market Report – December 2015 97
Graph 10.1: Balance of supply and demand
26
27
28
29
30
31
32
26
27
28
29
30
31
32
1Q15 2Q15 3Q15 4Q15 1Q16 2Q16 3Q16 4Q16
mb/dmb/d
OPEC crude production Required OPEC crude

98 OPEC Monthly Oil Market Report – December 2015
Table 10.3: World oil demand and supply balance, mb/d2012 2013 2014 1Q15 2Q15 3Q15 4Q15 2015 1Q16 2Q16 3Q16 4Q16 2016
World demand
OECD 45.9 46.0 45.7 46.5 45.4 46.3 46.6 46.2 46.7 45.6 46.4 46.7 46.4
Americas 23.6 24.1 24.2 24.2 24.1 24.8 25.0 24.5 24.5 24.4 25.1 25.3 24.8
Europe 13.8 13.6 13.4 13.5 13.6 13.9 13.5 13.6 13.5 13.6 13.8 13.4 13.6
Asia Pacific 8.5 8.4 8.2 8.8 7.7 7.6 8.2 8.1 8.6 7.6 7.5 8.0 7.9
DCs 28.3 29.2 29.9 30.0 30.7 31.3 30.5 30.6 30.7 31.4 32.0 31.2 31.3
FSU 4.4 4.5 4.5 4.4 4.2 4.6 4.9 4.5 4.4 4.3 4.7 5.0 4.6
Other Europe 0.6 0.6 0.7 0.7 0.6 0.7 0.7 0.7 0.7 0.6 0.7 0.8 0.7
China 9.7 10.1 10.5 10.4 11.1 10.7 11.2 10.8 10.8 11.4 11.0 11.5 11.1
(a) Total world demand 89.0 90.4 91.3 92.0 92.0 93.6 93.9 92.9 93.3 93.3 94.8 95.2 94.1
Non-OPEC supply
OECD 21.1 22.2 24.2 25.1 24.9 24.9 24.7 24.9 24.6 24.5 24.5 24.9 24.6
Americas 16.7 18.2 20.1 20.9 20.7 20.8 20.6 20.7 20.4 20.5 20.5 20.8 20.6
Europe 3.8 3.6 3.6 3.7 3.8 3.7 3.7 3.7 3.7 3.6 3.5 3.7 3.6
Asia Pacific 0.6 0.5 0.5 0.4 0.4 0.5 0.5 0.5 0.5 0.5 0.5 0.5 0.5
DCs 12.0 12.0 12.2 12.5 12.4 12.2 12.2 12.3 12.2 12.3 12.4 12.5 12.4
FSU 13.4 13.6 13.5 13.7 13.6 13.5 13.6 13.6 13.5 13.4 13.3 13.4 13.4
Other Europe 0.1 0.1 0.1 0.1 0.1 0.1 0.1 0.1 0.1 0.1 0.1 0.1 0.1
China 4.2 4.2 4.3 4.3 4.4 4.4 4.4 4.4 4.3 4.4 4.4 4.4 4.4
Processing gains 2.1 2.1 2.2 2.2 2.2 2.2 2.2 2.2 2.2 2.2 2.2 2.2 2.2
Total non-OPEC supply 52.9 54.3 56.5 57.9 57.6 57.4 57.2 57.5 57.0 56.9 57.0 57.6 57.1
OPEC NGLs + non-conventional oils 5.6 5.6 5.8 5.9 5.9 6.0 6.1 6.0 6.1 6.1 6.2 6.2 6.2
(b) Total non-OPEC supply and OPEC NGLs 58.4 59.9 62.3 63.8 63.5 63.4 63.3 63.5 63.2 63.1 63.1 63.8 63.3
OPEC crude oil production (secondary sources) 31.2 30.2 30.1 30.3 31.2 31.6
Total supply 89.6 90.2 92.4 94.1 94.7 95.0
Balance (stock change and miscellaneous) 0.6 -0.2 1.1 2.1 2.7 1.4
OECD closing stock levels (mb)
Commercial 2,683 2,589 2,738 2,815 2,905 2,967
SPR 1,547 1,584 1,579 1,582 1,584 1,581
Total 4,230 4,174 4,317 4,397 4,489 4,548
Oil-on-water 879 909 924 864 916 924
Days of forward consumption in OECD
Commercial onland stocks 58 57 59 62 63 64
SPR 34 35 34 35 34 34
Total 92 91 93 97 97 98
Memo items
FSU net exports 9.0 9.1 9.0 9.3 9.4 8.9 8.6 9.0 9.1 9.1 8.6 8.4 8.8
(a) - (b) 30.6 30.4 29.0 28.2 28.5 30.1 30.6 29.4 30.1 30.3 31.6 31.3 30.8
Note: Totals may not add up due to independent rounding.

OPEC Monthly Oil Market Report – December 2015 99
Table 10.4: World oil demand/supply balance: changes from last month's table* , mb/d2012 2013 2014 1Q15 2Q15 3Q15 4Q15 2015 1Q16 2Q16 3Q16 4Q16 2016
World demand
OECD - - - - - 0.1 0.1 - - - 0.1 0.1 -
Americas - - - - - - - - - - - - -
Europe - - - - - 0.1 0.1 - - - 0.1 0.1 -
Asia Pacific - - - - - - - - - - - - -
DCs - - - - - - - - - - - - -
FSU - - - - - - - - - - - - -
Other Europe - - - - - - - - - - - - -
China - - - - - - - - - - - - -
(a) Total world demand - - - - - 0.1 - - - - 0.1 - -
World demand growth - - - - - 0.1 - - - - - - -
Non-OPEC supply
OECD - - - - 0.1 0.5 0.3 0.2 - - - - -
Americas - - - - 0.1 0.4 0.2 0.2 - - - - -
Europe - - - - - 0.1 0.1 - - - - - -
Asia Pacific - - - - - - - - - - - - -
DCs - - - - - 0.1 0.1 - - - - - -
FSU - - - - - - - - - - - - -
Other Europe - - - - - - - - - - - - -
China - - - - - - - - - - - - -
Processing gains - - - - - - - - - - - - -
Total non-OPEC supply - - - - 0.1 0.6 0.4 0.3 0.1 - - - -
Total non-OPEC supply growth - - - - 0.1 0.6 0.4 0.3 0.1 -0.1 -0.6 -0.4 -0.2
OPEC NGLs + non-conventionals - - - - - -0.1 - - - - - - -
(b) Total non-OPEC supply and OPEC NGLs - - - - 0.1 0.5 0.4 0.2 0.1 - - - -
OPEC crude oil production (secondary sources) - - - - - -
Total supply - - - - 0.1 0.5
Balance (stock change and miscellaneous) - - - - 0.1 0.4
OECD closing stock levels (mb)
Commercial - - - - - 25
SPR - - - - - -2
Total - - - - - 23
Oil-on-water - - - - - -
Days of forward consumption in OECD
Commercial onland stocks - - - - - -
SPR - - - - - -
Total - - - - - -
Memo items
FSU net exports - - - - - - - - - - - - -
(a) - (b) - - - - -0.1 -0.4 -0.4 -0.2 -0.1 - 0.1 - -
* This compares Table 10.3 in this issue of the MOMR with Table 10.3 in the November 2015 issue. This table shows only where changes have occurred.

100 OPEC Monthly Oil Market Report – December 2015
Table 10.5: OECD oil stocks and oil on water at the end of period
2011 2012 2013 2014 4Q13 1Q14 2Q14 3Q14 4Q14 1Q15 2Q15 3Q15
Closing stock levels, mb
OECD onland commercial 2,617 2,683 2,589 2,738 2,589 2,611 2,681 2,749 2,738 2,815 2,905 2,967
Americas 1,308 1,365 1,316 1,446 1,316 1,317 1,387 1,416 1,446 1,483 1,537 1,578
Europe 914 912 881 886 881 885 889 897 886 939 938 946
Asia Pacific 395 405 392 405 392 409 405 436 405 392 430 443
OECD SPR 1,536 1,547 1,584 1,579 1,584 1,585 1,580 1,577 1,579 1,582 1,584 1,581
Americas 697 696 697 692 697 697 692 692 692 692 695 696
Europe 426 436 470 470 470 470 469 469 470 470 471 468
Asia Pacific 414 415 417 417 417 418 419 417 417 420 418 417
OECD total 4,154 4,230 4,174 4,317 4,174 4,196 4,260 4,326 4,317 4,397 4,489 4,548
Oil-on-water 825 879 909 924 909 954 914 952 924 864 916 924
Days of forward consumption in OECD
OECD onland commercial 57 58 57 58 57 58 58 59 59 62 63 64
Americas 53 55 55 57 55 55 57 57 60 61 62 63
Europe 68 68 66 67 68 66 65 67 66 69 68 70
Asia Pacific 47 48 46 48 44 53 52 52 46 51 56 54
OECD SPR 33 34 33 34 35 35 34 34 34 35 34 34
Americas 30 30 29 29 29 29 28 28 29 29 28 28
Europe 29 30 31 32 36 35 34 35 35 35 34 35
Asia Pacific 50 50 48 50 47 54 54 50 48 54 55 51
OECD total 90 92 90 92 91 93 93 93 93 97 97 98

OPEC Monthly Oil Market Report – December 2015 101
Table 10.6: Non-OPEC supply and OPEC natural gas liquids, mb/dChange Change
2012 2013 2014 3Q15 4Q15 2015 15/14 1Q16 2Q16 3Q16 4Q16 2016 16/15US 10.0 11.2 13.0 13.9 13.6 13.8 0.8 13.5 13.6 13.6 13.8 13.6 -0.2Canada 3.8 4.0 4.3 4.3 4.4 4.4 0.0 4.5 4.4 4.5 4.6 4.5 0.1Mexico 2.9 2.9 2.8 2.6 2.6 2.6 -0.2 2.5 2.5 2.5 2.4 2.5 -0.1OECD Americas* 16.7 18.2 20.1 20.8 20.6 20.7 0.7 20.4 20.5 20.5 20.8 20.6 -0.2Norway 1.9 1.8 1.9 1.9 1.9 1.9 0.0 2.0 1.9 1.9 2.0 1.9 0.0UK 1.0 0.9 0.9 0.9 0.9 1.0 0.1 0.9 0.9 0.9 1.0 0.9 0.0Denmark 0.2 0.2 0.2 0.2 0.2 0.2 0.0 0.2 0.2 0.2 0.2 0.2 0.0Other OECD Europe 0.7 0.7 0.7 0.7 0.6 0.7 0.0 0.6 0.6 0.6 0.6 0.6 0.0OECD Europe 3.8 3.6 3.6 3.7 3.7 3.7 0.1 3.7 3.6 3.5 3.7 3.6 -0.1Australia 0.5 0.4 0.4 0.4 0.4 0.4 0.0 0.4 0.4 0.4 0.4 0.4 0.0Other Asia Pacific 0.1 0.1 0.1 0.1 0.1 0.1 0.0 0.1 0.1 0.1 0.0 0.1 0.0OECD Asia Pacific 0.6 0.5 0.5 0.5 0.5 0.5 0.0 0.5 0.5 0.5 0.5 0.5 0.0Total OECD 21.1 22.2 24.2 24.9 24.7 24.9 0.7 24.6 24.5 24.5 24.9 24.6 -0.3Brunei 0.2 0.1 0.1 0.1 0.1 0.1 0.0 0.1 0.1 0.1 0.1 0.1 0.0India 0.9 0.9 0.9 0.9 0.8 0.9 0.0 0.8 0.9 0.9 0.9 0.9 0.0Indonesia 0.9 0.9 0.9 0.9 0.9 0.9 0.0 0.9 0.9 0.9 0.9 0.9 0.0Malaysia 0.7 0.7 0.7 0.7 0.7 0.7 0.1 0.8 0.8 0.8 0.8 0.8 0.0Thailand 0.4 0.4 0.4 0.4 0.4 0.4 0.0 0.4 0.4 0.4 0.4 0.4 0.0Vietnam 0.3 0.3 0.3 0.3 0.3 0.3 0.0 0.3 0.3 0.3 0.3 0.3 0.0Asia others 0.2 0.2 0.2 0.2 0.2 0.2 0.0 0.2 0.3 0.3 0.3 0.3 0.0Other Asia 3.6 3.5 3.5 3.5 3.5 3.6 0.1 3.6 3.6 3.6 3.7 3.6 0.1Argentina 0.7 0.7 0.7 0.7 0.7 0.7 0.0 0.7 0.7 0.7 0.7 0.7 0.0Brazil 2.6 2.6 2.9 3.1 3.1 3.1 0.2 3.1 3.1 3.2 3.3 3.2 0.1Colombia 1.0 1.0 1.0 1.0 1.0 1.0 0.0 1.0 1.0 1.0 1.0 1.0 0.0Trinidad & Tobago 0.1 0.1 0.1 0.1 0.1 0.1 0.0 0.1 0.1 0.1 0.1 0.1 0.0L. America others 0.3 0.3 0.3 0.3 0.3 0.3 0.0 0.3 0.3 0.3 0.3 0.3 0.0Latin America 4.7 4.8 5.0 5.2 5.2 5.2 0.2 5.1 5.2 5.2 5.3 5.2 0.0Bahrain 0.2 0.2 0.2 0.2 0.2 0.2 0.0 0.2 0.2 0.2 0.2 0.2 0.0Oman 0.9 0.9 0.9 1.0 1.0 1.0 0.0 1.0 1.0 1.0 1.0 1.0 0.0Syria 0.2 0.1 0.0 0.0 0.0 0.0 0.0 0.0 0.0 0.0 0.0 0.0 0.0Yemen 0.2 0.1 0.1 0.0 0.0 0.0 -0.1 0.0 0.0 0.0 0.0 0.0 0.0Middle East 1.5 1.4 1.3 1.2 1.2 1.3 -0.1 1.2 1.2 1.2 1.2 1.2 0.0Chad 0.1 0.1 0.1 0.1 0.1 0.1 0.0 0.1 0.1 0.1 0.1 0.1 0.0Congo 0.3 0.3 0.3 0.2 0.3 0.3 0.0 0.3 0.3 0.3 0.3 0.3 0.0Egypt 0.7 0.7 0.7 0.7 0.7 0.7 0.0 0.7 0.7 0.7 0.7 0.7 0.0Equatorial Guinea 0.3 0.3 0.3 0.3 0.3 0.3 0.0 0.3 0.3 0.3 0.3 0.3 0.0Gabon 0.2 0.2 0.2 0.2 0.2 0.2 0.0 0.2 0.2 0.2 0.2 0.2 0.0South Africa 0.2 0.2 0.1 0.1 0.1 0.1 0.0 0.1 0.1 0.1 0.1 0.1 0.0Sudans 0.1 0.2 0.3 0.3 0.3 0.3 0.0 0.3 0.3 0.3 0.3 0.3 0.0Africa other 0.3 0.3 0.3 0.3 0.3 0.3 0.0 0.3 0.3 0.3 0.3 0.3 0.0Africa 2.3 2.3 2.4 2.3 2.3 2.3 0.0 2.3 2.3 2.3 2.3 2.3 0.0Total DCs 12.0 12.0 12.2 12.2 12.2 12.3 0.1 12.2 12.3 12.4 12.5 12.4 0.0FSU 13.4 13.6 13.5 13.5 13.6 13.6 0.0 13.5 13.4 13.3 13.4 13.4 -0.2 Russia 10.5 10.6 10.7 10.8 10.8 10.8 0.1 10.8 10.7 10.7 10.7 10.7 -0.1 Kazakhstan 1.6 1.6 1.6 1.5 1.6 1.6 0.0 1.6 1.5 1.5 1.5 1.5 -0.1 Azerbaijan 0.9 0.9 0.9 0.8 0.8 0.9 0.0 0.8 0.8 0.8 0.8 0.8 0.0 FSU others 0.4 0.4 0.4 0.4 0.4 0.4 0.0 0.4 0.4 0.4 0.3 0.4 0.0Other Europe 0.1 0.1 0.1 0.1 0.1 0.1 0.0 0.1 0.1 0.1 0.1 0.1 0.0China 4.2 4.2 4.3 4.4 4.4 4.4 0.1 4.3 4.4 4.4 4.4 4.4 0.0
Non-OPEC production 50.7 52.2 54.4 55.2 55.0 55.3 1.0 54.8 54.7 54.8 55.4 54.9 -0.4
Processing gains 2.1 2.1 2.2 2.2 2.2 2.2 0.0 2.2 2.2 2.2 2.2 2.2 0.0Non-OPEC supply 52.9 54.3 56.5 57.4 57.2 57.5 1.0 57.0 56.9 57.0 57.6 57.1 -0.4OPEC NGL 5.4 5.4 5.6 5.7 5.9 5.7 0.2 5.9 5.9 5.9 5.9 5.9 0.2OPEC non-conventional 0.2 0.2 0.3 0.3 0.3 0.3 0.0 0.3 0.3 0.3 0.3 0.3 0.0OPEC (NGL+NCF) 5.6 5.6 5.8 6.0 6.1 6.0 0.2 6.1 6.1 6.2 6.2 6.2 0.2Non-OPEC & OPEC (NGL+NCF) 58.4 59.9 62.3 63.4 63.3 63.5 1.2 63.2 63.1 63.1 63.8 63.3 -0.2
* Chile has been included in OECD Americas.Note: Totals may not add up due to independent rounding.

102 OPEC Monthly Oil Market Report – December 2015
Table 10.7: World Rig CountChange Change
2011 2012 2013 2014 14/13 4Q14 1Q15 2Q15 3Q15 Oct 15 Nov 15 Nov/OctUS 1,880 1,919 1,761 1,862 101 1,912 1,380 909 866 790 760 -30Canada 423 364 354 380 26 406 309 99 191 185 178 -7Mexico 94 106 106 86 -20 78 67 59 42 38 38 0Americas 2,398 2,390 2,221 2,327 106 2,396 1,755 1,067 1,098 1,013 976 -37Norway 17 17 20 17 -3 16 17 18 18 15 14 -1UK 16 18 17 16 -1 17 18 14 13 14 12 -2Europe 118 119 135 145 10 148 132 116 109 108 108 0Asia Pacific 17 24 27 26 -1 25 21 17 16 16 14 -2Total OECD 2,532 2,533 2,383 2,499 116 2,569 1,908 1,200 1,222 1,137 1,098 -39Other Asia 239 217 219 228 9 229 214 203 201 197 194 -3Latin America 195 180 166 172 6 174 161 143 149 137 130 -7Middle East 129 136 102 108 6 105 103 98 100 101 108 7Africa 2 7 16 28 12 29 22 12 8 3 4 1Total DCs 565 539 503 536 33 537 499 456 458 438 436 -2Non-OPEC rig count 3,097 3,071 2,886 3,034 149 3,106 2,408 1,656 1,681 1,575 1,534 -41
Algeria 31 36 47 48 1 48 52 52 51 49 48 -1Angola 7 9 11 15 4 14 15 12 8 12 9 -3Ecuador 13 20 26 24 -2 21 17 15 12 6 4 -2Iran** 54 54 54 54 0 54 54 54 54 54 54 0Iraq** 36 58 83 79 -4 59 57 53 47 50 51 1Kuwait** 32 31 32 38 6 43 51 49 44 40 43 3Libya** 3 9 15 10 -4 8 6 3 1 1 1 0Nigeria 36 36 37 34 -3 36 35 29 28 28 28 0Qatar 8 8 9 10 2 10 9 8 7 6 5 -1Saudi Arabia 100 112 114 134 20 143 154 155 154 156 158 2UAE 21 24 28 34 6 38 38 39 41 50 54 4Venezuela 122 117 121 116 -5 106 108 105 114 113 112 -1OPEC rig count 461 513 576 596 20 579 595 575 561 565 567 2
Worldwide rig count* 3,559 3,584 3,462 3,631 169 3,685 3,002 2,231 2,242 2,140 2,101 -39of which: Oil 2,195 2,594 2,611 2,795 184 2,820 2,214 1,616 1,606 1,529 1,479 -50 Gas 1,257 886 746 743 -3 776 690 516 536 513 521 8 Others 103 106 109 95 -14 91 100 98 99 98 101 3
Note: Totals may not add up due to independent rounding. * Excludes China and FSU.na: Not available. ** Estimated figure when Baker Hughes Incorporated did Sources: Baker Hughes Incorporated & Secretariat's estimates. not reported the data.
OPEC Monthly Oil Market Report – December 2015 103
Contributors to the OPEC Monthly Oil Market Report Editor-in-Chief Omar S. Abdul-Hamid, Director, Research Division email: oabdul-hamid(at)opec.org Editor Hojatollah Ghanimi Fard, Head, Petroleum Studies Department email: h.ghanimifard(at)opec.org Analysts Crude Oil Price Movements Eissa Alzerma
email: ealzerma(at)opec.org
Commodity Markets Hector Hurtado email: hhurtado(at)opec.org
World Economy Afshin Javan email: ajavan(at)opec.org Imad Al-Khayyat email: ial-khayyat(at)opec.org Joerg Spitzy
email: jspitzy(at)opec.org World Oil Demand Hassan Balfakeih email: hbalfakeih(at)opec.org
World Oil Supply Mohammad Ali Danesh email: mdanesh(at)opec.org Product Markets and Refinery Operations Elio Rodriguez email: erodriguez(at)opec.org
Tanker Market and Oil Trade Anisah Almadhayyan email: aalmadhayyan(at)opec.org Stock Movements Aziz Yahyai email: ayahyai(at)opec.org Technical and editorial team Aziz Yahyai
email: ayahyai(at)opec.org Douglas Linton email: dlinton(at)opec.org
Data services Adedapo Odulaja, Head, Data Services Department (aodulaja(at)opec.org), Hossein Hassani, Statistical Systems Coordinator (hhassani(at)opec.org), Pantelis Christodoulides (World Oil Demand and Stock Movements), Klaus Stoeger (World Oil Supply), Harvir Kalirai (World Economy), Mouhamad Moudassir (Product Markets and Refinery Operations), Mohammad Sattar (Crude Oil Price Movements), Anna Gredinger (Tanker Market and Oil Trade) Editing, production, design and circulation Alvino-Mario Fantini, Maureen MacNeill, Scott Laury, Viveca Hameder, Hataichanok Leimlehner, Andrea Birnbach

104 OPEC Monthly Oil Market Report – December 2015
Disclaimer
The data, analysis and any other information contained in the Monthly Oil Market Report (the “MOMR”) is for informational purposes only and is not intended as a substitute for advice from your business, finance, investment consultant or other professional. The views expressed in the MOMR are those of the OPEC Secretariat and do not necessarily reflect the views of its Governing Bodies and/or individual OPEC Member Countries.
Whilst reasonable efforts have been made to ensure the accuracy of the MOMR’s content, the OPEC Secretariat makes no warranties or representations as to its accuracy, currency reference or comprehensiveness, and assumes no liability or responsibility for any inaccuracy, error or omission, or for any loss or damage arising in connection with or attributable to any action or decision taken as a result of using or relying on the information in the MOMR.
The MOMR may contain references to material(s) from third parties whose copyright must be acknowledged by obtaining necessary authorization from the copyright owner(s). The OPEC Secretariat shall not be liable or responsible for any unauthorized use of third party material(s). All rights of the Publication shall be reserved to the OPEC Secretariat, including every exclusive economic right, in full or per excerpts, with special reference but without limitation, to the right to publish it by press and/or by any communications medium whatsoever, including Internet; translate, include in a data base, make changes, transform and process for any kind of use, including radio, television or cinema adaptations, as well as sound-video recording, audio-visual screenplays and electronic processing of any kind and nature whatsoever.
Full reproduction, copying or transmission of the MOMR is not permitted in any form or by any means by third parties without the OPEC Secretariat’s written permission, however the information contained therein may be used and/or reproduced for educational and other non-commercial purposes without the OPEC Secretariat’s prior written permission, provided that OPEC is fully acknowledged as the copyright holder.

Next report to be issued on 18 January 2016.
OPEC Basket average price US$/b
November OPEC crude production mb/d, according to secondary sources
Economic growth rate per cent
down 4.52 in November
up 0.23 in November
November 2015 40.50
October 2015 45.02
Year-to-date 50.97
November 2015 31.70
October 2015 31.47
World OECD US Japan Euro-zone China India
2015 3.1 2.0 2.5 0.6 1.5 6.8 7.3
2016 3.4 2.1 2.5 1.2 1.5 6.4 7.6
Supply and demand mb/d
OECD commercial stocks mb
2015 15/14 2016 16/15
World demand 92.9 1.5 World demand 94.1 1.3
Non-OPEC supply 57.5 1.0 Non-OPEC supply 57.1 –0.4
OPEC NGLs 6.0 0.2 OPEC NGLs 6.2 0.2
Difference 29.4 0.4 Difference 30.8 1.5
Aug 15 Sep 15 Oct 15 Oct 15/Sep 15 Oct 14Crude oil 1,470 1,481 1,499 17.5 1,363
Products 1,481 1,486 1,456 –29.2 1,367
Total 2,950 2,967 2,955 –11.7 2,729
Days of forward cover 63.7 63.6 63.5 – 0.1 59.1


