Embed Size (px)
Citation preview

OECD Economic Outlook No. 76
1
IV. OIL PRICE DEVELOPMENTS: DRIVERS, ECONOMIC CONSEQUENCES AND POLICY RESPONSES
Introduction
The price of oil has risen significantly
At the end of October the oil price had more than doubled in dollar terms since the late 1990s, while increasing substantially, though somewhat less, in terms of the other major currencies (Figure IV.1). The chapter begins by investigating the fundamentals driving longer-term oil market developments and the implications for the long-run equilibrium price. It then identifies short-term influences which may have caused risk premia to rise, volatility to increase, and the oil price to diverge from its equilibrium. It concludes with an assessment of the impact of higher oil prices on OECD growth and inflation and the implications for economic policy.
The main points to emerge from the analysis are as follows:
Global dependence on oil will continue…
� Notwithstanding more efficient use of oil in production, oil is likely to retain its importance as a fuel in the longer term, increasingly for transport. In addition to expected strong demand in North America, strong oil demand growth from rapidly growing and energy-intensive non-OECD countries would entail an upward structural shift in the demand for oil per increment of global GDP.
…with growing reliance on OPEC…
� While global oil reserves are probably relatively ample, their distribution is likely to be increasingly concentrated on the Middle Eastern members of OPEC, which already account for around two-thirds of global proved reserves. Outside the Middle East, newly-discovered resources have tended to become smaller and more expensive to develop, being increasingly offshore.
… and a likely trend rise in the oil price…
� The OECD baseline scenario used here generates a trend rise in the real oil price from $27 per barrel in 2003 to $35 a barrel by 2030, both prices expressed in year 2000 dollars, if initial OPEC/non-OPEC market shares are maintained over the projection horizon.
… the more so if growth is strong and oil-intensive
� Higher GDP growth assumptions, or higher income elasticities of demand, especially in China and the rest of the non-OECD, could imply that prices rise significantly more than in the baseline scenario, or that OPEC is prepared to increase

OECD Economic Outlook No. 76
2
Source: OECD Economic Outlook 76 database.
Quarterly Brent crude oil price deflated by US consumer price index
Figure IV.1. Oil prices: a historical perspective
A. Brent crude oil price in key currency termsMonthly averages
B. Real oil price
0
10
20
30
40
50
60
70
80
90
1971 74 77 80 83 86 89 92 95 98 2001 04
$ per barrel (2000 prices)
0
5
10
15
20
25
30
35
40
45
50
55
1997 98 99 2000 01 02 03 04
�������������
0
500
1000
1500
2000
2500
3000
3500
4000
4500
5000
5500 ¥ per barrel
Dollar (left scale) Euro (left scale) Yen (right scale)
OECD Economic Outlook No. 76
3
its market share significantly (from 38 per cent in 2003 to around 55 per cent by 2030).
Non-OPEC supply and demand responses limit OPEC’s market power…
� Over the longer term, behavioural responses to higher prices could constrain cartel-like behaviour, particularly given the endogenous but non-reversible nature of technological progress in non-conventional supply and in oil consumption.
… but volatility and uncertainty depresses investment…
� In the short run, the low price elasticities of global demand and non-OPEC supply make oil prices highly sensitive to supply and demand shifts. Price volatility, compounded by geopolitical tensions, raises uncertainty about underlying price trends may depress oil exploration. OPEC’s excess capacity is currently the lowest in three decades, providing little cushion to raise supply in the event of unexpected oil market disruptions.
… and bottlenecks have put upward pressure on prices
� Transportation bottlenecks have emerged recently as the changing geographical composition of demand has put pressure on the tanker fleet. In addition, regional mismatches between the grade of oil supplied and demanded have seen premia on low sulphur oil rise.
The current price shock could be prolonged.
� It is not clear how rapidly short-term factors boosting the oil price will endure, hampering the return to long-term equilibrium prices. However, some stickiness seems to be indicated by the far futures prices, which have risen to historical highs.
The link between the oil price and core inflation has weakened…
� The pass-though from oil price increases to core inflation has been very limited in recent years, consistent with the increasing focus of monetary authorities on core inflation as the measure to be monitored or targeted and hence with expectations that monetary policy will respond to offset any pass-through from headline inflation to wages and non-energy prices. Going forward, the established credibility of monetary policies should ensure that oil price rises do not become embedded into inflation expectations to an extent requiring a significant rise in nominal interest rates.
… and oil price shocks tend to have only a moderate impact on output
� Traditional model analysis suggests that the likely impact on OECD output following an oil price hike of the magnitude experienced recently is relatively moderate in the short run. However, such models may not pick up supply-side effects and may not allow for asymmetries, where price increases have a more significant effect on output than do price decreases.
Economic policy should respond cautiously to oil price shocks
� A high tax component of the final price reduces oil intensity and hence the terms-of-trade and inflation impacts of such shocks. Using fiscal policy to stabilise end-user prices may hinder adjustment that could reduce an economy’s oil dependence.

OECD Economic Outlook No. 76
4
Longer-term prospects for the oil market
The oil intensity of production has fallen…
World oil demand (measured as ex post supply net of stock movements) has decelerated significantly over the past thirty years, largely reflecting a decline in the oil intensity of production -- total oil consumption per unit of output -- in OECD countries (Figure IV.2). This is an outcome of more efficient use of oil, as ongoing fuel-saving technical change has contributed to continuing reductions of energy intensities, an increasing utilisation of alternative energy sources, such as natural gas in power generation, and a shift in the composition of output towards less oil intensive sectors. By contrast, in non-OECD countries oil intensities have generally increased slightly up to the mid 1990s -- partly reflecting a change in production structure towards manufacturing and increasing vehicle ownership -- before falling marginally.
Note: Oil intensity is defined as total primary oil use per unit of output (GDP).
Source: OECD Economic Outlook 76 database and International Energy Agency.
Figure IV.2. Oil intensity of production has fallen in the OECD area
50
60
70
80
90
100
110
120
130
140
150
1970 1975 1980 1985 1990 1995 2000
Index, 1970=100
OECD
Developing countries
… but the global economy will remain reliant on oil…
Looking forward, and on the assumption that global growth will average around 3 per cent per annum over the period from 2000 to 2030, the International Energy Agency (IEA) has projected that global oil demand will increase by around 1 per cent annually over the same period, leading to a
OECD Economic Outlook No. 76
5
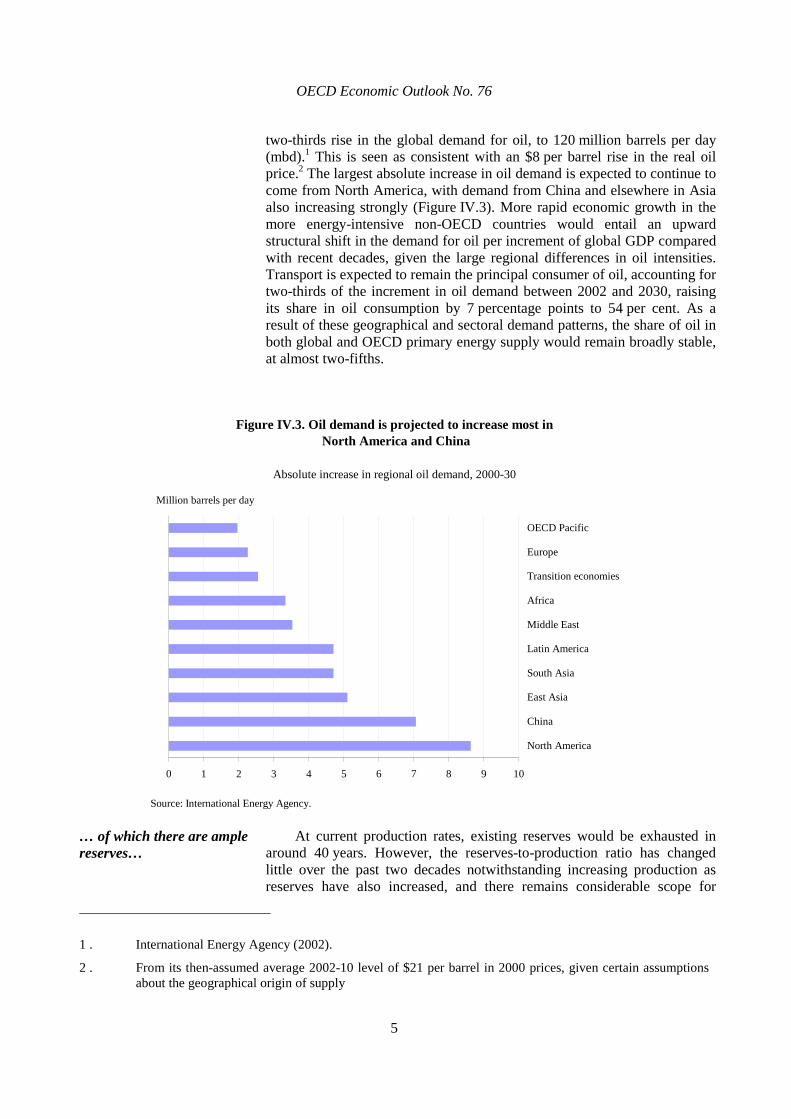
two-thirds rise in the global demand for oil, to 120 million barrels per day (mbd).1 This is seen as consistent with an $8 per barrel rise in the real oil price.2 The largest absolute increase in oil demand is expected to continue to come from North America, with demand from China and elsewhere in Asia also increasing strongly (Figure IV.3). More rapid economic growth in the more energy-intensive non-OECD countries would entail an upward structural shift in the demand for oil per increment of global GDP compared with recent decades, given the large regional differences in oil intensities. Transport is expected to remain the principal consumer of oil, accounting for two-thirds of the increment in oil demand between 2002 and 2030, raising its share in oil consumption by 7 percentage points to 54 per cent. As a result of these geographical and sectoral demand patterns, the share of oil in both global and OECD primary energy supply would remain broadly stable, at almost two-fifths.
Source: International Energy Agency.
Figure IV.3. Oil demand is projected to increase most in North America and China
Absolute increase in regional oil demand, 2000-30
0 1 2 3 4 5 6 7 8 9 10
North America
China
East Asia
South Asia
Latin America
Middle East
Africa
Transition economies
Europe
OECD Pacific
Million barrels per day
… of which there are ample reserves…
At current production rates, existing reserves would be exhausted in around 40 years. However, the reserves-to-production ratio has changed little over the past two decades notwithstanding increasing production as reserves have also increased, and there remains considerable scope for
1 . International Energy Agency (2002).
2 . From its then-assumed average 2002-10 level of $21 per barrel in 2000 prices, given certain assumptions about the geographical origin of supply

OECD Economic Outlook No. 76
6
substantial additions to reserves.3 The concept of proved reserves is linked to commercial viability and therefore reserves have increased in response both to oil price shifts and to technological changes, which have both allowed the extraction of new sources and increased the share of oil within a deposit that can be extracted. However, newly-discovered resources have tended to be smaller and more expensive to develop, being increasingly offshore, and the costs of exploration, development and production are higher than in the reserve-rich Middle East.
… but largely in the Middle East…
Against this background, and while oil reserves will probably remain relatively ample, their distribution is likely to be increasingly concentrated on the Middle Eastern members of OPEC, which already account for around two-thirds of global proved reserves (Figure IV.4). However, with reserves concentrated in a limited number of OPEC countries, where investment is not allocated according to market forces, investment in the energy sector may not be sufficient.4
…affording OPEC potential market power
Global investment, supply and price extrapolations are contingent upon the extent to which OPEC (or a subset of OPEC countries) will exercise its market power. Exploration, development, and extraction costs in the Middle East are reported to be less than $5 per barrel, while short-run marginal costs are generally estimated to be below $2 per barrel.5 Other suppliers face much higher, and probably more steeply increasing marginal costs than OPEC and the reserve-rich producers in the Middle East have incentives to exploit this cost advantage by trading off market share for a higher price. The less elastic global oil demand and non-OPEC supply are in the long run, the greater are OPEC’s incentives to restrict output and thus raise prices in the face of rising world demand.
… though this is limited, especially in the longer run
The longer-run supply and demand characteristics of the oil market are thus crucial determinants of future price trends. First, estimates of the long-run non-OPEC price elasticity of supply vary from a low of 0.1 to a relatively high 0.6. Second, the elasticity of non-OPEC supply may be non-linear insofar as at a certain point the oil price would be pushed up sufficiently to encourage investment to promote the production of (ample) non-conventional oil in other countries or alternative backstop technology, such as the liquefaction of other plentiful fossil fuels. For example, the cost of extraction of oil from tar sands in Canada has fallen considerably over past decades, and expectations of a sustained high oil price may trigger investment in expanding such activity. Third, higher prices induce
3 . US Geological Survey (2000).
4 . International Energy Agency (2003) contains a “restricted investment outlook” that considers the impact of lower investment in the Middle East, resulting in a lower supply and higher price (rising to $35 from $29 per barrel in the baseline). Kohl (2002) documents some of the deterioration in public finances in many OPEC countries. In the future, demographic pressures may also place additional strain on the public finances of OPEC members.
5 . Maurice (2001).

OECD Economic Outlook No. 76
7
Source: BP and International Energy Agency.
A. Proved oil reserves
B. Oil production
Figure IV.4. Proved oil reserves appear adequate for the next few decades relative to current production
0
200
400
600
800
1000
1200
1980 1990 2000
OPEC Commonwealth of Independent States OECD Other
Billion barrels
0
10
20
30
40
50
60
70
80
1970 1975 1980 1985 1990 1995 2000
Million barrels per day
OECD Economic Outlook No. 76
8
investment in (non-reversible) energy-saving technology or substitution between fuels, tending to make the price elasticity of demand for oil asymmetric.
Oil price scenarios to 2030
In the baseline scenario the oil price rises to $35 in 2030…
To explore possible oil price scenarios over the coming quarter of a century, a number of longer-term oil-price simulations have been undertaken, using a simplified spreadsheet model of the global oil market (see Appendix IV.1).6 The baseline scenario is one in which initial market shares are maintained (38 per cent for OPEC) over the projection horizon and the non-OPEC price elasticity of supply is assumed to be in the middle of the range of estimated elasticities.7 With market shares constant while demand is steadily growing, non-OPEC producers are assumed to pass into oil prices the expected rise in long-run marginal costs, as new additions to reserves and enhanced recovery techniques are increasingly required to raise their production levels. On the basis of these assumptions, and using the potential growth rates embodied in the OECD’s Medium-term Reference Scenario for the period up to 2010, the baseline generates a rise in the real oil price to $35 by the end of the projection period (2030), from $27.4 per barrel in 2003.
… which might be seen as an equilibrium price…
The baseline could be interpreted as an estimate of the equilibrium long-term price (contingent upon the elasticities adopted) only under certain assumptions. First, and most importantly, the starting point for the oil price (in 2003) would itself have to be considered as a long-run equilibrium. The 2003 price of $27 per barrel was achieved against the background of an already volatile oil market, so the spot price may already have included a short-term risk premium, but it was one where supply and demand were relatively well matched. Second, an oil market evolution based on a stable OPEC market share would need to be seen as the most likely supply side outcome.
… though this depends on OPEC behaviour
The equilibrium price could well differ quite substantially according to the OPEC supply and pricing strategy adopted (Table IV.1). Keeping the elasticity of non-OPEC supply unchanged and allowing OPEC supply to meet the additional demand, OPEC’s share of the oil market would have to rise by around 6 percentage points compared with the baseline to limit the oil price to $30 in 2030. It would have to rise by a further 5 to 6 percentage points to achieve and maintain a price of $25. This would take the OPEC share to around 50 per cent, which would not be unusual historically.
6 . The model is designed specifically to examine the impact of aggregate demand and supply developments on the oil price and should not be confused with the IEA’s more comprehensive and disaggregated World Energy Model. For further discussion see Brook et al (2004).
7 . The assumption of constant market shares is adopted as being consistent with the maintenance of the existing diversification of supply. The long-term projections of oil demand also assume that there will be no major changes in the structure of energy supply.

OECD Economic Outlook No. 76
9
Table IV.1. OPEC’s market share under different assumptions
Oil pricea OPEC supply (Mbd)
OPEC market
share (%)
Per cent change in
OPEC supply
$35 53.3 38.4 ..
$25 23.8 11.6 45 $30 11.9 6.1 22 $40 -11.9 -6.8 -22
a) Constant 2000 dollars. Source: OECD calculations.
Deviations from baseline in 2030
Baseline value in 2030
Price extrapolations are sensitive to assumptions…
The results summarised in Table IV.2 explore the sensitivity of the oil price extrapolations to different assumptions about GDP growth, income and price elasticities of oil demand, and non-OPEC supply elasticities. In Part A of the table (the first four columns), the scenarios are based on the assumption that OPEC targets a constant market share (38 per cent) regardless of the price implications.
… about growth rates, income elasticities of demand…
The first two scenarios suggest that oil price projections may be particularly sensitive to assumptions about the demand for oil. Moderate variations in global growth (½ per cent per annum stronger except in China, where the variation is 1 per cent) could push the oil price up by an additional $4.50 by 2030 (scenario group 1), while an increase of 0.2 in the income elasticity of oil demand could lead to an oil price some $13 higher (scenario group 2). In both cases, the magnitude of the shock imposed is plausible; any GDP growth projections over a 25-year horizon will have significant error bounds associated with them, and the range of estimates for long-run elasticities of demand with respect to income is sufficiently wide to suggest that a 0.2 percentage point change relative to the baseline assumption is possible. Although the scenarios presented in Table IV.2 are for positive shocks to growth and the income elasticity, negative shocks are equally plausible (with the impact approximated by reversing the signs in Table IV.2). As discussed in the annex, the model already assumes that the income elasticity of demand has declined since the 1970s, consistent with falling oil intensity and on-going technological change. But this process could continue over the next 25 years, resulting in even lower income elasticities.
… and the price elasticities of demand and non-OPEC supply
The next two scenarios suggest that oil price projections are sensitive to assumptions about the price elasticity of demand (scenario group 3) and the non-OPEC supply elasticity (scenario group 4). In the baseline scenario, the price path is relatively flat and the effect of changed elasticity assumptions on the oil price relatively small. In both cases the magnitude of shock assumed (0.2) seems reasonably significant relative to the range of estimates in the economic literature, and this magnitude of shock affects the oil price

OECD Economic Outlook No. 76
10
Table IV.2. Oil price extrapolations under selected demand and supply scenariosDeviations from baseline a
A. Oil price in constant 2000 dollars B. OPEC target price band +/- 10% from baseline(fixed OPEC market share target - 38%) 2030
2004 2010 2020 2030OPEC Supply
(Mbd)OPEC Market share (percentage points)
1. Higher growthOECD (+1/2%) 0.2 0.6 1.0 1.4 0.6 0.0China (+1%) 0.1 0.3 0.7 1.3 0.5 0.0Rest of the world (+1/2%) 0.2 0.5 1.1 1.9 0.8 0.0World 0.4 1.5 3.0 4.6 4.5 1.5
2. Higher income elasticitiesOECD (+0.2) 0.7 1.9 3.1 4.1 2.6 0.6OECD and China (+0.2) 0.9 2.6 4.5 6.5 9.6 3.9World (+0.2 for ROW) 1.4 4.6 8.7 13.2 29.0 11.7
3. Lower price elasticitiesof demandOECD (+0.2) 0.0 0.0 0.2 0.4 0.2 0.0China (+0.2) 0.0 0.0 0.0 0.1 0.0 0.0Rest of the world (+0.2) 0.0 0.0 0.1 0.4 0.2 0.0World 0.0 0.0 0.5 1.2 0.5 0.0
4. Different non-OPEC priceelasticities of supplyHigher (+0.2) 0.0 -0.1 -0.3 -0.6 0.3 0.0Lower (-0.2) 0.0 -0.1 0.4 0.9 -0.5 0.0
5. Higher growth and income elasticitiesin non-OECD countriesb
China 0.3 1.1 2.6 4.8 5.0 1.8World excluding OECD 1.1 4.0 8.7 14.9 34.4 13.6
6. Higher growth and income elasticitiesand lower price elasticities of demandb
China 0.3 1.1 2.8 5.3 6.3 2.5Rest of the world 0.8 3.1 7.3 13.2 24.9 10.3World excluding OECD 1.2 4.5 10.9 20.1 38.9 15.1
a) Assumptions in the left column are also shown as deviations from baseline. Since price elasticities are negative a positive change implies a lower elasticity
(in absolute terms).
b) Scenarios 5 and 6 are simulated as combinations of scenarios 1, 2 and 3 where relevant, for the country or region concerned.
Note : Rest of the World is defined as the total world less China and the OECD.Source : OECD calculations.

OECD Economic Outlook No. 76
11
by around $1 by 2030. However, the non-OPEC supply elasticity becomes much more important in scenarios where the price increases significantly and remains at the new level.
There is particular uncertainty about non-OECD demand
In terms of the global composition of oil demand, there is significant uncertainty about the likely path of oil demand from non-OECD countries. The risk of exceptionally strong demand from the non-OECD region is addressed in the final two scenarios, which combine the high growth scenario with higher income elasticities of demand in China and the rest of the world (scenario group 5), and with the additional effect of lower long-run price elasticities (scenario group 6). These results suggest that stronger demand and a higher income elasticity in China alone would be sufficient to push prices up by an additional $5 per barrel by 2030, with the rest of the world pushing prices up by a further $10. In the most extreme case, the final scenario in the table suggests that the oil price could rise by around $20 relative to the baseline price of $35 per barrel.8
OPEC has an interest in preventing large price movements…
The consequences of an alternative OPEC reaction function have been investigated in the last two columns of Table IV.2 (Part B). Instead of aiming at a fixed market share, OPEC is assumed to behave in a way that mimics OPEC’s declared policy of attempting to maintain oil prices within a band. In particular, OPEC is assumed to adjust supply in order to prevent the price from moving by more than 10 per cent from the baseline price. In this context, some events, such as a ½ per cent per annum increase in OECD growth or a change to the price elasticity of demand, could be accommodated without an increase in OPEC share. But more significant shocks such as slower reductions in oil intensities, or combination scenarios, could require OPEC to adjust supply substantially. In order to restrict price rises to no more than 10 per cent, the scenarios that incorporate robust, oil intensive and price-inelastic growth in non-OECD countries (scenario groups 5 and 6) would require OPEC to increase output significantly. The most extreme scenario suggests that OPEC would need to increase supply by 39 million barrels per day (relative to 51 million bpd in the baseline). In turn this would imply that global dependence on OPEC would increase from around 38 per cent to 53 per cent.
… and is likely to prevent the price rising too far...
The OPEC reaction function -- and in particular the question of whether OPEC responds to demand shifts by allowing the price to rise or by a matching supply shift -- is obviously crucial to any long-term oil price projection. In this context, it may be interesting to note that, comparing the revenue outcomes of the two strategies, the illustrative scenarios tentatively suggest that stabilising the price while expanding output (as in scenario 6 of Part B of the simulations), might result in significantly higher revenues than would accrue if OPEC’s share were fixed.9 This implies that the longer-term
8 . In interpreting this result it should be kept in mind that the model does not embody the availability of considerable backstop supplies at a particular price level.
9 . In scenario A6 OPEC achieves a 56 per cent increase in the oil price while supply rises by 15 per cent; in scenario B6 the oil price rises by 10 per cent while supply increases by 82 per cent. The incremental
OECD Economic Outlook No. 76
12
price elasticities of non-OPEC supply and of global oil demand could act as “softeners” on cartel-like behaviour. This would apply all the more if the demand elasticity is asymmetric, as it appears to have been in the past, being higher when prices move up than when they decline. Such a response is not built into the spreadsheet model. However, any conclusion about the relative benefits of stabilising market share or price would seem to be heavily contingent on the choice of supply and demand elasticities, which remains unavoidably somewhat arbitrary.10
… but short-term price volatility and uncertainty can depress investment
In the short term both the global demand and non-OPEC supply elasticities are very low, leading to considerable price volatility, and this may depress investment in exploration and development needed to ensure that supply is elastic in the longer term. Higher oil prices do indeed appear to induce greater investment activity by non-OPEC producers in identifying and developing new reserves. However, price volatility may increase long-term price uncertainty, prompting oil companies to require a greater rate of return on their investment. In this respect, current uncertainties about oil prices may limit the hike in investment activity by non-OPEC oil producers that would otherwise follow from current high prices. And one consequence of the reduced investment over the 1990s could be limited flexibility in the supply response to higher prices over the near-term horizon. The next section considers the role of supply and demand shocks and associated volatility in driving the oil price away from its trend level and how long such price spikes might last.
Short-term influences on oil price movements
The oil price has increased far more than implied by fundamentals…
So far in 2004, oil prices have increased significantly more than would be implied by longer-term fundamentals, reaching levels similar (in real terms) to those attained in the mid-to-late 1970s following the first oil shock, while being still much below the real oil price of the early 1980s. Spikes in oil prices are not unusual and are, to some extent, symptomatic of a gradual upward trend in daily oil price volatility since the early 1980s. In this regard, crude oil prices have become more volatile than the prices of other commodities since 1987, most of which have been less volatile than over the 1974 to 1986 period (Table IV.3).
revenue calculations which result from these shifts would need to be evaluated with respect to costs and option values to determine which strategy was optimal.
10 . Gately (2004), in an investigation of possible OPEC strategies, finds that a competitive market strategy, which would see OPEC’s market share rising constantly over time, would be inferior for its members to one that restricts output. An optimal OPEC strategy in one of Gately’s central scenarios would result in an OPEC market share of 37 per cent.

OECD Economic Outlook No. 76
13
Table IV.3. Crude oil prices have become more volatile than the pricesof other commodities
Standard deviation of monthly percentage changes
1974-1986 1987-2004 Difference
Agricultural raw materials 3.1 2.5 -0.6Food and beverages 5.5 3.1 -2.3Food 6.0 3.5 -2.5Tropical beverages 6.1 6.5 0.4Vegetable oil 6.8 4.8 -2.0Minerals and metals 3.3 3.7 0.4Gold bullion 6.0 3.7 -2.3Crude oil (Brent) 4.4 9.2 4.8
Source: Datastream.
… and is driven by stronger than anticipated demand…
An important contributor to the recent spike in oil prices has been unexpectedly strong demand for oil. The difficulties of forecasting global economic activity are well known, and misjudgements can, at times, have an important impact on oil prices.11 In the most recent episode, oil demand was particularly underestimated in China, where strong demand has been related to the vigorous investment cycle over the recent past (Table IV.4). This has been exacerbated by an inadequate electricity distribution network, which has prompted significant investment in diesel generators.
Table IV.4. The United States and China have been major sources of incremental oil demand since 1995
Oil demand (level)Share of
incremental demand
Million barrels per day Per cent
1995 2000 2004 1995-2004
United States 18.0 20.0 20.5 19.9China 3.3 4.6 6.3 24.3India 1.7 2.3 2.5 6.5Dynamic Asiaa 3.7 4.3 5.0 9.8OECD (excl. US) 26.9 27.8 28.8 15.7Rest of the world 16.2 17.3 19.1 23.7
Total 69.8 76.2 82.2 100
a) Includes Chinese Taipei; Hong-Kong, China; Indonesia; Malaysia; the Philippines; Singapore and Thailand.Source: International Energy Agency.
11 . For example, in 1997, the sharp and unexpected slowdown in the Asian economies coincided with an increase in the OPEC production target, and the oil price tumbled from almost $25 to just below $10 per barrel between early 1997 and early 1999 (Adelman, 2002).

OECD Economic Outlook No. 76
14
… a limited ability to respond on the supply side…
OPEC’s excess capacity, currently estimated to be just over 1 million barrels per day, is at its lowest level since the early 1990’s, providing little cushion in the event of unexpected oil market disruptions (Figure IV.5, panel A). This state of affairs has been largely attributed to insufficient investment in new extraction capacity over recent years and may result from mistaken expectations together with the long gestation lags applying to capital investment. Furthermore, as mentioned above, restraints on foreign direct investment and on the role of the enterprise sector in financing energy projects may be playing a role. Some of the price volatility noted above could be associated with a lack of transparency that deprives the market of reliable up-to-date information on global supply. As a result, OPEC “news” can move oil prices sharply, exacerbating oil price volatility and contributing to greater uncertainty about longer-term price trends.
… low oil industry inventories…
The number of days of forward cover provided by OECD industry stocks has been on a longer-term downward trend, and though inventories have picked up in 2004, it is not yet clear whether the increase will be sufficient to halt that trend (Figure IV.5, panel B). Globally, by historical standards, the industry margin to meet unexpected demand increases remains relatively low. In this context, low stocks could mean that the market is more exposed than normal to potential disruptions and regional supply imbalances, and hence to persisting volatility, which may be pushing the oil price (see Appendix IV.2). Volatility increases the demand for stocks (by increasing the value of the convenience yield which attaches to the physical ownership of oil), and thus pushes up the spot price relative to the forward price. This state of strong “backwardation” has been an unusually persistent characteristic of the oil market during the current episode, implying that the futures price has been a poor predictor of the actual future price. There may be an element of unstable dynamics here, by which the combination of supply uncertainty, high inventory demand and low stocks causes persistent price volatility.
… transportation bottlenecks…
Transportation bottlenecks for both crude and refined oil products also seem to have put upward pressure on oil tanker rates (Figure IV.5, panel C), with likely consequences for crude oil prices. Tight capacity is partly a result of unexpectedly high demand, and partly due to changes in the global composition of demand and supply, with more tankers required to meet longer supply lines. New orders of tankers are currently high, although there is a significant time delay (three to four years) to bring new capacity into service.
… and regional supply imbalances
Even when the global supply of oil is sufficient to meet global demand, there are often regional mismatches between the grade of oil supplied and that demanded. For example, recent final product price volatility and widening premia on types of crude oil reflect tightening regulations on fuel quality and short-run constraints on refinery capacity, especially in the United States. In particular, the available heavy, high-sulphur oil in early 2004 was of relatively little use for gasoline production, raising the premium on light, low-sulphur oil.

OECD Economic Outlook No. 76
15
Figure IV.5. Short-term influences on the oil price
0
5
10
15
20
25
30
35
40Million barrels per day
1970 71 72 73 74 75 76 77 78 79 80 81 82 83 84 85 86 87 88 89 90 91 92 93 94 95 96 97 98 99 2000 01 02 03 04
A. OPEC spare capacity has diminished
Capacity Production
45
50
55
60
65
70Days
1990 91 92 93 94 95 96 97 98 99 2000 01 02 03 04
B. Days of forward cover of oil industry stocks have been trending down
Actual Smoothed
0
10
20
30
40
50
60
70
80
90Thousand dollars per day
1980 81 82 83 84 85 86 87 88 89 90 91 92 93 94 95 96 97 98 99 2000 01 02 03 04
C. Transportation bottlenecks may be pushing up prices
Tanker rates 1
-200
-150
-100
-50
0
50
100
150Thousands of net contracts
1995 96 97 98 99 2000 01 02 03 04
D. Net long positions of non-commercial traders have picked up
Non-commercial traders Commercial traders
2
1. Quarterly average very large crude carrier (VLCC) rates for key routes.2. Data include futures and options contracts. Each contract is for one thousand barrels. Data from February 1st to mid-may 2000 are unavailable.Source: International Energy Agency, P.F. Bassøe AS, US Securities and Exchange Commission.

OECD Economic Outlook No. 76
16
In addition, geopolitical tensions have raised uncertainty…
Geopolitical tensions and uncertainty stemming from acts of sabotage on oil facilities in the Middle East and fears of disruption in other oil producing counties have added an additional “risk premium” to the oil price, related to the possibility of a significant disruption to supply capabilities, of a magnitude experienced in the major oil shocks of the past.12 Given this risk, Box IV.1 examines the possible impact of a severe supply disruption based on previous supply shocks.
Box IV.1. The impact of an oil supply crisis
To investigate the possible consequences of a serious supply disruption, the model was used to simulate the impact of a severe disruption of global oil supply by 7 per cent.1 In the first simulation (the “bad case” scenario), post-crisis output is assumed to recover linearly to baseline levels over the following decade. In this case, using the baseline parameter assumptions described in the Annex, the results suggest that the oil price would need to rise by around $20 per barrel in the first year in order to equilibrate demand and supply. Prices would then fall back to their baseline level relatively quickly.
In the second simulation (the “worse case” scenario) the recovery is assumed to be slower, with production remaining at its initial post-disturbance level for ten years before recovering linearly to the pre-crisis production level over the following decade. In this case the short-term spike in prices would be the same as in the bad case scenario. However, since production remains permanently below baseline, the price would remain around 20–25 per cent above the baseline price throughout the projection horizon. Finally, it is worth noting that these simulations capture only the increase in the price that would be required to equilibrate demand and supply given the reduction in supply, and as such they probably underestimate the total short-term price shock. This is because the uncertainty and risks that would accompany such a supply shock may also provoke a significant increase in the risk premium.
An oil supply crisis could push prices up significantly
10
20
30
40
50
60
70
1975 1980 1985 1990 1995 2000 2005 2010 2015 2020 2025 2030
2000 dollar prices
Actual and baseline Bad case scenario Worse case scenario
________________________
1. This magnitude of the disruption approximates the size of past exogenous supply shocks (see Hamilton, 2003).
12 . Estimates of the “risk premium” are typically derived from a subjective analysis of what the oil price would be in the absence of geopolitical tensions.
OECD Economic Outlook No. 76
17
… and speculation may have played a role
One gauge of speculative pressure is the volume of oil futures and options contracts traded on the New York Mercantile Exchange, where registration of all traders with large positions allows the data to be broadly separated into commercial and non-commercial categories. On this basis, there was a significant increase in the net long positions of non-commercial traders in late 2003, supporting the view that there was a pick-up in speculative activity (Figure IV.5, panel D). More recently, the extent of speculative demand seems to have fallen back somewhat, consistent with prices having risen and speculators taking profits. However, the net impact of speculation on the oil price is likely to be small (Box IV.2).
Box IV.2. The impact of speculation
Concerns have surfaced repeatedly about the possibly destabilising role of speculative hedge funds, or commodity pools, which may shift large sums of “hot money” between different markets at the first sign of a possible higher rate of return elsewhere.1 In this sense, the term “speculators” usually refers to investors who trade oil futures with a view to profiting from the rise or fall of prices; they have no exposure to the physical oil commodity.2 In contrast, hedgers generally have sizable spot or forward market commitments and trade futures contracts in order to minimise their exposure to price fluctuations.
Although the positions held by non-commercial traders make up only a relatively small proportion of total futures and options contracts traded, their net positions can be very significant and any sudden changes in these net positions could have an important influence on prices from time to time. Thus, speculation may exacerbate price volatility, particularly when news about the fundamentals is itself changing rapidly. At the same time, if speculators are successful, then the amplitude of the price cycle may be reduced. This would be the case if speculators correctly anticipate a turning point in prices and clip the peaks and troughs by selling or buying just prior to the turning point.
It is very difficult to judge whether speculators have any impact on the average level of prices. There are two reasons for this. First, it is not easy to distinguish between a situation in which hedgers move market prices (and speculators merely take the other side of the market) and the opposite one, where speculators are behind price movements. Second, changes in market fundamentals should affect both oil prices and the desired futures positions of hedgers and speculators. Thus, any correlation between prices and changes in speculators positions does not necessarily imply that that speculation has caused the price movements. Most robust empirical studies have found little evidence that speculation plays a role in price determination in the oil futures market.3 Even if speculators can temporarily raise prices by buying futures contracts, they cannot unload these positions at the higher price without a change in market fundamentals. In fact, the very action of unwinding their large positions would cause prices to fall.
________________________
1. Dale and Zyren, 1996.
2. Ederington and Lee, 2000.
3. Weiner, 2002.
The deviation from the “equilibrium” price could be prolonged
The degree of persistence will most likely depend on whether fears about future oil shortages prove to be valid. If, for example, a lasting solution were to be found for current geopolitical concerns, it is likely that the current spot price would fall back significantly. The speed of the price fall would depend on the gap between actual and desired inventories. If, on the other hand, the current state of uncertainty turns out to be prolonged, a relatively high spot price (and high volatility) may well persist. Indeed, the

OECD Economic Outlook No. 76
18
probability that there is a degree of expected persistence in the current price spike is supported by the fact that the far futures price of oil, which reflects the price for contracts six to seven years out has also increased quite sharply. Moreover, rising oil company share prices reflect a revaluation of their oil assets over the past few years which is consistent with an increase in longer-term oil price projections of around $5 per barrel.
The economic effects of oil price movements
Oil price shocks have become less inflationary…
The quantitative relationship between oil prices, economic activity and inflation is complex (Box IV.3) but seems to have weakened over time for a number of reasons. First, the weight of oil and oil products in price indices has fallen. Second, many economies have raised specific taxes on gasoline, which reduces the impact of a per-barrel rise in the oil price. Third, the wage formation process has become less responsive to fluctuations in oil prices. Fourth, heightened competition has helped to reduce the secondary impact on core inflation from changes in oil prices. In this context, the impact of oil prices on headline inflation expectations also appears to have become smaller over time, indicating that these tend to be formed from extrapolations of core rather than headline inflation.
… and will tend to have a smaller effect when indirect taxes are higher
Taking account of the weight of oil and oil products and the impact of the tax structure, and assessing the impact of a 10 per cent oil price hike, Table IV.5 suggests that the mechanical impact would be greatest for the United States and least or Japan, with the euro area impact being intermediate. The weight of transport fuel and lubricants in the consumer price inflation is 4.2 per cent in the euro area, but two-thirds of the price is made up of taxation, so the effect of a 10 per cent energy price hike is to raise the price level by 0.14 per cent (Table IV.5). In the United States, with its lower tax component, the mechanical impact would be a somewhat larger 0.23 per cent and in Japan somewhat smaller. The actual effect on inflation in different regions will, however, depend on exchange rate movements, the grade of crude oil being imported, pricing behaviour, the price response of other energy sources to oil price rises, and the impact of lower activity on prices.13
13 . Price developments during 2004 are broadly consistent with the rules of thumb, bearing in mind the lags between oil price and consumer price movements. However, the impact on consumer prices in Japan is more muted. This is mainly due to the different price dynamics of the main oil imported by Japan, Dubai crude, which trades at a discount to low sulphur oils such as Brent. The spread between Brent and Dubai widened to $14 per barrel during 2004 from an average of $2 per barrel over the previous 5 years.

OECD Economic Outlook No. 76
19
Box IV.3. Channels of oil price effects on the economy
Terms of trade effects. The first, and principal, impact of oil price shifts on activity arises from changes in purchasing power between oil-importing and oil-exporting nations. The extent to which oil-importing countries will suffer a reduction in purchasing power will depend on the oil-intensity of production and the degree to which the demand for oil is price inelastic. The income of oil-producers would increase correspondingly. The global demand impact would depend on how much of the extra revenue accruing to oil exporters is respent; typically, such revenues are not fully respent in the short term. Terms-of-trade changes have been quite large in the past but have generally been quite moderate in the current episode, with some OECD economies experiencing an improvement.
Terms of trade losses due to oil price increases in O ECD countries
-6
-4
-2
0
2
4
6
8
10
12
AUS AUT BEL CAN DNK FIN FRA DEU GRC IRE ITA JPN KOR MEX NLD NZL NOR PRT ESP SWE CHE TUR GBR USA
% o f GDP 1973-74 1979-80 2003-04
Source: International Energy Agency and OECD.
Effect on domestic prices and inflation. Inflation effects mirror terms-of-trade changes in their impact on producer prices. As far as headline consumer price inflation is concerned, taxes on oil products help to insulate the price level from oil price changes, fundamentally by helping to reduce oil intensity in the longer run, but also statistically in the short term, since the proportional impact of an oil price rise is inversely related to the tax content of the retail price. Whether the increase in the price level translates into a shift in core inflation depends on the “second round” effects -- i.e. whether workers and/or enterprises are able to compensate for the income loss through higher wages and prices -- which, in turn, depends on the monetary policy regime in place.
Domestic demand effects: who bears the income loss? Domestically, the income loss arising from the price increase would be borne by consumers to the extent that the demand for oil and oil price products is inelastic in the short run. This would be the case for final consumption products such as gasoline. However, where oil is an input into price-elastic final goods, the negative revenue effects would initially be borne by producers in a competitive market, since they would be unable to pass on the higher costs. More generally, since oil is an input into many goods both consumers and producers would bear losses. To the extent that producers are affected, profit margins and returns on capital will fall, with effects on the allocation of capital. While capital is the most flexible and footloose of the factors of production in the longer run, and would move from energy-intensive areas to areas with higher rates of return, in the short term capital in energy-intensive sectors is relatively inflexible, which makes it bear an income loss.
Supply-side implications: impact on output and employment; The impact on output and employment is determined by the relative supply responses of labour and capital. To the extent that labour market institutions inhibit the adjustment of real wages to shocks -- i.e. higher oil prices imply higher input prices which reduce profitability -- the deterioration in the terms of trade following an oil shock can affect equilibrium employment, since it creates a wedge between value-added and consumer prices. In general, the short-term economic impact of an oil shock on output and employment would be smaller, the higher the proportion of the price rise that can be passed on to consumers and/or the more flexible are wages if the price rise cannot be passed on.
Longer-term outcomes. The negative impact of an oil price rise on domestic demand and income will diminish over time as consumers and producers modify their behaviour (the longer-run price elasticity of demand is higher than the short-run elasticity). However, research seems to indicate that there is an asymmetric effect, insofar as oil demand does not revert to its initial level as oil prices fall. In that case, the income losses experienced by energy importers may eventually be partly reversed. Where fluctuations in oil prices create uncertainty, there may be a reduction in trend investment activity, but it is less clear that the effects on profitability or capacity utilisation are asymmetric.

OECD Economic Outlook No. 76
20
Table IV.5. The mechanical impact of a 10 per cent oil price change on consumer price inflation
Weight of transport, fuel and lubricants in CPI,
per cent
Share of excise taxes in final transport fuel price, per cent
Change in CPI inflation as a result
of a 10 per cent change in oil price, percentage points
3.1 25 0.23United States
1.8 53 0.08Japan
Euro area 4.2 67 0.14
Source: OECD calculations.
The oil price/output relationship has weakened
Simulation results from large-scale macroeconomic models suggest that the impact of higher oil prices on inflation and output is quite small in the short term. Table IV.6 summarises the results from a sustained $15 increase in the price of oil (from $32 to $47 per barrel) over the short-term, using the OECD’s INTERLINK model.14 The effects on inflation are close to those expected from the rules-of-thumb above. However, apart from the size and duration of the shock, the eventual impact on inflation and output depends crucially on the extent to which the country/area is an oil-producer, the assumed nature of the wage-price formation process, the reaction function of the monetary authorities and the degree to which higher oil revenues are respent by oil-exporting countries:15
� If real interest rates, measured in terms of headline inflation, were to be held constant, as in panel A, the price shock leads to a negative impact on OECD GDP of -0.4 per cent in the first year, with a slightly larger impact in Japan and the euro area than in the United States. The impact on output is felt longer in the United States, partly as a result of benefiting les than others from the respending of oil-exporting countries. The impact on headline inflation is significant in the first year at 0.6 percentage point for the OECD area, but this fades in the following year.
14 . The rise in the oil price has been chosen to represent the scale of the oil price shock embodied in the projections in this Outlook. For these simulations, the country weights of energy in export prices have been updated to their 2002 levels. Due to the model structure this mechanically updates the energy content of import prices and consequently the response of domestic inflation.
15 . The simulations reported here assume that two-thirds of oil revenues are respent within two years, leaving the remainder to be recycled through capital markets. Fiscal policy is assumed to be neutral, maintaining public expenditure constant in real terms.

OECD Economic Outlook No. 76
21
Table IV.6. Impacts of a sustained $15 increase in the price of oil
Deviation from baseline levels, per cent, unless otherwise stated
2004 2005
A. Assuming constant real interest rates United States GDP level -0.45 -0.55 Inflation (percentage points) 0.70 0.40 Total domestic demand -0.65 -0.75 Current account (% of GDP) -0.15 -0.15
Japan GDP level -0.60 -0.60 Inflation (percentage points) 0.40 0.10 Total domestic demand -0.55 -0.50 Current account (% of GDP) -0.35 -0.45
Euro area GDP level -0.50 -0.35 Inflation (percentage points) 0.60 0.20 Total domestic demand -0.50 -0.60 Current account (% of GDP) -0.45 -0.30
OECD GDP level -0.45 -0.45 Inflation (percentage points) 0.65 0.25 Total domestic demand -0.50 -0.60 Current account (% of GDP) -0.10 -0.10
B. Assuming constant nominal interest rates United States GDP level -0.15 -0.30 Inflation (percentage points) 0.70 0.45 Total domestic demand -0.20 -0.40 Current account (% of GDP) -0.30 -0.25
Japan GDP level -0.35 -0.35 Inflation (percentage points) 0.40 0.15 Total domestic demand -0.40 -0.40 Current account (% of GDP) -0.30 -0.40
Euro area GDP level -0.20 -0.20 Inflation (percentage points) 0.65 0.30 Total domestic demand -0.25 -0.40 Current account (% of GDP) -0.40 -0.30
OECD GDP level -0.20 -0.25 Inflation (percentage points) 0.65 0.35 Total domestic demand -0.20 -0.35 Current account (% of GDP) -0.15 -0.15
Source: OECD calculations (INTERLINK model simulation).

OECD Economic Outlook No. 76
22
� The negative short-term impact on output of an oil price shock would be reduced if nominal interest rates remain unchanged (panel B), since real interest rates (nominal rates less headline inflation) would fall, with a slight cost in terms of higher inflation in the subsequent year.
Price increases may have a larger impact than falls
These impacts would tend to be amplified if supply-side channels were to be taken into account and would not necessarily apply where the oil price were to fall. Reduced-form econometric evidence points to more powerful links between oil prices and economic activity and to non-linear reactions which are conditional on the recent history of oil price shocks. Price increases appear to have a larger impact on activity than oil price declines. The relatively high estimated impact from reduced-form macroeconomic models may be due to the inclusion of supply-side channels that can have slower-acting effects on potential output
Monetary policy can be cautious in responding to oil prices…
It is likely that the increasing independence of central banks and the growing adoption of price stability objectives, often based on inflation targeting, have helped to improve the response of monetary policy, and price-setting behaviour more generally, to oil price shocks. In particular, inflation targeting, or its approximation in practice, has helped to anchor inflation expectations among economic agents, preventing temporary inflationary shocks from becoming embedded into a more generalised and enduring increase in the inflation rate. Indeed, inflation expectations have been affected to only a small extent by the current oil price shock. As a result, it is now generally accepted that transitory spikes in headline inflation caused by movements in oil prices can be ignored, or “looked through”. This is likely to remain the case, making it unnecessary for nominal interest rates to respond to headline inflation, although monetary policy needs to remain vigilant towards any second-round inflationary effects that show up in core inflation.
… fiscal policy generally should be guided by long-term goals…
As for the role of fiscal policy vis-à-vis an oil shock, while it might be possible to smooth final prices by adjusting energy taxes, there are a number of reasons why such a policy may be problematic. First, it is very difficult ex ante to determine whether a change in the oil price is a temporary shock or a more permanent response to changes in market fundamentals. If it turns out to be a prolonged shock, then lower taxes would simply impede the beneficial medium-term adjustment of demand and supply to price changes, thus raising long-term oil dependence. More specifically, lowering taxes might impede the effect that higher prices have on incentives to switch to alternative energy sources and increase the efficiency of the capital stock. Second, if many countries adopt such a practice, then the "global" effect would be to reduce the price elasticity of the demand faced by OPEC -- inviting them to cut supply or raise prices further. Third, even if the smoothing of adjustment costs (and therefore slowing adjustment) is a legitimate policy aim, the effectiveness of tax policy as a means of smoothing oil price movements may be compromised by political economy considerations, thus jeopardising the achievement of budget goals.

OECD Economic Outlook No. 76
23
… and structural policies should promote the development of markets
Against the background that the uncertainties associated with the oil market have probably acted to depress investment activity, greater market transparency would seem essential for creating a better match between supply and demand. This would allow market participants to make better informed decisions and help to damp the effects of “news”. Better information would probably be instrumental in reducing the convenience yield while allowing the more effective use of hedging activity to reduce exposure to price volatility. In addition, given the apparent role of tightening regulation in creating demand and supply mismatches, governments need to examine whether they can remove regulatory or other obstacles to the development of new oil resources, refining capacity, energy substitutes and energy saving technology.
OECD Economic Outlook No. 76
24
APPENDIX IV.1: THE OIL SPREADSHEET MODEL
The impact on oil prices of different assumptions about economic growth or supply and demand elasticities is assessed using a “calibrated” spreadsheet model of global oil demand and supply.16 World oil demand is comprised of three main regions: the OECD area (which is split into the three largest economies -- the United States, the euro area and Japan -- and other OECD countries); China, which is among the most dynamic and oil intensive developing economies; and the rest of the world (ROW). On the supply side, two groups of producer countries are distinguished: OPEC and non-OPEC. Non-OPEC producers are assumed to be “price takers” i.e. to produce until marginal costs equal the world price of oil. In contrast, the OPEC cartel may adjust production to influence prices.
The only exogenous variable is real GDP in each of the main oil consumer countries or regions.
� Real GDP growth in OECD countries up to 2009 is derived from the OECD’s Medium Term Baseline projections (3.3 per cent in the United States, 1.9 per cent in the euro area and 1.3 per cent in Japan).17 From 2010 to 2030, GDP is assumed to be driven by trend labour productivity growth, as defined at the end of the Medium Term Baseline, and potential employment growth based on United Nations projections of population growth. Labour force participation rates are based on those contained in earlier OECD research into long term labour supply trends.18 This results in potential GDP growth rates slowing after 2010 to around 3 per cent in the United States, 1.4 per cent in the Euro area and 1 per cent in Japan
� China’s GDP growth, projected at 8.5 per cent in 2004, is assumed to decline progressively to 5 per cent in 2020-2030.19 In ROW, real GDP is assumed to grow at 5.4 per cent from 2004 to 2009 and at 5 per cent thereafter.20
16 . For a fuller exposition, see Brook et al. (2004).
17 . See OECD (2004).
18 . Burniaux, Duval and Jaumotte (2003).
19 . Using purchasing power parity estimates, GDP per capita in China is estimated in 2003 at around 13 per cent of that of the United States. According to the projections embodied in the baseline scenario and to United Nations population projections, this figure would rise to 27 per cent in 2030.
20 . Based on data in International Monetary Fund (2004).

OECD Economic Outlook No. 76
25
The remaining assumptions underpinning the baseline scenario are:
� The long run price and income elasticities of demand for oil were based on existing estimates21, though adjusted downwards somewhat to reflect the fact that these elasticities have probably fallen slightly over recent decades. The long-run income elasticities of demand are 0.4 for the OECD, 0.7 for China and 0.6 for ROW. The long-run price elasticities of demand are -0.6 for the OECD and -0.2 for both China and ROW.
� The price elasticities of non-OPEC supply are assumed to be 0.04 in the short run and 0.35 in the long run. The OPEC share of supply remains constant at its 2003 level of 38.4 per cent. This implies that both OPEC and non-OPEC supply are growing at the same rate as oil demand.
� In calibrating the model, it is has been assumed that the structural adjustment of demand and supply to prices takes place over ten years. In addition, in line with existing estimates,22 short run price elasticities are assumed to be very low (-0.02 for the United States and Japan, -0.04 for the Euro area and -0.01 for China and ROW).
� Oil demand is estimated to rise from 79.4 million barrels a day in 2003 to 134 million in 2030.
21 . Gately and Huntington (2002).
22 . See for example Gately (2004).

OECD Economic Outlook No. 76
26
APPENDIX IV.2: PRICE VOLATILITY, INVENTORIES AND THE OIL PRICE
Volatility affects the level of oil prices and inventories in two main ways. First, when the market is volatile, refiners and consumers will usually have a higher desired level of inventories, which, ceteris paribus, raises prices in the short run. Second, volatility per se raises the value of the call option held by oil producers of being able to extract oil from the ground. This increases the opportunity cost of current production and can result in decreased oil supply, unless the spot price increases sufficiently relatively to the futures price to make continuing production and running down inventories worthwhile. Higher demand for inventories and reduced supply will thus push prices up. Although the impact of the first channel will be temporary, as inventories adjust to their new higher level, the higher price that results from the second channel will persist as long as the higher level of volatility persists.
Note: Chart shows futures and spot prices for Brent crude oil. Includes data up to August 2004.
Source: Datastream.
Figure IV.5. The futures market has been in strong backwardation since 1999
0
5
10
15
20
25
30
35
40
45
Jun-89 Jun-90 Jun-91 Jun-92 Jun-93 Jun-94 Jun-95 Jun-96 Jun-97 Jun-98 Jun-99 Jun-00 Jun-01 Jun-02 Jun-03 Jun-04
Dollars per barrel
-2
0
2
4
6
8
10
Spread (dollars)
Spot price (left axis) 6 month futures price (left axis) Spread: Spot - Futures (right axis)
Strong backwardation
Contango
OECD Economic Outlook No. 76
27
Compared with other markets for traded assets (such as bonds), the oil market is distinguished by the existence of a “convenience yield”, which refers to the services that accrue to the owner of the physical stock of oil, but not to the owner of a contract for future delivery of the oil. Intuitively the convenience yield can be thought of as the premium that purchasers of the physical commodity are prepared to pay to avoid counterparty risk. The size of this convenience yield determines whether the futures price is greater or smaller than the spot price.23 When the convenience yield is sufficiently high that the spot price exceeds the futures price, the market is described as being in strong backwardation. While some degree of backwardation of normal, a very strong degree of backwardation may be encountered when price volatility is high.24 The futures market is said to be in contango when the spot price is lower than the futures price. For an extractive resource commodity like crude oil, the futures market would be expected to normally exhibit weak or strong backwardation most of the time, in order to provide producers with an incentive to extract now, rather than to wait.
However, the recent period has been one of strong backwardation, which has persisted for longer than earlier episodes in 1990 and 1996. Under normal circumstances, such strong backwardation would provide important incentives for refineries and consumers to run down their inventory levels, since it would suggest that the future spot price of oil should be lower than the current spot price. However, when the risk premium is large and volatility persistent futures prices often provide poor forecasts of subsequent spot prices, as in present circumstances. Market participants may not interpret strong backwardation in the six-month futures price as a sign that the spot price of oil will necessarily fall. In conjunction with geopolitical uncertainties and capacity constraints, low stocks and the price volatility noted above could imply only a partial and slow return to long-term equilibrium prices. This may be accompanied by unstable dynamics, which exacerbate fluctuations, as when a high spot price leads to strong backwardation and a run-down in inventories, such as has been seen recently. If lower inventories were interpreted as a signal of excess demand, this could cause spot prices to rise, exacerbating the strong backwardation and further discouraging inventory accumulation. Hence, spot and short-term futures prices can rise very dramatically when supply disruptions occur and inventories are low.25
23 . The spread between the spot and futures price gives an approximation of the convenience yield, though for an accurate representation this should be adjusted to take into account the risk free rate and the costs of oil storage.
24 . Pindick (2001).
25 . See Farrel et al. (2001).
OECD Economic Outlook No. 76
28
BIBLIOGRAPHY
ADELMAN, M. (2002), “World oil production and prices”, The Quarterly Review of Economics and Finance, No. 42.
BROOK, A., R. PRICE, D. SUTHERLAND, N. WESTERLUND and C. ANDRÉ (2004), “Oil price developments: drivers, economic consequences and policy responses”, OECD Economics Department Working Papers, forthcoming.
BURNIAUX, J-M., R. DUVAL and F. JAUMOTTE (2003), “Coping with ageing: a dynamic approach to quantify the impact of alternative policy options on future labour supply in OECD countries”, OECD Economics Department Working Papers, No. 371.
DALE, C. and J. ZYREN (1996), “Noncommercial trading in the energy futures market”, Energy Information Administration/Petroleum Marketing Monthly, May.
EDERINGTON, L. and J.H. LEE (2000), “Who trades futures and how: evidence from heating oil futures markets”, Journal of Business, No. 75(2).
FARRELL, G., B. KAHN and F. VISSER (2001), “Price determination in international oil markets: developments and prospects”, South African Reserve Bank Quarterly Bulletin, March.
GATELY, D. (2004), “OPEC’s incentives for faster output growth”, Energy Journal, 25.
GATELY, D. and H. HUNTINGTON (2002), “The asymmetric effects of changes in price and income on energy and oil demand” The Energy Journal, 23.
HAMILTON, J. (2003), "What is an oil price shock?", Journal of Econometrics, 113.
INTERNATIONAL ENERGY AGENCY (2002), World Energy Outlook, Paris.
INTERNATIONAL ENERGY AGENCY (2003), World Energy Investment Outlook, Paris.
INTERNATIONAL MONETARY FUND (2004), World Economic Outlook, April, Washington.
KOHL, W. (2002), “OPEC behavior, 1998-2001”, Quarterly Review of Economics and Finance, 42.
MAURICE, J. (2001), Prix du Pétrole, Conseil d’Analyse économique, Paris.
OECD (2004), OECD Economic Outlook, No. 75, Paris.
PINDYCK, R. (2001), “The dynamics of commodity spot and futures markets: a primer”, The Energy Journal, Vol. 22(3).

OECD Economic Outlook No. 76
29
US GEOLOGICAL SURVEY (2000), World Petroleum Assessment, 2000, Digital Data Series 60.
WEINER, R. (2002), “Sheep in wolves’ clothing? Speculators and price volatility in petroleum futures”, The Quarterly Review of Economics and Finance, No. 42.