Embed Size (px)
Citation preview

OIL AND FATTY ACID PROFILES OF SOYBEANS
(MATURITY GROUPS IV, V, AND VI)
By
LUKE AARON FARNO
Bachelor of Science Eastern Kentucky University
Richmond, Kentucky 1996
Master of Science Oklahoma State University
Stillwater, Oklahoma 1999
Submitted to the Faculty of the Graduate College of the
Oklahoma State University in partial fulfillment of
the requirements for the Degree of
DOCTOR OF PHILOSOPHY July, 2005

ii
OIL AND FATTY ACID PROFILES OF SOYBEANS
(MATURITY GROUPS IV, V, AND VI)
Dissertation Approved:
Dr. Arthur Klatt Dissertation Adviser Dr. Kenton Dashiell
Dr. Nurhan Dunford
Dr. Carla Goad
A. Gordon Emslie Dean of the Graduate College
iii
TABLE OF CONTENTS
Chapter Page I. INTRODUCTION......................................................................................................1
Soybean Oil Composition ........................................................................................1
Seed Development Influences on Fatty Acid Composition.....................................2 Environmental Influences on Fatty Acid Composition ...........................................3 Genetic Modification of Fatty Acid Composition ...................................................5 Uses for Oils with Specific Fatty Acid Compositions ...........................................10 Soybean Oil Quality...............................................................................................11 Maturity Effect on Fatty Acid Composition ..........................................................12
II. OIL AND FATTY ACID PROFILES OF SOYBEANS (MATUIRTY GROUPS IV, V, AND VI)
Abstract ..................................................................................................................15 Introduction............................................................................................................16 Materials and Methods...........................................................................................18 Results and Discussion ..........................................................................................20 Combined Full Season Maturity Group VI......................................................20 Uniform Maturity Group IV ............................................................................26 Uniform Maturity Group V..............................................................................28 Uniform Maturity Group VI ............................................................................31 2000 Overall Summary....................................................................................35 2001 Overall Summary....................................................................................36 Conclusion .............................................................................................................37 REFERENCES ............................................................................................................39 APPENDIX..................................................................................................................58
APPENDIX A-- GENOTYPES AND PEDIGREES FOR ENTRIES IN THE COMBINED FULL SEASON MATURITY GROUP VI SOYBEAN VARIETY TETS………………………………..59
APPENDIX B-- GENOTYPES AND PEDIGREES FOR ENTRIES IN THE
UNIFORM MATURITY GROUP IV SOYBEAN YIELD TEST...……………………….……………………………….60
APPENDIX C-- GENOTYPES AND PEDIGREES FOR ENTRIES IN THE
UNIFORM MATURITY GROUP V SOYBEAN YIELD TEST………………………….……………….………………61

iv
APPENDIX D-- GENOTYPES AND PEDIGREES FOR ENTRIES IN THE
UNIFORM MATURITY GROUP VI SOYBEAN YIELD TEST……………….…………….……………….………………62
v
LIST OF TABLES
Table Page
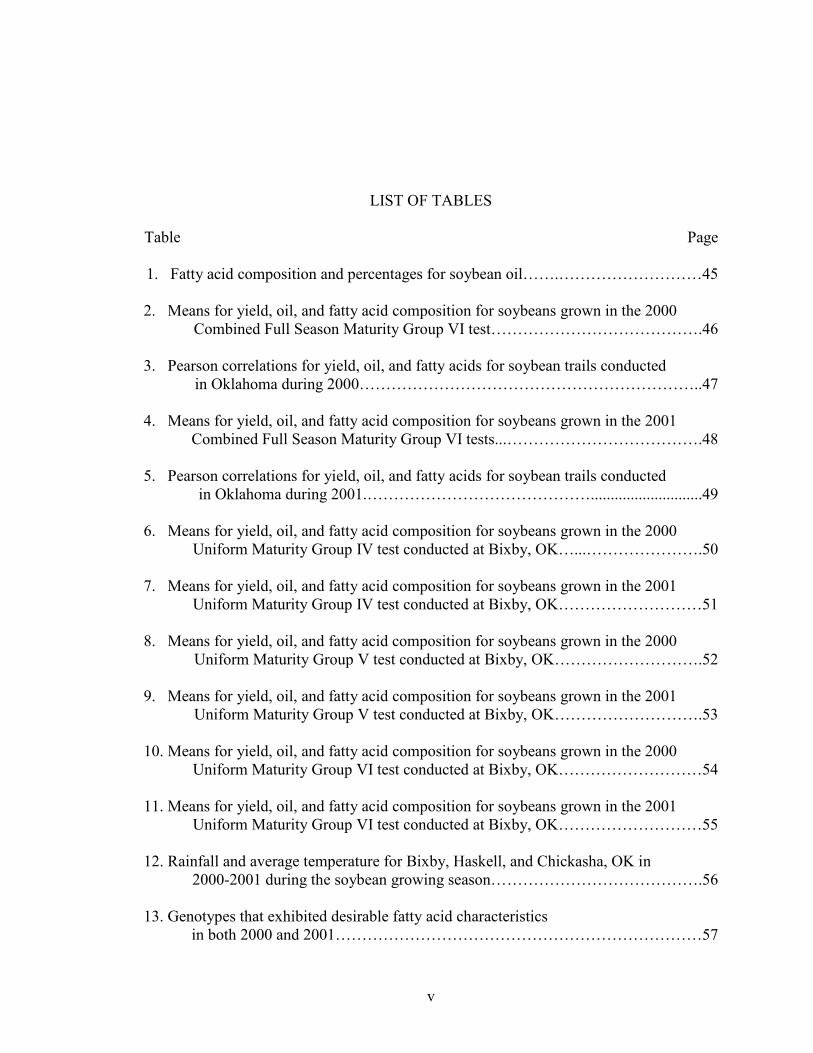
1. Fatty acid composition and percentages for soybean oil…….………………………45 2. Means for yield, oil, and fatty acid composition for soybeans grown in the 2000 Combined Full Season Maturity Group VI test………………………………….46 3. Pearson correlations for yield, oil, and fatty acids for soybean trails conducted in Oklahoma during 2000………………………………………………………..47 4. Means for yield, oil, and fatty acid composition for soybeans grown in the 2001 Combined Full Season Maturity Group VI tests...……………………………….48 5. Pearson correlations for yield, oil, and fatty acids for soybean trails conducted in Oklahoma during 2001.……………………………………............................49 6. Means for yield, oil, and fatty acid composition for soybeans grown in the 2000 Uniform Maturity Group IV test conducted at Bixby, OK…...………………….50 7. Means for yield, oil, and fatty acid composition for soybeans grown in the 2001 Uniform Maturity Group IV test conducted at Bixby, OK………………………51 8. Means for yield, oil, and fatty acid composition for soybeans grown in the 2000 Uniform Maturity Group V test conducted at Bixby, OK……………………….52 9. Means for yield, oil, and fatty acid composition for soybeans grown in the 2001 Uniform Maturity Group V test conducted at Bixby, OK……………………….53 10. Means for yield, oil, and fatty acid composition for soybeans grown in the 2000 Uniform Maturity Group VI test conducted at Bixby, OK………………………54 11. Means for yield, oil, and fatty acid composition for soybeans grown in the 2001 Uniform Maturity Group VI test conducted at Bixby, OK………………………55 12. Rainfall and average temperature for Bixby, Haskell, and Chickasha, OK in 2000-2001 during the soybean growing season………………………………….56 13. Genotypes that exhibited desirable fatty acid characteristics
in both 2000 and 2001……………………………………………………………57

1
CHAPTER I
INTRODUCTION
Soybeans are a global commodity used as feed for livestock, as a source of
protein and oil for people, and in the industrial manufacturing of thousands of products.
In the U.S. only about 5% of total production is processed for human food with the
majority crushed for oil and animal feed (Nwokola, 1996). Soybean oil is a major source
of the five essential fatty acids for humans (palmitic, stearic, oleic, linoleic, and linolenic)
(Firestone, 1999). A lack of the daily requirements of these fatty acids can lead to serious
health problems. For example, symptoms associated with linoleic (C18:2) fatty acid
deficiency are diminished growth, diminished skin pigment, fatty livers, kidney
degeneration, and the loss of muscle tone (Chapkin, 1992).
SOYBEAN OIL COMPOSITION
Soybean oil is composed of approximately 16% saturated fatty acids (palmitic
[C16:0] and stearic [C18:0]), 24% monounsaturated fatty acids (oleic [C18:1]), and 60%
polyunsaturated fatty acids (linoleic [C18:2] and linolenic [C18:3]). It is because of the
2
high percentage of these polyunsaturated fatty acids that soybeans are considered to be
unstable (Neff and List, 1999).
SEED DEVELOPMENT INFLUENCES ON FATTY ACID COMPOSITION
Seed maturation is associated with considerable increase in the size and weight of
the various tissues of the seed. In oil crops much of this weight increase is due to the
accumulation of lipids in the endosperm or embryo of the seed. In dicotyledonous plants,
such as soybean, the principal site of storage is the cotyledon. The major change in fatty
acid composition of the triglycerides occurs during the first 52 days after flowering.
During this period, C18:3 decreases from 34% to 12% of the total lipid content of the
seed. The percentages of C18:2 and C18:1 increase, while C18:0 remains fairly constant
and C16:0 decreases slightly (Smith, 1984). Sangwan et al. (1986) examined the extent
of variability in fatty acid composition of soybean cultivars at different stages of seed
development. Pod samples were taken from seven soybean cultivars (Alankar, Ankur,
Black tar, Bragg, Cobb, HM-1, and SH-3) at 10 day intervals from the 45th day to the 75th
day after flowering or when the plant had matured. The total free fatty acids were
estimated by titrating the oil samples against standard alkali (AOAC method No. 28.032)
and the methyl esters were separated with a gas chromatograph. They found that the
saturated fatty acids, C16:0 and C18:0, decreased as the seed matured in all of the
cultivars except Bragg and SH-3. Both showed slight increases in C16:0 during the
advanced stages of maturity. In three of the cultivars (Alankar, Ankur, and Black tar),
C18:1 showed a slight increase at the initial stages of maturity and then decreased in the
3
later stages. In the other cultivars (Bragg, Cobb, HM-1, and SH-3), the C18:1 content
decreased progressively as seed development occurred. C18:2 increased in all cultivars
as seed development advanced. The same was true for C18:3 except in the cultivars
Alankar and Ankur. In Alankar, C18:3 initially increased and later, in maturation, it
began to decrease. In Ankur, C18:3 remained almost unchanged throughout
development. Sangwan et al. (1986) compared their results to studies that had been done
up to the time of this study. The results of decreasing C18:1 levels and increasing C18:3
levels, as seed matured, were in contrast to previous findings (Rubel et al., 1972). The
decrease in levels of C16:0 and C18:0 along with an increase in C18:2 with seed maturity
were in agreement with observations from other studies (Kannangara et al., 1973). They
concluded that the oil of the mature seed was superior to that of immature seed because it
contained lower amounts of free fatty acids and higher amounts of the essential
unsaturated fatty acids, mainly C18:2 and C18:3.
ENVIRONMENTAL INFLUENCES ON FATTY ACID COMPOSITION
The environment plays a critical role in oil content and fatty acid development.
Seed-fill is the most critical growth stage for environmental effects and temperature is the
primary factor. Oil begins to accumulate in developing seeds 15-20 days after flowering.
The most rapid deposition occurs 20-40 days after flowering and continues until 70 days
after flowering (Rose, 1988). When temperatures are above the optimum for growth
(22ºC) an accumulation of C18:1 appears to result (Holmberg, 1973). This is at the
expense of C18:2 and C18:3, but C18:0 is unaffected (Smith, 1984). At temperatures

4
lower than the optimum 22ºC, a higher proportion of polyunsaturated fatty acids are
present. The variations in fatty acid composition are generally confined to C18:1, C18:2,
and C18:3. Temperature has little effect on the proportion of saturated fatty acids; these
are primarily determined by the genotype of the plant.
Cherry et al. (1985) compared the fatty acid profiles of six genotypes grown for
one year in both Indiana and Mississippi. They found that genotypes grown in the
southern environment had an increased oil content and C18:1 percentage and a decrease
in C18:3 percentages. This led them to conclude that the environmental sensitivity of
fatty acid profiles needed to be considered when producing soybean genotypes outside
their area of adaptation.
Another environmental condition that affects soybean oil is moisture stress. Rose
(1988) looked at early maturing, indeterminate soybean lines for five years comparing
dryland and fully irrigated plots. Moisture stress effects on yield, seed weight, and oil
and protein content of the seeds were evaluated. Rose found that 57-68% of the seed
weight loss was attributed to changes in weight per seed of oil and protein. When
compared to the irrigated treatments, the oil and protein percentages of the dryland seed
varied. This variation was dependant upon the balance between reduction in seed weight
and response of the oil or protein to the pattern of stress. In one season, Rose reported
that when a severe stress occurred in early pod fill, the percentage of protein decreased,
while the oil percentage increased. In the three other years, the percentage of protein
increased on dryland plots while oil percentage decreased. They determined that there
was no significant increase in either protein or oil percentages during the high rainfall
season.
5
GENETIC MODIFICATION OF FATTY ACID COMPOSITION
Soybean oil and the fatty acids, which make up the oil, are quantitative traits that
are influenced by many environmental and genetic factors. Oil composition is primarily
determined by the genotype of the maternal parent (Brim, 1973). Significant progress
has been made to improve soybean oil quality through genetic modification of fatty acid
composition. This has led to the development of “value-added” soybean oils, with novel
combinations of fatty acids, for innovative food and industrial uses. Realizing that the
lack of a natural product with oxidative stability and a high
monounsaturated/polyunsaturated (M/P) ration would have a negative impact on future
utilization and market share of soybean oil, the American Soybean Association initiated
support for research in 1978 to develop germplasm exhibiting genetically altered oil
composition. The initial challenge was to develop a soybean genotype having a 3%
C18:3 content, a typical level for hydrogenated soybean oil (Wilson, 1991). Historically,
hydrogenation was used to reduce the amount of C18:3 and increases the
monosaturated/polyunsaturated fatty acid ratio of soybean oil. Commercial soybean
varieties have relatively high levels of C18:3 (8-10%). However this process is
expensive and it generates trans isomers of unsaturated fatty acids. Trans isomers pose a
health risk, as they are associated with an increased risk of coronary disease (Hammond
and Fehr, 1983; Hardin, 1989). Initial studies utilized conventional breeding methods
along with available germplasm to develop these low C18:3 lines. Mutations in certain
soybean genes led to further alteration in fatty acids composition (Wilson, 1991).
6
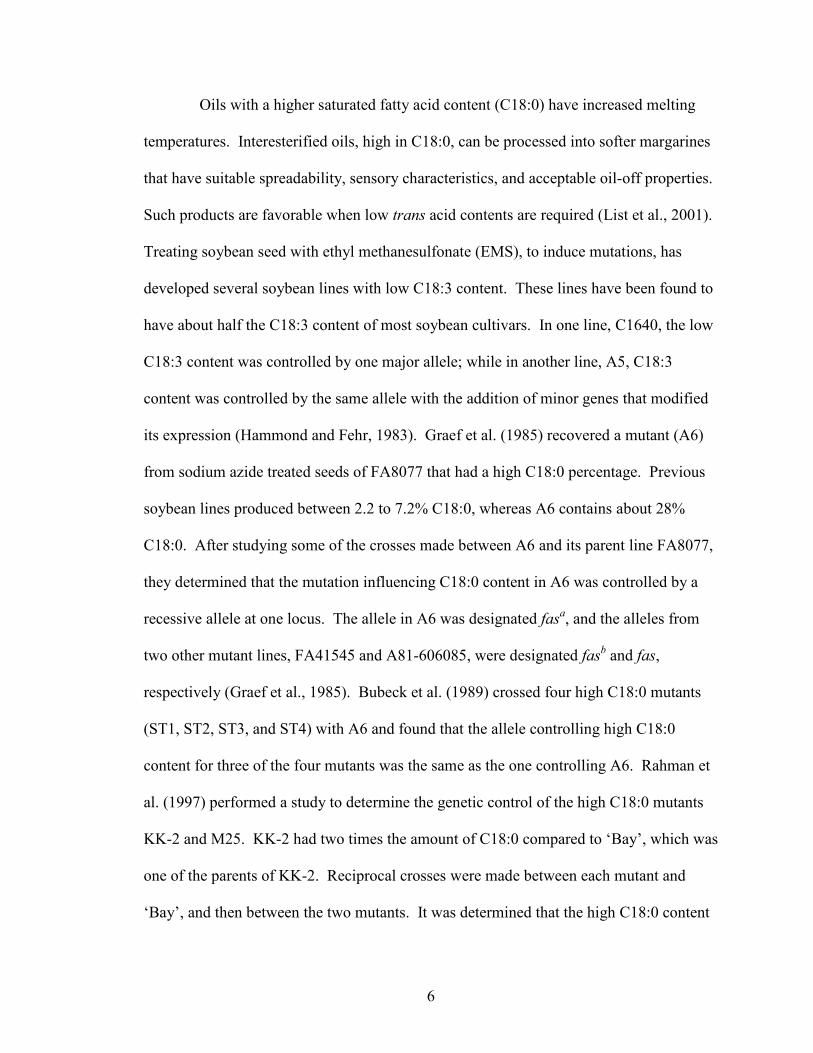
Oils with a higher saturated fatty acid content (C18:0) have increased melting
temperatures. Interesterified oils, high in C18:0, can be processed into softer margarines
that have suitable spreadability, sensory characteristics, and acceptable oil-off properties.
Such products are favorable when low trans acid contents are required (List et al., 2001).
Treating soybean seed with ethyl methanesulfonate (EMS), to induce mutations, has
developed several soybean lines with low C18:3 content. These lines have been found to
have about half the C18:3 content of most soybean cultivars. In one line, C1640, the low
C18:3 content was controlled by one major allele; while in another line, A5, C18:3
content was controlled by the same allele with the addition of minor genes that modified
its expression (Hammond and Fehr, 1983). Graef et al. (1985) recovered a mutant (A6)
from sodium azide treated seeds of FA8077 that had a high C18:0 percentage. Previous
soybean lines produced between 2.2 to 7.2% C18:0, whereas A6 contains about 28%
C18:0. After studying some of the crosses made between A6 and its parent line FA8077,
they determined that the mutation influencing C18:0 content in A6 was controlled by a
recessive allele at one locus. The allele in A6 was designated fasa, and the alleles from
two other mutant lines, FA41545 and A81-606085, were designated fasb and fas,
respectively (Graef et al., 1985). Bubeck et al. (1989) crossed four high C18:0 mutants
(ST1, ST2, ST3, and ST4) with A6 and found that the allele controlling high C18:0
content for three of the four mutants was the same as the one controlling A6. Rahman et
al. (1997) performed a study to determine the genetic control of the high C18:0 mutants
KK-2 and M25. KK-2 had two times the amount of C18:0 compared to ‘Bay’, which was
one of the parents of KK-2. Reciprocal crosses were made between each mutant and
‘Bay’, and then between the two mutants. It was determined that the high C18:0 content

7
of the two lines was controlled by recessive alleles at a single locus. When the seed from
the cross of the two mutants was evaluated, they found F2 seed with C18:0 content lower
than the seeds of KK-2 and higher than those of M25. This demonstrated that different
alleles, at different loci, control the C18:0 content in these two mutants. They designated
KK-2 as st1st1St2St2 and M25 St1St1st2st2. They also found that the allele in KK-2 was
partially dominant to the allele in M25. They were able to produce a line with a C18:0
content greater than 30%, but it was not possible to further develop the line because the
irregular seeds failed to grow after germination.
Lowering the C18:3 content of soybeans, because of its association with flavor
instability, has brought about much interest and research. Decreasing the percentage of
C18:3 and/or increasing the percentage of C18:0 can enhance frying stability of the oil.
New genetically altered soybean lines have increased C18:0 or C16:0 or they have
decreased C18:3 levels. Soybean oil with a high percentage of C18:0 has significantly
greater oxidative stability than does normal soybean oil (White, 2000). Researchers have
developed soybean breeding lines that may be the forerunners for varieties specially
suited for making salad oils. These oils could be stored at room temperature for two to
three months longer than the soybean oils of today. Another approach to genetically
modifying soybeans to preserve oil freshness is to breed them to have little to none of the
enzyme (lipoxygenase) that breaks down C18:3 and other polyunsaturated lipids. During
the 1940’s significant research within the soybean oil industry led to the development of
standardized oil processing equipment. During this same time, scientists found that off-
flavors and objectionable odors, which developed in aging soybean oil, were mostly
associated with the breakdown of C18:3 (Hardin, 1989).

8
An increase in C18:0, along with a decrease in C18:3, is another way to improve
the stability of the soybean oil. White and Miller (1988) looked at the oxidative stability
of soybean oil that had low C18:3 and high C18:0 contents, comparing the oil from three
common commercial lines and two mutant lines. They used the mutant line A5, which is
a low C18:3 line (2.9%), and the mutant line A6, which is a high C18:0 line (28%)
(Hammond and Fehr, 1983; Graef et al., 1985). They cold pressed the seeds, refined the
oil, and then they deodorized the oil without the use of any additives. They stored the oil
samples at two different temperatures, 28°C and 60°C. They then compared the five oils
based on peroxide values, conjugated dienoic acid values, and sensory panel. It was
determined that: 1) A5 and A6 lines were more stable than the commercial varieties, as
measured by the peroxide values and the conjugated dienoic acid values, but sensory
panel data were inconclusive; 2) oils with similar C18:3 contents did not have similar
rates of oxidation; 3) that the differences fatty acid content of the five oils were not as
distinct in the 60°C test as they were in the 28°C test.
Several researchers have studied the inheritance and gene action of modified fatty
acid levels (Fehr et al., 1991a, Fehr et al., 1991b, Graef et al., 1998, and Rahman et al.,
1997). Stojšin et al. (1998) developed the soybean line RG10 through the use of EMS,
which had a C18:0 content of less than 2.5%. After developing the RG10 soybean they
determined the number of loci and gene action associated with the inheritance of reduced
C18:3 content in RG10. They looked at the F2 and F3 progenies of the crosses RG10 X
C1640 and RG10 X ‘Century’. Using chi-square analyses on the F2 seeds and F3 families
from the RG10 X C1640 cross and F3 families from the RG10 X ‘Century’ cross, they
observed frequency distributions that fit a 1:2:1 ratio. These results indicated that the low
9
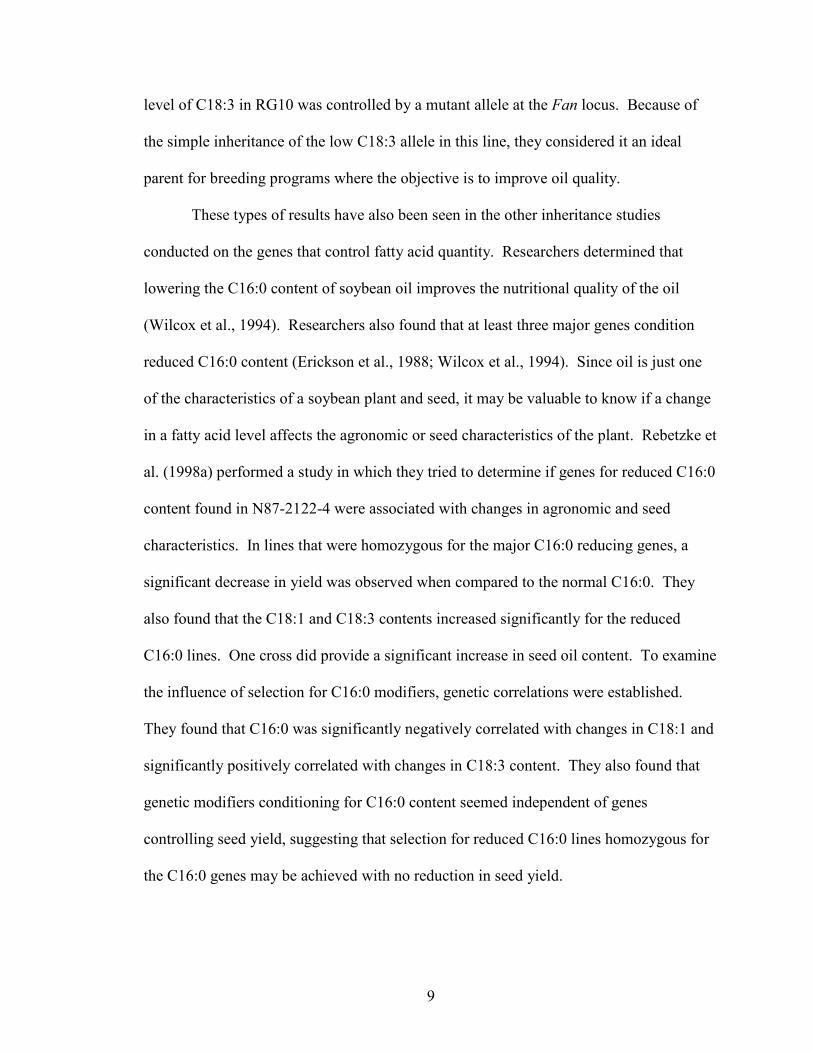
level of C18:3 in RG10 was controlled by a mutant allele at the Fan locus. Because of
the simple inheritance of the low C18:3 allele in this line, they considered it an ideal
parent for breeding programs where the objective is to improve oil quality.
These types of results have also been seen in the other inheritance studies
conducted on the genes that control fatty acid quantity. Researchers determined that
lowering the C16:0 content of soybean oil improves the nutritional quality of the oil
(Wilcox et al., 1994). Researchers also found that at least three major genes condition
reduced C16:0 content (Erickson et al., 1988; Wilcox et al., 1994). Since oil is just one
of the characteristics of a soybean plant and seed, it may be valuable to know if a change
in a fatty acid level affects the agronomic or seed characteristics of the plant. Rebetzke et
al. (1998a) performed a study in which they tried to determine if genes for reduced C16:0
content found in N87-2122-4 were associated with changes in agronomic and seed
characteristics. In lines that were homozygous for the major C16:0 reducing genes, a
significant decrease in yield was observed when compared to the normal C16:0. They
also found that the C18:1 and C18:3 contents increased significantly for the reduced
C16:0 lines. One cross did provide a significant increase in seed oil content. To examine
the influence of selection for C16:0 modifiers, genetic correlations were established.
They found that C16:0 was significantly negatively correlated with changes in C18:1 and
significantly positively correlated with changes in C18:3 content. They also found that
genetic modifiers conditioning for C16:0 content seemed independent of genes
controlling seed yield, suggesting that selection for reduced C16:0 lines homozygous for
the C16:0 genes may be achieved with no reduction in seed yield.
10
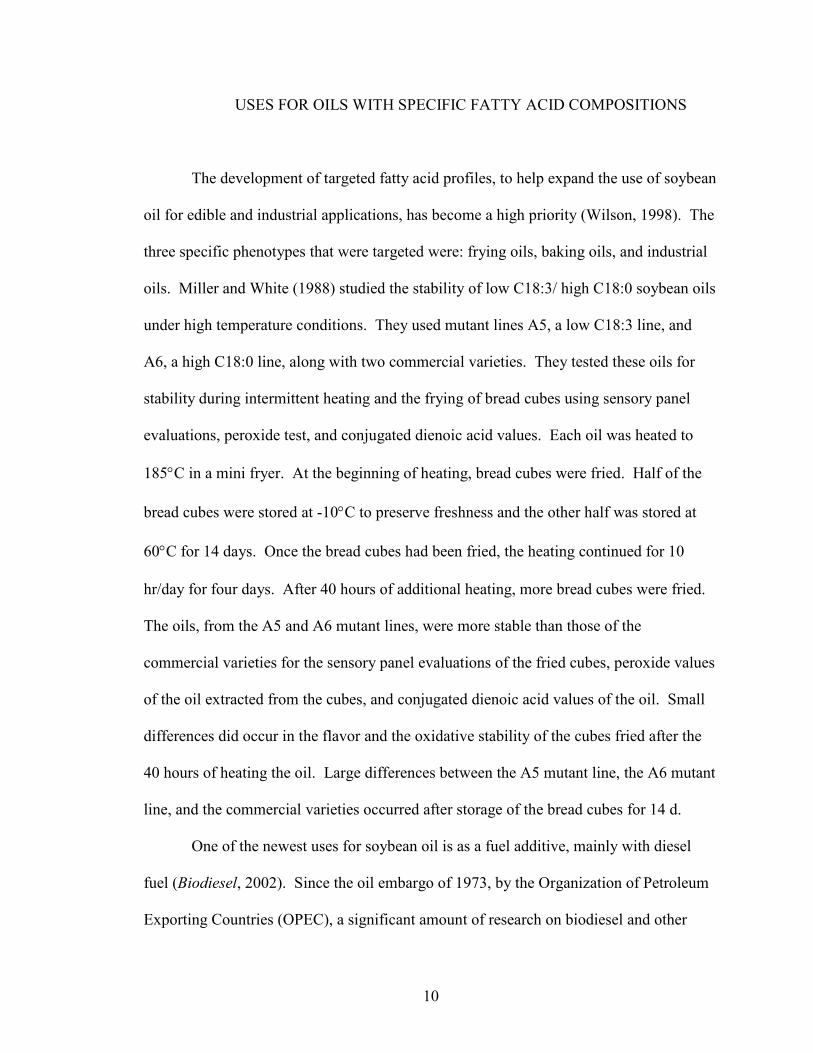
USES FOR OILS WITH SPECIFIC FATTY ACID COMPOSITIONS
The development of targeted fatty acid profiles, to help expand the use of soybean
oil for edible and industrial applications, has become a high priority (Wilson, 1998). The
three specific phenotypes that were targeted were: frying oils, baking oils, and industrial
oils. Miller and White (1988) studied the stability of low C18:3/ high C18:0 soybean oils
under high temperature conditions. They used mutant lines A5, a low C18:3 line, and
A6, a high C18:0 line, along with two commercial varieties. They tested these oils for
stability during intermittent heating and the frying of bread cubes using sensory panel
evaluations, peroxide test, and conjugated dienoic acid values. Each oil was heated to
185°C in a mini fryer. At the beginning of heating, bread cubes were fried. Half of the
bread cubes were stored at -10°C to preserve freshness and the other half was stored at
60°C for 14 days. Once the bread cubes had been fried, the heating continued for 10
hr/day for four days. After 40 hours of additional heating, more bread cubes were fried.
The oils, from the A5 and A6 mutant lines, were more stable than those of the
commercial varieties for the sensory panel evaluations of the fried cubes, peroxide values
of the oil extracted from the cubes, and conjugated dienoic acid values of the oil. Small
differences did occur in the flavor and the oxidative stability of the cubes fried after the
40 hours of heating the oil. Large differences between the A5 mutant line, the A6 mutant
line, and the commercial varieties occurred after storage of the bread cubes for 14 d.
One of the newest uses for soybean oil is as a fuel additive, mainly with diesel
fuel (Biodiesel, 2002). Since the oil embargo of 1973, by the Organization of Petroleum
Exporting Countries (OPEC), a significant amount of research on biodiesel and other

11
domestically produced fuels has been conducted. The viscosity of vegetable oils is 10-20
times that of diesel fuel. When used as a fuel, the oil causes injector fouling and other
engine problems. But, when the oil is mixed with methanol in the presence of a catalyst,
glycerin and biodiesel (chemically called methyl esters) are yielded. The methyl or
sometimes ethyl esters of vegetable oils have viscosities approximately twice those of
diesel fuels. Therefore, the biodiesel can be used directly or as blends with diesel fuels in
a diesel engine. Biodiesel is biodegradable and it is a renewable fuel. It puts no net
carbon dioxide or sulfur into the atmosphere and it emits less gaseous pollutants than
normal diesel. Because of these properties, the U.S. Environmental Protection Agency
has registered biodiesel as a pure fuel or fuel additive, and they have made it a legal fuel
for commerce (Biodiesel, 2002; Lang et al., 2001).
SOYBEAN OIL QUALITY
Once the affects of genetically modifying one fatty acid were studied, the next
approach was to look at the affects of genetically modifying two or more fatty acids
within a soybean line. By altering more than one fatty acid, advancements in soybean oil
quality could be accomplished faster. Neff and List (1999) looked at how soybean lines
that were genetically modified for high C16:0 and high C18:0, changed the oxidative
stability of natural and randomized oils. Randomization is the process of blending
different vegetable oils together. They found that one way to improve the oxidation
stability of soybean oil was to genetically modify the fatty acid composition so that there
was a decrease in the polyunsaturated acids (C18:2 and C18:3) and an increase in

12
monosaturated (C18:1) and saturated fatty acids (C16:0 and C18:0). This increase in
saturated fatty acids must be watched though. Medical studies have shown that diets high
in saturated acyl components (C16:0 and C18:0 fatty acids) may contribute to increased
blood serum cholesterol. Food and Drug Administration regulations require that a “low
saturated” vegetable oil must contain less than 7% total saturates. Although soybean oil
is relatively low in total saturates, a reduction may be needed at some point to enhance
the utility of soybean oil in the health food market (Rebetzke et al., 1998b).
MATURITY EFFECT ON FATTY ACID COMPOSITION
Kane et al. (1997) evaluated the grain quality of cultivars in Maturity Groups
(MG) 00 through IV using late April, mid-May, early June, and late June planting dates
in the southern U.S. They found that across years and cultivars, delayed planting
increased C18:3 percentage and decreased both oil and C18:1 percentages. The higher
seed-fill temperatures associated with early planting were strongly correlated with
increased oil content and C18:1 levels and reduced C18:3 percentages. The reduced
C18:3 percentage, for all six cultivars, was closely associated with increased seed-fill
temperatures. However, the C18:1 response to seed-fill temperatures was strongly
dependant upon cultivar maturity. They found the C16:1 percentage of early-maturing
cultivars was more sensitive to seed-fill temperatures than was that of later maturing
cultivars. They concluded that while the overall effects of environment on grain quality
characteristics might be relatively small, perhaps the abilities of new low C18:3 cultivars

13
could be amplified by growing them under the warmer conditions of the southeastern
U.S.

14
CHAPTER II
This dissertation chapter is to be submitted to the journal Crop Science for
publication. The format conforms to the style of this journal.

15
Oil and Fatty Acid Profiles of Soybeans (Maturity Groups IV, V, and VI)
ABSTRACT
Soybean oil contains 14 fatty acids and five of them, C16:0, C18:0, C18:1, C18:2,
and C18:3, are considered essential fatty acids for proper human nutrition. Increasing the
oil content and improving the ratio of the various fatty acids in soybeans is a goal for
many breeding programs. The objective of this research was to evaluate the relationship
between grain yield, oil content, and fatty acid composition in soybean cultivars and
experimental lines grown in Oklahoma. Yield, oil content, and fatty acid composition
was determined in trials conducted at three locations in 2000 and 2001. In 2000,
temperatures were above the optimum for seed development and severe drought stress
occurred at the non-irrigated locations. These soybeans had a high C18:1 content and
low C18:2, C18:3, and total oil content. Negative correlations between C18:2/C18:0,
C18:2/C18:1, and C18:3/C18:1 were also observed in all tests. In 2001, temperatures
were still above optimum, but there was no drought stress during seed development; this
led to the fatty acid compositions being within their expected ranges, but oil percentages
were still low.

16
INTRODUCTION
Soybeans [Glycine max. (L.) Merr] are used for livestock feed, as a source of
protein and oil for humans, and in the industrial manufacturing of products such as liquid
shortenings, margarines, non-dairy creamers, and confectionery products (Manufactured
products and soy, 2000). A recent use of soybean oil is as a fuel additive, mainly with
diesel fuel (Biodiesel, 2002; Lang et al., 2001; Lee et al., 1996). Soybean acreage in the
U.S. has increased approximately 20% over the past decade. Soybean acreage in
Oklahoma doubled between 1991 and 1999, but then declined by 17% between 1999 and
2001 (Agricultural Statistics CD-ROM, 2000; Oklahoma State Statistics, 2000).
Soybean oil is the most widely used edible oil in the world because of its
widespread use in processed food. In 1999, soybean oil accounted for 28% of the
world’s vegetable and marine oil consumption (World soybean production, 2001). As a
food, soybean use varies from country to country. Only about 5% of the soybeans
produced in the U.S. are processed for human food. The majority of it is crushed for oil
and animal feed (Nwokola, 1996).
Soybean oil contains 14 fatty acids (Table 1). Five of these fatty acids, palmitic
(C16:0), stearic (C18:0), oleic (C18:1), linoleic (C18:2), and linolenic (C18:3), are
considered essential fatty acids because they must be obtained in our diet. A lack of the
daily requirements of these fatty acids leads to serious health problems (Chapkin, 1992).
Many healthcare professionals recommend replacing saturated fats with unsaturated fats.
Soybean oil is popular because it has approximately 16% saturated fatty acids (C16:0 and
C18:0) and approximately 84% unsaturated fatty acids (C18:1, C18:2, and C18:3) (Neff
and List, 1999; Soybean oil – nutritional analysis, 2001).

17
Significant progress has been made to improve soybean oil through genetic
modification of the fatty acid composition. Genetic studies (Bubeck et al., 1989;
Erickson et al., 1988; Fehr et al., 1991a; Fehr et al., 1991b; Graef et al., 1998; Rahman et
al., 1997; Stojšin et al., 1998; Wilcox et al., 1994) have led to the development of “value-
added” soybean oils with novel combinations of fatty acids for innovative food and
industrial uses (Wilson, 1991). Historically, soybean oil went through a process known
as hydrogenation. This reduced the C18:3 content and increased the
monounsaturated/polyunsaturated ratio (Wilson, 1991). Lowering the C18:3 content is
also desired because of the association of C18:3 content with flavor instability in soybean
oil (White, 2000). However, hydrogenation is expensive and generates trans isomers of
unsaturated fatty acids, which pose a health risk (Hammond and Fehr, 1983). Today
improved soybean oil is obtained through the genetic manipulation of soybean to modify
the fatty acid composition.
Conventional breeding methods have been used with a variety of different
germplasm to create soybean lines with modified fatty acid compositions (Wilson, 1991).
Mutations can also lead to the development of germplasm with altered fatty acid content
(Wilson, 1991). X-rays and chemical mutagens have been used to create genotypes that
contain altered fatty acid composition (Hammond and Fehr, 1983; Rahman et al., 1997;
Stojšin et al., 1998). A more stable and desirable soybean oil can be achieved by altering
one or a combination of fatty acids (Carver et al., 1984; Neff and List, 1999: White,
2000; Wilcox et al., 1994)
Soybean oil content and composition are quantitative traits with the genotype of
the maternal parent being the primarily determinant (Brim, 1973). Because these are

18
quantitative traits, the environment also has a large influence. Seed-fill is the most
critical stage at which the environment affects oil composition, and temperature is the
primary factor during this time (Rose, 1988). At temperatures lower than what are
considered optimum for growth, a higher proportion of polyunsaturated fatty acids are
present. An accumulation of C18:1 appears to result when temperatures are above the
optimum for growth. This is at the expense of C18:2 and C18:3, but C18:0 is unaffected
(Smith, 1984). Moisture stress is another environmental condition that affects soybean
oil. Rose (1988) reported that when sever stress occurred early in pod fill, the percentage
of protein decreased while the oil percentage increased. Rose also found no significant
increase in either protein or oil percentages during a season of high rainfall.
The objective of this research was to evaluate grain yield, oil content, and fatty
acid composition in soybean cultivars and experimental lines grown in Oklahoma and to
evaluate the relationship between these traits.
MATERIALS AND METHODS
Four soybean trials were evaluated for two years (2000-2001). These were the
Full Season Maturity Group VI Soybean Variety Test, which contained 18 entries
(Appendix A), the Uniform Maturity Group IV-S Soybean Yield Test (Appendix B),
which contained 16 entries, the Uniform Maturity Group V Soybean Yield Test
(Appendix C), which contained 34 entries, and the Uniform Maturity Group VI Soybean
Yield Test (Appendix D), which contained 24 entries. The data for the three locations of
the Full Season Maturity Group VI Soybean Variety Tests were combined . The Uniform
tests were part of the Uniform Soybean Test for the Southern Region.
19
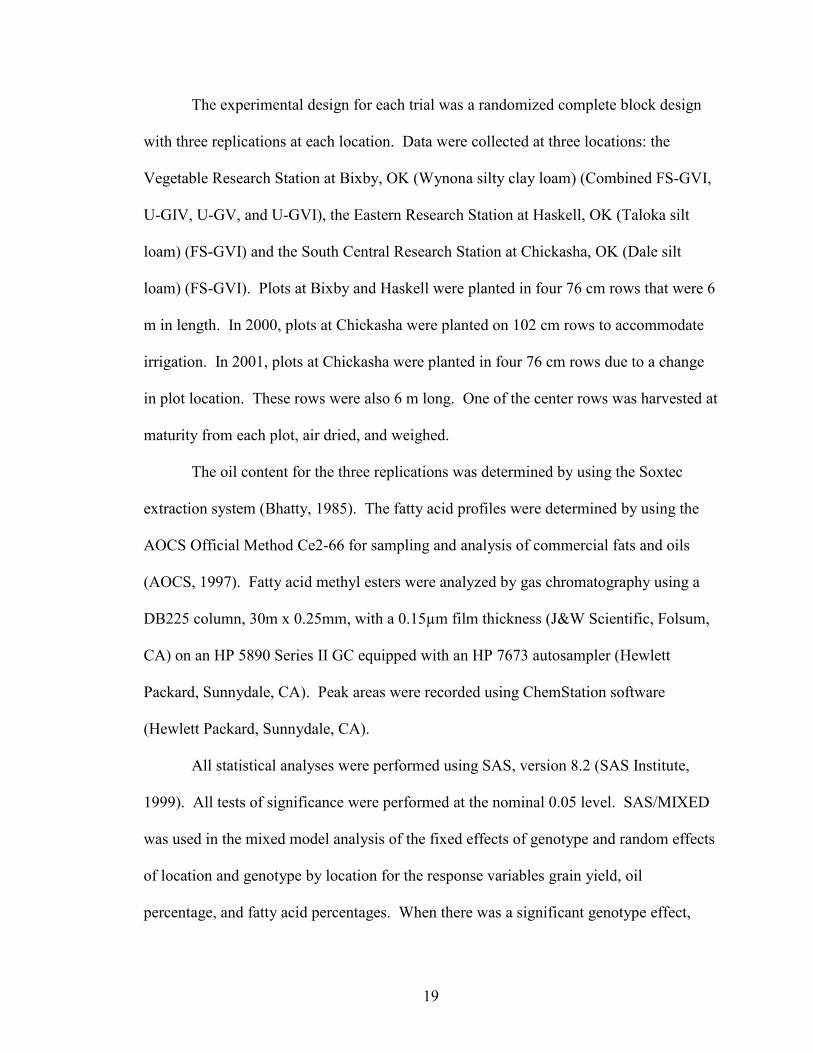
The experimental design for each trial was a randomized complete block design
with three replications at each location. Data were collected at three locations: the
Vegetable Research Station at Bixby, OK (Wynona silty clay loam) (Combined FS-GVI,
U-GIV, U-GV, and U-GVI), the Eastern Research Station at Haskell, OK (Taloka silt
loam) (FS-GVI) and the South Central Research Station at Chickasha, OK (Dale silt
loam) (FS-GVI). Plots at Bixby and Haskell were planted in four 76 cm rows that were 6
m in length. In 2000, plots at Chickasha were planted on 102 cm rows to accommodate
irrigation. In 2001, plots at Chickasha were planted in four 76 cm rows due to a change
in plot location. These rows were also 6 m long. One of the center rows was harvested at
maturity from each plot, air dried, and weighed.
The oil content for the three replications was determined by using the Soxtec
extraction system (Bhatty, 1985). The fatty acid profiles were determined by using the
AOCS Official Method Ce2-66 for sampling and analysis of commercial fats and oils
(AOCS, 1997). Fatty acid methyl esters were analyzed by gas chromatography using a
DB225 column, 30m x 0.25mm, with a 0.15µm film thickness (J&W Scientific, Folsum,
CA) on an HP 5890 Series II GC equipped with an HP 7673 autosampler (Hewlett
Packard, Sunnydale, CA). Peak areas were recorded using ChemStation software
(Hewlett Packard, Sunnydale, CA).
All statistical analyses were performed using SAS, version 8.2 (SAS Institute,
1999). All tests of significance were performed at the nominal 0.05 level. SAS/MIXED
was used in the mixed model analysis of the fixed effects of genotype and random effects
of location and genotype by location for the response variables grain yield, oil
percentage, and fatty acid percentages. When there was a significant genotype effect,
20
means separation was performed using the Dunnett-Hsu multiple comparison method
(Kuehl, 2000) where genotypes were compared to the optimal performing genotype for
that response variable. The Dunnett-Hsu procedure was selected due to the number of
genotypes studied and because only genotypes with the best or optimal response values
are of interest. SAS/CORR was used to calculate Pearson correlations between grain
yield, oil content, and the fatty acid percentages.
Specific fatty acid levels were looked for when determining the optimal genotype
that would be used in the Dunnett-Hsu procedure. High C18:0 percentages were used
because these oils have a greater oxidative stability than normal soybean oil (White,
2000). Also, oils with a higher saturated fatty acid content (C18:0) have increased
melting temperatures (List et al., 2001). A high C18:1 content was optimal because
genotypes high in this fatty acid were found to be less susceptible to oxidative changes
during refining, storage, and frying (Carver et al., 1984). A high grain yield and high oil
content were also determined optimal for the Dunnett-Hsu procedure. A low C16:0
content was used because it was determined that genotypes low in C16:0 content have
improved nutritional quality (Rebetzke et al., 1998a). Low C18:2 and C18:3 contents
were also used because these oils have a low polyunsaturated fat content, which makes
the oil more stable (Neff and List, 1999; White, 2000).
RESULTS AND DISCUSSION
Combined Full Season Maturity Group VI
2000 Agronomic Results
The mean grain yield for the 2000 Combined Full Season Maturity Group VI test
was 456.9 kg ha-1 (Table 2). Oil content averaged well below the recommended standard

21
of 18% determined by Updaw and Nichols (1980). The C16:0 and C18:3 mean
compositions were found to be within their standard percentages of 9.7-13.3 and 5.5-9.5,
respectively (Table 1). The C18:2 mean was below its standard percentage and C18:0
and C18:1 were above their 3.0-5.4 and 17.7-28.5 ranges, respectively (Table 1 and 2).
2000 Multiple Comparison Results
Grain yield, C16:0, C18:0, C18:1, C18:2 and C18:3 all showed significant
genotype effects. Boggs (yield), OK895618 (C16:0), OK915605 (C18:1), OK895806,
OK915605 (C18:2), and Soyola (C18:0, C18:2 and C18:3) were used as the optimal
genotype for their respective variables in the Dunnett-Hsu multiple comparison test
(Table 2). Soyola was the genotype that optimized the most response variables: grain
yield, C16:0, C18:0, C18:1, C18:2, and C18:3. That is, it produced a high grain yield, a
low C16:0, C18:2, and C18:3 content, and it produced a high C18:0 and C18:1 content
(Table 2). Other genotypes that merited further consideration were OK915605,
OK926524, OK935907, and Prolina. They were shown to be optimal for five of the six
variables. OK926524 had a high grain yield, low C16:0 and C18:2 content, and it had a
high C18:0 and C18:1 content. The other three genotypes had a high grain yield, a low
C16:0, C18:2 and C18:3 content, and they also had a high C18:1 content (Table 2).
Musen had the poorest performance as it was the only genotype to be significantly
different from the genotypes in the optimal group for all responses.
2000 Phenotypic Results
The development of targeted fatty acid profiles to help expand the use of soybean
oil for edible and industrial applications has become a high priority (Wilson, 1998). The
focus of this type of research has been on three different oil phenotypes (Wilson, 2004).

22
These three phenotypes are frying oils, baking oils, and industrial oils. The results of
these trials were evaluated using these phenotypic options. For all the traits that were
evaluated the importance of their results being high or low was determined by what the
end use will be. A high grain yield is always desirable, so it was included in each of the
three phenotypes that were evaluated.
The first phenotype that was evaluated was frying oil. Genotypes that fit into this
category have a high C18:1 content and low C16:0 and C18:3 contents. High C18:1
content makes the oil less susceptible to oxidative changes during refining, storage, and
frying (Carver et al., 1984). A low C16:0 content improves the nutritional quality of the
oil and a low C18:3 content means enhanced frying stability (Table 2) (Rebetzke et al.,
1998a; White, 2000). There were five genotypes that satisfied the characteristics looked
for in this phenotype. OK915605, OK935907, OK935917, Prolina, and Soyola all
produced high grain yields, a high C18:0 content and low C16:0 and C18:3 contents
(Table 2). Other genotypes possessed one or two of the four characteristics.
The second phenotype that was evaluated was baking oil. As with the first
phenotype, a low C16:0 content is recommended because it improves the nutritional
quality of the oil and a combined low C18:2 and C18:3 content means a low
polyunsaturated fatty acid content, thus making the oil more stable (Table 2) (Rebetzke et
al., 1998a; Neff and List, 1999). Again, OK915605, OK935907, OK935917, Prolina, and
Soyola were found to exhibit the needed characteristics (Table 2). These genotypes
produced high yields along with oils that were low in C16:0 and low in polyunsaturated
fatty acids.

23
The final phenotype that was evaluated was industrial oil. The specific industrial
use evaluated was Soy-diesel or biodiesel. For this use a high C18:1 level was used
because this increased the cetane index and a low C16:0 level was used because it
improved the cold-flow of the diesel fuel. These conditions help overcome ignition
problems and poor performance in cooler climates (Dunn et al., 1996). There were nine
genotypes that satisfied the needed characteristics for this phenotype (Table 2).
2000 Pearson Correlation Results
There were five correlations found to be significant in these data (Table 3).
Negative correlations were found between C18:0/Yield, C18:2/C18:0, C18:2/C18:1 and
C18:3/C18:1. The negative correlations between C18:2/C18:1 and C18:3/C18:1 were
anticipated because C18:1 is a precursor for C18:2 and C18:3. Thus as C18:1 increased
the percentage of the other two fatty acids would decrease and vice versa. A positive
correlation was also found between C18:3/C18:2 (Table 3). This correlation is surprising
because C18:2 is the precursor for C18:3. Thus you would expect these two fatty acids to
be negatively correlated.
2001 Agronomic Results
The mean yield for the Combined Full Season Group VI tests in 2001 (2284.5 kg
ha-1) (Table 4) was higher than the mean yield in 2000 (463.6 kg ha-1) (Table 2). Oil did
increase, but the average of 11.0% was still well below the recommended 18% (Updaw
and Nichols, 1980). The fatty acids all performed within their expected ranges.
2001 Multiple Comparison Results
C16:0, C18:0, C18:1, C18:2, and C18:3 were the variables that produced a
significant genotype effect (Table 4). OK895618 (C16:0), OK895608 (C16:0 and
24
C18:0), OK935907 (C18:1 and C18:2), and Soyola (C18:3) were the genotypes for these
five fatty acids. In this year’s results, OK935907 was the genotype that was most
consistent when looking at the five significant variables (Table 4). It produced a high
C18:0, C18:1, and C18:2 content, and it produced a low C18:3 content. OK935907 was
also the top genotype for the variables C18:1 and C18:2 (Table 4). Soyola also deserves
consideration because of its performance. Soyola produced a high C18:0 and C18:1
content as well as a low C18:3 content; it was the preferred genotype for these variables.
Choska was the poorest entry as it was the only entry to be significantly different from
the optimal genotype in all five response variables.
2001 Phenotypic Results
The genotypes were again evaluated using the frying, baking, and industrial oil
phenotypes. This year’s results were in great contrast to the previous year because a
smaller number of genotypes showed no notable difference from the optimal genotype.
For the frying oil phenotype, in 2000 (Table 4) there were five genotypes that met the
needed characteristics. In 2001, only two genotypes, OK935907 and Soyola, met two of
the characteristics for this phenotype, and the remaining genotypes only met one of the
characteristics. The same is true for the baking oil phenotype with the exception of
Soyola, which only met one of the needed characteristics. In the industrial oil phenotype,
of the nine genotypes that met the characteristics in 2000, six genotypes met one of the
three characteristics needed to be considered useful for this phenotype; the remaining
genotypes met none of the characteristics
25
2001 Pearson Correlation Results
Four correlations were found in this data. The negative correlations between
C18:2/C18:0, C18:2/C18:1, and C18:3/C18:1 that were found in 2000 were again found
in 2001 (Table 5). A positive correlation between C18:1/C18:0 was found. This
correlation is new and does require further investigation to determine its validity. The
negative correlation that was found between C18:0/Yield and C18:3/C18:2 was not found
in this year’s data.
Summary of the Combined Full Season Maturity Group VI test
OK935907 and Soyola showed that they were the top genotypes in the Combined
Full Season Maturity Group VI test. In 2000, OK935907 produced a high grain yield and
a high C18:1 content. It also produced low C16:0, C18:2, and C18:3 contents (Table 2).
In 2001, it repeated its performance for C18:1, C18:2, and C18:3. This time it was the
preferred genotype for both C18:1 and C18:2 (Table 4). Soyola was optimal for all six
significant response variables in 2000. It was also the preferred genotype for three of
those variables (C18:0, C18:2, and C18:3) (Table 2). In 2001, Soyola produced high
C18:0 and C18:1 contents and a low C18:3 content. As it was in 2000, it was the
preferred genotype for C18:3 in 2001 (Table 4).
OK935907 can also be called the most consistent performer when looking at the
phenotypic results. In 2000, OK935907 met all of the needed characteristics for all three
phenotypes that were evaluated. It was found to be useful for the frying oil, baking oil,
and industrial oil phenotypes. However, in 2001, OK935907 only met two of the four
needed characteristics for frying and baking oil phenotypes and it only met one of the
characteristics for the industrial oil phenotype. Soyola was also one of the consistent
26
performers in the phenotypic results. As with OK935907, Soyola met all the needed
characteristics for all three of the phenotypes that were evaluated in 2000. And as did
OK935907 in 2001, Soyola performed below its previous year results. It met two of the
four needed characteristics for the frying oil phenotype and then it met only one of the
characteristics for the baking and industrial oil phenotypes.
UNIFORM MATURITY GROUP IV
2000 Agronomic Results
The mean grain yield and oil contents were very low for the Uniform Maturity
Group IV test conducted at Bixby, OK (Table 6). C16:0 and C18:0 both performed
within their expected ranges of 9.7-13.3 and 3.0-5.4, respectively. C18:1 (17.7-28.5) had
a mean that was higher than its standard percentage and C18:2 (49.8-57.1) and C18:3
(5.5-9.5) were lower than expected (Table 6).
2000 Multiple Comparison Results
Grain yield and C16:0 were the only variables that demonstrated a significant
genotype effects. V94-0198 and V94-0552 were shown to be the preferred genotypes for
grain yield and C16:0, respectively. There were 11 genotypes that produced both a high
grain yield and a low C16:0 content (Table 6). Three genotypes were significantly
different for grain yield; two genotypes were significantly different for C16:0.
2000 Phenotypic Results
Because there were only two variables shown to have significant genotypic
effects all three oil phenotypes had the same outcome. Eleven genotypes exhibited two
of the four characteristics for the frying and baking oil phenotypes; and they exhibited
one of the three characteristics for the industrial oil phenotype (Table 6).

27
2000 Pearson Correlation Results
As in the 2000 Combined Full Season Maturity Group VI test, negative
correlations between C18:2/C18:0, C18:2/C18:1, C18:3/C18:1, and a positive correlation
between C18:3/C18:2 were found (Table 3). Two new correlations were also found. A
negative correlation between C18:3/C18:0 and a positive correlation between
C18:1/C18:0.
2001 Agronomic Results
The Uniform Maturity Group IV test had a high mean grain yield (Table 7).
Mean oil content was 16.0% and this was much closer to the recommended standard of
18% determined by Updaw and Nichols (1980). The mean percentages for C16:0, C18:0,
C18:1, C18:2, and C18:3 were all within their expected ranges (Table 7).
2001 Multiple Comparison Results
Only one response variable, C16:0, out of the seven examined showed a
significant genotype effect (Table 7). K1401 was shown to produce the lowest C16:0
content. Of the 16 genotypes, there were two genotypes, TN95-268 and TN96-63 that
were found to be significantly different from K1401.
2001 Phenotypic Results
Because only one response variable showed a significant genotypic difference
the genotypes in this test were not evaluated using the three oil phenotypes (Table 7).
2001 Pearson Correlation Results
Only one significant correlation was found in this test, a negative correlation
between C18:2/C18:1 (Table 5). This correlation was also exhibited in 2000. Again, this
correlation was anticipated because of the relationship between C18:1 and C18:2.

28
Summary of the Uniform Maturity Group IV test
Looking at both years of the Uniform Maturity Group IV test, 13 genotypes
optimized C16:0 content in both years of the study (Table 6 and Table 7). TN96-63 was
found to be optimal in 2000, but not in 2001 and V94-0436 was found to be optimal in
2001, but not in 2000.
UNIFORM MATURITY GROUP V
2000 Agronomic Results
The Uniform Maturity Group V test performed similar to the Uniform Maturity
Group IV test (Table 6). Grain yield was high and oil content was still low with a mean
of 10.0%. C16:0 performed within its standard range of 9.7-13.3 percent (Table 8).
C18:0 (5.6%) and C18:1 (31.4%) both had means above their standard ranges and C18:2
(46.4%) and C18:3 (4.9%) were again below their standard ranges (Table 1).
2000 Multiple Comparison Results
All response variables showed a significant genotypic effect (Table 8). TN93-99
(Grain yield), V93-3114 (Oil), S96-2692 (C16:0), DT98-6840 (C18:0), and R96-1471
(C18:1, C18:2, and C18:3) were the optimal genotypes. K1425, K1466, Manokin, N96-
556, P9594, and V95-0016 were the genotypes that optimized all seven response
variables (Table 8). R96-1417 and eight other genotypes merited further consideration
because they optimized six of the seven response variables. R96-1417 produced a high
yield, a low C16:0, C18:2, and C18:3 content, and a high C18:0 and C18:1 content. It
was also found to be the preferred genotype for C18:1, C18:2, and C18:3 (Table 8).

29
2000 Phenotypic Results
For the frying oil phenotype, 12 genotypes exhibited all characteristics needed for
this phenotype (Table 8.). There were thirteen genotypes that demonstrated three of the
characteristics. For the baking oil phenotype, there were 10 genotypes that demonstrated
all four characteristics. Nine genotypes demonstrated three of the four phenotypic
characteristics. For the industrial oil phenotype, there were 14 genotypes that
demonstrated the three characteristics needed for this phenotype (Table 8). K1425,
K1466, Manokin, N96-556, P9594, R96-1471, S96-2692, and V95-0016 were the only
genotypes to meet all the needed characteristics for all three phenotypes.
2000 Pearson Correlation Results
Four correlations, the negative correlations between C18:2/C18:0, C18:2/C18:1
and C18:3/C18:1 and the positive correlation between C18:3/C18:2, which were
observed in 2000 Combined Full Season Maturity Group VI test and the 2000 Uniform
Maturity Group IV test, were observed in this test (Table 3). The negative correlation
between C18:3/C18:0 that was observed in the 2000 Uniform Maturity Group IV test
data was also observed here.
2001 Agronomic Results
The Uniform Maturity Group V test had a mean grain yield of 1478.2 kg ha-1 and
a mean oil content of 13.3% (Table 9). These were both higher than the previous year’s
means. All the fatty acids had means within their expected ranges (Table 1).
2001 Multiple Comparison Results
Oil, C18:0, C18:1 and C18:3 had significant genotypic effects by the MIXED
procedure (Table 9). N96-556 (Oil), K1424 (C18:0), S96-2692 (C18:1), and S97-1688
30
(C18:3) were the preferred genotypes for these four response variables. Nine genotypes
are recommended based on two of the four response variables. A5547, DT96-6840, and
TN93-99 were observed to be optimal for C18:0 and C18:3. Hutcheson, K1463, N96-
556, and R96-1471 were observed to be optimal for oil and C 18:0; while N96-7211 and
S96-2692 were observed to be optimal for C18:0 and C18:1. There were also 17
genotypes found to be optimal for one of the four response variables (Table 9).
2001 Phenotypic Results
For the frying oil phenotype, S97-1688 was the only genotype to demonstrate two
of the four characteristics for the phenotype. In the baking oil phenotype, A5547, DT96-
6840, S97-1688, and TN93-99 were the only genotypes to meet one of the four
characteristics for this phenotype. Four genotypes exhibited one of the three
characteristics for the industrial oil phenotype (Table 9).
2001 Pearson Correlation Results
Two correlations were observed in these data (Table 5), a negative correlation
between C18:3/C18:1. This correlation was also observed in the Combined Full Season
Maturity Group VI test. A positive correlation between C18:3/C18:2 was also observed.
Summary of the Uniform Maturity Group V test
Six genotypes were recommended based on all seven response variables in 2000.
In 2001, N96-556 was the only genotype recommended. It produced a high grain yield, a
low C16:0, C18:2 and C18:3 content and a high C18:1 content in 2000; and in both years
it produced a significant oil percentage and a high C18:0 content. Manokin and V95-
0016 produced a significant C18:0 content in both years of the study. P9594 produced a
significant C18:1 content in both years also. Another genotype that merits further

31
consideration is R96-1471. It produced a low C16:0, C18:2 and C18:3 content, and a high
C18:1 content in 2000 (Table 8). In both 2000 and 2001 it also produced a high C18:0
content along with being the recommended genotype for C18:1, C18:2 and C18:3 in 2000
(Table 8). According to these results, R96-147 was also a recommended genotype in the
Uniform Maturity Group V test.
There was a large difference between the phenotypic results of 2000 and 2001.
Eight genotypes in 2000 exhibited all the characteristics for all three phenotypes (Table
8). In 2001, S97-1688 was the only genotype to exhibit more than one of the
characteristics for any of the phenotypes. The remaining genotypes exhibited one of the
characteristics or less. In total there were only six genotypes to exhibit at least one of the
needed characteristics in more than one phenotype in 2001; in 2000, all of the genotypes
did this. The change in weather conditions from 2000 to 2001 had a major impact on this
trial.
UNIFORM MATURITY GROUP VI
2000 Agronomic Results
The averages for grain yield and oil were low for the Uniform Maturity Group VI
test. C16:0 and C18:3 had mean percentages that were within their expected ranges
(Table 1). C18:2 was below its expected range and the means for C18:0 and C18:1 were
above their normal ranges (Table 10).
2000 Multiple Comparison Results
There were six variables that had significant genotype effects. These variables
were grain yield, oil content, C18:0, C18:1, C18:2, and C18:3 (Table 10). TN91-220-53
(Yield), R96-1559 (oil), N97-3525 (C18:0, C18:1, and C18:2), and OK935907 (C18:3)

32
were determined to be the preferred genotypes. N97-3525 was the genotype that most
consistently optimized the response variables oil, C18:0, C18:1, C18:2, and C18:3. It
produced a high oil percentage, a low C18:2 and C18:3 content, and a high C18:0 and
C18:1 content (Table 10). It was also the preferred genotype for C18:0, C18:1, and
C18:2. There were five other genotypes that also merit consideration since they too
optimized five of the six response variables. Those genotypes were Dillon, N97-61, N97-
9812, OK926524, and OK935907 (Table 10). R96-1559 and R96-1939 may also deserve
some consideration because they optimized four of the six significant response variables
2000 Phenotypic Results
Although there were no genotypes that completely satisfied all of the
characteristics for the three phenotypes, some genotypes did exhibit some of the needed
characteristics. N97-61, N97-9812, OK926524, R96-1939, and TN93-142-17 had three
of the four characteristics needed for the frying oil phenotype. For the baking oil
phenotype five genotypes exhibited three of the four characteristics. There were also five
genotypes that exhibited two of the needed characteristics. Lastly, there were six
genotypes that met two of the three industrial oil characteristics.
2000 Pearson Correlation Results
Five significant correlations exhibited in the other three trials of this study were
also exhibited here (Table 3). These were the negative correlations between
C18:2/C18:0, C18:2/C18:1, C18:3/C18:1, C18:3/C18:0 and a positive correlation
between C18:1/C18:0 (Table 4). Two significant correlations that had not been observed
in the other three trials were also found. These were a negative correlation between
C18:1/C16:0 and a positive correlation between C18:2/yield.

33
2001 Agronomic Results
The mean grain yield for the Uniform Maturity Group VI test was high at 2177.0
kg ha-1 (Table 11). The mean oil content was again lower than the standard set by Updaw
and Nichols (1980). All the fatty acids had averages that were within the ranges expected
(Table 1).
2001 Multiple Comparison Results
The five fatty acids were the only variables to have a significant genotype effect
(Table 11). N97-61 was the preferred genotype for C18:0 and C18:2 and N97-3525 was
the preferred genotype for C16:0, C18:1, and C18:3. AU94-507, G95-179, and SC95-
1070 optimized all five significant response variables. They produced low C16:0, C18:2,
and C18:3 contents as well as high C18:0 and C18:1 contents (Table 11). There were
also 10 genotypes that optimized four of the six response variables.
2001 Phenotypic Results
There were six genotypes that exhibited three of the four frying oil phenotype
characteristics. Fourteen genotypes exhibited two of the four characteristics. Nineteen of
the 21 tested genotypes exhibited three of the four baking oil phenotypic characteristics.
The other two genotypes exhibited two of the four characteristics. There were 12
genotypes that exhibited two of the three industrial oil phenotypic characteristics and nine
genotypes that exhibited only one characteristic (Table 11).
2001 Pearson Correlations
Four negative correlations were observed in this test (Table 5). The negative
correlations between C18:2/C18:0, observed in the 2001 Combined Full Season Maturity
Group VI test, and C18:3/C18:1, observed in the 2001 Combined Full Season Maturity

34
Group VI test and the 2001 Uniform Maturity Group V test, were observed in this test.
Significant negative correlations were observed between C18:1/C16:0 and C18:3/C16:0.
The correlation between C18:3/C16:0 was not observed in the 2000 U-GVI trail.
Summary of the Uniform Maturity Group VI test
N97-3525 was the optimal genotype of this test. In 2000, it produced low C18:2
and C18:3 contents and high oil, C18:0, and C18:1 contents. In 2001, it again produced a
low C18:3 content as well as a low C16:0 content and it produced a high C18:1 content.
Other genotypes that deserve merit include Dillon, N97-61, N97-9812, OK926524, and
OK935907. They were optimal for five of the six response variables in 2000 (Table 10)
and between four and three of the five response variables in 2001 (Table 11).
Although there were no genotypes that met all of the characteristics for any of the
three phenotypes, the two years did have some genotypes that showed some promise. For
the frying oil phenotype, there was a slight increase in the number of genotypes that met
three of the characteristics when you compare 2000 to 2001. There were three genotypes
that produced two of the four characteristics in both years. The same is true for the
second phenotype. For the baking oil phenotype there was a larger number of genotypes
that possess three of the four characteristics in 2001 when compared to 2000; five of
these genotypes did meet three of the four characteristics in both years. For the industrial
oil phenotypes the two years results were similar. In 2000, three genotypes did not
possess any of the characteristics for this phenotype, but in 2001 all of the genotypes
possessed at least one characteristic. Dillon was the only genotype in this phenotype to
meet two of the three characteristics in both years.

35
2000 Overall Summary
The results from 2000 confirm some of the correlations that have been reported in
previous literature. The low correlation between yield/oil cited by Burton (1987) held
true; none of the trials showed a significant yield/oil correlation. The negative
correlations between C18:2/C18:1 and C18:3/C18:1 that were determined by Carver et al.
(1984) were found in all four trials in 2000. Also, a negative correlation between
C18:2/C18:0 was found in all four trials. The negative correlation between C18:1/C16:0
that was discussed by Rebetzke et al. (1998a) was only found in the Uniform Maturity
Group VI test. Other significant correlations were found in three or less of the trials and
those correlations may need further investigation. In 2000, some experimental lines had
desirable fatty acid characteristics. OK915605 exhibited significantly low C16:0, C18:2,
and C18:3 contents and a high C18:1 content along with a high yield (Table 2). The
environmental conditions under which these soybean lines were developed could be the
cause for these fatty acid combinations. Cherry et al. (1985) and Howell and Collins
(1957) found that oil and C18:1 percentages increased while C18:2 and C18:3
percentages decreased in warmer temperatures. These trials were in agreement with
these findings except that all of the trials in this report had oil percentages much lower
than expected. These low oil percentages could be the result of the combination of warm
temperatures during seed development and the lack of rainfall during plant growth. As
Smith (1984) stated, when temperatures during seed-fill are high an accumulation of
C18:1 occurs while C18:2 and/or C18:3 levels drop. It was also shown that many of the
experimental lines exhibited characteristics that fit into the phenotypic profiles of frying
oils, baking oils, and industrial oils (Wilson, 1998). Many of the experimental lines

36
demonstrated many, if not all, of the fatty acid characteristics that made up these three oil
phenotypes.
2001 Overall Summary
The results of 2001 were very different from those in 2000. Grain yields were
much higher and the fatty acid contents were closer to expected ranges. What set the
second year apart from the first was that the trials received rainfall in August at each
location. The trials received 4.8 to 8.6 cm of rain depending upon the location (Table
12). Also, temperatures were closer to optimal for seed development (Holmberg, 1973).
During seed-fill, temperatures were still above the optimum, but they were not as high as
in 2000. Also, there were only a few days during this period when temperatures were
38°C or higher (Oklahoma Mesonet, 2003).
With the better growing conditions in 2001, yields were much higher than they
were in 2000. Oil percentages were higher, but all trials still produced averages well
below what is expected. These low percentages could again be attributed to the
combination of warm temperatures during seed development and low rainfall amounts
during plant development. Even though temperatures were not as high in 2001 as they
were in 2000, rainfall did occur during August. As in 2000, there was no significant
correlation between yield/oil in any of the trials. The negative correlation between
C18:2/C18:0 was found in two of the four trials. The negative correlations discovered by
Carver et al. (1984) between C18:2/C18:1 and C18:3/C18:1 were found in two of the four
trials and three of the four trials, respectively. The positive correlation between
C18:3/C18:2 was found in only one of the four trials in 2001. Also the negative

37
correlation found by Rebetzke et al. (1998) between C18:1 and C16:0 was found to be
significant in one of the four tests.
CONCLUSIONS
It was determined that year had the largest effect on traits evaluated in this study
because of the differences in rainfall and temperature in 2000 and 2001. In 2000,
temperatures were above what was considered optimal for seed development and drought
stress was present for all locations except Chickasha. In the month of August there was
no recorded rainfall at any of the three locations (Table 12). This was combined with
temperatures reaching the 37.8°C + mark 10 times at Bixby, 17 times at Haskell, and 31
times at Chickasha. In these conditions, the soybeans had high C18:1 content and low
C18:2 and C18:3 content. All soybeans grown at the three locations during 2000 had low
oil content when compared to the recommended standard 18%. In 2001, temperatures
were still above optimum, but there was no drought stress during seed development.
During August 4.8 to 8.6 cm of rainfall was recorded at the three locations (Table 12).
And temperatures reached the 37.8°C + mark three times at Bixby, five times at Haskell,
and nine times at Chickasha. This led to the fatty acid compositions being normal, but oil
percentages were still low. Negative correlations were found between C18:2/C18:0,
C18:2/C18:1, and C18:3/C18:1 as expected.
Although oil was low in both years of this study there were three genotypes that
were not significantly different from the top oil genotype in both years. All three of those
genotypes were found in the Uniform Maturity Group V test conducted at Bixby. Eight
genotypes exhibited low C16:0 characteristics in both years of this study. The majority
of these coming from the Combined Full Season GVI tests (Table 13). Fourteen
38
genotypes exhibited high C18:0 characteristics in both years. Six of the thirteen came
from the Uniform GV tests at Bixby (Table 13). There were nine genotypes that
exhibited the high C18:1 characteristic and nine genotypes that exhibited low C18:2
characteristics. For both variables the majority of those genotypes came from the
Uniform GVI tests at Bixby (Table 13). There were 12 genotypes that exhibited the low
C18:3 characteristic. Again, the majority of those genotypes came from the Uniform
GVI tests at Bixby. A few genotypes were found to exhibit desirable fatty acid
characteristics for multiple fatty acids. OK935907, Dillon (Uniform Maturity Group VI
test), and N97-3525 exhibited a combination of high C18:1 and low C18:2 and C18:3
contents in both years (Table 13).
This study has provided genotypes that can be considered for both production in
Oklahoma and be used as germplasm in a breeding program. The goal of many breeding
programs is to develop soybean lines with specific fatty acid content and this study has
shown that there are many possibilities available to breeders to produce these types of
lines that will grow and flourish in Oklahoma growing conditions.

39
REFERENCES
1. Agricultural Statistics CD-ROM, Oklahoma Farm Statistics. Vol.20 No.16 [12 January 2000].
2. AOCS. 1997. Preparation of methyl esters of fatty acids. Official and Tentative
Methods. Am. Oil Chemists’ Soc. Ce 2-66.
3. Bhatty, R. S. 1985. Comparison of the soxtec and goldfisch systems for determination of oil in grain species. Can. Inst. Food Sci. Technol. J. 18:181-184.
4. Biodiesel. URL: http://www.soygold.com/biodiesel.htm. [4 November 2002].
5. Brim, C. A. 1973. Quantitative genetics and breeding. p. 155-186. In B. E.
Caldwell (ed.) Soybeans: Improvements, production and uses. ASA, CSSA, SSSA, Madison, WI.
6. Bubeck, D. M., W. R. Fehr, and E. G. Hammond. 1989. Inheritance of palmitic
and stearic acid mutants of soybean. Crop Sci. 29:652-656.
7. Burton, J. W. 1987. Quantitative genetics: results relevant to soybean breeding. p. 211-247. In J. R. Wilcox (ed.) Soybeans: Improvement, production, and uses. 2nd ed. ASA, CSSA, SSSA, Madison, WI.
8. Carver, Brett F., Richard F. Wilson, and Joseph W. Burton. 1984. Developmental
changes in acyl-composition of soybean seed selected for high oleic acid concentration. Crop Sci. 24:1016-1019.
9. Chapkin, Robert S. 1992. Reappraisal of the essential fatty acids. In Ching Kuang
Chow (ed.) Fatty acids in foods and their health implications. Marcel Dekker, Inc., New York.
10. Cherry, J. H., L. Bishop, P. M. Hasegawa, and H. R. Leffler. 1985. Differences in
the fatty acid composition of soybean seed produced in northern and southern areas of the U.S.A. Phytochemistry 24:237-241.
11. Dunn, R. O., M. W. Shockley, and M. O. Bagby. 1996. Improving the low-
temperature properties of alternative diesel fuels: Vegetable oil-derived methyl esters. J. Am. Oil Chem. Soc. 73:1719-1728.
12. Erickson, E. A., J. R. Wilcox, and J. F. Cavins. 1988. Inheritance of altered
palmitic acid percentages in two soybean mutants. J. Hered. 79:465-468.
13. Fehr, W. R., G. A. Welke, E. G. Hammond, D. N. Duvick, and S. R. Cianzio. 1991a. Inheritance of reduced palmitic acid content in seed oil of soybean. Crop Sci. 31:88-89.
40
14. Fehr, W. R., G. A. Welke, E. G. Hammond, D. N. Duvick, and S. R. Cianzio. 1991b. Inheritance of elevated palmitic acid content in soybean seed oil. Crop Sci. 31:1522-1524.
15. Firestone, David (ed). 1999. Physical and chemical characteristics of oils, fats,
and waxes. U.S. FDA, Washington D.C.
16. Graef, G. L., W. R. Fehr, L. A. Miller, E. G. Hammond, and S. R. Cianzio. 1998. Inheritance of fatty acid composition in soybean mutant with low linolenic acid. Crop Sci. 28:55-58.
17. Graef, G. L., L. A. Miller, W. R. Fehr, and E. G. Hammond. 1985. Fatty acid
development in a soybean mutant with high stearic acid. J. Am. Oil Chem. Soc. 62:773-775.
18. Hammond, E. G. and W. R. Fehr. 1983. Registration of A5 germplasm line
soybean. Crop Sci. 23:192. 19. Hardin, Ben. 1989. Better tasting, more healthful oils. Agric. Res. 37:10-12.
20. Holmberg, S. A. 1973. Soybeans for cool temperature climates. Agric. Hort.
Genet. 31:1-20.
21. Howell, R. W., and F. I. Collins. 1957. Factors affecting linoleic and linolenic acid content in soybean. Agron. J. 49:593-597.
22. Kane, Mark V., Colleen C. Steele, Larry J. Grabau, Charles T. MacKown, and
David F. Hildebrand. 1997. Early-maturing soybean cropping systems: III. protein and oil contents and oil composition. Agron. J. 89:464-469.
23. Kannangara, C. Gamini, Bruce S. Jacobson, and P. K. Stumpf. 1973. In vivo
biosynthesis of α-linolenic acid in plants. Biochem. Biophys. Res. Commun. 52:648-655.
24. Kuehl, Robert. 2000. Design of experiments: statistical principles of research
design and analysis. Duxbury Press, CA. 25. Lang, X., A. K. Dalai, N. N. Bakhshi, M. J. Reaney, and P. B. Hertz. 2001.
Preparation and characterization of bio-diesels from various bio-oils. Bioresour. Technol. 80:53-62.
26. Lee, Inmok, Lawrence A. Johnson, and Earl G. Hammond. 1996. Reducing the
crystallization temperature of biodiesel by winterizing methyl soyate. J. Am. Oil Chem. Soc. 73:631-636.

41
27. List, G. R., T. Pelloso, F. Orthoefer, K. Warner, W. E. Neff. 2001. Soft margarines from high stearic acid soybean oils. J. Am. Oil Chem. Soc. 78:103-104.
28. Manufactured products and soy. URL:
http://www.talksoy.com/manufactured.htm. [28 February 2000].
29. Miller, L. A. and P. J. White. 1988. High-temperature stabilities of low-linolenate, high-stearate and common soybean oils. J. Am. Oil Chem. Soc. 65:1324-1327.
30. Neff, W. E. and G. R. List. 1999. Oxidative stability of natural and randomized
high-palmitic and high-stearic acid oils from genetically modified soybean varieties. J. Am. Oil Chem. Soc. 76:825-831.
31. Nwokola, E. 1996. Soybean (Glycine max (L.) Merr.). In E. Nwokola and J.
Smartt (ed.) Food and Feed Legumes and Oilseeds: 90-102.
32. Oklahoma Mesonet. URL:http://www.mesonet.org/premium/summary.html. [9 January 2003].
33. Oklahoma State Statistics, 1994-1998 Oklahoma. URL:
http://www.nass.usda.gov/ok/5year99/ok5yr.htm. [12 January 2000].
34. Rahman, S. M., Y. Takagi, and T. Kinoshita. 1997. Genetic control of high stearic acid content in seed oil of two soybean mutants. Theor. Appl. Genet. 95:772-776.
35. Rebetzke, Gregory J., Joseph W. Burton, Thomas E. Carter, Jr., and Richard F.
Wilson. 1998a. Changes in agronomic and seed characteristics with selection for reduced palmitic acid content in soybean. Crop Sci. 38:297-302.
36. Rebetzke, Gregory J., Joseph W. Burton, Thomas E. Carter, Jr., and Richard F.
Wilson. 1998b. Genetic variation for modifiers controlling reduced saturated fatty acid content in soybean. Crop Sci. 38:303-308.
37. Rose, I. A. 1988. Effects of moisture stress on the oil and protein components of
soybean seed. Aust. J. Agric. Res. 39:163-170. 38. Rubel, A., R. W. Rinne, and D. T. Canvin. 1972. Protein, oil, and fatty acid in
developing soybean seed. Crop Sci. 12:739-741.
39. SAS Institute. 1999. SAS system for Windows. Release 8.2. SAS Inst., Cary, NC.
40. Sangwan, Naresh K., Kaushalya Gupta, and Kuldip Singh Dhindsa. 1986. Fatty acid composition of developing soybeans. J. Agric. Food Chem. 34:415-417.
42
41. Smith, L. H. 1984. Seed development, metabolism, and composition. In M. B. Tesar (ed.) Physiological basis of crop growth and development. ASA and CSSA, Madison, WI.
42. Soybean oil – nutritional analysis. URL: http://www.soyohio.org/health/nut-
oil.htm. [15 January 2001].
43. Stojšin, Duška, Bruce M. Luzzi, Gary R. Ablett, and Jack W. Tanner. 1998. Inheritance of low linolenic acid level in the soybean line RG10. Crop Sci. 38:1441-1444.
44. Updaw, N. J. and T. E. Nichols, Jr. 1980. Pricing soybeans on the basis of
chemical constituents. p. 781-799. In F.T. Corbin (ed.) Proc. 2nd world soybean Res. Conf., Raleigh, NC. 26-29 Mar. 1979. Westview Press, Boulder, CO.
45. White, J. 2000. Fatty acids in oilseeds (vegetable oils). In Ching Kueng Chow
(ed.) Fatty acids in foods and their health implications 2nd ed. 209-238. 46. White, P. J. and L. A. Miller. 1988. Oxidative stabilities of low-linolenate, high-
stearate and common soybean oils. J. Am. Oil Chem. Soc. 65:1334-1338.
47. Wilcox, J. R., J. W. Burton, G. J. Rebetzke, and R. F. Wilson. 1994. Trangressive segregation for palmitic acid in seed oil of soybean. Crop Sci. 34:1248-1250.
48. Wilson, R. F. 2004. Seed Composition. p. 621-677. In H.R. Boerma and J.E.
Specht (ed.) Soybeans: Improvement, production, and uses. 3rd ed. ASA, CSSA, SSSA, Madison, WI.
49. Wilson, R.F. 1998. New commodity products from soybean through
biotechnology. Oil Mill Gazetteer 104:27-33.
50. Wilson, R. F. 1991. Advances in the genetic alteration of soybean oil composition. In R. F. Wilson (ed.) Designing value-added soybeans for markets of the future. American Oil Chemists Society, Champaign, IL.
51. World Soybean Production. URL:
http://www.unitedsoybean,org/soystats2000/page_34.htm [15 January 2001].

43
LIST OF TABLES
Table 1. Fatty acid composition and percentages for soybean oil.
Table 2. Means for yield, oil, and fatty acid composition for soybeans grown in the 2000
Combined Full Season Maturity Group VI tests.
Table 3. Pearson correlations for yield, oil, and fatty acids for soybean trials conducted
in Oklahoma during 2000.
Table 4. Means for yield, oil, and fatty acid composition for soybeans grown in the 2001
Combined Full Season Maturity Group VI tests.
Table 5. Pearson correlations for yield, oil, and fatty acids for soybean trials conducted
in Oklahoma during 2001.
Table 6. Means for yield, oil, and fatty acid composition for soybeans grown in the 2000
Uniform Maturity Group IV test conducted at Bixby, OK.
Table 7. Means for yield, oil, and fatty acid composition for soybeans grown in the 2001
Uniform Maturity Group IV test conducted at Bixby, OK.
Table 8. Means for yield, oil, and fatty acid composition for soybeans grown in the 2000
Uniform Maturity Group V test conducted at Bixby, OK.
Table 9. Means for yield, oil, and fatty acid composition for soybeans grown in the 2001
Uniform Maturity Group V test conducted at Bixby, OK.
Table 10. Means for yield, oil, and fatty acid composition for soybeans grown in the 2000
Uniform Maturity Group VI test conducted at Bixby, OK.
Table 11. Means for yield, oil, and fatty acid composition for soybeans grown in the 2001
Uniform Maturity Group VI test conducted at Bixby, OK.

44
Table 12. Rainfall and average temperature for Bixby, Haskell, and Chickasha, OK in
2000-2001 during soybean growing season.
Table 13. Genotypes that exhibited desirable fatty acid characteristics in both 2000 and
2001.

45
Table 1. Fatty acid composition and percentages for soybean oil*.Fatty acid Carbon: Double bond ratio Percent content Lauric C12:0 0-0.1 Myristic C14:0 0-0.2 Palmitic† C16:0 9.7-13.3 Palmitoleic C16:1 0-0.2 Stearic† C18:0 3.0-5.4 Oleic† C18:1 17.7-28.5 Linoleic† C18:2 49.8-57.1 Linolenic† C18:3 5.5-9.5 Arachidic C20:0 0.1-0.6 Gadoleic/ Gondoleic C20:1 0-0.3 Eicosadienoic C20:2 0-0.1 Behenic C22:0 0.3-0.7 Docosenoic C22:1 0-0.3 Lignoceric C24:0 0-0.4 † Essential Fatty Acid
* Firestone, David (ed). 1999. Physical and chemical characteristics of oils, fats, and waxes. U.S. FDA, Washington D. C.
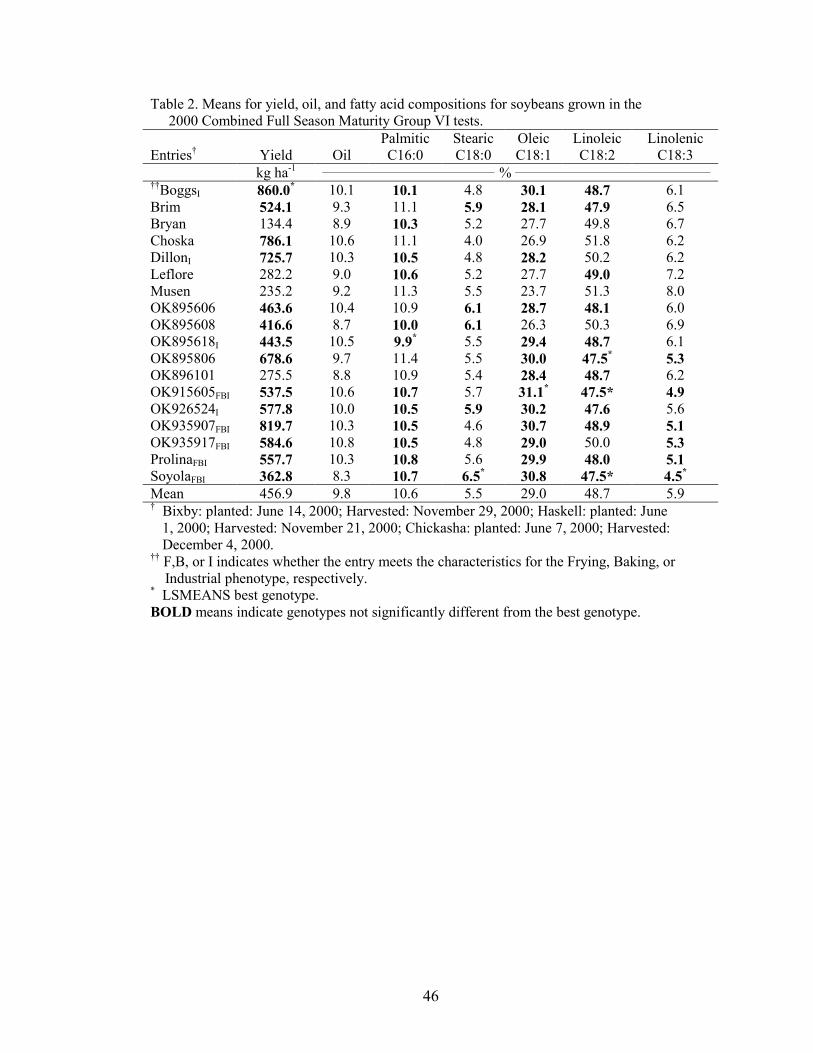
46
Table 2. Means for yield, oil, and fatty acid compositions for soybeans grown in the 2000 Combined Full Season Maturity Group VI tests. Entries† Yield
Oil
Palmitic C16:0
Stearic C18:0
Oleic C18:1
Linoleic C18:2
Linolenic C18:3
kg ha-1 _____________________________________ % __________________________________________ ††BoggsI 860.0* 10.1 10.1 4.8 30.1 48.7 6.1 Brim 524.1 9.3 11.1 5.9 28.1 47.9 6.5 Bryan 134.4 8.9 10.3 5.2 27.7 49.8 6.7 Choska 786.1 10.6 11.1 4.0 26.9 51.8 6.2 DillonI 725.7 10.3 10.5 4.8 28.2 50.2 6.2 Leflore 282.2 9.0 10.6 5.2 27.7 49.0 7.2 Musen 235.2 9.2 11.3 5.5 23.7 51.3 8.0 OK895606 463.6 10.4 10.9 6.1 28.7 48.1 6.0 OK895608 416.6 8.7 10.0 6.1 26.3 50.3 6.9 OK895618I 443.5 10.5 9.9* 5.5 29.4 48.7 6.1 OK895806 678.6 9.7 11.4 5.5 30.0 47.5* 5.3 OK896101 275.5 8.8 10.9 5.4 28.4 48.7 6.2 OK915605FBI 537.5 10.6 10.7 5.7 31.1* 47.5* 4.9 OK926524I 577.8 10.0 10.5 5.9 30.2 47.6 5.6 OK935907FBI 819.7 10.3 10.5 4.6 30.7 48.9 5.1 OK935917FBI 584.6 10.8 10.5 4.8 29.0 50.0 5.3 ProlinaFBI 557.7 10.3 10.8 5.6 29.9 48.0 5.1 SoyolaFBI 362.8 8.3 10.7 6.5* 30.8 47.5* 4.5*
Mean 456.9 9.8 10.6 5.5 29.0 48.7 5.9 † Bixby: planted: June 14, 2000; Harvested: November 29, 2000; Haskell: planted: June
1, 2000; Harvested: November 21, 2000; Chickasha: planted: June 7, 2000; Harvested: December 4, 2000.
†† F,B, or I indicates whether the entry meets the characteristics for the Frying, Baking, or Industrial phenotype, respectively. * LSMEANS best genotype. BOLD means indicate genotypes not significantly different from the best genotype.
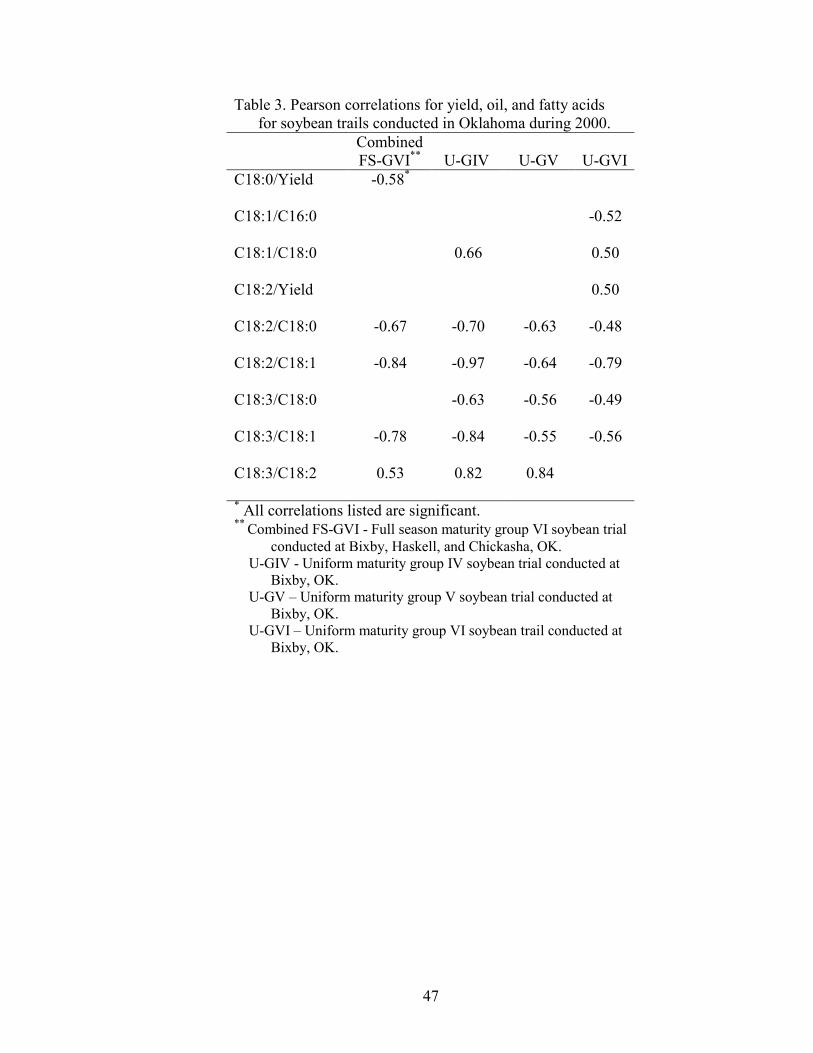
47
Table 3. Pearson correlations for yield, oil, and fatty acids for soybean trails conducted in Oklahoma during 2000.
Combined FS-GVI** U-GIV
U-GV
U-GVI
C18:0/Yield
-0.58*
C18:1/C16:0
-0.52
C18:1/C18:0
0.66 0.50
C18:2/Yield
0.50
C18:2/C18:0
-0.67 -0.70
-0.63
-0.48
C18:2/C18:1
-0.84
-0.97
-0.64
-0.79
C18:3/C18:0
-0.63
-0.56
-0.49
C18:3/C18:1
-0.78
-0.84
-0.55
-0.56
C18:3/C18:2
0.53 0.82 0.84
* All correlations listed are significant. ** Combined FS-GVI - Full season maturity group VI soybean trial
conducted at Bixby, Haskell, and Chickasha, OK. U-GIV - Uniform maturity group IV soybean trial conducted at Bixby, OK. U-GV – Uniform maturity group V soybean trial conducted at Bixby, OK. U-GVI – Uniform maturity group VI soybean trail conducted at
Bixby, OK.

48
Table 4. Means for yield, oil, and fatty acid compositions for soybeans grown in the 2001 Combined Full Season Maturity Group VI tests. Entries† Yield
Oil
Palmitic C16:0
Stearic C18:0
Oleic C18:1
Linoleic C18:2
Linolenic C18:3
Kg ha-1 ____________________________________ % _______________________________________
Boggs 2633.8 13.1 10.2 4.3 22.9 52.0 9.0 Brim 2472.6 10.0 10.7 5.1 23.2 51.0 8.9 Bryan 2324.8 10.6 10.0 4.4 22.6 52.4 9.4 Choska 2358.4 10.1 10.6 4.2 21.9 53.8 8.4 Dillon 2217.3 13.4 10.1 4.5 22.4 53.1 8.6 Leflore 2358.4 10.2 10.9 4.6 23.7 51.3 9.0 Musen 2385.2 10.5 10.9 4.9 19.1 53.7 10.6 OK895606 2210.6 10.9 10.4 5.4 23.0 52.3 8.1 OK895608 2392.0 12.4 9.9 5.5* 21.0 54.0 8.9 OK895618 2533.1 10.3 9.9* 4.9 23.8 51.9 8.3 OK895806 2197.1 10.4 11.0 4.8 24.1 51.0 8.1 OK896101 2385.2 10.2 10.7 4.5 21.7 53.2 9.1 OK915605 1881.3 9.9 10.6 5.1 24.5 51.9 7.3 OK926524 2365.1 13.4 10.9 5.3 21.8 52.9 8.2 OK935907 1921.6 11.9 10.6 5.2 28.5* 48.9* 6.4 OK935917 2351.7 9.8 10.2 4.4 22.9 54.6 7.6 Prolina 1787.3 12.4 10.6 4.9 24.2 52.4 7.3 Soyola 2351.7 9.8 10.6 5.3 25.1 52.6 5.2*
Mean 2284.5 11.0 10.6 4.9 23.1 52.2 8.2 † Bixby: planted: June 13, 2001; Harvested: December 7, 2001; Haskell: planted: June 7,
2001; Harvested: November 21, 2001; Chickasha: planted: June 6, 2001; Harvested: December 6, 2001.
* LSMEANS best genotype. BOLD means indicate genotypes not significantly different from the best genotype.

49
Table 5. Pearson correlations for yield, oil, and fatty acids for soybean trials conducted in Oklahoma during 2001. Combined
FS-GVI**
U-GIV
U-GV
U-GVI C18:1/C16:0
-0.49*
C18:1/C18:0
0.53
C18:2/C18:0
-0.61
-0.56
C18:2/C18:1
-0.82
-0.84
C18:3/C16:0
0.50
C18:3/C18:1
-0.76
-0.61
-0.80
C18:3/C18:2
0.55
* All correlations listed are significant. ** Combined FS-GVI - Full season maturity group VI soybean trial
conducted at Bixby, Haskell, and Chickasha, OK. U-GIV - Uniform maturity group IV soybean trial conducted at Bixby, OK. U-GV – Uniform maturity group V soybean trial conducted at Bixby, OK. U-GVI – Uniform maturity group VI soybean trail conducted at
Bixby, OK.

50
Table 6. Means for yield, oil, and fatty acid compositions for soybeans grown in the 2000 Uniform Maturity Group IV test conducted at Bixby, OK.
Entries† Yield
Oil
Palmitic C16:0
Stearic C18:0
Oleic C18:1
Linoleic C18:2
Linolenic C18:3
Kg ha-1 ___________________________________ % _____________________________________
K1401 503.9 9.2 11.8 5.3 30.8 46.1 4.5 K1423 497.2 10.5 11.2 5.4 28.9 48.1 5.4 KS4694 362.8 10.2 12.2 5.0 29.5 47.6 4.5 MD94-5332 356.1 10.0 12.2 6.4 32.8 43.8 3.9
MD94-5396 571.1 13.4 12.3 4.9 30.2 46.3 4.7 MD96-5275 631.6 9.7 12.0 5.4 30.8 46.0 4.3 MD96-5696 416.6 8.4 11.3 4.7 29.1 48.6 4.7 Manokin 490.5 10.9 11.7 5.7 34.2 43.3 4.1 TN93-87 456.9 10.4 12.3 5.3 31.5 45.2 4.6 TN95-268 611.4 10.1 13.4 5.1 29.5 46.8 4.1 TN96-63 624.9 10.0 11.9 5.6 31.1 46.1 4.3 V94-0198 752.5* 10.5 11.4 5.2 31.7 45.0 5.3 V94-0436 638.3 10.9 12.8 5.6 31.9 44.4 4.2 V94-0552 376.3 14.6 11.0* 5.4 29.5 47.2 5.5 V96-0332 718.9 10.8 12.3 5.6 31.0 45.4 4.7 V96-2543 409.9 9.2 12.4 5.1 27.2 49.2 5.5 Mean 524.1 10.6 12.0 5.3 30.7 46.1 4.6
† Planted: June 14, 2000; Harvested: November 21, 2000 * LSMEANS best genotype. BOLD means indicate genotypes not significantly different from the best genotype.

51
Table 7. Means for yield, oil, and fatty acid compositions for soybeans grown in the 2001 Uniform Maturity Group IV test conducted at Bixby, OK. Entries† Yield
Oil
Palmitic C16:0
Stearic C18:0
Oleic C18:1
Linoleic C18:2
Linolenic C18:3
Kg ha-1 ____________________________________ %______________________________________
K1401 1679.8 17.1 11.0* 4.1 24.5 52.0 7.3 K1423 1975.4 17.6 11.1 4.8 23.4 51.7 7.2 KS4694 2190.4 14.1 11.3 4.8 25.4 50.6 7.1 MD94-5332 2062.7 16.2 11.1 4.9 24.3 51.3 6.9
MD94-5396 1390.8 12.9 11.1 4.0 24.6 51.1 7.4 MD96-5275 1901.5 15.7 11.6 5.1 25.5 50.9 7.2 MD96-5696 1753.7 16.4 11.4 4.6 25.3 50.2 7.4 Manokin 1343.8 14.4 11.3 4.6 24.7 51.0 7.0 TN93-87 1706.6 16.7 11.2 4.4 24.9 50.8 7.0 TN95-268 2707.8 15.3 11.9 4.6 23.7 51.3 7.1 TN96-63 1437.9 14.3 11.8 4.4 23.9 51.2 4.2 V94-0198 1841.0 18.1 11.3 4.5 24.3 51.6 7.9 V94-0436 1841.0 14.4 11.1 4.4 25.1 50.7 7.7 V94-0552 1901.5 19.3 11.1 4.3 24.7 51.3 7.6 V96-0332 2284.5 15.6 11.8 4.8 22.5 52.5 7.1 V96-2543 1753.7 17.1 11.3 4.5 24.1 51.7 6.9 Mean 1861.2 16.0 11.3 4.5 24.4 51.2 7.2 † Planted: June 13, 2001; Harvested: October 26, 2001. * LSMEANS best genotype. BOLD means indicate genotypes not significantly different from the best genotype.
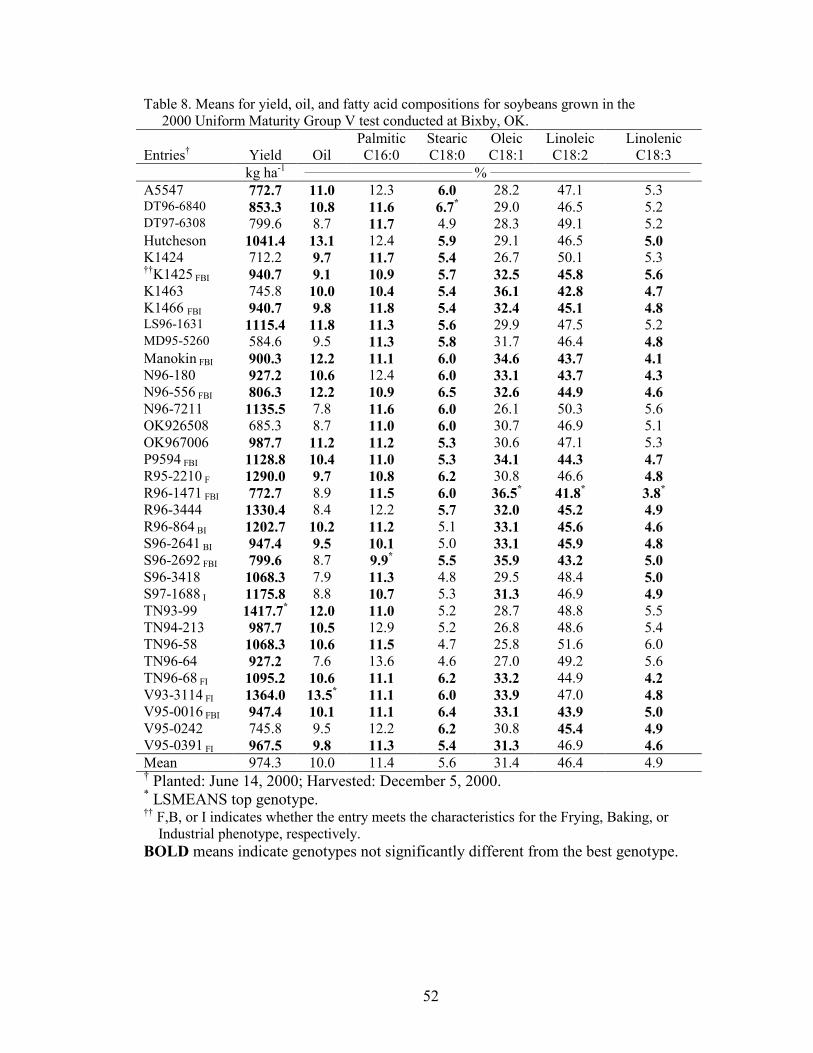
52
Table 8. Means for yield, oil, and fatty acid compositions for soybeans grown in the 2000 Uniform Maturity Group V test conducted at Bixby, OK. Entries† Yield
Oil
Palmitic C16:0
Stearic C18:0
Oleic C18:1
Linoleic C18:2
Linolenic C18:3
kg ha-1 ____________________________________ % ___________________________________________
A5547 772.7 11.0 12.3 6.0 28.2 47.1 5.3 DT96-6840 853.3 10.8 11.6 6.7* 29.0 46.5 5.2 DT97-6308 799.6 8.7 11.7 4.9 28.3 49.1 5.2 Hutcheson 1041.4 13.1 12.4 5.9 29.1 46.5 5.0 K1424 712.2 9.7 11.7 5.4 26.7 50.1 5.3 ††K1425 FBI 940.7 9.1 10.9 5.7 32.5 45.8 5.6 K1463 745.8 10.0 10.4 5.4 36.1 42.8 4.7 K1466 FBI 940.7 9.8 11.8 5.4 32.4 45.1 4.8 LS96-1631 1115.4 11.8 11.3 5.6 29.9 47.5 5.2 MD95-5260 584.6 9.5 11.3 5.8 31.7 46.4 4.8 Manokin FBI 900.3 12.2 11.1 6.0 34.6 43.7 4.1 N96-180 927.2 10.6 12.4 6.0 33.1 43.7 4.3 N96-556 FBI 806.3 12.2 10.9 6.5 32.6 44.9 4.6 N96-7211 1135.5 7.8 11.6 6.0 26.1 50.3 5.6 OK926508 685.3 8.7 11.0 6.0 30.7 46.9 5.1 OK967006 987.7 11.2 11.2 5.3 30.6 47.1 5.3 P9594 FBI 1128.8 10.4 11.0 5.3 34.1 44.3 4.7 R95-2210 F 1290.0 9.7 10.8 6.2 30.8 46.6 4.8 R96-1471 FBI 772.7 8.9 11.5 6.0 36.5* 41.8* 3.8*
R96-3444 1330.4 8.4 12.2 5.7 32.0 45.2 4.9 R96-864 BI 1202.7 10.2 11.2 5.1 33.1 45.6 4.6 S96-2641 BI 947.4 9.5 10.1 5.0 33.1 45.9 4.8 S96-2692 FBI 799.6 8.7 9.9* 5.5 35.9 43.2 5.0 S96-3418 1068.3 7.9 11.3 4.8 29.5 48.4 5.0 S97-1688 I 1175.8 8.8 10.7 5.3 31.3 46.9 4.9 TN93-99 1417.7* 12.0 11.0 5.2 28.7 48.8 5.5 TN94-213 987.7 10.5 12.9 5.2 26.8 48.6 5.4 TN96-58 1068.3 10.6 11.5 4.7 25.8 51.6 6.0 TN96-64 927.2 7.6 13.6 4.6 27.0 49.2 5.6 TN96-68 FI 1095.2 10.6 11.1 6.2 33.2 44.9 4.2 V93-3114 FI 1364.0 13.5* 11.1 6.0 33.9 47.0 4.8 V95-0016 FBI 947.4 10.1 11.1 6.4 33.1 43.9 5.0 V95-0242 745.8 9.5 12.2 6.2 30.8 45.4 4.9 V95-0391 FI 967.5 9.8 11.3 5.4 31.3 46.9 4.6 Mean 974.3 10.0 11.4 5.6 31.4 46.4 4.9 † Planted: June 14, 2000; Harvested: December 5, 2000. * LSMEANS top genotype. †† F,B, or I indicates whether the entry meets the characteristics for the Frying, Baking, or Industrial phenotype, respectively. BOLD means indicate genotypes not significantly different from the best genotype.

53
Table 9. Means for yield, oil, and fatty acid compositions for soybeans grown in the 2001 Uniform Maturity Group V test conducted at Bixby, OK. Entries† Yield
Oil
Palmitic C16:0
Stearic C18:0
Oleic C18:1
Linoleic C18:2
Linolenic C18:3
kg ha-1 ____________________________________ % ___________________________________________
A5547 1243.0 12.4 11.2 5.2 21.4 51.8 8.9 DT96-6840 1720.1 13.9 11.5 4.9 20.2 53.0 8.9 DT97-6308 1384.1 13.6 10.6 5.0 23.7 52.8 7.0 Hutcheson 651.7 13.3 10.7 5.1 21.2 53.4 8.4 K1424 1726.8 -- 10.8 5.6* 21.1 52.8 5.3 K1425 1458.0 16.8 11.1 3.9 21.7 54.0 7.7 K1463 1014.6 13.5 10.8 4.2 22.4 52.6 8.4 K1466 1572.2 13.5 11.4 4.3 20.8 53.7 8.4 LS96-1631 1155.7 13.8 11.3 5.0 21.1 53.2 8.2 MD95-5260 1001.1 14.6 11.2 4.2 22.7 52.9 7.5 Manokin 1565.5 12.5 11.4 5.0 23.6 51.6 7.0 N96-180 1565.5 12.4 11.3 3.9 21.2 53.4 8.4 N96-556 2331.5 12.8* 10.4 4.9 23.3 52.3 7.8 N96-7211 1128.8 12.7 7.9 4.8 19.7 54.6 8.4 OK926508 1706.6 13.6 10.5 4.8 22.6 52.9 7.9 OK967006 1316.9 15.3 10.4 4.6 20.6 54.1 8.8 P9594 1961.9 13.7 9.5 2.9 19.2 45.5 6.6 R95-2210 1632.7 14.1 10.9 4.7 22.1 52.8 8.1 R96-1471 732.4 13.0 10.7 5.3 24.2 50.8 7.6 R96-3444 1175.8 12.3 11.6 4.9 22.6 51.7 8.0 R96-864 1155.7 13.3 10.5 4.5 23.0 52.6 7.9 S96-2641 1847.7 13.1 10.4 4.2 23.6 52.9 7.8 S96-2692 1390.8 12.1 10.3 4.8 24.8* 50.7 8.0 S96-3418 2271.0 12.8 11.3 4.2 22.1 53.5 7.6 S97-1688 1196.0 12.3 10.7 3.9 24.3 52.6 6.9*
TN93-99 1249.7 16.2 10.8 4.9 20.2 53.7 9.0 TN94-213 1343.8 12.4 11.3 4.7 21.0 52.8 8.8 TN96-58 1861.2 14.7 11.6 4.3 24.1 51.5 7.0 TN96-64 1639.4 14.1 11.7 3.8 20.1 54.8 8.3 TN96-68 1451.3 11.1 10.9 4.6 23.8 53.1 7.2 V93-3114 2197.1 11.9 10.7 4.9 22.9 52.1 7.9 V95-0016 1518.5 11.3 10.7 4.7 23.4 51.7 7.9 V95-0242 1914.9 14.7 11.1 4.8 23.2 52.0 7.9 V95-0391 1263.2 11.7 11.3 4.1 21.0 54.3 7.9 Mean 1478.2 13.3 10.8 4.6 22.1 52.6 7.9 † Planted: June 13, 2001; Harvested: December 7, 2001. * LSMEANS best genotype. BOLD means indicate genotypes not significantly different from the best genotype.

54
Table 10. Means for yield, oil, and fatty acid compositions for soybeans grown in the 2000 Uniform Maturity Group VI test conducted at Bixby, OK.
Entries† Yield
Oil
Palmitic C16:0
Stearic C18:0
Oleic C18:1
Linoleic C18:2
Linolenic C18:3
kg ha-1 ___________________________________ % ____________________________________
AU94-507 907.1 11.6 11.7 4.6 26.8 50.0 5.8 AU96-1353 -- 10.1 10.2 6.3 31.1 46.0 6.4 Boggs 483.8 11.2 10.2 5.4 31.5 45.1 6.1 Dillon 551.0 12.3 10.7 5.4 31.9 45.8 5.1 G95-179 -- 7.5 11.5 5.8 28.1 46.1 6.8 N96-6783 544.2 10.0 11.4 4.4 24.9 52.2 6.0 N96-6800 598.0 9.4 11.3 5.1 27.3 49.5 5.8 N97-3525 315.8 11.5 9.0 7.2* 34.1* 43.8* 4.8 N97-61 544.2 11.3 9.3 7.1 31.7 49.2 4.7 N97-9812 685.3 9.0 11.1 6.1 31.8 45.2 4.7 OK926524 665.2 9.5 10.6 6.3 31.7 45.0 5.0 OK935907 772.7 13.2 11.1 5.7 33.4 44.7 4.5*
R96-1559 759.2 14.0* 11.6 5.6 30.2 46.7 4.9 R96-1939 725.7 11.7 12.2 6.2 26.8 48.2 5.2 R96-3538 618.1 11.7 10.7 5.6 29.2 47.7 5.8 SC94-1075 584.6 13.2 11.4 5.3 31.2 44.9 5.9 SC95-1070 309.1 12.1 10.7 5.4 29.7 47.7 5.0 TN91-220-53 947.4* 11.4 10.3 5.5 28.2 48.9 5.7 TN93-142-17 503.9 10.7 11.4 6.0 28.6 48.1 5.5 VS95-154 369.5 8.9 11.3 6.0 27.6 47.2 6.4 VS95-78 -- -- 10.3 5.6 28.7 47.0 6.9 Mean 604.7 11.1 10.9 5.7 29.6 47.3 5.5 † Planted: June 14, 2000; Harvested: December 8, 2000. * LSMEANS best genotype. BOLD means indicate genotypes not significantly different from the best genotype.
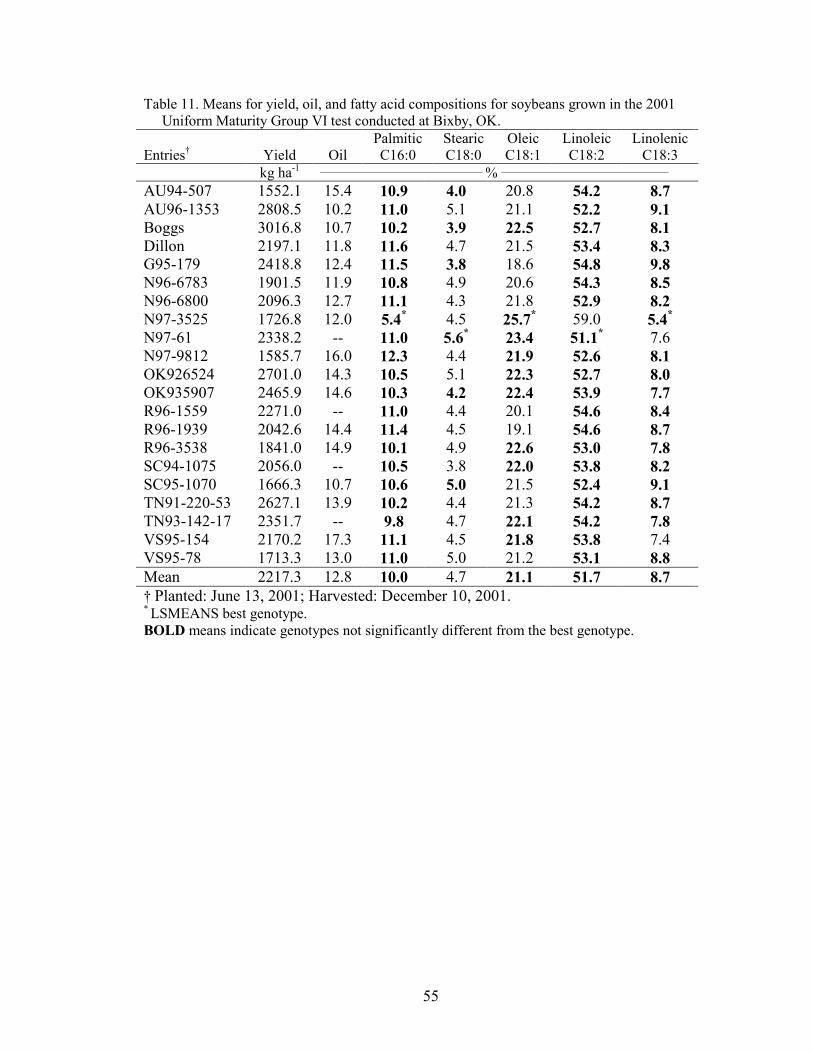
55
Table 11. Means for yield, oil, and fatty acid compositions for soybeans grown in the 2001 Uniform Maturity Group VI test conducted at Bixby, OK. Entries† Yield
Oil
Palmitic C16:0
Stearic C18:0
Oleic C18:1
Linoleic C18:2
Linolenic C18:3
kg ha-1 ___________________________________ % ____________________________________
AU94-507 1552.1 15.4 10.9 4.0 20.8 54.2 8.7 AU96-1353 2808.5 10.2 11.0 5.1 21.1 52.2 9.1 Boggs 3016.8 10.7 10.2 3.9 22.5 52.7 8.1 Dillon 2197.1 11.8 11.6 4.7 21.5 53.4 8.3 G95-179 2418.8 12.4 11.5 3.8 18.6 54.8 9.8 N96-6783 1901.5 11.9 10.8 4.9 20.6 54.3 8.5 N96-6800 2096.3 12.7 11.1 4.3 21.8 52.9 8.2 N97-3525 1726.8 12.0 5.4* 4.5 25.7* 59.0 5.4*
N97-61 2338.2 -- 11.0 5.6* 23.4 51.1* 7.6 N97-9812 1585.7 16.0 12.3 4.4 21.9 52.6 8.1 OK926524 2701.0 14.3 10.5 5.1 22.3 52.7 8.0 OK935907 2465.9 14.6 10.3 4.2 22.4 53.9 7.7 R96-1559 2271.0 -- 11.0 4.4 20.1 54.6 8.4 R96-1939 2042.6 14.4 11.4 4.5 19.1 54.6 8.7 R96-3538 1841.0 14.9 10.1 4.9 22.6 53.0 7.8 SC94-1075 2056.0 -- 10.5 3.8 22.0 53.8 8.2 SC95-1070 1666.3 10.7 10.6 5.0 21.5 52.4 9.1 TN91-220-53 2627.1 13.9 10.2 4.4 21.3 54.2 8.7 TN93-142-17 2351.7 -- 9.8 4.7 22.1 54.2 7.8 VS95-154 2170.2 17.3 11.1 4.5 21.8 53.8 7.4 VS95-78 1713.3 13.0 11.0 5.0 21.2 53.1 8.8 Mean 2217.3 12.8 10.0 4.7 21.1 51.7 8.7 † Planted: June 13, 2001; Harvested: December 10, 2001. * LSMEANS best genotype. BOLD means indicate genotypes not significantly different from the best genotype.
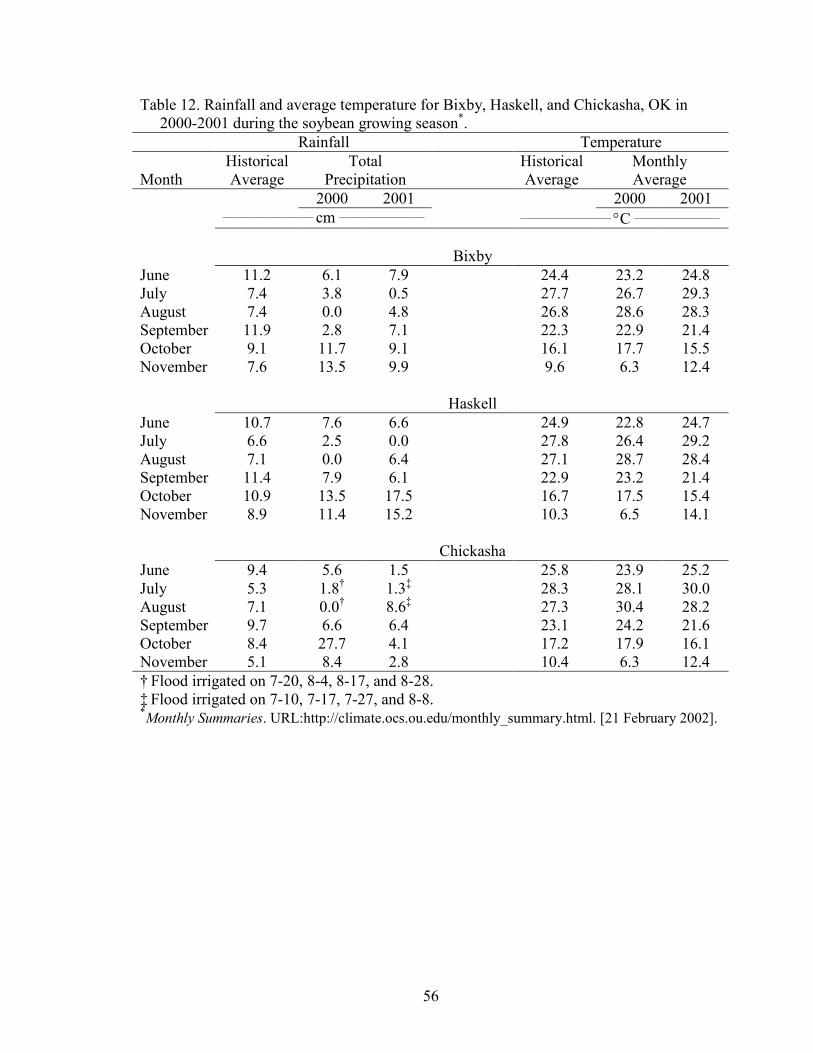
56
Table 12. Rainfall and average temperature for Bixby, Haskell, and Chickasha, OK in 2000-2001 during the soybean growing season*.
Rainfall Temperature
Month Historical Average
Total Precipitation
HistoricalAverage
Monthly Average
2000 2001 2000 2001 _________________ cm ________________ _________________ °C ________________
Bixby June 11.2 6.1 7.9 24.4 23.2 24.8 July 7.4 3.8 0.5 27.7 26.7 29.3 August 7.4 0.0 4.8 26.8 28.6 28.3 September 11.9 2.8 7.1 22.3 22.9 21.4 October 9.1 11.7 9.1 16.1 17.7 15.5 November 7.6 13.5 9.9 9.6 6.3 12.4
Haskell June 10.7 7.6 6.6 24.9 22.8 24.7 July 6.6 2.5 0.0 27.8 26.4 29.2 August 7.1 0.0 6.4 27.1 28.7 28.4 September 11.4 7.9 6.1 22.9 23.2 21.4 October 10.9 13.5 17.5 16.7 17.5 15.4 November 8.9 11.4 15.2 10.3 6.5 14.1
ChickashaJune 9.4 5.6 1.5 25.8 23.9 25.2 July 5.3 1.8† 1.3‡ 28.3 28.1 30.0 August 7.1 0.0† 8.6‡ 27.3 30.4 28.2 September 9.7 6.6 6.4 23.1 24.2 21.6 October 8.4 27.7 4.1 17.2 17.9 16.1 November 5.1 8.4 2.8 10.4 6.3 12.4 † Flood irrigated on 7-20, 8-4, 8-17, and 8-28. ‡ Flood irrigated on 7-10, 7-17, 7-27, and 8-8. *Monthly Summaries. URL:http://climate.ocs.ou.edu/monthly_summary.html. [21 February 2002].
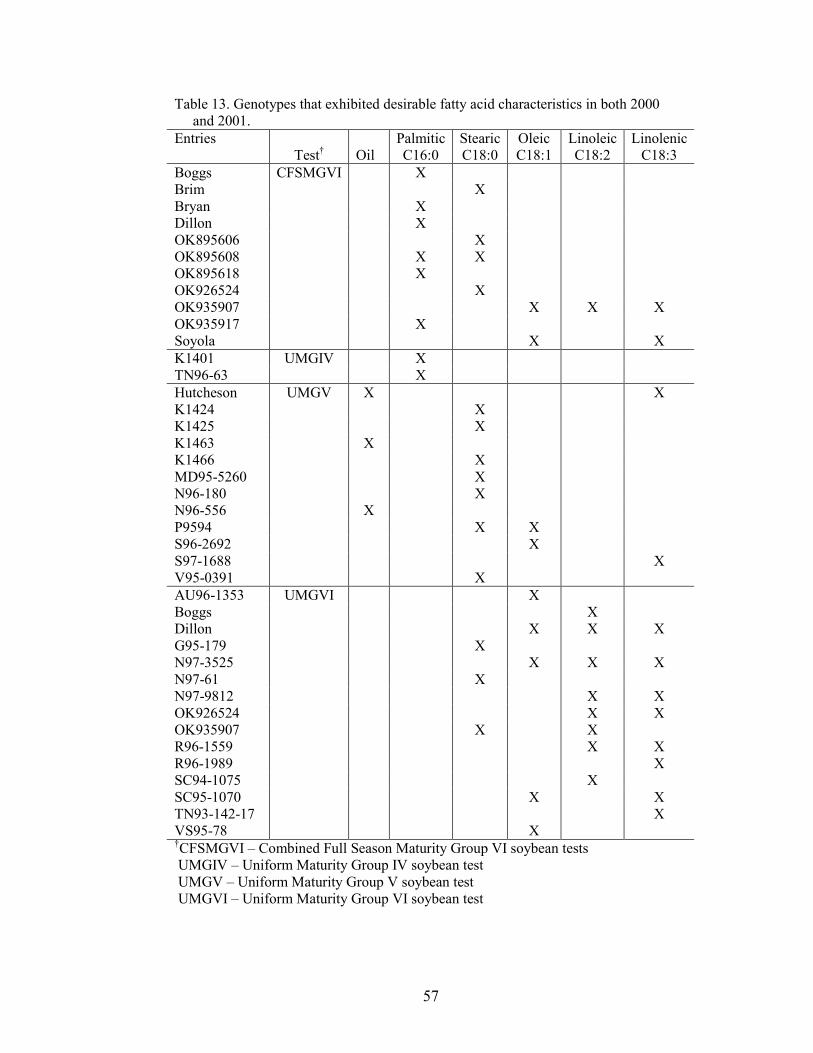
57
Table 13. Genotypes that exhibited desirable fatty acid characteristics in both 2000 and 2001. Entries
Test† Oil Palmitic C16:0
Stearic C18:0
Oleic C18:1
Linoleic C18:2
Linolenic C18:3
Boggs CFSMGVI XBrim X Bryan X Dillon X OK895606 X OK895608 X X OK895618 X OK926524 X OK935907 X X X OK935917 X Soyola X X K1401 UMGIV X TN96-63 X Hutcheson UMGV X X K1424 X K1425 X K1463 X K1466 X MD95-5260 X N96-180 X N96-556 X P9594 X X S96-2692 X S97-1688 X V95-0391 X AU96-1353 UMGVI X Boggs X Dillon X X X G95-179 X N97-3525 X X X N97-61 X N97-9812 X X OK926524 X X OK935907 X X R96-1559 X X R96-1989 X SC94-1075 X SC95-1070 X X TN93-142-17 X VS95-78 X †CFSMGVI – Combined Full Season Maturity Group VI soybean tests UMGIV – Uniform Maturity Group IV soybean test UMGV – Uniform Maturity Group V soybean test UMGVI – Uniform Maturity Group VI soybean test

58
APPENDIXES

59
Appendix A. Genotypes and pedigrees for entries in the Combined Full Season Maturity Group VI soybean variety test.
Varieties State Pedigree Boggs Georgia G81-152 x Coker 6738 Brim North Carolina Young x N73-1102 Bryan Georgia Centennial x Bedford Choska Oklahoma Dyer x Bragg Dillon South Carolina Centennial x Young Leflore Mississippi Centennial x J74-47 Musen South Carolina Hutcheson x Leflore OK895606 Oklahoma Bedford x Mitchell OK895608 Oklahoma Bedford x Mitchell OK895618 Oklahoma Coker 156 x Essex OK895806 Oklahoma Bethel x Essex OK896101 Oklahoma Tracy x Centennial OK915605 Oklahoma Essex x Sohoma OK926524 Oklahoma Miles x Lee 74 OK935907 Oklahoma Sohoma x Forrest OK935917 Oklahoma Sohoma x Forrest Prolina North Carolina N/A†
Soyola North Carolina N87-2117-3 x Brim †Information was not available.

60
Appendix B. Genotypes and pedigrees for entries in the Uniform Maturity Group IV soybean yield test.
Varieties State Pedigree K1401 Kansas Delsoy 4710 x KS4694 K1423 Kansas Manokin x LS86-1922 KS4694 Kansas Sherman x Toano Manokin Missouri L70-L3048 x D74-7824 MD94-5332 Maryland Clifford x Corsica MD94-5396 Maryland Ripley x Clifford MD96-5275 Maryland Ky 88-4080 x Manokin MD96-5696 Maryland Ky 88-4080 x Corsica TN93-87 Tennessee TN85-55 x TN82-268 TN95-268 Tennessee Cordell x Hutcheson TN96-63 Tennessee N85-578 x Manokin V94-0198 Virginia DP 415 x Manokin V94-0436 Virginia DP 415 x C1747 V94-0552 Virginia Hutcheson x Manokin V96-0332 Virginia Hutcheson x Clifford V96-2543 Virginia V85-5344 x C1747

61
Appendix C. Genotypes and pedigrees for entries in the Uniform Maturity Group V soybean yield test.
Varieties State Pedigree A5547 N/A† N/A†
DT96-6840 Mississippi Hutcheson x P9641 DT97-6308 Mississippi Hutcheson x A5979 Hutcheson Virginia V68-1034 x Essex K1424 Kansas Hutcheson x A4715 K1425 Kansas Hartwig x KS4895 K1463 Kansas S88-1934 x N90-516 K1466 Kansas Manokin x HC89-2170 LS96-1631 Illinois Gateway511 x Hutcheson Manokin Missouri L70-L3048 x D74-7824 MD95-5260 Maryland S88-1855 x Manokin N96-180 North Carolina N87-298 x Cook N96-556 North Carolina N87-298 x NRS5Y N96-7211 North Carolina Holladay x N91-8006 OK926508 Oklahoma Miles x Forrest OK967006 Oklahoma Forrest x R85-3280 P9594 N/A† N/A†
R95-2210 Arkansas Manokin x A6297 R96-1471 Arkansas A5403 x Manokin R96-3444 Arkansas PIO 9592 x KS4895 R96-864 Arkansas A6297 x PIO 9592 S96-2641 Missouri P9591 x S91-1839 S96-2692 Missouri Manokin x S91-1839 S96-3418 Missouri S92-1666 x NKS59-60 S97-1688 Missouri S91-1381 x H5810 TN93-99 Tennessee Hutcheson x (TN85-88 x TN5-85) TN94-213 Tennessee S85-1009 x Hutcheson TN96-58 Tennessee Hutcheson x TN89-39 TN96-64 Tennessee Holladay x Manokin TN96-68 Tennessee Holladay x Manokin V93-3114 Virginia FFR544 x Hutcheson V95-0016 Virginia KS5292 x Accomac V95-0242 Virginia Hutcheson x V85-1195 V95-0391 Virginia V85-1729 x V84-1354W †Information was not available.
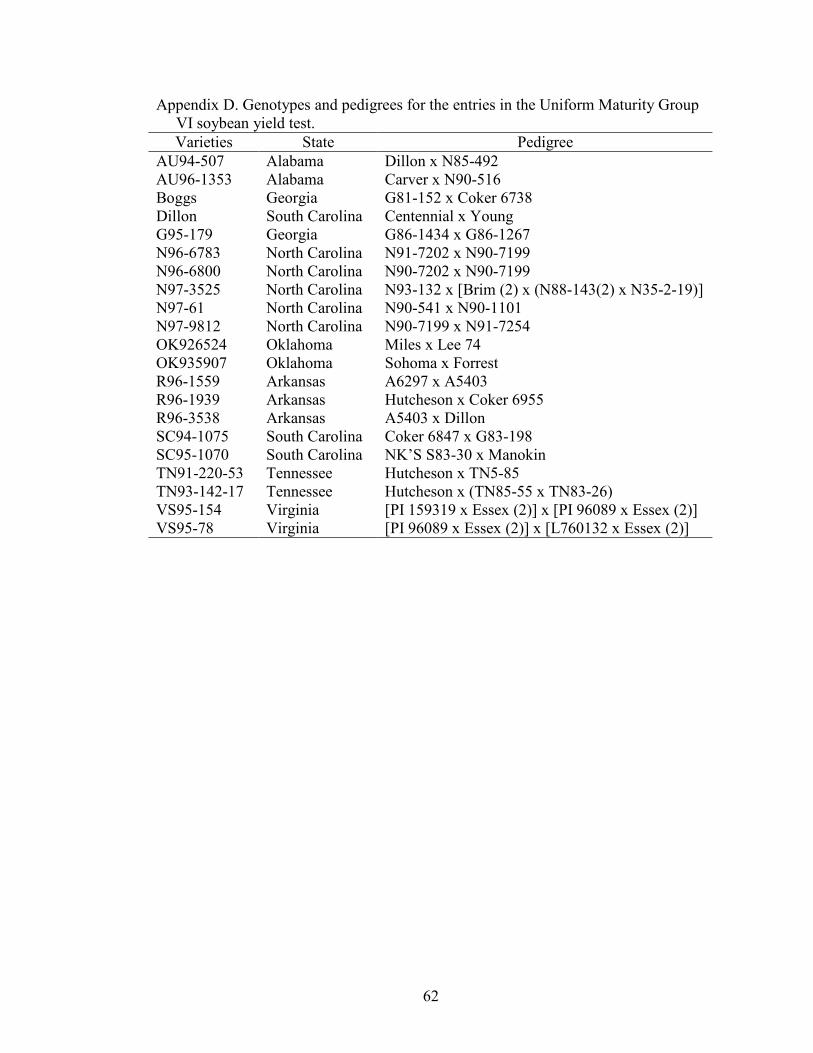
62
Appendix D. Genotypes and pedigrees for the entries in the Uniform Maturity Group VI soybean yield test.
Varieties State Pedigree AU94-507 Alabama Dillon x N85-492 AU96-1353 Alabama Carver x N90-516 Boggs Georgia G81-152 x Coker 6738 Dillon South Carolina Centennial x Young G95-179 Georgia G86-1434 x G86-1267 N96-6783 North Carolina N91-7202 x N90-7199 N96-6800 North Carolina N90-7202 x N90-7199 N97-3525 North Carolina N93-132 x [Brim (2) x (N88-143(2) x N35-2-19)] N97-61 North Carolina N90-541 x N90-1101 N97-9812 North Carolina N90-7199 x N91-7254 OK926524 Oklahoma Miles x Lee 74 OK935907 Oklahoma Sohoma x Forrest R96-1559 Arkansas A6297 x A5403 R96-1939 Arkansas Hutcheson x Coker 6955 R96-3538 Arkansas A5403 x Dillon SC94-1075 South Carolina Coker 6847 x G83-198 SC95-1070 South Carolina NK’S S83-30 x Manokin TN91-220-53 Tennessee Hutcheson x TN5-85 TN93-142-17 Tennessee Hutcheson x (TN85-55 x TN83-26) VS95-154 Virginia [PI 159319 x Essex (2)] x [PI 96089 x Essex (2)] VS95-78 Virginia [PI 96089 x Essex (2)] x [L760132 x Essex (2)]

VITA
Luke Aaron Farno
Candidate for the Degree of
Doctor of Philosophy
Thesis: OIL AND FATTY ACID PROFILE OF SOYBEAN (MATURITY GROUPS IV, V,AND VI)
Major Field: Crop Science Biographical:
Personal Data: Born on September 4, 1973, in Dayton, Ohio, the son of Paul H. and Marsha A. Farno. Married to Sarah A. Farno (Hoppe) on May 31, 2003.
Education: Graduated from National Trail High School, New Paris, Ohio in
June 1992; received Bachelor of Science in Agriculture with Agronomy option and minor in Chemistry from Eastern Kentucky University, Richmond, Kentucky in December of 1996; received Master of Science degree with a major in Crop Science from Oklahoma State University, Stillwater, Oklahoma in May, 1999. Completed the requirements for the Doctor of Philosophy degree with a major in Crop Science at Oklahoma State University in July of 2005.
Experience: Raised on a farm in Eaton, Ohio; employed by Eastern Kentucky
University as an assistant to the Director of the University Farms the fall semester of 1997; attended Oklahoma State University, on a graduate research and teaching assistantship, Oklahoma State University,
Department of Plant and Soil Sciences, 1997 to 2003. Worked as an Assistant Plant Breeder/ Team Leader II for Garst Seed Company at the Marshall Research Station from April 2003 to June 2005
Professional Memberships: Crop Science Society of America
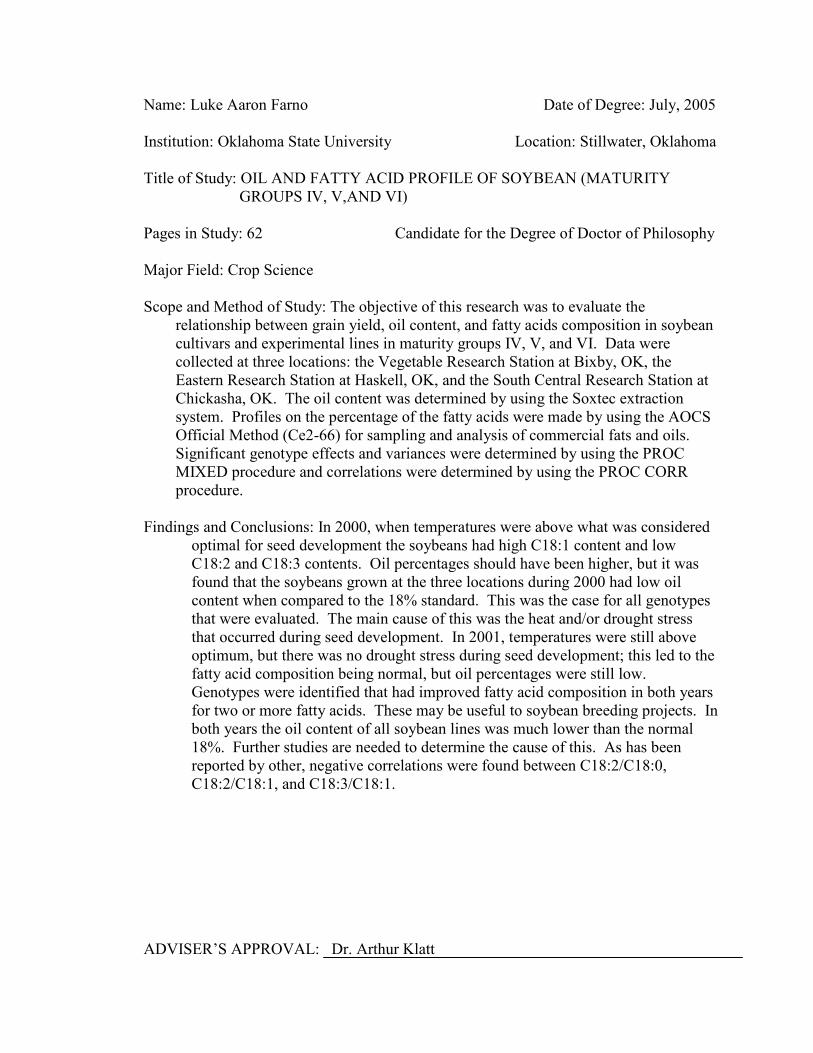
Name: Luke Aaron Farno Date of Degree: July, 2005 Institution: Oklahoma State University Location: Stillwater, Oklahoma Title of Study: OIL AND FATTY ACID PROFILE OF SOYBEAN (MATURITY
GROUPS IV, V,AND VI) Pages in Study: 62 Candidate for the Degree of Doctor of Philosophy
Major Field: Crop Science Scope and Method of Study: The objective of this research was to evaluate the
relationship between grain yield, oil content, and fatty acids composition in soybean cultivars and experimental lines in maturity groups IV, V, and VI. Data were collected at three locations: the Vegetable Research Station at Bixby, OK, the Eastern Research Station at Haskell, OK, and the South Central Research Station at Chickasha, OK. The oil content was determined by using the Soxtec extraction system. Profiles on the percentage of the fatty acids were made by using the AOCS Official Method (Ce2-66) for sampling and analysis of commercial fats and oils. Significant genotype effects and variances were determined by using the PROC MIXED procedure and correlations were determined by using the PROC CORR procedure.
Findings and Conclusions: In 2000, when temperatures were above what was considered optimal for seed development the soybeans had high C18:1 content and low
C18:2 and C18:3 contents. Oil percentages should have been higher, but it was found that the soybeans grown at the three locations during 2000 had low oil content when compared to the 18% standard. This was the case for all genotypes that were evaluated. The main cause of this was the heat and/or drought stress that occurred during seed development. In 2001, temperatures were still above optimum, but there was no drought stress during seed development; this led to the fatty acid composition being normal, but oil percentages were still low. Genotypes were identified that had improved fatty acid composition in both years for two or more fatty acids. These may be useful to soybean breeding projects. In both years the oil content of all soybean lines was much lower than the normal 18%. Further studies are needed to determine the cause of this. As has been reported by other, negative correlations were found between C18:2/C18:0, C18:2/C18:1, and C18:3/C18:1.
ADVISER’S APPROVAL: Dr. Arthur Klatt