Embed Size (px)
Citation preview

IEA 2019. All rights reserved.
Oil 2019 – Analysis and Forecasts to 2024
Neil Atkinson, Olivier Lejeune
Oslo, 26 March 2019
IEA

2IEA 2019. All rights reserved.
Supply

3IEA 2019. All rights reserved.
US expansion is 70% of global growth. Gains in Brazil, Iraq, Norway, the UAE and Guyana.
Main declines in Iran and Venezuela.
US leads the way in global supply growth
Change in total oil supply 2018-24
US
Brazil
Iraq
Norway
UAE
Guyana
Iran
Venezuela
-2
-1
0
1
2
3
4
5
mb
/d
4IEA 2019. All rights reserved.
0.0
2.0
4.0
6.0
8.0
10.0
12.0
2010 2011 2012 2013 2014 2015 2016 2017 2018 2019 2020 2021 2022 2023 2024
mb
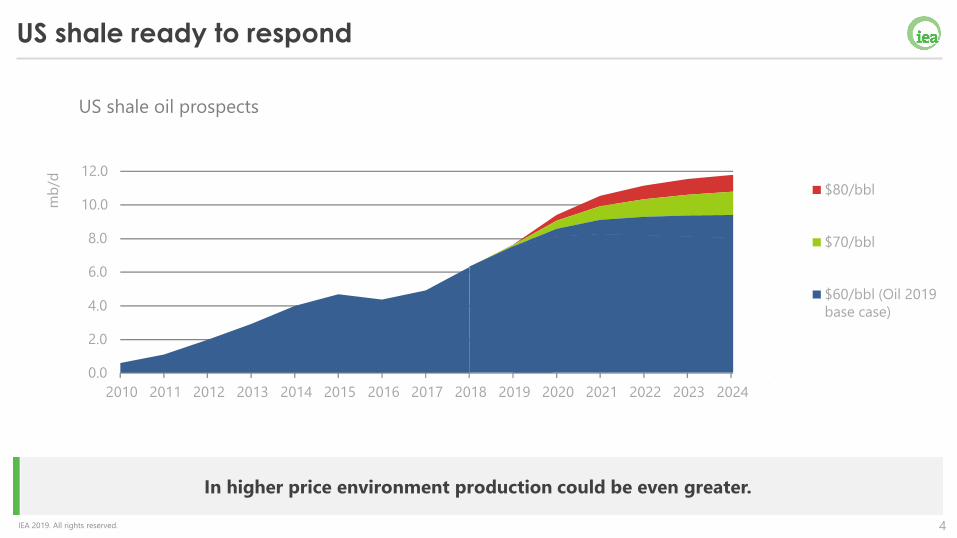
/dUS shale ready to respond
In higher price environment production could be even greater.
$80/bbl
$70/bbl
$60/bbl (Oil 2019
base case)
US shale oil prospects

5IEA 2019. All rights reserved.
US crude export capacity no longer a constraint
Enough pipelines planned to match Saudi exports, even if not all of them will be built.
* Based on pipelines currently under construction or in final development stage.
0,0
2,0
4,0
6,0
8,0
10,0
2018 2019 2020 2021 2022 2023 2024
mb/d WithAdditionalPipelinesProposed
US CrudeExportCapacity
2018 SaudiCrudeExports
2018RussianCrudeExports
6IEA 2019. All rights reserved.
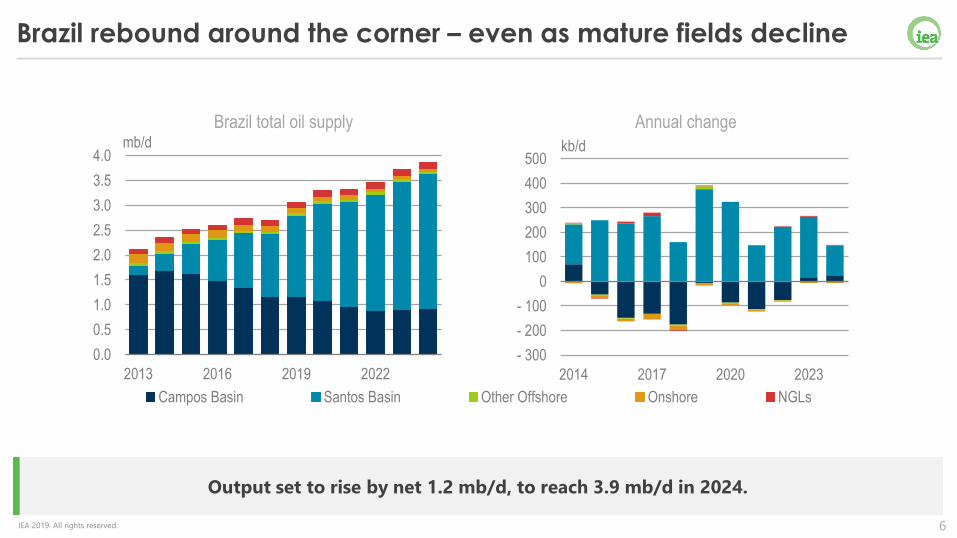
Brazil rebound around the corner – even as mature fields decline
Output set to rise by net 1.2 mb/d, to reach 3.9 mb/d in 2024.
0.0
0.5
1.0
1.5
2.0
2.5
3.0
3.5
4.0
2013 2016 2019 2022
mb/d
Campos Basin Santos Basin Other Offshore Onshore NGLs
- 300
- 200
- 100
0
100
200
300
400
500
2014 2017 2020 2023
kb/d
Brazil total oil supply Annual change
7IEA 2019. All rights reserved.
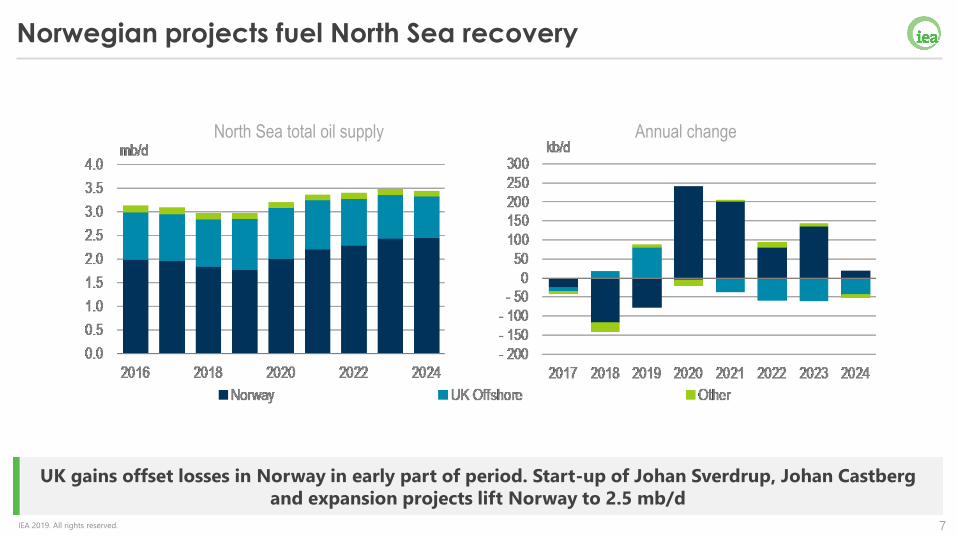
Norwegian projects fuel North Sea recovery
UK gains offset losses in Norway in early part of period. Start-up of Johan Sverdrup, Johan Castberg
and expansion projects lift Norway to 2.5 mb/d
North Sea total oil supply Annual change
8IEA 2019. All rights reserved.
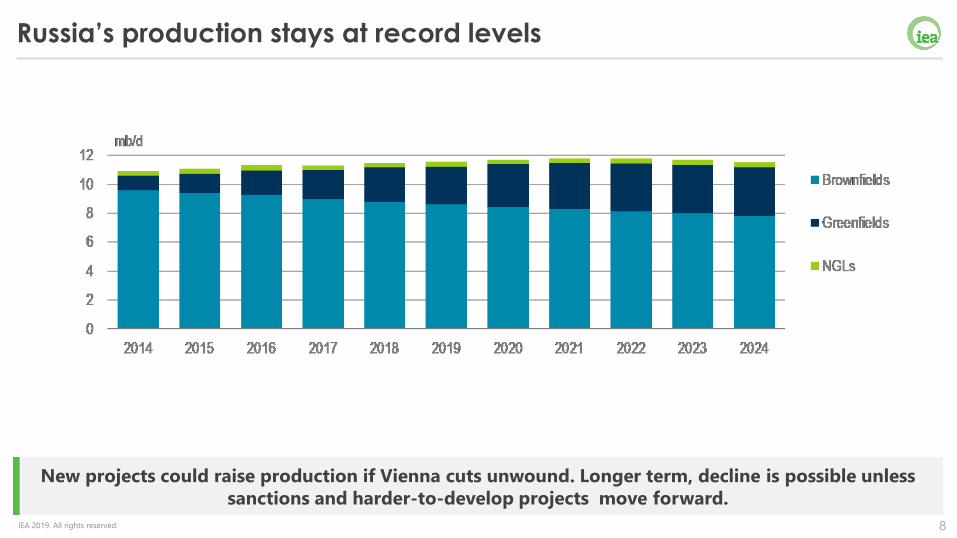
Russia’s production stays at record levels
New projects could raise production if Vienna cuts unwound. Longer term, decline is possible unless
sanctions and harder-to-develop projects move forward.

9IEA 2019. All rights reserved.
Canada’s growth eases back
Infrastructure bottlenecks led to mandatory production cuts in 2019. New projects stall.
Canada total oil supply Annual change
10IEA 2019. All rights reserved.
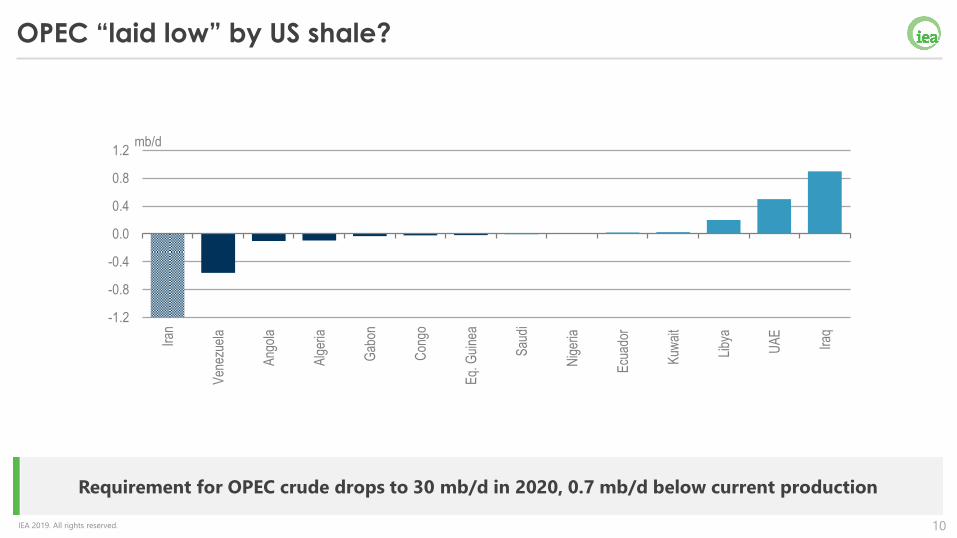
OPEC “laid low” by US shale?
Requirement for OPEC crude drops to 30 mb/d in 2020, 0.7 mb/d below current production
-1.2
-0.8
-0.4
0.0
0.4
0.8
1.2
Iran
Ven
ezue
la
Ang
ola
Alg
eria
Gab
on
Con
go
Eq.
Gui
nea
Sau
di
Nig
eria
Ecu
ador
Kuw
ait
Liby
a
UA
E
Iraq
mb/d

11IEA 2019. All rights reserved.
Demand
12IEA 2019. All rights reserved.
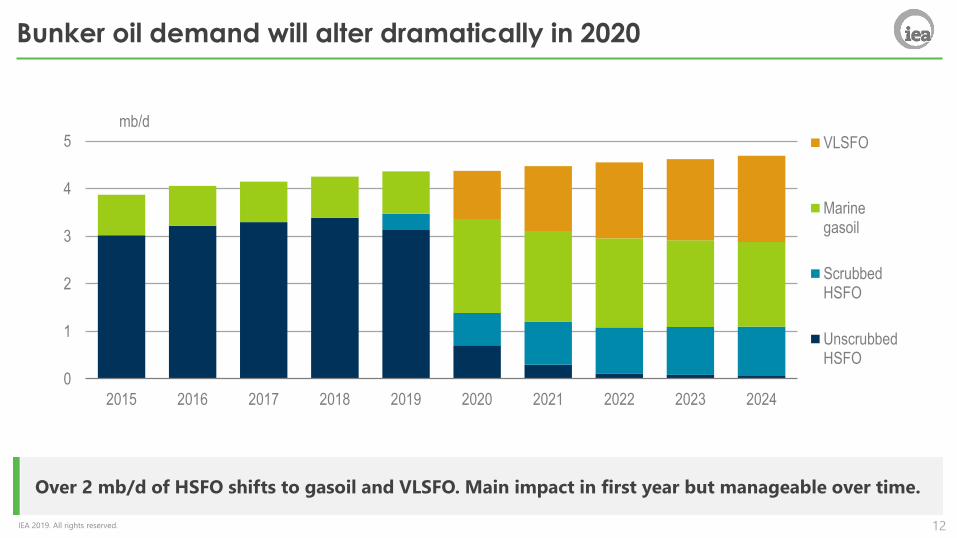
Bunker oil demand will alter dramatically in 2020
Over 2 mb/d of HSFO shifts to gasoil and VLSFO. Main impact in first year but manageable over time.
0
1
2
3
4
5
2015 2016 2017 2018 2019 2020 2021 2022 2023 2024
mb/d
VLSFO
Marinegasoil
ScrubbedHSFO
UnscrubbedHSFO
13IEA 2019. All rights reserved.
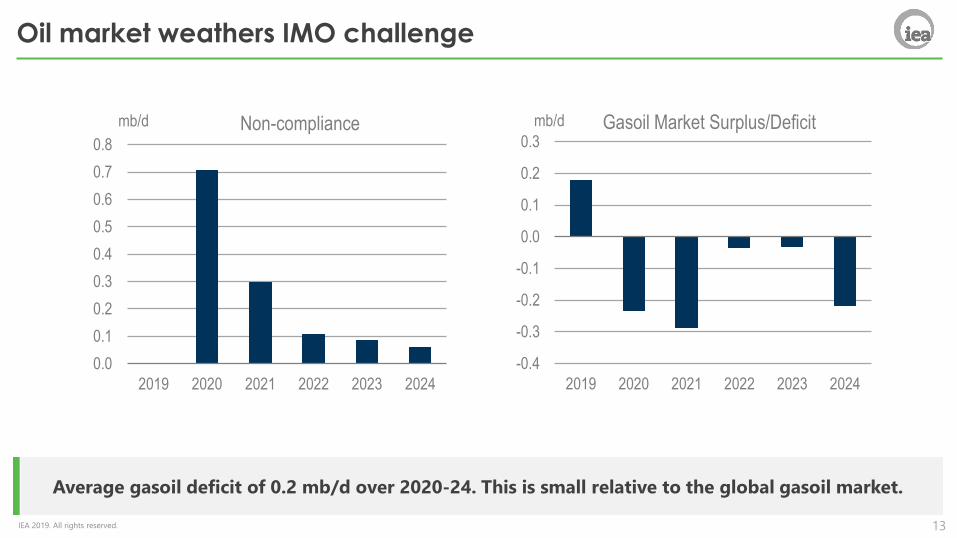
Oil market weathers IMO challenge
Average gasoil deficit of 0.2 mb/d over 2020-24. This is small relative to the global gasoil market.
0.0
0.1
0.2
0.3
0.4
0.5
0.6
0.7
0.8
2019 2020 2021 2022 2023 2024
mb/d Non-compliance
-0.4
-0.3
-0.2
-0.1
0.0
0.1
0.2
0.3
2019 2020 2021 2022 2023 2024
mb/d Gasoil Market Surplus/Deficit

14IEA 2019. All rights reserved.
Scrubber installations rise rapidly in 2019-20
But investments slow markedly in 2021 as gasoil availability rises.
0
1 000
2 000
3 000
4 000
5 000
6 000
2019 2020 2021 2022 2023 2024
Vessels with scrubbers Forecast scrubber installations by vessel category Other
LPG
Cruise
Containerships
BulkCarriers
OilTankers

15IEA 2019. All rights reserved.
Bunker demand growth to slow
Bunker demand falls in 2020 following IMO rule implementation and slows to 1.9% p.a. after
0.0
0.5
1.0
1.5
2.0
2.5
3.0
3.5
4.0
4.5
5.0
2000 2005 2010 2015 2020
mb/d Global bunker fuel demand
OECD Non-OECD Forecast
-10%
-5%
0%
5%
10%
15%
20%
2005 2008 2011 2014 2017 2020 2023
%/year Global bunker fuel demand growth
Historic Forecast

16IEA 2019. All rights reserved.
Marine gasoil takes rising share of global market
Inland gasoil/diesel demand growth slows. Marine sector accounts for 56% of growth in gasoil demand.
0
5
10
15
20
25
30
35
2000 2004 2008 2012 2016 2020 2024
mb/d Global gasoil/diesel demand
Inland gasoil Marine gasoil
-4%
-2%
0%
2%
4%
6%
2004 2008 2012 2016 2020 2024
%/year Inland gasoil/diesel demand growth
Historic Forecast

17IEA 2019. All rights reserved.
Some HSFO finds its way in the power sector
Middle East power sector demand grows, mainly in Saudi Arabia
0
50
100
150
200
250
300
350
400
450
500
2020 2021 2022 2023 2024
kb/d
Saudi Arabia Other Middle east Asia Other
Incremental fuel oil demand (changes vs. 2019)
18IEA 2019. All rights reserved.
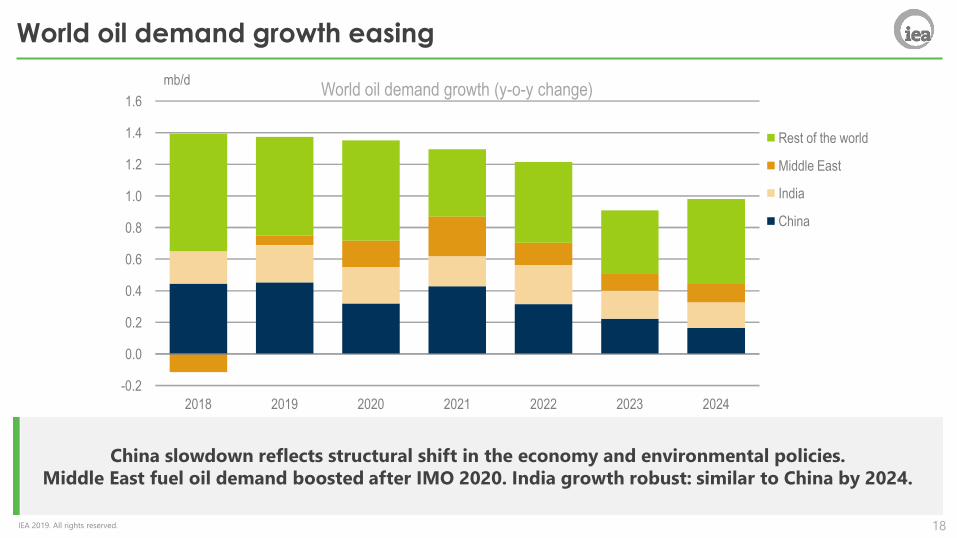
World oil demand growth easing
China slowdown reflects structural shift in the economy and environmental policies.
Middle East fuel oil demand boosted after IMO 2020. India growth robust: similar to China by 2024.
World oil demand growth (y-o-y change)
-0.2
0.0
0.2
0.4
0.6
0.8
1.0
1.2
1.4
1.6
2018 2019 2020 2021 2022 2023 2024
mb/d
Rest of the world
Middle East
India
China
19IEA 2019. All rights reserved.
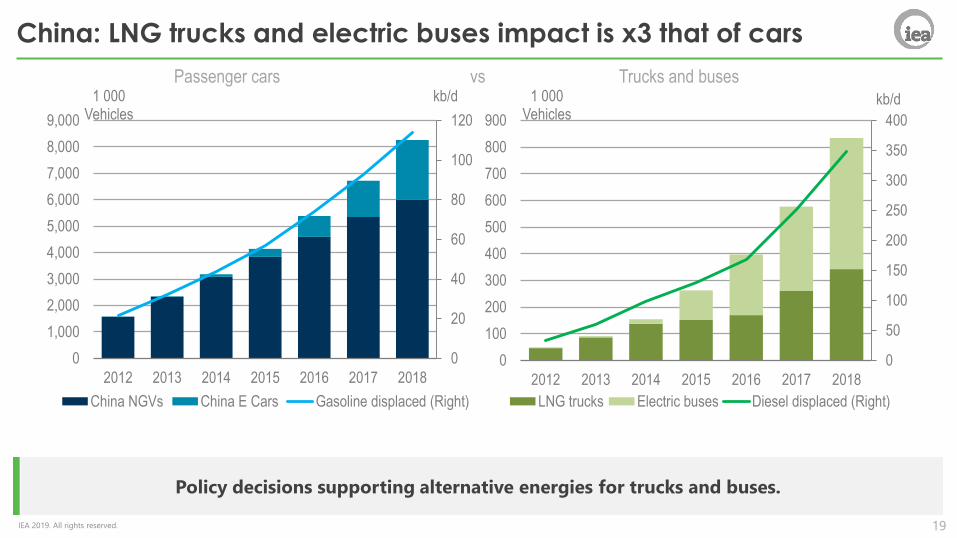
China: LNG trucks and electric buses impact is x3 that of cars
Policy decisions supporting alternative energies for trucks and buses.
0
20
40
60
80
100
120
0
1,000
2,000
3,000
4,000
5,000
6,000
7,000
8,000
9,000
2012 2013 2014 2015 2016 2017 2018
kb/d1 000 Vehicles
China NGVs China E Cars Gasoline displaced (Right)
0
50
100
150
200
250
300
350
400
0
100
200
300
400
500
600
700
800
900
2012 2013 2014 2015 2016 2017 2018
kb/d1 000 Vehicles
LNG trucks Electric buses Diesel displaced (Right)
Passenger cars vs Trucks and buses
20IEA 2019. All rights reserved.
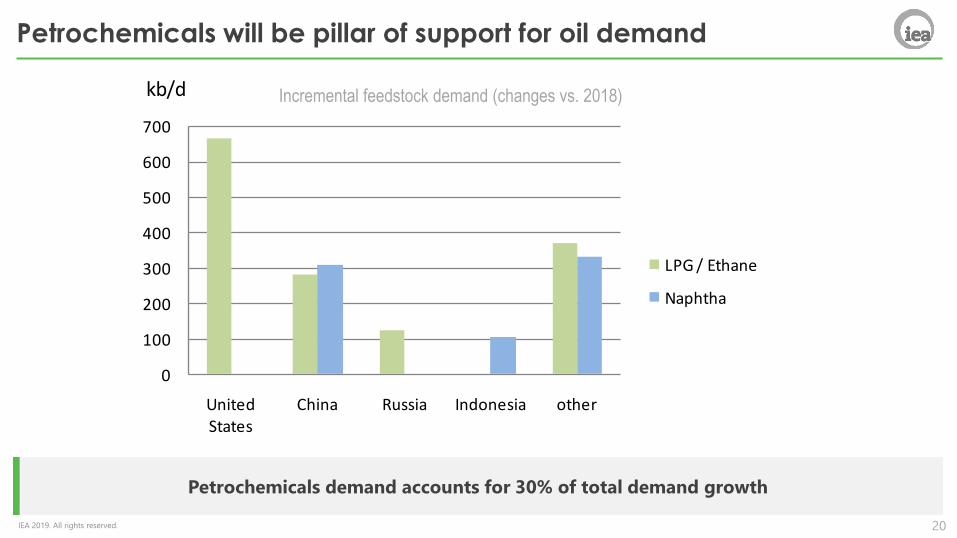
Petrochemicals will be pillar of support for oil demand
Petrochemicals demand accounts for 30% of total demand growth
0
100
200
300
400
500
600
700
United States
China Russia Indonesia other
kb/d
LPG / Ethane
Naphtha
Incremental feedstock demand (changes vs. 2018)
21IEA 2019. All rights reserved.
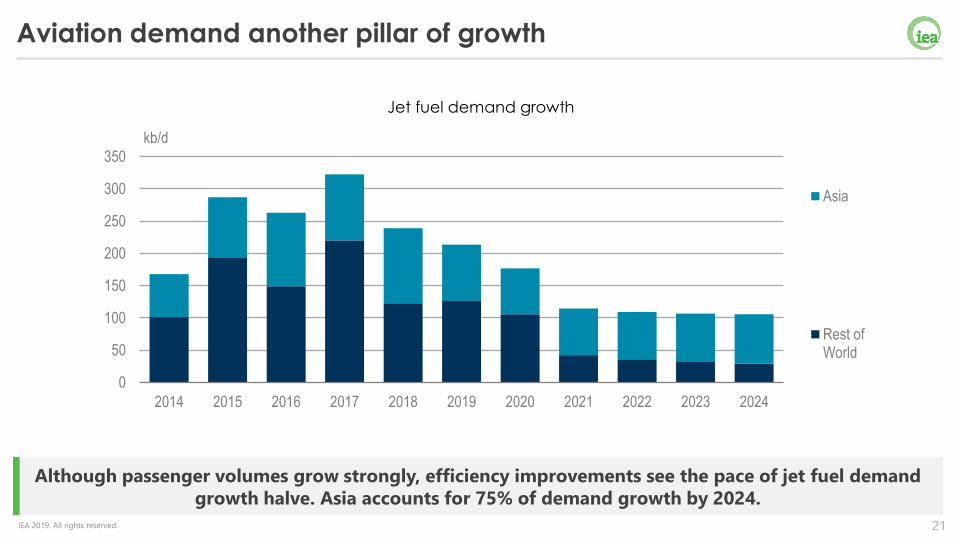
Although passenger volumes grow strongly, efficiency improvements see the pace of jet fuel demand
growth halve. Asia accounts for 75% of demand growth by 2024.
Jet fuel demand growth
0
50
100
150
200
250
300
350
2014 2015 2016 2017 2018 2019 2020 2021 2022 2023 2024
kb/d
Asia
Rest ofWorld
Aviation demand another pillar of growth

22IEA 2019. All rights reserved.
Refining & Trade

23IEA 2019. All rights reserved.
Downstream capacity additions challenge refiners
Global capacity growth to 2024 far exceeds refined products demand growth.
China
Other Asia
Middle East
Other
0
2
4
6
8
10
Capacity additions Demand growth Implied excess
capacity
Capacity closures
in 2013-18
mb/d
Demand for
refined products
24IEA 2019. All rights reserved.
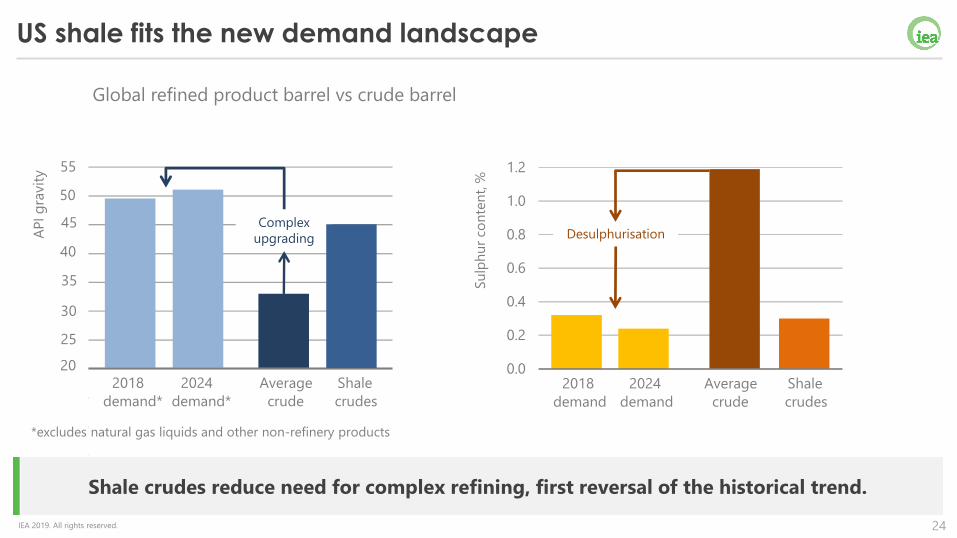
Shale crudes reduce need for complex refining, first reversal of the historical trend.
US shale fits the new demand landscape
0.0
0.2
0.4
0.6
0.8
1.0
1.2
2018
demand
2024
demand
Average
crude
Shale
crudes
Su
lph
ur
con
ten
t, %
20
25
30
35
40
45
50
55
2024
demand*
Average
crude
Shale
crudes
AP
Ig
ravit
y
2018
demand*
Complex
upgrading Desulphurisation
*excludes natural gas liquids and other non-refinery products
Global refined product barrel vs crude barrel

25IEA 2019. All rights reserved.
US gross exports overtake Russia, close in on Saudi Arabia
US is net oil exporter in 2021 after 75 years of import dependency. US exports add to market flexibility.
-8
-6
-4
-2
0
2
4
6
8
10
2012 2014 2016 2018 2020 2022 2024
mb/d US net oil balance
Saudi gross exports
Russia gross exports
US gross exports
US net seaborne trade
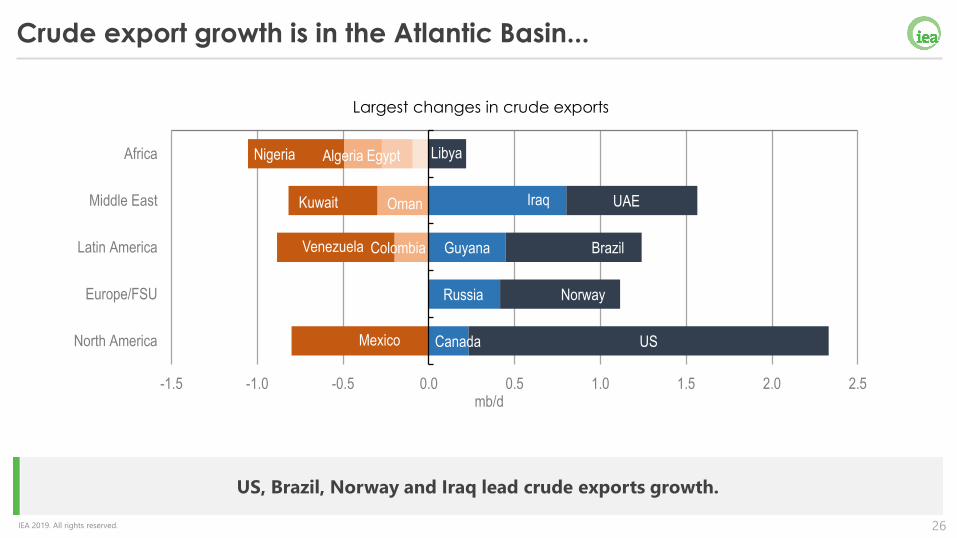
26IEA 2019. All rights reserved.
US, Brazil, Norway and Iraq lead crude exports growth.
Crude export growth is in the Atlantic Basin...
Algeria
Oman
Nigeria
Kuwait
Venezuela
Mexico
Egypt
UAE
Colombia
Russia
Canada
Guyana
Libya
Iraq
Brazil
Norway
US
-1.5 -1.0 -0.5 0.0 0.5 1.0 1.5 2.0 2.5
Africa
Middle East
Latin America
Europe/FSU
North America
mb/d
Largest changes in crude exports
27IEA 2019. All rights reserved.
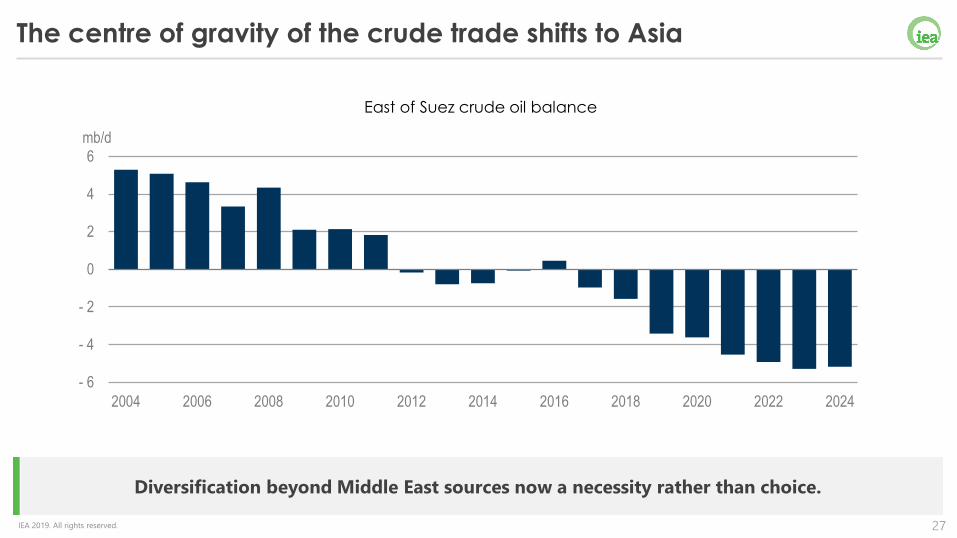
Diversification beyond Middle East sources now a necessity rather than choice.
The centre of gravity of the crude trade shifts to Asia
- 6
- 4
- 2
0
2
4
6
2004 2006 2008 2010 2012 2014 2016 2018 2020 2022 2024
mb/d
East of Suez crude oil balance
28IEA 2019. All rights reserved.
Conclusions
• The United States to provide 70% of the increase in global oil supply over next five years, with Iraq, Brazil, Norway & Guyana other major contributors
• Global oil demand growth to slow modestly, but still average 1.2 mb/d, with petrochemicals a key driver
• While there may be teething problems, refiners & shippers are relatively well
prepared to implement the new IMO bunker fuel regulations
• The 2nd wave of the US shale revolution is coming – it will shake-up international oil & gas trade flows, with profound implications for the geopolitics of energy
• Up to and beyond 2024: oil industry must do more to cut its carbon footprint, e.g. flaring & methane leakages, and use of CCUS, EOR, hydrogen & renewables.

29IEA 2019. All rights reserved.
www.iea.orgIEA