Embed Size (px)
Citation preview

1
2020 Report of Deaths and Injuries Involving Off-Highway Vehicles with More than Two Wheels
December 2020 John Topping, M.S. Directorate for Epidemiology Division of Hazard Analysis U.S. Consumer Product Safety Commission 4330 East West Highway Bethesda, MD 20814

Executive Summary
Off-Highway-Vehicle-Related Fatalities Reported • As of September 2020, the year 2017 is the most recent year of reporting for fatalities that CPSC considers
complete. CPSC staff is aware of 2,258 deaths associated with Off-Highway Vehicles (OHVs) that resulted from 2,210 incidents during the 3-year period from 2015 through 2017.
• Of the OHVs involved in those 2,258 reported deaths, CPSC staff classifies 1,697 as All-Terrain Vehicles
(ATVs), 445 as Recreational Off-highway Vehicles (ROVs), and 47 as Utility Terrain Vehicles (UTVs). For the remaining 69 deaths, CPSC staff does not know the vehicle classification, but it concludes that the vehicle is either an ROV or UTV.
• CPSC staff divided these 2,258 reported deaths across various age groups: under 16 years (16%), 16-24
(15%), 25-34 (15%), 35-44 (11%) 45-54 (16%) and 55+ (27%). Children under 12 (8%) represent about half (48%) of the fatalities among the under-16 age group.
• CPSC staff observed that OHV overturns and/or collisions (e.g., with other vehicles or stationary
objects, such as trees) were the most common fatality hazards.
Off-Highway-Vehicle-Related Emergency Department-Treated Injury Estimates
• Over the full 5-year period from 2015 through 2019, CPSC staff estimates that there were 524,600 emergency department-treated injuries in the United States associated with OHVs (ATVs, ROVs, and/or UTVs). This corresponds to an annual average of 104,900 emergency department-treated injuries over the period.
• Although these estimates generally decreased--from 110,000 in 2015 to 96,000 in 2019--CPSC staff did not find most year-over-year changes to be statistically significant.
• CPSC staff divided injuries during the 2015 through 2019 period across various age groups: under 16 years
(27%), 16-24 (24%), 25-34 (20%), 35-44 (13%) 45-54 (9%) and 55+ (8%). This distribution of estimated injuries appears to be more heavily weighted towards younger ages than the distribution of reported fatalities.
• Of the 2015-2019 estimated OHV-related emergency department-treated injuries for all ages, CPSC staff
found that:
• Most were treated and released (84%) or hospitalized (15%).
• The most common diagnoses were fractures (28%) and contusions/abrasions (21%).
• The affected body parts were primarily: the arm (shoulders to fingertips, 29%), the head or neck (29%), the leg (21%), and the torso (20%).
• Sex was more frequently identified as male (69%) than female (31%).

Table of Contents Executive Summary................................................................................................................................................. 2 Table of Contents .................................................................................................................................................... 3 Introduction ............................................................................................................................................................. 4 Off-Highway Vehicle Fatalities .............................................................................................................................. 5
Reported Deaths .................................................................................................................................................. 5 Table 1: Reported Fatal Incidents Associated with OHVs by Vehicle Classification and Incident Year .. 5 Table 2: Multiple Fatality Reported Incidents by Vehicle Classification and Incident Year ..................... 6 Table 3: Reported Deaths by Vehicle Classification and Incident Year .................................................... 6 Figure 1 (Histogram): Reported Deaths by Vehicle Classification and Year ............................................ 6
Reported Deaths by Incident State ...................................................................................................................... 7 Figure 2 (Map): Number of Reported Fatal Incidents by State. ................................................................. 7 Table 4: Reported Fatal Incidents and Deaths by Incident State ............................................................... 8
Reported Deaths of Children Compared with All Ages ...................................................................................... 9 Table 5: Reported Fatalities and Percentages for Children under 16 and 12 ............................................. 9 Figure 3 (Histogram): Reported Fatalities for Ages Under 12, 12-15, 16+, and Age Unknown ............... 9
Reported Deaths of Various Age Groups .......................................................................................................... 10 Table 6: Reported Fatalities by Age Groups ...................................................................................... 10 Figure 4 (Histogram): Percent Distribution of Age Groups ..................................................................... 10
Observed OHV Hazard Patterns from These Data and Other Studies .............................................................. 11 Off-Highway Vehicle-Related Emergency Department-Treated Injuries ............................................................. 12 Table 7: Estimates of OHV-Related Emergency-Treated Injuries by Product Codes ............................. 12 Table 8: Annual Estimates for All Ages, Children Under 16 and Under 12 Years of Age ................... 13 Table 9: Annual Estimates by Age Group ............................................................................................... 13 Figure 5 (Plot): Annual Injury Rate Estimates per 100,000 Population by Age Group ........................... 14 Figure 6 (Histograms): Injury Estimates for All Ages by Disposition, Diagnosis, and Body Part .......... 15 Discussion ............................................................................................................................................................. 16 Appendix A: Estimation Methodologies ............................................................................................................... 18
OHV-Related Deaths ........................................................................................................................................ 18 In-Scope OHV-Related Fatalities................................................................................................................... 18 OHV-Related Injuries ....................................................................................................................................... 18
Estimation of Emergency Department-Treated Injuries Associated with OHVs ............................................ 18 Coefficients of Variation ................................................................................................................................ 19
References ............................................................................................................................................................. 20

Introduction This report presents the information collected by U.S. Consumer Product Safety Commission (CPSC) staff on deaths and injuries related to the use of various off-highway vehicles (OHVs) with more than two wheels. These OHVs correlate with one of three vehicle classifications: “All-terrain Vehicles” (ATVs), “Recreational Off-Highway Vehicles” (ROVs), and “Utility Terrain Vehicles” (UTVs). Below, we describe these classifications in additional detail. For this report, CPSC staff defines an “ATV” as an off-road, motorized vehicle having three, four, or more low-pressure tires, a straddle seat for the operator, and handlebars for steering control. ROVs and UTVs have many features in common, such as four or more tires designed for off-road vehicles. However, ROVs and UTVs have many features that distinguish them from ATVs, such as non-straddle or “side-by-side” seating, automotive-type controls for steering, throttle, and braking (e.g., steering wheel and pedals).1 For this report, CPSC staff defines “ROVs” as motorized vehicles designed for off-highway use with the following features: four or more pneumatic tires designed for off-highway use; bench or bucket seats for two or more occupants; automotive-type controls for steering, throttle, and braking; and a maximum vehicle speed greater than 30 miles per hour (mph). ROVs are also equipped with rollover protective structures (ROPS), seat belts, and other restraints (such as doors, nets, and shoulder barriers) for the protection of occupants. (ROV NPR, 79 Fed. Reg. 68,964 November 19, 2014). In this report, CPSC staff defines “UTVs” as motorized vehicles designed for off-highway use with the following features: four or more pneumatic tires designed for off-highway use; bench or bucket seats for two or more occupants; automotive-type controls for steering, throttle, and braking; and a maximum speed of 25 mph or less. UTVs are generally equipped with larger cargo beds and may be equipped with ROPS, seat belts, and other restraints. In the late 1980s, the major ATV distributors agreed to stop distributing three-wheel ATVs (U.S. CPSC, 2006). A very small proportion of ATVs, ROVs, and UTVs are sold with more than four wheels (5 or 6), and have never held more than a very small market share. As such, nearly all ATVs, ROVs, and UTVs in use today are four-wheeled vehicles. This report does not address every vehicle with off-road capability. The report excludes,2 for example, dune buggies, sand rails, and golf carts, as well as licensed motor vehicles, such as “sport utility vehicles” (SUVs) and jeeps. Similarly, this report excludes two-wheeled off-highway vehicles (e.g., dirt bikes and/or off-road-capable motorcycles). This report includes information related to deaths involving ATVs, ROVs, and UTVs in incidents from 2015 through 2017, based on data available to CPSC staff as of September, 2020. This report also presents the national estimates of hospital emergency department-treated injuries related to ATVs, ROVs, and UTVs from January 1, 2015, through December 31, 2019.
1 Definition from ANSI/ROHVA 1 American National Standard for Recreational Off-Highway Vehicles. 2 However, incidents involving collision or other interaction with an ATV, ROV, or UTV, are included, regardless of the type of the other vehicle.

Off-Highway Vehicle Fatalities3 This section details the OHV deaths from incidents during the years 2015 through 2017. The data are based on fatalities reported through the Consumer Product Safety Risk Management System (CPSRMS), as well as the National Electronic Injury Surveillance System (NEISS). Data in CPSRMS are anecdotal, and collection of the data is ongoing. Among the various types of reports included in CPSRMS are death certificates from the 50 states and the territories. Due to a lag in time that exists between when a fatality occurs and when it gets reported to CPSC, staff considers the latest 3 years of data, 2018 through 2020, to be incomplete. As such, this report includes deaths from 2015 through 2017.
Reported Deaths
As of September 10, 2020, CPSC staff received reports of 2,210 fatal off-highway vehicle incidents during the 3-year period from 2015 through 2017, which resulted in a total of 2,258 deaths. Due to delayed onset of death, the year of incident may precede the ultimate year of death. Due to multiple-fatality incidents, the total number of fatal incidents is not the same as the total number of deaths. Table 1 presents the count of reported fatal incidents by year and off-highway vehicle classification.
Table 1 Reported Fatal Incidents Associated with Off-Highway Vehicles
By Vehicle Classification and Incident Year, 2015-2017
Vehicle Classification
Number of Fatal Incidents Per Year
Total Incidents 2015 2016 2017
ATV 585 565 521 1,671 ROV 115 141 168 424
UTV 16 15 15 46 Unknown
(ROV or UTV) 19 18 32 69
Total 735 739 736 2,210 Sources: CPSRMS, ATV Deaths Database (ATVD), and other CPSC staff analyses. One incident may result in deaths of multiple persons. Such is the case for at least 46 of the fatal incidents (2% of 2,210), of which 44 are double fatalities (2 deaths per incident), and two are triple fatalities (3 deaths per incident). Table 2 presents these 46 multiple fatality incidents by number of deceased persons per incident and the type of off-highway vehicle.
3 Staff includes reported incidents involving a collision of an ATV, ROV, and/or UTV in this report, even if the occupants of those vehicle types survived, so long as some person, such as a pedestrian bystander or an occupant of another type of vehicle (e.g., bicycle, dirt bike), suffered fatal injury. Eight single-fatality incidents reported collision of both an ATV and ROV, but staff allocated these incidents only to the classification corresponding to the type of vehicle occupied by the deceased (3 ROV, 5 ATV), to ensure mutual exclusivity and correct incident totals. Staff classified fatalities reported as an “ATV,” absent further information collection, as ATVs, although staff is aware this descriptor is not always accurate as reported in death certificates and other sources. Therefore, some of the “ATV” fatalities classified in this report may have involved other types of off-highway vehicles. Most of the incidents classified specifically as an “ROV” or a “UTV” were so classified with the benefit an in-depth investigation and review in collaboration with CPSC engineering staff. Some combination of information collected, such as VIN, make, and/or model, photographs, and/or other descriptions supported each such determination.

Table 2 Multiple Fatality Reported Incidents Associated with Off-Highway Vehicles By Vehicle Classification and Number of Deaths per Incident, 2015-2017
Incident Count
Vehicle Classification
Number of Deceased Persons Per Incident Total Multiple Fatality
Incidents Two (Double Fatality) Three (Triple Fatality)
ATV 26 26 ROV 17 2 19
UTV 1 1 Total 44 2 46
Sources: CPSRMS, ATVD, and other CPSC staff analyses. Accounting for these multiple fatality incidents, Table 3 and Figure 1 present the resulting number of deaths by vehicle classification and incident year.
Table 3 Reported Deaths Associated with Off-Highway Vehicles By Vehicle Classification and Incident Year, 2015-2017
Vehicle Classification
Number of Deaths Per Incident Year Total Deaths 2015 2016 2017
ATV 592 575 530 1,697 ROV 119 154 172 445
UTV 16 16 15 47 Unknown
(ROV or UTV) 19 18 32 69
Total 746 763 749 2,258 Sources: CPSRMS, ATVD, and other CPSC staff analyses.
Sources: CPSRMS, ATVD, and other CPSC staff analyses.
530
575
592
172
154
119
0 100 200 300 400 500 600 700 800
2017
2016
2015
Year
Figure 1: Reported OHV Deaths by Vehicle Classification and Incident Year (2015-2017)
ATV
ROV
UTV
Unknown(ROV or UTV)

Reported Deaths by Incident State
Table 4 (on next page) lists the number of fatal incidents and deaths due to off-highway vehicle incidents in each state and the percentage that each state represents in relation to all deaths resulting from incidents in the 3-year period (2015-2017).4 States are listed in descending order of the number of reported deaths. The following states had the highest reported deaths associated with incidents occurring in this period: Texas (161), West Virginia (116), Kentucky (106), Pennsylvania (106), and California (103). Together, these five states accounted for 592 deaths from 579 fatal incidents, or 26 percent of the total 2,258 deaths from the 2,210 reported incidents. When reviewing state-level fatal incident and death counts for the period 2015 through 2017, staff notes:
• Consistent with CPSC staff’s previous annual reports on ATV-related deaths and injuries, the counts shown in Table 2 have not been adjusted for demographic characteristics (e.g., total population, age structure of population).
• Unlike previous CPSC staff reports on ATVs, these counts reflect the state and year in which the incident
occurred, rather than the state and year in which the deaths occurred.
Figure 2 (below) represents the first and second columns of Table 4 (on next page). As the legend shows, the darker-shaded states had more reported fatal incidents related to OHVs between 2015 through 2017, than states displayed in lighter shades.
Figure 2: Number of Reported Fatal Incidents Related to OHVs by State (2015–2017)
Sources: CPSRMS, ATVD, and other CPSC staff analyses.
4 No fatal incidents in the District of Columbia, Puerto Rico, or other U.S. territories were reported for the period, so these locations are not included in Figure 2 or Table 4

Table 4 Reported Fatal Incidents and Deaths Related to OHVs by Incident State
For the Incident Period January 1, 2015 through December 31, 2017
State
Reported Fatal Incidents
2015–2017
Reported Deaths from Incidents
2015–2017
Percent of All Reported Deaths from Incidents
2015-2017
TEXAS 160 161 7.1% WISCONSIN 114 116 5.1% KENTUCKY 102 106 4.7% PENNSYLVANIA 102 106 4.7% CALIFORNIA 100 102 4.5% FLORIDA 73 75 3.3% NORTH CAROLINA 67 68 3.0% WEST VIRGINIA 65 66 2.9% OHIO 64 65 2.9% NEW YORK 63 64 2.8% MISSOURI 63 63 2.8% MICHIGAN 61 62 2.7% ALABAMA 58 62 2.7% LOUISIANNA 60 61 2.7% OKLAHOMA 58 58 2.6% MISSISSIPPI 55 55 2.4% VIRGINIA 55 55 2.4% INDIANA 52 54 2.4% TENNESSEE 52 53 2.3% IDAHO 49 51 2.3% COLORADO 49 50 2.2% ILLINOIS 48 49 2.2% MINNESOTA 45 47 2.1% SOUTH CAROLINA 45 45 2.0% ARIZONA 41 43 1.9% OREGON 39 39 1.7% WASHINGTON 35 37 1.6% MONTANA 36 36 1.6% NEVADA 34 35 1.6% IOWA 33 33 1.5% GEORGIA 29 30 1.3% ALASKA 27 28 1.2% NEW MEXICO 27 28 1.2% MARYLAND 24 26 1.2% ARKANSAS 25 25 1.1% KANSAS 25 25 1.1% NEBRASKA 25 25 1.1% SOUTH DAKOTA 24 24 1.1% WYOMING 21 22 1.0% UTAH 20 21 0.9% MAINE 17 17 0.8% NORTH DAKOTA 16 17 0.8% VERMONT 16 16 0.7% MASSACHUSETTS 12 12 0.5% NEW JERSEY 10 11 0.5% CONNECTICUT 7 7 0.3% NEW HAMPSHIRE 5 5 0.2% DELAWARE 1 1 <0.1% HAWAII 1 1 <0.1% RHODE ISLAND 0 0 <0.1% Note: State rankings are based on total reported deaths resulting from ATV, ROV, and/or UTV incidents in this period. Sources: CPSRMS, ATVD, and other CPSC staff analyses.

Reported Deaths of Children Compared with All Ages A review of the reported OHV-related fatalities indicates that 353 decedents in the timeframe (16% of the 2,258 total), were younger than 16 years of age, and 171 (8%) were younger than 12 years of age. Forty-eight percent of the child fatalities (i.e., children under 16 years of age) were children younger than 12 years of age. Table 5 shows the total number of reported fatalities, by year, among children younger than 16 years; the corresponding percentage of the total number of reported fatalities for the year; the total numbers of fatalities by year for children younger than 12 years of age; and the corresponding percentage for all ATV-related fatalities of children younger than 16 years of age.
Table 5 Reported OHV-Related Fatalities and Percentages for Children Under 16 and 12 Years of Age
For the Incident Period from January 1, 2015 through December 31, 2017 All Ages Under 16 Years of Age Under 12 Years of Age
Year Deaths Deaths Percent of All Ages Deaths Percent of
All Ages
Percent of Children Under 16
2015 746 128 17% 69 9% 54% 2016 763 110 14% 51 7% 46% 2017 749 115 15% 51 7% 44% Total 2,258 353 16% 171 8% 48%
Sources: CPSRMS, ATVD, and other CPSC staff analyses. Figure 3 shows the corresponding total number of reported fatalities, by year, split into mutually exclusive age groups of children younger than 12 years, children 12-15 years, persons age 16 and over, and decedents of unknown age.
Sources: CPSRMS, ATVD, and other CPSC staff analyses.
51
51
69
64
59
59
632
651
617
0 100 200 300 400 500 600 700 800
2017
2016
2015
Reported Deaths
Year
Figure 3: Reported OHV-Related Fatalities by Yearfor Ages Under 12, 12-15, 16+, and Unknown (2015-2017)
Ages Under 12 Ages 12-15 Ages 16+ Unknown Age

Reported Deaths of Various Age Groups Table 6 presents the distribution of fatalities by year, and by various age groups over the period. Figure 4 presents the percent distributions of age groups during the 3-year period among both the resident U.S. population and reported OHV fatalities. Table 2
Reported OHV-Related Fatalities by Age Groups For the Incident Period from January 1, 2015 through December 31, 2017
All Ages
Age Group (in years of age) Year Under 12 12-15 16–24 25–34 35–44 45–54 55 + Unknown 2015 746 69 59 112 105 83 133 184 1 2016 763 51 59 107 118 89 124 213 2 2017 749 51 64 123 107 85 100 217 2 Total 2,258 171 182 342 330 257 357 614 5
Sources: CPSRMS, ATVD, and other CPSC staff analyses.
Sources: U.S. Census Bureau, CPSRMS, ATVD, and CPSC staff analyses Comparing age group distributions for reported OHV fatalities against population, the largest imbalances are observed among child age groups. Within this period, disproportionately fewer fatalities are reported among children in the younger age group (ages under 12) when compared to their population representation. In contrast, disproportionately higher fatalities are reported in the older child age group (ages 12 to 15) when compared to their population representation. The 16-24 and 45-54 age groups are also observed to be reported in a greater proportion of OHV fatalities than their representation among the population. Staff does not know whether this merely corresponds to differences in OHV usage or other factors for the various age groups.
0%
5%
10%
15%
20%
25%
30%
Under 12 12–15 16–24 25–34 35–44 45–54 55 +Age Group
Figure 4: Percent Distribution of Age GroupsComparing Resident U.S. Population and Reported OHV Decedents (2015-2017)
Percent of Resident U.S. Population Percent of Reported OHV Deaths for All Ages

Observed OHV Hazard Patterns from These Data and Other Studies
Overturning is a common hazard for all types of OHVs. An overturning vehicle report may indicate the vehicle overturning forward, backward, sideways (rollover), or in an unknown direction. Forward and backward overturns often occur while descending or ascending steep terrain. On flat terrain, when an OHV operator attempts to make a sharp turn, the OHV may roll over due to factors such as high rate of speed, change in the terrain surface type (e.g., from gravel to sand), and/or improper loading. Rollovers may also occur due to slanted or uneven terrain. Rollovers are especially consequential with regard to ROVs. Based on 801 investigations of ROV fatal incidents,5 staff determined more than two-thirds involved rollover of the ROV. About one-fifth of ROV fatalities in the same investigated sample involved an attempt on level terrain to make a turn prior to rollover. Staff’s review of historical ATV data6 found the involved ATV overturns in at least 65 percent of fatal incidents, but this includes incidents with other events (such as collisions) that may have preceded the overturning of the ATV. Staff’s review finds overturn as the primary hazard in about 38 percent of ATV fatalities. Collisions (with other vehicles, stationary objects, such as trees, people, or animals) are also a frequent hazard among all OHV fatalities. Collisions are particularly common among ATV fatalities. Staff’s review of ATV data finds collisions to be the primary hazard in about 37 percent of fatalities before including collision that may result as a consequence of other hazards. A majority of these ATV collisions (at least 61%) are with a stationary object, such as trees, guard rails, and mailboxes. Staff found that many collisions (over 30%) occur with other vehicles. Less frequently collisions involve the ATV striking animals (4%) or pedestrian bystanders (less than 1%). Collisions similarly contribute to UTV fatalities. For ROVs, staff noted collisions (of any type) in about 16 percent of the sample of 801 investigated fatalities. Staff notes that hazards are not mutually exclusive; OHV fatality reports describe scenarios of overturning and collision, or other combinations of hazards in the same report. Staff less frequently observes fatality hazards, such as: drowning from falling into a body of water, fire (typically an ROV), or falling or being ejected without substantial preceding events (e.g., collision or overturn). OHV occupant ejection ultimately occurs in the majority of fatalities. For ROVs, staff assessment of the 801 IDIs found that more than 80 percent decedents were ultimately ejected (whether fully or partially) from the ROV. For ATVs that have no seat belts or other restraints, fatally injured persons do not commonly remain seated on the ATV after the injury incident.
5 CPSC staff analyses conducted in support of ROV Termination Package and Congressional Report, June, 2020. 6 Based on analysis of All-Terrain Vehicle Death database deaths for the years 2010 through 2013, because every death in these years has a primary hazard code.
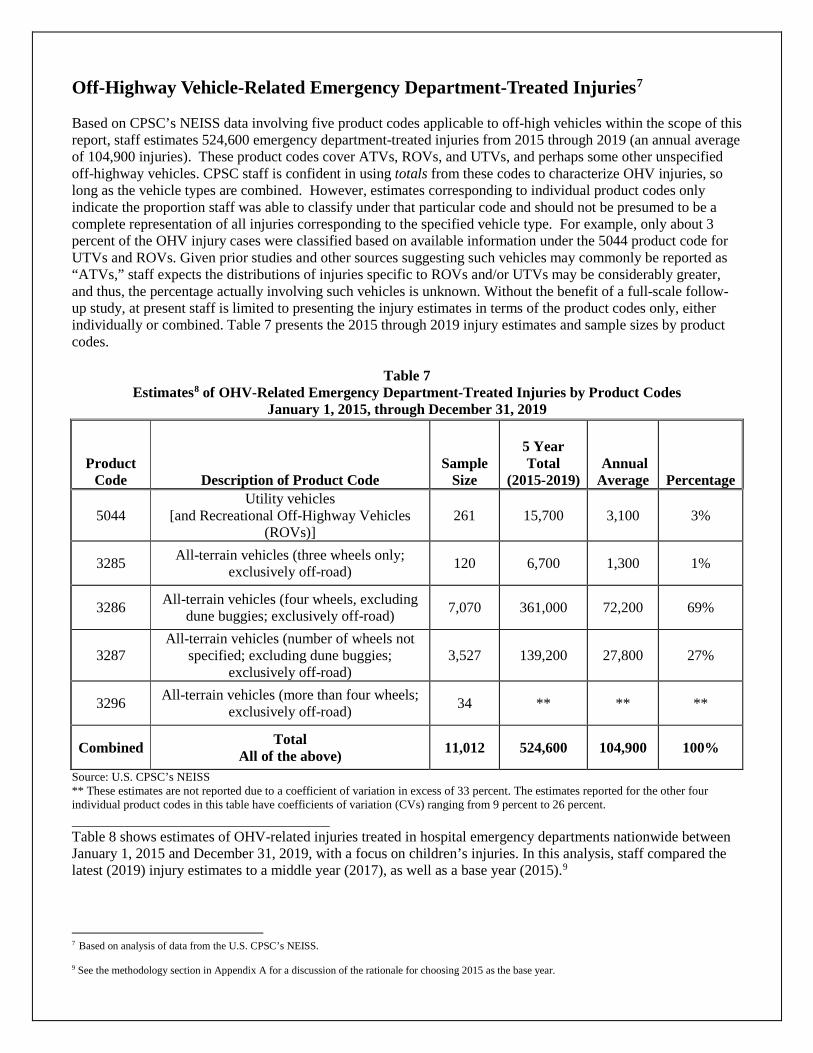
Off-Highway Vehicle-Related Emergency Department-Treated Injuries7 Based on CPSC’s NEISS data involving five product codes applicable to off-high vehicles within the scope of this report, staff estimates 524,600 emergency department-treated injuries from 2015 through 2019 (an annual average of 104,900 injuries). These product codes cover ATVs, ROVs, and UTVs, and perhaps some other unspecified off-highway vehicles. CPSC staff is confident in using totals from these codes to characterize OHV injuries, so long as the vehicle types are combined. However, estimates corresponding to individual product codes only indicate the proportion staff was able to classify under that particular code and should not be presumed to be a complete representation of all injuries corresponding to the specified vehicle type. For example, only about 3 percent of the OHV injury cases were classified based on available information under the 5044 product code for UTVs and ROVs. Given prior studies and other sources suggesting such vehicles may commonly be reported as “ATVs,” staff expects the distributions of injuries specific to ROVs and/or UTVs may be considerably greater, and thus, the percentage actually involving such vehicles is unknown. Without the benefit of a full-scale follow-up study, at present staff is limited to presenting the injury estimates in terms of the product codes only, either individually or combined. Table 7 presents the 2015 through 2019 injury estimates and sample sizes by product codes.
Table 7 Estimates8 of OHV-Related Emergency Department-Treated Injuries by Product Codes
January 1, 2015, through December 31, 2019
Source: U.S. CPSC’s NEISS ** These estimates are not reported due to a coefficient of variation in excess of 33 percent. The estimates reported for the other four individual product codes in this table have coefficients of variation (CVs) ranging from 9 percent to 26 percent. Table 8 shows estimates of OHV-related injuries treated in hospital emergency departments nationwide between January 1, 2015 and December 31, 2019, with a focus on children’s injuries. In this analysis, staff compared the latest (2019) injury estimates to a middle year (2017), as well as a base year (2015).9
7 Based on analysis of data from the U.S. CPSC’s NEISS.
9 See the methodology section in Appendix A for a discussion of the rationale for choosing 2015 as the base year.
Product Code Description of Product Code
Sample
Size
5 Year Total
(2015-2019)
Annual Average
Percentage
5044 Utility vehicles
[and Recreational Off-Highway Vehicles (ROVs)]
261 15,700 3,100 3%
3285 All-terrain vehicles (three wheels only; exclusively off-road) 120 6,700 1,300 1%
3286 All-terrain vehicles (four wheels, excluding dune buggies; exclusively off-road) 7,070 361,000 72,200 69%
3287 All-terrain vehicles (number of wheels not
specified; excluding dune buggies; exclusively off-road)
3,527 139,200 27,800 27%
3296 All-terrain vehicles (more than four wheels; exclusively off-road) 34 ** ** **
Combined Total All of the above) 11,012 524,600 104,900 100%

Table 8 Annual Estimates10 of OHV-Related Emergency Department-Treated Injuries
For All Ages, Children under 16 and Under 12 Years of Age January 1, 2015, through December 31, 2019
All Ages Under 16 Years of Age Under 12 Years of Age
Year Estimated Number of
Injuries
Estimated Number of
Injuries
Percent of All Ages
Estimated Number of
Injuries
Percent of All Ages
Percent of Children Under 16
2015 110,000 30,400 28% 15,400 14% 51% 2016 115,500 30,700 27% 15,800 14% 52% 2017 108,100 28,300 26% 13,300 12% 47% 2018 95,000 24,800 26% 12,900 14% 52% 2019 96,000 25,800 27% 12,900 13% 50% Total 524,600 140,000 27% 70,300 13% 50%
Source: U.S. CPSC’s NEISS Note: The coefficients of variation (CVs) for the injury estimates in this table range from 10 percent to 16 percent. See Appendix A for an explanation of the use and calculation of CVs.
For the “All Ages” age group, none of the year-over-year changes are statistically significant, except for the decrease from 2017 to 2018 (108,100 to 95,000; p-value=0.0321). For the “Under 16 Years of Age” and the “Under 12 Years of Age” groups, staff observed decreases of 15 percent and 16 percent, respectively, between 2015 and 2019. These declines were not statistically significant. On average, over the period 2015 through 2019, children “Under 12 Years of Age” represent an estimated 13 percent of emergency department-treated injuries for all ages, or 50 percent of injuries to children under 16. Males were injured more frequently than females, regardless of age. For all ages, the estimated distribution of injuries based on available sex classifications is 69 percent male and 31 percent female. Among children under the ages of 12 and 16, about 64 percent and 65 percent, respectively, were identified as male. Table 9 breaks down the estimated numbers of OHV-related, emergency department-treated injuries by age groups, from 2015 through 2019, while Figure 5 gives the corresponding graph of Table 9. Table 9
Annual Estimates of OHV-Related Emergency Department-Treated Injuries by Age Group January 1, 2015, through December 31, 2019
Age Group (in years of age) Year Under 12 12–15 16–24 25–34 35–44 45–54 55+ Total 2015 15,400 15,000 27,400 22,100 13,100 8,800 8,100 110,000 2016 15,800 14,900 26,400 24,900 15,400 9,200 8,900 115,500 2017 13,300 15,000 24,800 21,800 13,000 10,000 10,200 108,100 2018 12,900 11,900 21,500 18,600 12,700 8,600 8,600 95,000 2019 12,900 12,900 24,000 17,800 12,000 8,100 8,200 96,000 Total 70,300 69,700 124,100 105,200 66,200 44,700 44,000 524,600 Source: U.S. CPSC’s NEISS Note: Rows may not sum to the annual totals due to rounding and the exclusion of cases with unknown victim age. The coefficients of variation (CVs) for the injury estimates in this table range from 11 percent to 18 percent.

Staff’s analysis of information in Table 6 (above) supports the following:
• Between 2018 and 2019, none of the age groups exhibit a statistically significant difference in injuries.
• Between 2017 and 2018, there’s a statistically significant 20 percent decrease in estimates for the 12-15 age group (from 15,000 in 2017 to 11,900 in 2018). Although the estimates are also reduced for all remaining age groups, none of remaining age groups show a significant decrease between 2017 and 2018.
• The 25 to 34 age group is the only age group for which staff found a statistically significant difference
when comparing midyear (2017) against the latest year (2019). The 18 percent decrease between the 2017 and 2019 estimates for this 25 to 34 age group is statistically significant (p-value=0.0393).
• Although staff estimates for most age groups, other than the eldest (55+), decreased between 2015 and 2019, staff found no additional statistical significance in these apparent differences when comparing year-over-year, or when comparing the base year (2015) against any other year in the period.
Differences in population sizes among age groups and across time likely influence the number of injuries for each age group. According to data from the U.S. Census Bureau11, the number of persons age 55 years or older increased from an estimated 88 million to 97 million during this 5-year period. Child age group populations held steady throughout the period, with about 16.5 million 12-15 year old teens, in addition to about 48 million children under 12 years of age. The remaining age groups were comparable, somewhere between about 39 and 46 million, depending on the year and age group. To facilitate comparisons normalized by population size, Figure 5 (below) presents annual estimated injury rates per 100,000 persons within each age group. With the exception of children under 12 years of age, younger age groups throughout the period have injury rates estimated to be greater than that of their elders.
Sources: U.S. Census Bureau and U.S. CPSC’s NEISS
11 U.S. Census Bureau. https://www.census.gov/.
31.732.5
27.4 26.7 26.9
90.3 90.1 90.7
71.677.1
69.4 67.263.5
55.562.3
50.255.7
48.2
40.8 38.7
32.438.1
31.930.8 28.8
20.5 21.5 23.720.7 19.8
9.2 9.8 11.0 9.1 8.5
0
10
20
30
40
50
60
70
80
90
100
2015 2016 2017 2018 2019
Rate
Est
imat
e (p
er 1
00,0
00 p
opul
atio
n)
Year
Figure 5: Annual OHV-Related Hospital Emergency Department-Treated Injury Rate Estimates per 100,000 Population by Age Group in Years (2015-2019) Ages
Under12
Ages 12–15
Ages 16–24
Ages 25–34
Ages 35–44
Ages 45–54
Ages55 +

Figure 6 provides the estimated number of relevant OHV-related, emergency department-treated injuries for all ages from 2015-2019, broken down, respectively, by disposition, diagnosis, and body part.12 Any fatal injury reports in NEISS are also included in the earlier fatality section of this report. Of the five year total 524,600 estimated emergency department-treated injuries, staff categorized a majority as “treated and released” (84 percent). Staff categorized fifteen percent of the estimated emergency department-treated injuries as “treated and admitted” or “treated and transferred.” The remaining treatment disposition percentages are spread across several categories, such as “left without being seen,” “held for observation,” “fatality,” and “unknown.” Among all 524,600 estimated injuries the most common diagnoses were fractures (28 percent) and contusions/abrasions (21 percent). Staff categorized the remaining diagnoses into several categories, such as: lacerations, sprains/strains, internal organ injuries, and other (which includes concussions). The majority of all injuries were located on the arm (the shoulder down, 29 percent) or the head or neck (also 29 percent).
Figure 6: OHV-related Emergency Department-Treated Injury Estimates for All Ages, 2015-2019 By Disposition, Diagnosis, and Body Part
Sources: U.S. Census Bureau and U.S. CPSC’s NEISS
12 Beginning 2018, NEISS allowed the coding of up to two diagnoses and body part codes per injury. For this analysis, the first diagnosis and body part codes were considered “primary.” A small proportion of cases are associated with more than one diagnoses and body part categorization.
84%
15%
2%
Treated and Released
Treated and Admitted orTransferred to Another Hospital
Other
0% 10% 20% 30% 40% 50% 60% 70% 80% 90%
Disposition
21%
28%
11%
10%
12%
19%
Contusion/Abrasion
Fracture
Laceration
Internal Organ Injury
Sprain/Strain
Other
0% 5% 10% 15% 20% 25% 30%
Diagnosis
29%
20%
21%
29%
Head and Neck
Torso
Leg
Arm
0% 5% 10% 15% 20% 25% 30%
Body Part

Discussion Significant uncertainties exist regarding the classification of OHV injury data into ATVs versus UTVs and ROVs. Although staff could determine that about 25 percent of fatal OHV incidents were not ATVs, all but 3 percent of the OHV injury data was classified as an “ATV,” and thus, coded under an ATV product code. Investigations are attempted for fatal incidents, but not the injury cases that may very plausibly have contributed to a lesser rate of UTV/ROV vehicle identification among injuries. Thus, the rate of UTV and ROV injuries, in actuality, may be greater than 3 percent. However, it is also plausible that ATVs that expose riders to their surroundings, in actuality, may have a greater proportion of involvement among nonfatal injuries. It is not clear whether differences in exposure (as a function of riders and miles and time) account for the difference. After reaching a high of 812K in 2004, ATV sales declined steadily to 203K in 2018, the last year for which we have data. Except for the financial crisis years 2009 and 2010, combined ROV and UTV sales increased steadily from 164K in 2004, to 492K in 2018. Combined ROV and UTV sales first exceeded ATV sales in 2011, and they have done so every year since. However, product life for these products is uncertain, and utilization of these products is even more unclear. Accordingly, in the end, the effect of exposure is unclear. Due to the relatively modest influence (i.e., small sample size) of the UTV/ROV product code on the overall OHV injury estimates, staff’s injury analysis, limited to the combination of these five product codes, is overwhelmingly dominated by the ATV product code-related injury characteristics. For example, the disposition, diagnosis, and body part distributions for 2015 through 2019, presented earlier in Figure 6, represent almost the same percentages as if staff omitted entirely the UTV/ROV product code cases. Conversely, this may not represent the distribution for UTVs and ROVs as suggested by an analysis restricted to cases specifically classified using the UTV/ROV product code (5044) with regard to some body parts and diagnoses. More notably, analysis constrained to the UTV/ROV product code suggests statistically significant increases in injuries contrary to what is observed for OHVs overall when ATVs are included. The product code 3287 for ATVs with an unknown number of wheels accounts for 27 percent of the total OHV injury estimates from 2015 through 2019. Based on the current distributions of other product codes specifying the numbers of wheels as 3, 4, or more, staff estimates that 2 percent of the vehicles may be imputed as vehicles having 3, 5, or 6 wheels, while the remaining 98 percent of vehicles may be imputed as 4-wheeled vehicles. Based on historical knowledge, we expect that some minority proportion of these cases (especially those imputed to 4-wheeled vehicles) correspond to misclassified ROVs and UTVs. We similarly expect some misclassifications among a minority proportion of cases coded as 4-wheeled ATVs (product code 3286). Although we can reliably impute vehicles for the number of wheels from current available data, staff can only compute adjustments for misclassification errors between ATV and ROVs/UTVs, based upon survey data. The reallocation of sample cases into the small UTV/ROV product category could substantially increase the UTV/ROV estimates. However, any resulting “corrected” estimates for UTVs/ROVs would be especially sensitive to variations in the rate of reallocation computed from that survey data. Staff is aware that the more an estimate relies upon correction/adjustment, the more the estimate can be influenced by any imperfections with the method used for that correction/adjustment. Prior annual reports, which were primarily concerned only with estimates for ATVs, were less sensitive to any subtle inaccuracies in adjustment factors. However, the 2010 special study results are not applicable for the ROV/UTV data because:
1. substantial changes have occurred in the marketplace and market share for the various vehicle types since the time of prior surveys;
2. staff observed error frequency in vehicle classification from fatality incident data (e.g., among investigated fatalities involving an ROV about 75 percent are described in their death certificates as an “ATV”);
3. relative magnitude of the uncorrected estimates for ROVs/UTVs have small sample sizes and can be more sensitive to any imperfections with those corrections.

Without the benefit of a more recent follow-up special study, staff cannot reliably produce an adjusted and corrected injury estimate specific to UTVs and/or ROVs. Until such a study is completed and results are available, this annual report will continue to present these injury estimates as combined OHV estimates.

Appendix A: Estimation Methodologies
This appendix describes the methodologies used to count OHV-related deaths and estimate injuries and other information to develop the report analyses.
OHV-Related Deaths
In-Scope OHV-Related Fatalities All fatality data are based on reports received through the Consumer Product Safety Risk Management System (CPSRMS). OHV-related fatalities that staff considered to be in-scope in this report include any unintentional incident involving OHVs (ATVs, ROVs, and UTVs), whether or not the OHV was in operation at the time of the incident. Because of the difficulties inherent in distinguishing between occupational and non-occupational use, staff included occupational fatalities in both the death counts and the injury estimates. For example, staff may find it difficult to classify a fatality that occurs as a victim is riding next to a fence on a ranch, while examining the fence, and subsequently, becomes involved in an OHV-related fatality incident while taking a break from work to go on a recreational ride up a nearby hill. ICD-10 codes (V86.X) characterizing the external cause of death as “ATV-related,” include fatalities resulting from all specialty motor vehicles intended primarily for off-road use (World Health Organization, 2007). Thus, this set of ICD-10 codes captures other types of off-highway vehicles, such as dune buggies, ROVs, UTVs, and dirt bikes. By conducting in-depth investigations (IDIs), CPSC staff attempts to verify that the vehicles involved in these incidents were “ATVs,” as defined by CPSC staff (i.e., an ATV is a motorized vehicle intended for off-road use and having three, four, or more low pressure tires, a straddle seat for the operator, and handlebars for steering control). In cases where staff cannot ascertain the specific type of off-highway vehicle, CPSC staff counts the death report as an ATV-related fatality. Staff’s assumptions may result in an overestimation of ATV-related deaths. In many cases, CPSC staff receives fatality reports for the same incident from multiple sources. The reports are about deaths counted in a previous annual report, or deaths reported for the first time in this annual report. For example, CPSC staff may receive a MECAP report of a fatality that CPSC staff previously received via a news clip. Staff compares reports from all sources to identify and consolidate duplicate incidents reported in multiple sources so that incidents are counted only once in Table 1.
OHV-Related Injuries
Estimation of Emergency Department-Treated Injuries Associated with OHVs Staff derived all injury estimates in this report from data collected through CPSC’s NEISS, a probability sample of U.S. hospitals with 24-hour emergency departments with more than six beds (Schroeder and Ault, 2001a and 2001b). Thus, OHV-related injury estimates in this report represent hospital emergency department-treated injuries only. OHV-related injuries that were not treated in hospital emergency departments are not included in these estimates. Staff defined an “in-scope injury case” to be any non-occupational, unintentional case involving an OHV, whether or not the victim was operating the OHV at the time of the incident, i.e., the victim could have been a passenger or a bystander. Note that NEISS does not collect occupational injuries; thus, the definition of “in-scope, OHV-related injuries,” differs slightly from the definition of “in-scope, OHV-related fatalities.”

Staff did not use the adjustment factors from prior annual reports regarding ATVs, because those adjustment factors sought to exclude other types of off-highway vehicles misclassified as ATVs. Staff concluded that continued use of such adjustment factors would likely exclude cases that were really ROVs or UTVs. Coefficients of Variation A coefficient of variation (CV) is an expression of the standard deviation relative to the estimate itself. In this report, CVs for injury estimates are given as percentages. Schroeder and Ault (2001a) and Schroeder and Ault (2001b) discuss calculation of NEISS estimates and their variances. Levenson (2003b, 2005) and Garland (2011) discuss in greater detail adjustment factors and other concepts specific to variability associated with ATV estimates.

References ANSI/ROHVA 1 American National Standard for Recreational Off-Highway Vehicles. National Center for Health Statistics (NCHS) “About the International Classification of Diseases/Clinical Modification (ICD-10-CM).” August 2007. http://www.cdc.gov/nchs/icd.htm.
Schroeder, T. Trend Analysis of NEISS Data. February 2000. U.S. Consumer Product Safety Commission. Schroeder, T. and Ault, K. (2001b) The NEISS Sample (Design and Implementation) from 1997 to the Present. June 2001. U.S. Consumer Product Safety Commission. Topping, J. (February 2020) 2018 Annual Report of ATV Deaths and Injuries. U.S. Consumer Product Safety Commission. U.S. Census Bureau. https://www.census.gov/ U.S. Consumer Product Safety Commission. Standards for All-Terrain Vehicles and Ban of Three-Wheeled All-Terrain Vehicles; Notice of Proposed Rulemaking. Federal Register, Volume 71, Number 154, Pages 45904–45962. August 10, 2006. U.S. Consumer Product Safety Commission, Office of Information and Public Affairs (OIPA) (September 21, 2006). CPSC Launches Major Campaign to Drive Down Deaths and Serious Injuries Associated with All-Terrain Vehicles. Press Release. Retrieved September 16, 2009. World Health Organization (WHO), “International Classification of Diseases.” Retrieved December 4, 2007 from: http://www.who.int/classifications/icd/en/.


![lectureantibiogramme DESC2017 JCAILLON avec corrections … · 2017. 10. 27. · 3dupl ohv sursrvlwlrqv vxlydqwhv frqfhuqdqw6 dxuhxvhqwrxuh] od rx ohv upsrqvhvh[dfwhv" $ 7rxwhv ohv](https://img.dokumen.tips/doc/110x75/60db9b3c26c21a4e1558a99d/lectureantibiogramme-desc2017-jcaillon-avec-corrections-2017-10-27-3dupl-ohv.jpg)