Embed Size (px)
Citation preview

Ohio’s State Tests
ITEM RELEASE
SPRING 2017
ALGEBRA I
i
Table of Contents
Questions 1 – 20: Content Summary and Answer Key ................................................ iii
Question 1: Question and Scoring Guidelines .............................................................. 1
Question 1: Sample Responses ....................................................................................... 5
Question 2: Question and Scoring Guidelines ............................................................ 11
Question 2: Sample Response ...................................................................................... 13
Question 3: Question and Scoring Guidelines ........................................................... 15
Question 3: Sample Responses ..................................................................................... 19
Question 4: Question and Scoring Guidelines ............................................................ 25
Question 4: Sample Response ...................................................................................... 27
Question 5: Question and Scoring Guidelines ............................................................ 29
Question 5: Sample Response ...................................................................................... 32
Question 6: Question and Scoring Guidelines ............................................................ 33
Question 6: Sample Response ...................................................................................... 35
Question 7: Question and Scoring Guidelines ............................................................ 37
Question 7: Sample Responses ..................................................................................... 41
Question 8: Question and Scoring Guidelines ............................................................ 47
Question 8: Sample Response ...................................................................................... 50
Question 9: Question and Scoring Guidelines ............................................................ 51
Question 9: Sample Response ...................................................................................... 54
Question 10: Question and Scoring Guidelines .......................................................... 55
Question 10: Sample Response .................................................................................... 58
Question 11: Question and Scoring Guidelines .......................................................... 59
Question 11: Sample Response .................................................................................... 61
Question 12: Question and Scoring Guidelines .......................................................... 63
Question 12: Sample Response .................................................................................... 65
Question 13: Question and Scoring Guidelines .......................................................... 67
Question 13: Sample Responses ................................................................................... 71

ii
Question 14: Question and Scoring Guidelines .......................................................... 79
Question 14: Sample Responses ................................................................................... 81
Question 15: Question and Scoring Guidelines .......................................................... 87
Question 15: Sample Responses ................................................................................... 89
Question 16: Question and Scoring Guidelines .......................................................... 95
Question 16: Sample Responses ................................................................................... 99
Question 17: Question and Scoring Guidelines ........................................................ 113
Question 17: Sample Response .................................................................................. 115
Question 18: Question and Scoring Guidelines ........................................................ 117
Question 18: Sample Response .................................................................................. 119
Question 19: Question and Scoring Guidelines ........................................................ 121
Question 19: Sample Response .................................................................................. 123
Question 20: Question and Scoring Guidelines ........................................................ 125
Question 20: Sample Responses ................................................................................. 129

iii
Algebra I
Spring 2017 Item Release
Content Summary and Answer Key
Question
No.
Item
Type
Content
Cluster
Content
Standard Answer
Key Points
1 Equation
Item
Build new
functions from
existing
functions
Identify the effect on the graph
of replacing f(x) by f(x) + k, k
f(x), f(kx), and f(x + k) for specific
values of k (both positive and
negative); find the value of k
given the graphs. Experiment
with cases and illustrate an
explanation of the effects on
the graph using technology.
Include recognizing even and
odd functions from their graphs
and algebraic expressions for
them. (F.BF.3)
--- 1 point
2 Multiple
Choice
Interpret the
structure of
expressions
Interpret expressions that
represent a quantity in terms of
its context.* (A.SSE.1)
a. Interpret parts of an
expression, such as terms,
factors, and coefficients.
B 1 point
3 Table Item
Understand the
concept of a
function and
use function
notation
Use function notation, evaluate
functions for inputs in their
domains, and interpret
statements that use function
notation in terms of a context.
(F.IF.2)
--- 1 point
4 Multiple
Choice
Summarize,
represent, and
interpret data
on two
categorical
and
quantitative
variables
Represent data on two
quantitative variables on a
scatter plot, and describe how
the variables are related. (S.ID.6)
a. Fit a function to the data; use
functions fitted to data to solve
problems in the context of the
data. Use given functions or
choose a function suggested by
the context. Emphasize linear,
quadratic, and exponential
models.
C 1 point
*An asterisk appears next to any standard or group of standards linked with Modeling as a conceptual category.

iv
Algebra I
Spring 2017 Item Release
Content Summary and Answer Key
Question
No.
Item
Type
Content
Cluster
Content
Standard Answer
Key Points
5 Multiple
Choice
Create
equations that
describe
numbers or
relationships
Rearrange formulas to highlight a
quantity of interest, using the
same reasoning as in solving
equations. (A.CED.4)
D 1 point
6 Multiple
Choice
Interpret linear
models
Distinguish between correlation
and causation. (S.ID.9) D 1 point
7 Equation
Item
Solve
equations and
inequalities in
one variable
Solve linear equations and
inequalities in one variable,
including equations with
coefficients represented by
letters. (A.REI.3)
--- 1 point
8 Multiple
Choice
Construct and
compare
linear,
quadratic, and
exponential
models and
solve problems
Distinguish between situations
that can be modeled with linear
functions and with exponential
functions. (F.LE.1)
b. Recognize situations in which
one quantity changes at a
constant rate per unit interval
relative to another.
C 1 point
9
Multi-
Select
Item
Extend the
properties of
exponents to
rational
exponents
Rewrite expressions involving
radicals and rational exponents
using the properties of
exponents. (N.RN.2)
A, C, E 1 point

v
Algebra I
Spring 2017 Item Release
Content Summary and Answer Key
Question
No.
Item
Type
Content
Cluster
Content
Standard Answer
Key Points
10 Multiple
Choice
Interpret linear
models
Compute (using technology)
and interpret the correlation
coefficient of a linear fit. (S.ID.8)
A 1 point
11 Multiple
Choice
Summarize,
represent, and
interpret data
on a single
count or
measurement
variable
Use statistics appropriate to the
shape of the data distribution to
compare center (median,
mean) and spread (interquartile
range, standard deviation) of
two or more different data sets.
(S.ID.2)
B 1 point
12 Multiple
Choice
Write
expressions in
equivalent
forms to solve
problems
Choose and produce an
equivalent form of an expression
to reveal and explain properties
of the quantity represented by
the expression. (A.SSE.3)
a. Factor a quadratic expression
to reveal the zeros of the
function it defines.
C 1 point
13 Equation
Item
Solve systems
of equations
Solve systems of linear equations
exactly and approximately (e.g.,
with graphs), focusing on pairs of
linear equations in two variables.
(A.REI.6)
--- 1 point
14 Equation
Item
Create
equations that
describe
numbers or
relationships
Create equations in two or more
variables to represent
relationships between quantities;
graph equations on coordinate
axes with labels and scales.
(A.CED.2)
--- 1 point

vi
Algebra I
Spring 2017 Item Release
Content Summary and Answer Key
Question
No.
Item
Type
Content
Cluster
Content
Standard Answer
Key Points
15 Equation
Item
Construct and
compare
linear,
quadratic, and
exponential
models and
solve problems
Construct linear and exponential
functions, including arithmetic
and geometric sequences, given
a graph, a description of a
relationship, or two input-output
pairs (include reading these from
a table). (F.LE.2)
--- 1 point
16 Short
Response
Interpret
functions that
arise in
applications in
terms of the
context
For a function that models a
relationship between two
quantities, interpret key features
of graphs and tables in terms of
the quantities, and sketch graphs
showing key features given a
verbal description of the
relationship. Key features
include: intercepts; intervals
where the function is increasing,
decreasing, positive, or negative;
relative maximums and
minimums; symmetries; end
behavior; and periodicity.*
(F.IF.4)
--- 2 points
17 Multiple
Choice
Interpret
functions that
arise in
applications in
terms of the
context
Relate the domain of a function
to its graph and, where
applicable, to the quantitative
relationship it describes. For
example, if the function h(n)
gives the number of person-hours
it takes to assemble n engines in
a factory, then the positive
integers would be an
appropriate domain for the
function.* (F.IF.5))
C 1 point
*An asterisk appears next to any standard or group of standards linked with Modeling as a conceptual category.

vii
Algebra I
Spring 2017 Item Release
Content Summary and Answer Key
Question
No.
Item
Type
Content
Cluster
Content
Standard Answer
Key Points
18
Multi-
Select
Item
Represent and
solve equations
and
inequalities
graphically
Understand that the graph of an
equation in two variables is the
set of all its solutions plotted in
the coordinate plane, often
forming a curve (which could be
a line). (A.REI.10)
A, D 1 point
19 Multiple
Choice
Perform
arithmetic
operations on
polynomials
Understand that polynomials
form a system analogous to the
integers, namely, that they are
closed under the operations of
addition, subtraction, and
multiplication; add, subtract and
multiply polynomials. (A.APR.1)
D 1 point
20 Equation
Item
Create
equations that
describe
numbers or
relationships
Create equations and
inequalities in one variable and
use them to solve problems.
Include equations arising from
linear and quadratic functions,
and simple rational and
exponential functions. (A.CED.1)
--- 2 points
1
Algebra I
Spring 2017 Item Release
Question 1
Question and Scoring Guidelines

2
Question 1
16722
20512
Points Possible: 1
Content Cluster: Build new functions from existing functions
Content Standard: Identify the effect on the graph of replacing f(x)
by f(x) + k, k f(x), f(kx), and f(x + k) for specific values of k (both
positive and negative); find the value of k given the graphs.
Experiment with cases and illustrate an explanation of the effects on
the graph using technology. Include recognizing even and odd
functions from their graphs and algebraic expressions for them.
(F.BF.3)

3
Scoring Guidelines
Exemplar Response
h = 5
Other Correct Responses
Any equivalent value
For this item, a full-credit response includes:
The correct value for h (1 point)


5
Algebra I
Spring 2017 Item Release
Question 1
Sample Responses

6
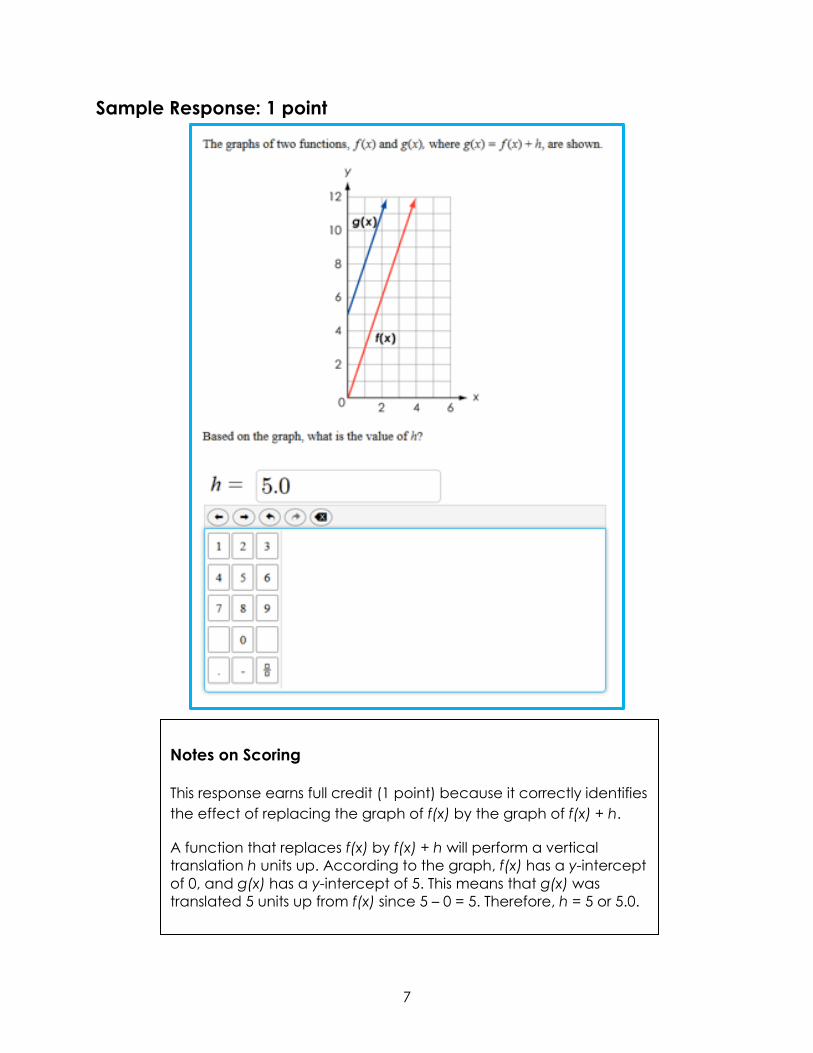
Sample Response: 1 point
Notes on Scoring
This response earns full credit (1 point) because it correctly identifies
the effect of replacing the graph of f(x) by the graph of f(x) + h.
A function that replaces f(x) by f(x) + h will perform a vertical
translation h units up. According to the graph, f(x) has a y-intercept
of 0, and g(x) has a y-intercept of 5. This means that g(x) was
translated 5 units up from f(x) since 5 – 0 = 5. Therefore, h = 5.
7
Sample Response: 1 point
Notes on Scoring
This response earns full credit (1 point) because it correctly identifies
the effect of replacing the graph of f(x) by the graph of f(x) + h.
A function that replaces f(x) by f(x) + h will perform a vertical
translation h units up. According to the graph, f(x) has a y-intercept
of 0, and g(x) has a y-intercept of 5. This means that g(x) was
translated 5 units up from f(x) since 5 – 0 = 5. Therefore, h = 5 or 5.0.

8
Sample Response: 0 points
Notes on Scoring
This response earns no credit (0 points) because it incorrectly
identifies the effect of replacing the graph of f(x) by the graph of
f(x) + h.
The student may have confused g(x) with f(x) and noticed that f(x)
was translated 5 units below g(x), since 0 – 5 = –5, and made the
conclusion that h = –5.

9
Sample Response: 0 points
Notes on Scoring
This response earns no credit (0 points) because it incorrectly
identifies the transformation of f(x) + h on a graph.
The student may have found the y-coordinate at x = 1 for g(x),
which is (1, 8), and f(x), which is (1, 3), and then found the ratio of 𝑔(𝑥)
𝑓(𝑥) as
8
3 without realizing that the y-coordinates need to be
subtracted in order to find the vertical translation.


11
Algebra I
Spring 2017 Item Release
Question 2
Question and Scoring Guidelines

12
Question 2
16723
*An asterisk appears next to any standard or group of standards linked with Modeling as a conceptual category.
Scoring Guidelines
Rationale for Option A: This is incorrect. The student may have confused the
meaning of the constant with the meaning of the coefficient.
Rationale for Option B: Key – The student noted that the variable term
represented the marbles' weight, while the constant was the bucket's weight.
Rationale for Option C: This is incorrect. The student may have confused the
meaning of the constant with the meaning of the variable.
Rationale for Option D: This is incorrect. The student may have seen that the 8
was added on and assumed it meant total weight.
Points Possible: 1
Content Cluster: Interpret the structure of expressions
Content Standard: Interpret expressions that represent a quantity in
terms of its context.* (A.SSE.1)
a. Interpret parts of an expression, such as terms, factors, and
coefficients.

13
Sample Response: 1 point


15
Algebra I
Spring 2017 Item Release
Question 3
Question and Scoring Guidelines

16
Question 3
16724
20512
Points Possible: 1
Content Cluster: Understand the concept of a function and use
function notation
Content Standard: Use function notation, evaluate functions for
inputs in their domains, and interpret statements that use function
notation in terms of a context. (F.IF.2)

17
Scoring Guidelines
Exemplar Response
Other Correct Responses
Any equivalent values
For this item, a full-credit response includes:
Three correct values (1 point)


19
Algebra I
Spring 2017 Item Release
Question 3
Sample Responses

20
Sample Response: 1 point
Notes on Scoring
This response earns full credit (1 point) because it shows
three correct values of the inputs/outputs of a function inserted
in the table.
The Number of Deliveries, n, is the input of the function
𝑓(𝑛) = 7𝑛 + 96. The Daily Pay, f(n), in dollars, is the output of the
function. To find the Daily Pay for 𝑛 = 0, or f(0), substitute 0 into the
equation for n to get 𝑓(0) = 7(0) + 96, so 𝑓(0) = 96. To find the
Daily Pay for 𝑛 = 5, or f(5), substitute 5 into the equation for n to
get 𝑓(5) = 7(5) + 96, so 𝑓(5) = 131. To find the Number of Deliveries
when the Daily Pay equals 145, substitute 145 in for f(n) to get
145 = 7𝑛 + 96. Then solve the equation by subtracting 96 from both
sides to get 49 = 7𝑛. Then divide both sides by 7, 49
7=
7𝑛
7, which
results in 𝑛 = 7.

21
Sample Response: 1 point
Notes on Scoring
This response earns full credit (1 point) because it shows
three correct values of the inputs/outputs of a function inserted
in the table.
The Number of Deliveries, n, is the input of the function
𝑓(𝑛) = 7𝑛 + 96. The Daily Pay, f(n), in dollars, is the output of the
function. To find the Daily Pay for n = 0, or f(0), substitute 0 into the equation for n to get 𝑓(0) = 7(0) + 96, so 𝑓(0) = 96. To find
the Daily Pay for 𝑛 = 5, or f(5), substitute 5 into the equation for n to
get 𝑓(5) = 7(5) + 96, so 𝑓(5) = 131. To find the Number of Deliveries
when the Daily Pay equals 145, substitute 145 in for f(n) to get
145 = 7𝑛 + 96. Then solve the equation by subtracting 96 from both
sides to get 49 = 7𝑛. Then divide both sides by 7, 49
7=
7𝑛
7, which
results in in 𝑛 = 7. Equivalent values of 96.00, 131.00, and 7.00 also
earn full credit.

22
Sample Response: 0 points
Notes on Scoring
This response earns no credit (0 points) because out of three
required values, it shows two incorrect values of the inputs/outputs
of a function inserted in the table.
The student is correct that when the Number of Deliveries is 7,
the correct Daily Pay is $145. However, the student incorrectly
calculated the Daily Pay at $0, when the Number of Deliveries is 0.
For f(0) the Daily Pay should be $96, not $0. The student also
incorrectly calculated the Daily Pay at $35, when the Number of
Deliveries is 5. For f(5) the Daily Pay should be $131, not $35. The
student may have ignored that a constant of $96 is added to 7n
when substituting 0 and 5 in for n.
Students need to get all three values correct in order to get full
credit for this item.

23
Sample Response: 0 points
Notes on Scoring
This response earns no credit (0 points) because out of three
required values, it shows one incorrect value of the inputs/outputs
of a function inserted in the table.
The Daily Pay of $96 for 0 deliveries is correct. The Daily Pay of $131
for 5 deliveries is correct. However, the number of deliveries for
$145 is incorrect. The student may have forgotten to divide by 7 when solving 𝑓(𝑛) = 7𝑛 + 96 for n.
Students need to get all three values correct in order to get full
credit for this item.


25
Algebra I
Spring 2017 Item Release
Question 4
Question and Scoring Guidelines

26
Question 4
16725
Points Possible: 1
Content Cluster: Summarize, represent, and interpret data on two
categorical and quantitative variables
Content Standard: Represent data on two quantitative variables on
a scatter plot, and describe how the variables are related. (S.ID.6)
a. Fit a function to the data; use functions fitted to data to solve
problems in the context of the data. Use given functions or choose a
function suggested by the context. Emphasize linear, quadratic, and
exponential models.

27
Scoring Guidelines
Rationale for Option A: This is incorrect. The student may have confused a
square root model with a quadratic model.
Rationale for Option B: This is incorrect. The student may have thought that
since the data was not perfectly linear, a quadratic model would be best.
Rationale for Option C: Key – The student correctly identified that the data in
the scatterplot represented half of a U-shape, which would be best modeled
by a quadratic function.
Rationale for Option D: This is incorrect. The student may have confused a
linear model with negative-slope with a model represented by quadratic
function.
Sample Response: 1 point


29
Algebra I
Spring 2017 Item Release
Question 5
Question and Scoring Guidelines

30
Question 5
16726
Points Possible: 1
Content Cluster: Create equations that describe numbers or
relationships.
Content Standard: Rearrange formulas to highlight a quantity of
interest, using the same reasoning as in solving equations. (A.CED.4)

31
Scoring Guidelines
Rationale for Option A: This is incorrect. The student may have taken the
square root of F and r2 but not the other terms, and he or she may have also
confused multiplying with dividing when rearranging the equation to find r.
Rationale for Option B: This is incorrect. The student may only have taken the
square root of the terms on the right side of the equation before rearranging
to find r.
Rationale for Option C: This is incorrect. The student may have taken the
square root of all the terms but confused multiplication with division when
rearranging to find r.
Rationale for Option D: Key – The student correctly rearranged the formula,
𝐹 =𝐺(𝑚1)(𝑚2)
𝑟2 , to find r. The first step would be to multiply both sides by r2 which
would result in (𝑟2)(𝐹) = 𝐺(𝑚1)(𝑚2). Then the student would divide each side
by F resulting in 𝑟2 =𝐺(𝑚1)(𝑚2)
𝐹. Finally, he or she would take the square root of
both sides to get 𝑟 = √𝐺(𝑚1)(𝑚2)
𝐹.

32
Sample Response: 1 point

33
Algebra I
Spring 2017 Item Release
Question 6
Question and Scoring Guidelines
34
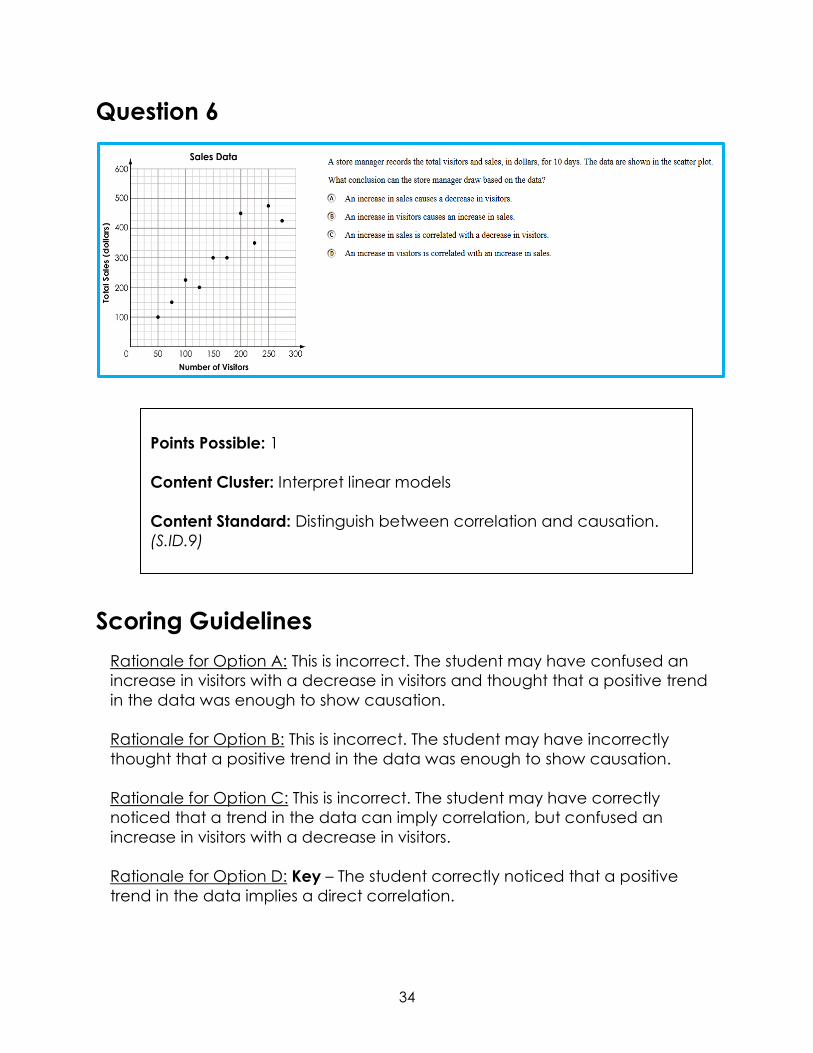
Question 6
16727
Scoring Guidelines
Rationale for Option A: This is incorrect. The student may have confused an
increase in visitors with a decrease in visitors and thought that a positive trend
in the data was enough to show causation.
Rationale for Option B: This is incorrect. The student may have incorrectly
thought that a positive trend in the data was enough to show causation.
Rationale for Option C: This is incorrect. The student may have correctly
noticed that a trend in the data can imply correlation, but confused an
increase in visitors with a decrease in visitors.
Rationale for Option D: Key – The student correctly noticed that a positive
trend in the data implies a direct correlation.
Points Possible: 1
Content Cluster: Interpret linear models
Content Standard: Distinguish between correlation and causation.
(S.ID.9)

35
Sample Response: 1 point


37
Algebra I
Spring 2017 Item Release
Question 7
Question and Scoring Guidelines

38
Question 7
16728
20512
Points Possible: 1
Content Cluster: Solve equations and inequalities in one variable
Content Standard: Solve linear equations and inequalities in one
variable, including equations with coefficients represented by letters.
(A.REI.3)
39
Scoring Guidelines
Exemplar Response
31
25
Other Correct Responses
Any equivalent values
For this item, a full-credit response includes:
A correct value (1 point)


41
Algebra I
Spring 2017 Item Release
Question 7
Sample Responses

42
Sample Response: 1 point
Notes on Scoring
This response earns full credit (1 point) because it shows the correct solution when
solving linear equations in one variable.
To find a solution, the linear equation must be rearranged to isolate x. It can be
solved in many ways. One way to solve the equation 3𝑥 +4
5= 7 − 2𝑥 is to add 2𝑥
to both sides to get 3𝑥 + (2𝑥) +4
5= 7 − 2𝑥 + (2𝑥), which simplifies to 5𝑥 +
4
5= 7. Then,
−4
5could be added to both sides of the equation to get 5𝑥 +
4
5+ (−
4
5) = 7 + (−
4
5),
which simplifies to 5𝑥 = 61
5or 5𝑥 =
31
5. The next step is to multiply both sides by
1
5 to
get (1
5) (5𝑥) = (
31
5) (
1
5), which simplifies to 𝑥 =
31
25.

43
Sample Response: 1 point
Notes on Scoring
This response earns full credit (1 point) because it shows the correct solution
when solving linear equations in one variable.
To find a solution, the linear equation must be rearranged to isolate x. It can
be solved in many ways. One way to solve the equation 3𝑥 +4
5= 7 − 2𝑥 is
to add 2𝑥 to both sides to get 3𝑥 + (2𝑥) +4
5= 7 − 2𝑥 + (2𝑥), which simplifies
to 5𝑥 +4
5= 7. Then, −
4
5 could be added to both sides of the equation to get
5𝑥 +4
5+ (−
4
5) = 7 + (−
4
5), which simplifies to 5𝑥 = 6
1
5or 5𝑥 =
31
5. The next step
is to multiply both sides by 1
5to get (
1
5) (5𝑥) = (
31
5) (
1
5), which simplifies to 𝑥 =
31
25,
which is equivalent to 16
25.

44
Sample Response: 0 points
Notes on Scoring
This response earns no credit (0 points) because it shows an incorrect solution
when solving linear equations in one variable.
To find a solution, the linear equation must be rearranged to isolate x. It can
be solved in many ways. One way to solve the equation 3𝑥 +4
5= 7 − 2𝑥 is
to add 2𝑥 to both sides to get 3𝑥 + (2𝑥) +4
5= 7 − 2𝑥 + (2𝑥), which simplifies
to 5𝑥 +4
5= 7. Then, −
4
5 could be added to both sides of the equation to get
5𝑥 +4
5+ (−
4
5) = 7 + (−
4
5), which simplifies to 5𝑥 = 6
1
5or 5𝑥 =
31
5. The student
may have ended his or her solution without multiplying each side by 1
5.

45
Sample Response: 0 points
Notes on Scoring
This response earns no credit (0 points) because it shows an incorrect solution
when solving linear equations in one variable.


47
Algebra I
Spring 2017 Item Release
Question 8
Question and Scoring Guidelines
48
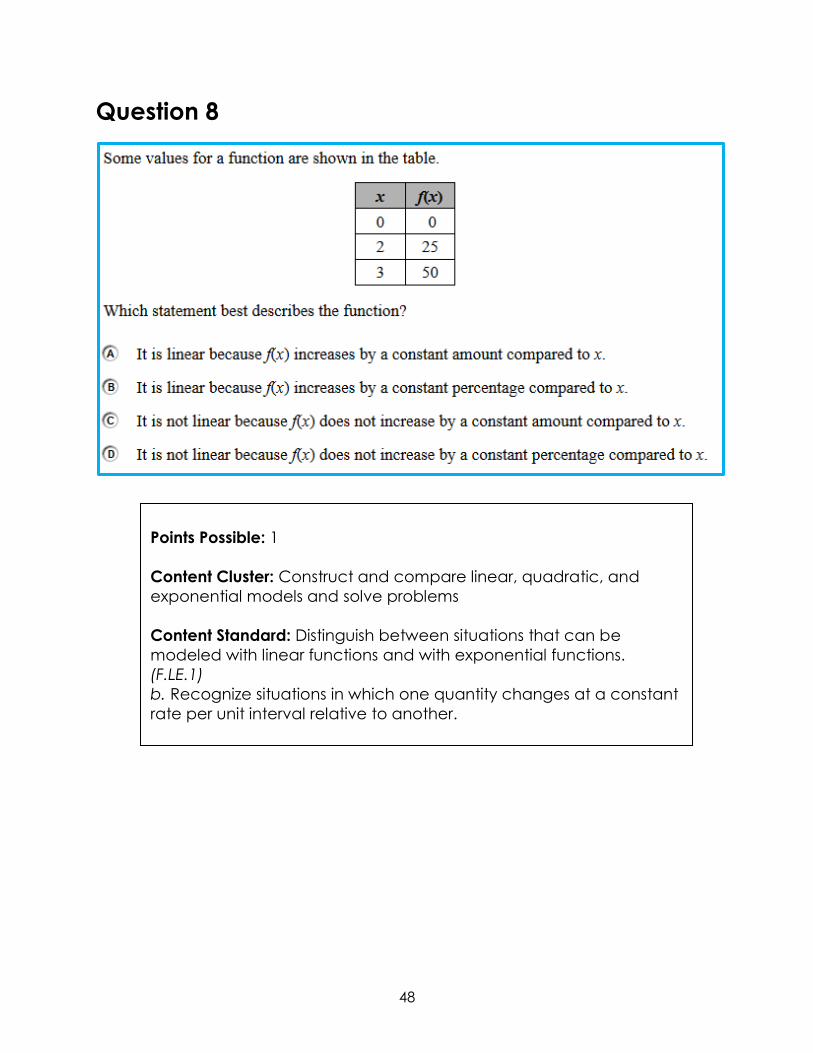
Question 8
16729
Points Possible: 1
Content Cluster: Construct and compare linear, quadratic, and
exponential models and solve problems
Content Standard: Distinguish between situations that can be
modeled with linear functions and with exponential functions.
(F.LE.1)
b. Recognize situations in which one quantity changes at a constant
rate per unit interval relative to another.
49
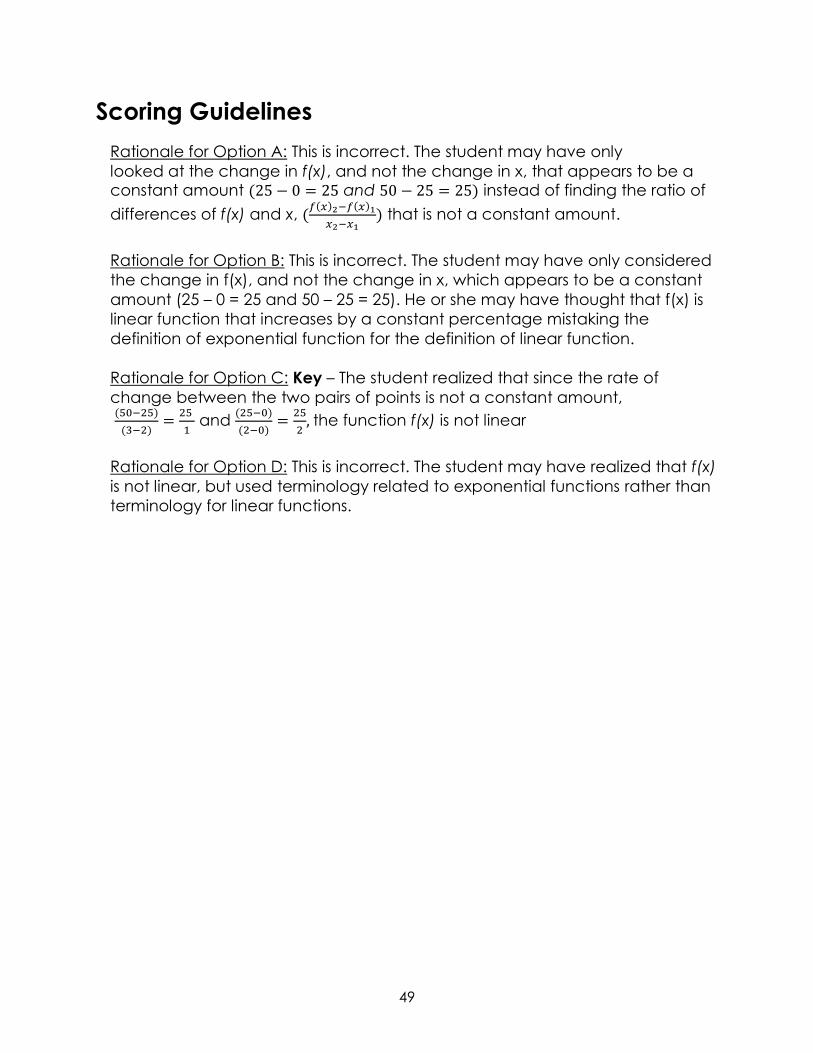
Scoring Guidelines
Rationale for Option A: This is incorrect. The student may have only
looked at the change in f(x), and not the change in x, that appears to be a constant amount (25 − 0 = 25 and 50 − 25 = 25) instead of finding the ratio of
differences of f(x) and x, (𝑓(𝑥)2−𝑓(𝑥)1
𝑥2−𝑥1) that is not a constant amount.
Rationale for Option B: This is incorrect. The student may have only considered
the change in f(x), and not the change in x, which appears to be a constant
amount (25 – 0 = 25 and 50 – 25 = 25). He or she may have thought that f(x) is
linear function that increases by a constant percentage mistaking the
definition of exponential function for the definition of linear function.
Rationale for Option C: Key – The student realized that since the rate of
change between the two pairs of points is not a constant amount,
(50−25)
(3−2)=
25
1 and
(25−0)
(2−0)=
25
2, the function f(x) is not linear
Rationale for Option D: This is incorrect. The student may have realized that f(x)
is not linear, but used terminology related to exponential functions rather than
terminology for linear functions.

50
Sample Response: 1 point

51
Algebra I
Spring 2017 Item Release
Question 9
Question and Scoring Guidelines

52
Question 9
16730
Points Possible: 1
Content Cluster: Extend the properties of exponents to rational
exponents.
Content Standard: Rewrite expressions involving radicals and rational
exponents using the properties of exponents. (N.RN.2)

53
Scoring Guidelines
Rationale for First Option: Key – The student correctly selected an equivalent
expression. According to the property of exponents
165
2 = 162 161
2. Since162 = (42)2 = 44 and 161
2 = (42)1
2 = 4, then
162 161
2 = 44 4 = 45 and 165
2 = 45.
Rationale for Second Option: This is incorrect. The student may have divided
the 16 by the 2 in the denominator of the exponent instead of taking the
square root of 16.
Rationale for Third Option: Key – The student correctly selected an equivalent
expression because expressions in the form 𝑥𝑏
𝑎 can be written as √𝑥𝑏𝑎 so that
165
2 = √165.
Rationale for Fourth Option: This is incorrect. The student may have recognized
that numbers with fraction exponents can be written with radicals, but
reversed the meaning of the numerator and denominator and used the
numerator as the radical’s index instead of the denominator.
Rationale for Fifth Option: Key – The student correctly selected an equivalent
expression because the product of two exponential expressions with the same
bases is the exponential expression with the unchanged base and the sum of
exponents. In this case, the sum of the exponents is 2.5 or 5
2 in the given
expression, so 165
2 = 162
2+
2
2+
1
2 = 162 161
2.
Rationale for Sixth Option: This is incorrect. The student may have incorrectly
converted the improper fraction 5
2 to 5 and
1
2 instead of 2 and
1
2, and applied
the product property of exponents (165.5 = 165+1
2 = 165 161
2).

54
Sample Response: 1 point
55
Algebra I
Spring 2017 Item Release
Question 10
Question and Scoring Guidelines

56
Question 10
16731
Points Possible: 1
Content Cluster: Interpret linear models
Content Standard: Compute (using technology) and interpret the
correlation coefficient of a linear fit. (S.ID.8)

57
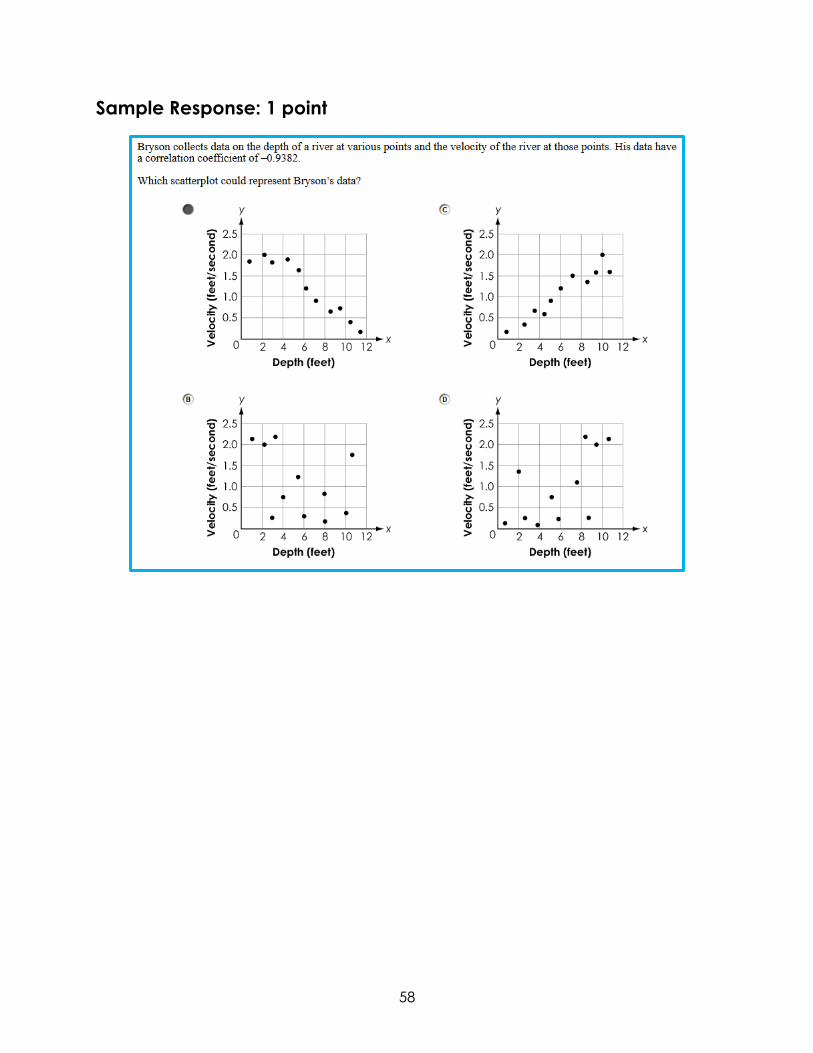
Scoring Guidelines
Rationale for Option A: Key – The student correctly identified that a correlation
coefficient of –0.9382 indicates a strong negative linear relationship because
the scatterplot shows the set of points lying closely to the imaginary line of best
fit with increasing variable x and decreasing variable y.
Rationale for Option B: This is incorrect. The student may have thought that a
correlation coefficient of –0.9382 represents a weak negative linear
relationship and chose the scatterplot that represented this data.
Rationale for Option C: This is incorrect. The student may have thought that
because the absolute value of a correlation coefficient of –0.9382 is close to 1,
it represents a strong positive linear relationship and chose the scatterplot that
represented this data.
Rationale for Option D: This is incorrect. The student may have thought that a
correlation coefficient of –0.9382 represents a weak positive linear relationship
and chose the scatterplot that represented this data.
58
Sample Response: 1 point

59
Algebra I
Spring 2017 Item Release
Question 11
Question and Scoring Guidelines
60
Question 11
16732
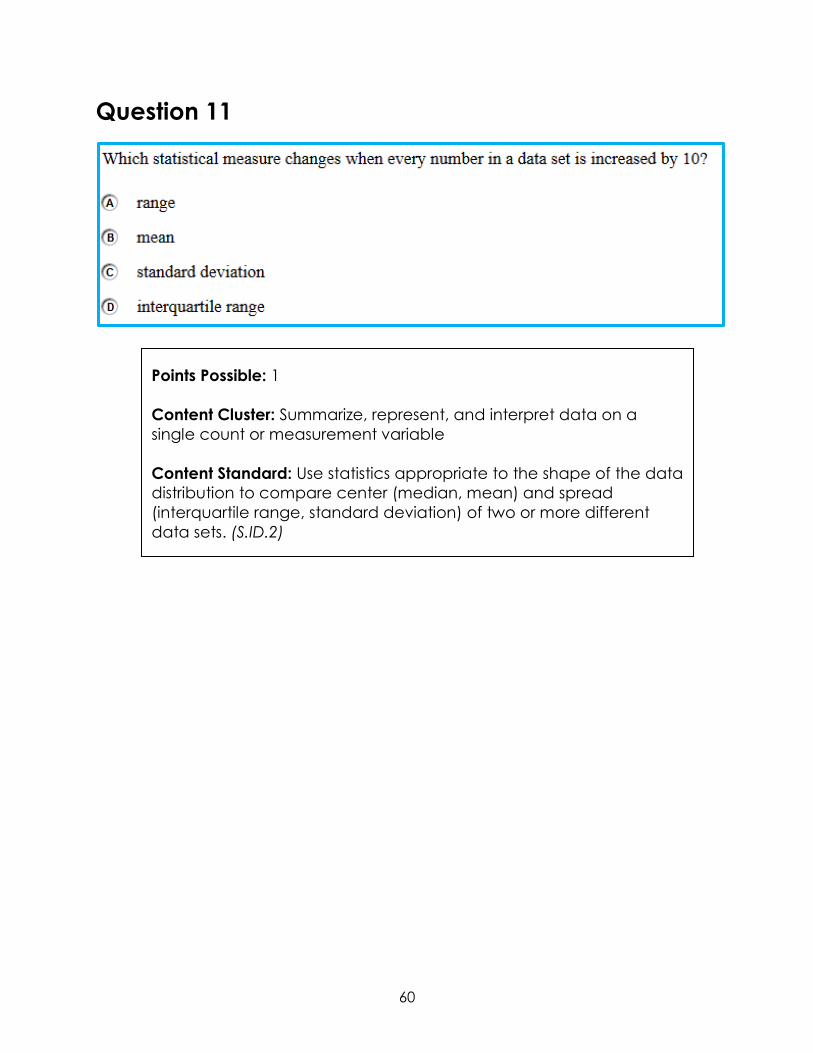
Points Possible: 1
Content Cluster: Summarize, represent, and interpret data on a
single count or measurement variable
Content Standard: Use statistics appropriate to the shape of the data
distribution to compare center (median, mean) and spread
(interquartile range, standard deviation) of two or more different
data sets. (S.ID.2)

61
Scoring Guidelines
Rationale for Option A: This is incorrect. The student may have thought that
since each value was increased by 10, the range would also increase, but
neglected to consider that the increases of 10 would cancel each other when
subtracting the minimum from the maximum to calculate the range.
Rationale for Option B: Key – The student correctly determined that the mean
of the data set would increase because if every data point increases by 10
and the number of data points remains the same, the average increases.
Rationale for Option C: This is incorrect. The student may have thought that
since each value increased by 10, the standard deviation would also
increase, but because the mean would increase by 10 and each data point
increases by 10, the increases cancel each other when finding the difference
between each data point and the mean to calculate the deviation.
Rationale for Option D: This is incorrect. The student may have thought that
since all data points increased by 10, the interquartile range would also
increase but neglected to consider that the increases of 10 to the first and
third quartiles would cancel each other when finding their difference to
calculate the interquartile range.
Sample Response: 1 point


63
Algebra I
Spring 2017 Item Release
Question 12
Question and Scoring Guidelines

64
Question 12
16733
Points Possible: 1
Content Cluster: Write expressions in equivalent forms to solve
problems.
Content Standard: Choose and produce an equivalent form of an
expression to reveal and explain properties of the quantity
represented by the expression. (A.SSE.3)
a. Factor a quadratic expression to reveal the zeros of the function it
defines.

65
Scoring Guidelines
Rationale for Option A: This is incorrect. The student may have factored the
greatest common factor from the expression and then left it out from the final
answer since it is not a binomial. The student may have also failed to use
multiplication to verify that it is not equivalent to the quadratic expression in
the given f(x).
Rationale for Option B: This is incorrect. The student may have factored only
the squared term, 36𝑥2, and constant term, –6, when selecting option B. The
student may have also failed to use multiplication to verify that it is not
equivalent to the quadratic expression in the given f(x).
Rationale for Option C: Key – The student chose the completely factored form
of the given expression by stating that 36𝑥2 + 15𝑥 − 6 = 3(12𝑥2 + 5𝑥 − 2) =3(4𝑥 − 1)(3𝑥 + 2). Next, the student may have first used the distributive
property and then multiplication to verify if the expression in option C is
equivalent to the quadratic expression in the given f(x).
Rationale for Option D: This is incorrect. The student may have recognized that
the expression has a greatest common factor of 3, but then may have
factored just the squared term, 36x2, and constant term, –6, of the given
quadratic expression f(x). The student may have also failed to use first the
distributive property and then multiplication to verify that it is not equivalent to
the quadratic expression in the given f(x).
Sample Response: 1 point


67
Algebra I
Spring 2017 Item Release
Question 13
Question and Scoring Guidelines

68
Question 13
16734
20512
Points Possible: 1
Content Cluster: Solve systems of equations
Content Standard: Solve systems of linear equations exactly and
approximately (e.g., with graphs), focusing on pairs of linear
equations in two variables. (A.REI.6)
69
Scoring Guidelines
Exemplar Response
151
66
Other Correct Responses
Any equivalent value
For this item, a full-credit response includes:
The correct values (1 point)


71
Algebra I
Spring 2017 Item Release
Question 13
Sample Responses

72
Sample Response: 1 point

73
Notes on Scoring
This response earns full credit (1 point) because it shows two correct
numbers representing a solution of a system of two linear equations
in two variables that can be used to solve this problem.
The sum of two numbers that have a sum of 217 can be written by
the linear equation 𝑥 + 𝑦 = 217, where x represents the first number
and y represents the second number. Two numbers that have a
difference of 85 can be written by the linear equation 𝑥 − 𝑦 = 85.
There are many ways to solve systems of equations. One method is
to use the elimination method to add the equations and eliminate
one variable:
𝑥 + 𝑦 = 217 + 𝑥 − 𝑦 = 85 2𝑥 + 0 = 302
This simplifies to 2𝑥 = 302. By dividing each side by 2, 2𝑥
2=
302
2, the
result is 𝑥 = 151. Then, substitute 151 in for x in the first equation to
get 151 + 𝑦 = 217. After subtracting 151 from both sides to get
151 − 151 + 𝑦 = 217 − 151, y is found to equal 66. Therefore, the two
numbers are 151 and 66.

74
Sample Response: 1 point

75
Notes on Scoring
This response earns full credit (1 point) because it shows two correct
numbers representing a solution of a system of two linear equations
in two variables that can be used to solve this problem.
The sum of two numbers that have a sum of 217 can be written by
the linear equation 𝑥 + 𝑦 = 217, where x represents the first number
and y represents the second number. Two numbers that have a
difference of 85 can be written by the linear equation 𝑥 − 𝑦 = 85.
There are many ways to solve systems of equations. One method is
to use the elimination method to add the equations and eliminate
one variable:
𝑥 + 𝑦 = 217 + 𝑥 − 𝑦 = 85 2𝑥 + 0 = 302
This simplifies to 2𝑥 = 302. By dividing each side by 2, 2𝑥
2=
302
2, the
result is 𝑥 = 151. Then, substitute 151 in for x in the first equation to
get 151 + 𝑦 = 217. After subtracting 151 from both sides to get
151 − 151 + 𝑦 = 217 − 151, y is found to equal 66. Therefore, the two
numbers are 66 and 151, or 151 and 66. It does not matter which
number goes into which box.
76
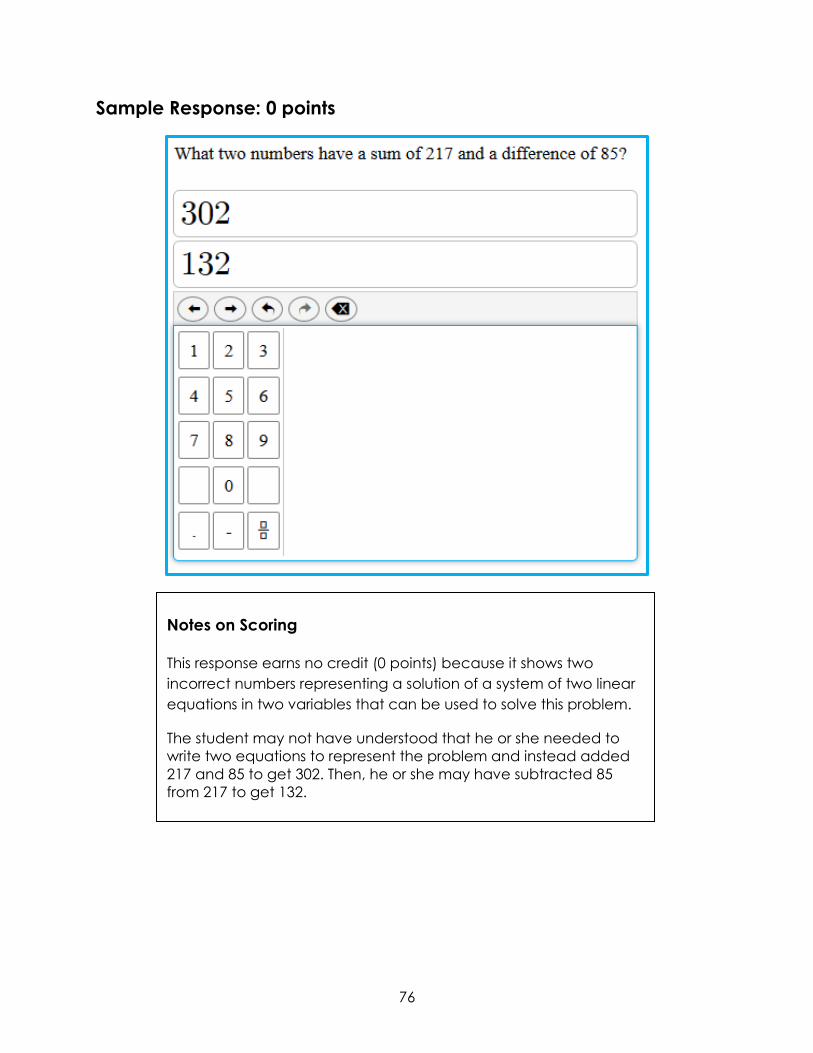
Sample Response: 0 points
Notes on Scoring
This response earns no credit (0 points) because it shows two
incorrect numbers representing a solution of a system of two linear
equations in two variables that can be used to solve this problem.
The student may not have understood that he or she needed to
write two equations to represent the problem and instead added
217 and 85 to get 302. Then, he or she may have subtracted 85
from 217 to get 132.

77
Sample Response: 0 points
Notes on Scoring
This response earns no credit (0 points) because it shows two
incorrect numbers representing a solution of a system of two linear
equations in two variables that can be used to solve this problem.
The student may have misread the problem and found two
numbers whose sum is 207, instead of 217, and whose difference is
85.


79
Algebra I
Spring 2017 Item Release
Question 14
Question and Scoring Guidelines

80
Question 14
16735
20512
Scoring Guidelines
Exemplar Response
2.5𝑥 + 5𝑦 + 5.7𝑧 = 75
Other Correct Responses
Any equivalent equation
For this item, a full-credit response includes:
The correct equation (1 point)
Points Possible: 1
Content Cluster: Create equations that describe numbers or
relationships
Content Standard: Create equations in two or more variables to
represent relationships between quantities; graph equations on
coordinate axes with labels and scales. (A.CED.2)

81
Algebra I
Spring 2017 Item Release
Question 14
Sample Responses

82
Sample Response: 1 point
Notes on Scoring
This response earns full credit (1 point) because it shows a correct
equation to represent the relationships between quantities.
The mass of each coin type is equal to the mass of the coin times
the number of coins. Since x is the number of pennies, the mass of
all the pennies is represented by 2.5x. Since y is the number of
nickels, the mass of all the nickels is represented by 5y. Since z is the
number of quarters, the mass of all the quarters is represented by
5.7z. The mass of all the pennies plus the mass of all the nickels plus
the mass of all the quarters equals the total mass of all the coins,
which is 75, so 2.5𝑥 + 5𝑦 + 5.7𝑧 = 75 is an equation that models the
situation.

83
Sample Response: 1 point
Notes on Scoring
This response earns full credit (1 point) because it shows a correct
equation to represent the relationships between quantities.
The mass of each coin type is equal to the mass of the coin times
the number of coins. Since x is the number of pennies, the mass of
all the pennies is represented by 2.5x. Since y is the number of
nickels, the mass of all the nickels is represented by 5y. Since z is the
number of quarters, the mass of all the quarters is represented by
5.7z. The mass of all the pennies plus the mass of all the nickels plus
the mass of all the quarters equals the total mass of all the coins,
which is 75, so 2.5𝑥 + 5𝑦 + 5.7𝑧 = 75 is an equation that models the
situation. The equation can also be written as 75 = 2.5𝑥 + 5𝑦 + 5.7𝑧.

84
Sample Response: 0 points
Notes on Scoring
This response earns no credit (0 points) because it shows an
incorrect equation to represent the relationships between
quantities.
The student knew that he or she needed to add the three types of
coins to get the combined mass of all the coins but did not take
into account the mass of each coin.

85
Sample Response: 0 points
Notes on Scoring
This response earns no credit (0 points) because it shows an
incorrect equation to represent the relationships between
quantities.
The student knew that he or she needed to add the mass of each
of the three types of coins to get the combined mass of all the
coins. However, the student assigned the wrong masses to the
pennies and quarters.


87
Algebra I
Spring 2017 Item Release
Question 15
Question and Scoring Guidelines

88
Question 15
16736
20512
Scoring Guidelines
Exemplar Response
𝑓(𝑛) = 80 3𝑛
Other Correct Responses
Any equivalent function
For this item, a full-credit response includes:
A correct function (1 point)
Points Possible: 1
Content Cluster: Construct and compare linear, quadratic, and
exponential models and solve problems
Content Standard: Construct linear and exponential functions,
including arithmetic and geometric sequences, given a graph, a
description of a relationship, or two input-output pairs (include
reading these from a table). (F.LE.2)

89
Algebra I
Spring 2017 Item Release
Question 15
Sample Responses
90
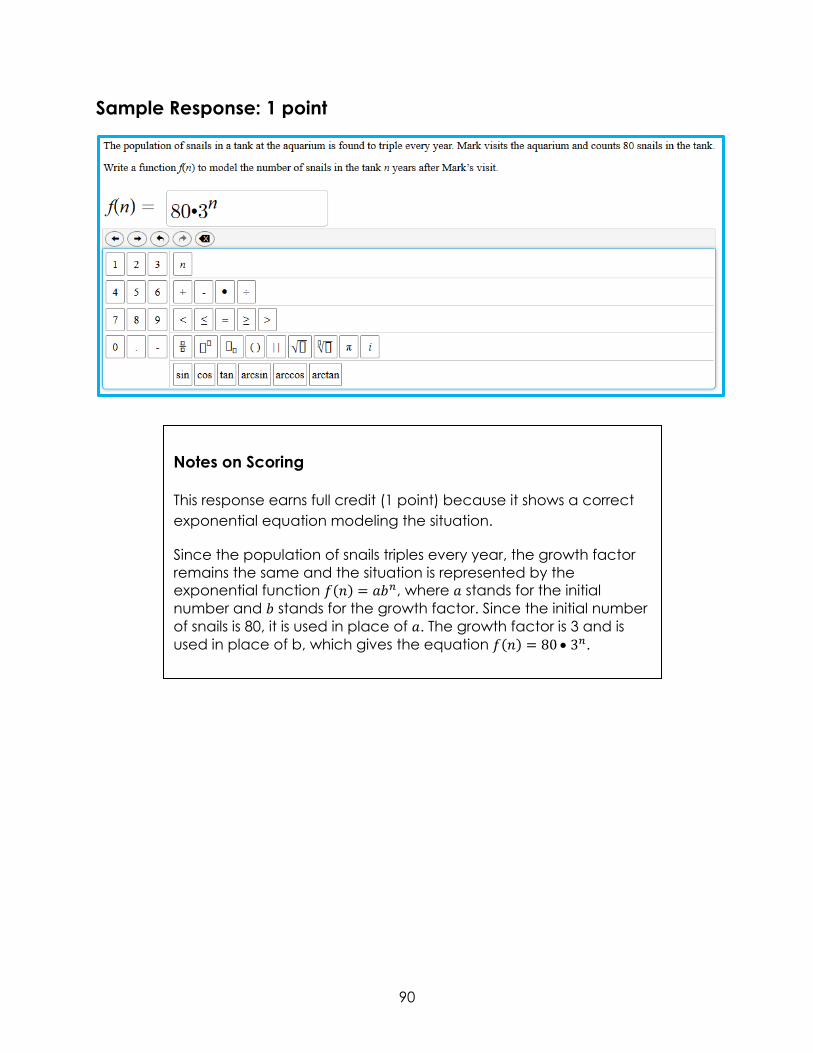
Sample Response: 1 point
Notes on Scoring
This response earns full credit (1 point) because it shows a correct
exponential equation modeling the situation.
Since the population of snails triples every year, the growth factor
remains the same and the situation is represented by the
exponential function 𝑓(𝑛) = 𝑎𝑏𝑛, where 𝑎 stands for the initial
number and 𝑏 stands for the growth factor. Since the initial number
of snails is 80, it is used in place of 𝑎. The growth factor is 3 and is
used in place of b, which gives the equation 𝑓(𝑛) = 80 3𝑛.

91
Sample Response: 1 point
Notes on Scoring
This response earns full credit (1 point) because it shows a correct
exponential equation modeling the situation.
Since the population of snails triples every year, the growth factor
remains the same and the situation is represented by the
exponential function 𝑓(𝑛) = 𝑎𝑏𝑛, where 𝑎 stands for the initial
number and 𝑏 stands for the growth factor. Since the initial number
of snails is 80, it is used in place of 𝑎. The growth factor is 3 and is
used in place of b, which gives the equation 𝑓(𝑛) = 80 3𝑛. The
equivalent equation of 𝑓(𝑛) = 3𝑛 80 is also a correct answer
because of the Commutative Property of Multiplication.

92
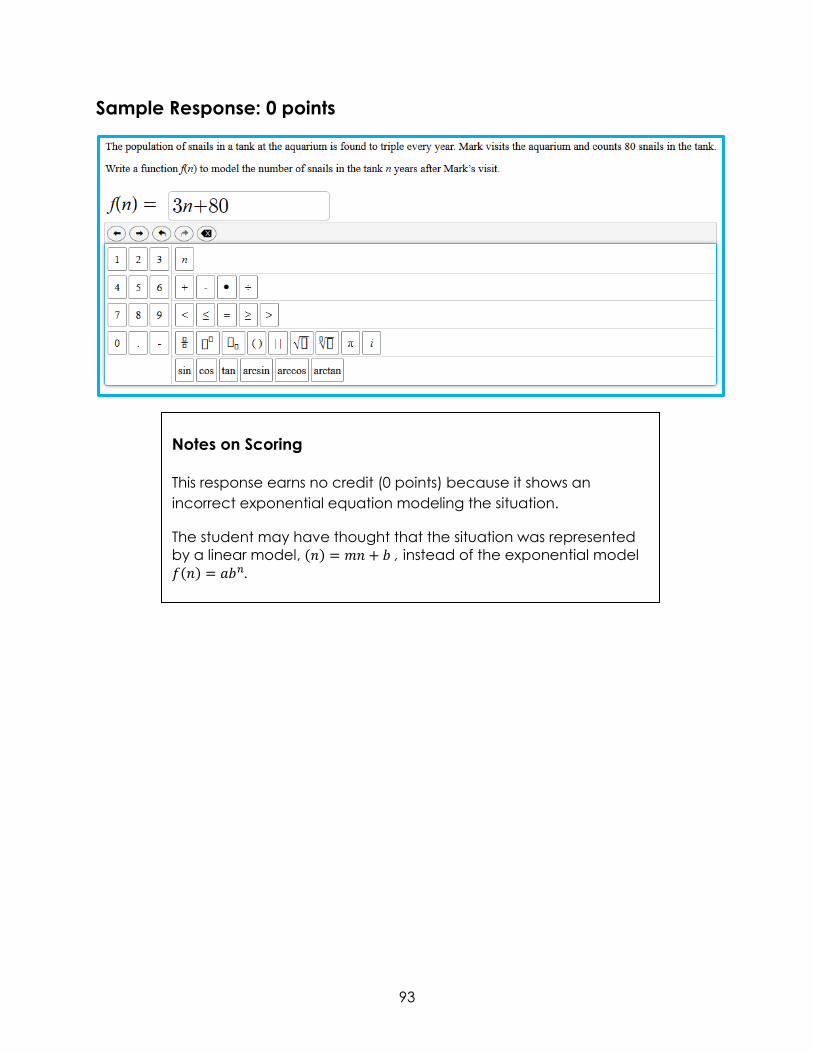
Sample Response: 0 points
Notes on Scoring
This response earns no credit (0 points) because it shows an
incorrect exponential equation modeling the situation.
The student may have confused the form of an exponential
equation, 𝑓(𝑛) = 𝑎𝑏𝑛, where 𝑎 stands for the initial number and 𝑏
standards for the growth factor, with a form of a linear equation.
93
Sample Response: 0 points
Notes on Scoring
This response earns no credit (0 points) because it shows an
incorrect exponential equation modeling the situation.
The student may have thought that the situation was represented
by a linear model, (𝑛) = 𝑚𝑛 + 𝑏 , instead of the exponential model
𝑓(𝑛) = 𝑎𝑏𝑛.


95
Algebra I
Spring 2017 Item Release
Question 16
Question and Scoring Guidelines

96
Question 16
16737
*An asterisk appears next to any standard or group of standards linked with Modeling as a conceptual category.
Points Possible: 2
Content Cluster: Interpret functions that arise in applications in terms of the
context
Content Standard: For a function that models a relationship between two
quantities, interpret key features of graphs and tables in terms of the
quantities, and sketch graphs showing key features given a verbal description
of the relationship. Key features include: intercepts; intervals where the
function is increasing, decreasing, positive, or negative; relative maximums
and minimums; symmetries; end behavior; and periodicity.* (F.IF.4)

97
Scoring Guidelines
Score Point Description
2 points Response includes the following correct Initial
Position with a correct Maximum Speed.
Initial Position:
a) Train B is closer to Columbus than Train A at
6:00 a.m.
Maximum Speed:
b) Since the speed of an object is measured by
dividing the distance the object travels by
the time it takes the object to travel that
distance, the speed of each train is the
slope of each train’s graph. Tom is correct
since the graph of each train has the same
slope when both trains are moving.
1 point Response includes the correct Initial Position listed
above with an incorrect or missing Maximum
Speed or vice versa.
0 points The response does not meet the criteria required to
earn one point. The response indicates inadequate or
no understanding of the task and/or the idea or
concept needed to answer the item. It may only
repeat information given in the test item. The response
may provide an incorrect solution/response and the
provided supportive information may be irrelevant to
the item, or possibly, no other information is shown.
The student may have written on a different topic or
written, “I don’t know.”


99
Algebra I
Spring 2017 Item Release
Question 16
Sample Responses

100
Sample Response: 2 points

101
Notes on Scoring
This response earns full credit (2 points) because it shows a correct
interpretation of the graphs of two functions in terms of the context.
A. The graph shows that Train A begins its trip at 1,800 miles and
Train B begins its trip at 1,200 miles from Columbus. Therefore, Train B
is closer to Columbus than Train A by 600 miles (1800 − 1200 = 600) .
B. The y-value of each point on the line on the grid represents the
train’s remaining distance to Columbus. The slope (the rate of
change) of each line represents the speed of the corresponding
train. Because lines are parallel over the certain interval of time,
their slopes are equal and the trains travel with equal speeds over
that interval of time.
There is an interval on the graph between 1:00 p.m. and 6:00 p.m.
where both lines are parallel, so the trains have the same speed
over that interval. Therefore, Tom is correct that both trains traveled
the same speed over a certain interval of time. Sara is incorrect.
She may have thought that since Train A arrives to Columbus first, it
went faster than Train B.

102
Sample Response: 2 points

103
Notes on Scoring
This response earns full credit (2 points) because it shows a correct
interpretation of the graphs of two functions in terms of the context.
A. The graph shows that Train A begins its trip at 1,800 miles from
Columbus and Train B begins its trip at 1,200 miles from Columbus.
Therefore, Train A is farther from Columbus than Train B by 600 miles
(1800 − 1200 = 600).
B. On the graph, the speeds of the trains are represented by the
slopes of the lines. The line representing the remaining distance of
Train A has a constant slope, which can be calculated by
|(1200−1800)
(10:00 a.m.−6:00 a.m.) | and is equivalent to |
−600
4 | , which simplifies to 150
miles per hour. Since the graph representing Train B is a horizontal
line from 6:00 a.m. to 1:00 p.m., Train B does not start moving until
1:00 p.m. After 1:00 p.m., Train B has a constant speed (rate of
change), which can be calculated by |(1200−600)
(1:00 p.m.−5:00 p.m.)| or |
600
−4| and
which simplifies to 150 miles per hour. Therefore, Tom is correct that
both trains have the same speed of 150 miles per hour between
1:00 p.m. and 6:00 p.m.

104
Sample Response: 1 point

105
Notes on Scoring
This response earns partial credit (1 point) because it shows only
one correct interpretation of the graphs of two functions in terms of
the context.
A. The student did not answer the first question.
B. The height (y-value) of each line on the grid denotes the train’s
remaining distance to Columbus. The slope (the rate of change) of
each line represents the speed of the corresponding train. Because
lines are parallel over the certain interval of time, their slopes are
equal and the trains travel with equal speeds over that interval of
time.
There is an interval on the graph between 1:00 p.m. and 6:00 p.m.
where both lines are parallel, so the trains have the same speed
over that interval. Therefore, Tom is correct that both trains traveled
the same speed over a certain interval of time. Sara may have
thought that since Train A arrives to Columbus first, it went faster
than Train B.

106
Sample Response: 1 point

107
Notes on Scoring
This response earns partial credit (1 point) because it shows a
partially correct interpretation of the graphs of two functions in
terms of the context.
A. The student is correct that Train A is at a farther distance from
Columbus than Train B. The graph shows that Train A begins its
trip at 1,800 miles and Train B begins its trip at 1,200 miles from
Columbus. Therefore, Train B is closer to Columbus than Train A
by 600 miles (1800 − 1200 = 600).
B. The student is incorrect because he or she confused arrival time
with the speed (slope of a line).

108
Sample Response: 1 point

109
Notes on Scoring
This response earns partial credit (1 point) because it shows a
partially correct interpretation of the graphs of two functions in
terms of the context.
A. The student is correct that Train A is at a farther distance from
Columbus than Train B. The graph shows that Train A begins its
trip at 1,800 miles and Train B begins its trip at 1,200 miles from
Columbus. Therefore, Train A was farther from Columbus than
Train B by 600 miles (1800 − 1200 = 600).
B. The student is incorrect; Train B was not traveling at a slower
speed initially. Instead, Train B was stopped until 1:00 p.m. From 1:00
p.m. until 6:00 p.m., the graphs are parallel, so the trains were
going at the same speeds. Therefore, Tom is correct.

110
Sample Response: 0 points
Notes on Scoring
This response earns no credit (0 points) because it shows an
incorrect interpretation of the graphs of two functions in terms of
the context.

111
Sample Response: 0 points
Notes on Scoring
This response earns no credit (0 points) because it shows an
incorrect interpretation of the graphs of two functions in terms of
the context.

112
Sample Response: 0 points
Notes on Scoring
This response earns no credit (0 points) because it shows an
incorrect interpretation of the graphs of two functions in terms of
the context.

113
Algebra I
Spring 2017 Item Release
Question 17
Question and Scoring Guidelines

114
Question 17
16738
*An asterisk appears next to any standard or group of standards linked with Modeling as a conceptual category.
Points Possible: 1
Content Cluster: Interpret functions that arise in applications in terms
of the context
Content Standard: Relate the domain of a function to its graph and,
where applicable, to the quantitative relationship it describes. For
example, if the function h(n) gives the number of person-hours it
takes to assemble n engines in a factory, then the positive integers
would be an appropriate domain for the function.* (F.IF.5)

115
Scoring Guidelines
Rationale for Option A: This is incorrect. The student may have understood
that this graph represents a function, but confused the domain, the set of
x-coordinates, of all real numbers, with the range, the set of y-coordinates, of
all non-negative real numbers.
Rationale for Option B: This is incorrect. The student may have understood that
the domain is the set of non-negative x-values, but overlooked the fact that
this is not the graph of a function.
Rationale for Option C: Key – The student correctly understood that the graph
satisfies the requirements of a function where each x-coordinate corresponds
to only one y-coordinate and that the domain is represented by the set of
non-negative x-coordinates.
Rationale for Option D: This is incorrect. The student may have understood that
this graph represents a function, but overlooked the fact that the domain, the
set of x-coordinates, is all non-positive real numbers and the range is all non-
negative real numbers.
Sample Response: 1 point

117
Algebra I
Spring 2017 Item Release
Question 18
Question and Scoring Guidelines

118
Question 18
16739
Points Possible: 1
Content Cluster: Represent and solve equations and inequalities
graphically
Content Standard: Understand that the graph of an equation in two
variables is the set of all its solutions plotted in the coordinate plane,
often forming a curve (which could be a line). (A.REI.10)
119
Scoring Guidelines
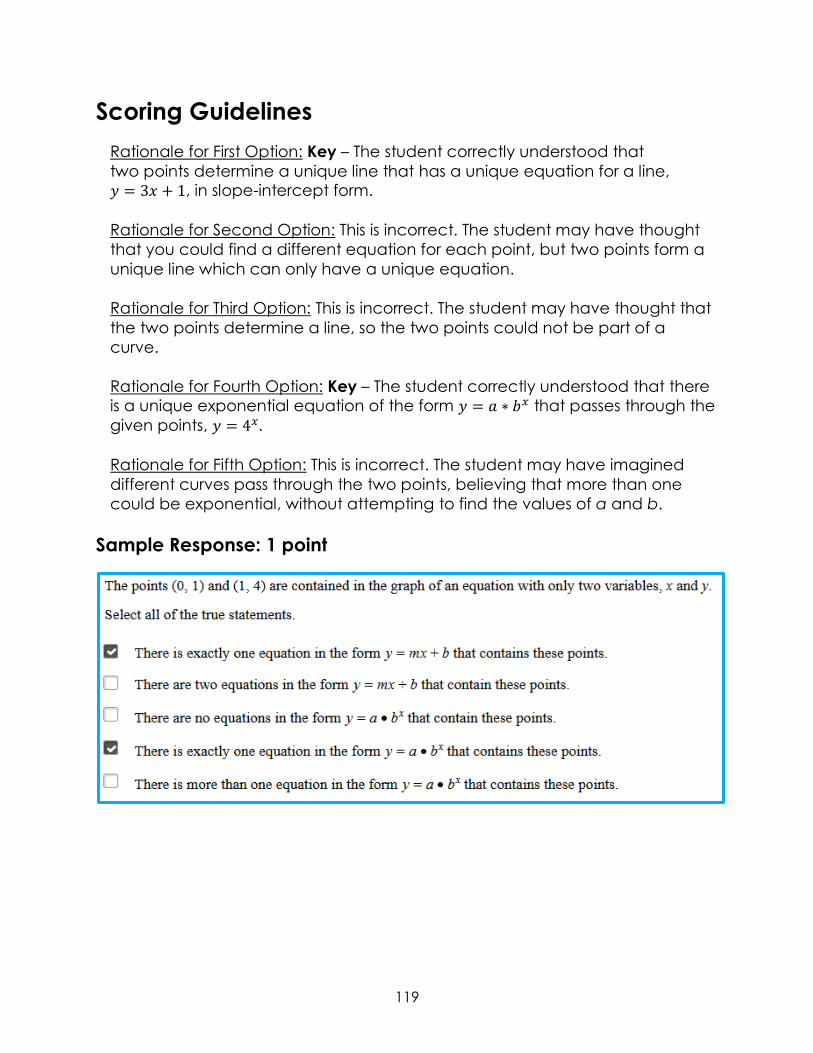
Rationale for First Option: Key – The student correctly understood that
two points determine a unique line that has a unique equation for a line,
𝑦 = 3𝑥 + 1, in slope-intercept form.
Rationale for Second Option: This is incorrect. The student may have thought
that you could find a different equation for each point, but two points form a
unique line which can only have a unique equation.
Rationale for Third Option: This is incorrect. The student may have thought that
the two points determine a line, so the two points could not be part of a
curve.
Rationale for Fourth Option: Key – The student correctly understood that there
is a unique exponential equation of the form 𝑦 = 𝑎 ∗ 𝑏𝑥 that passes through the
given points, 𝑦 = 4𝑥 .
Rationale for Fifth Option: This is incorrect. The student may have imagined
different curves pass through the two points, believing that more than one
could be exponential, without attempting to find the values of a and b.
Sample Response: 1 point


121
Algebra I
Spring 2017 Item Release
Question 19
Question and Scoring Guidelines
122
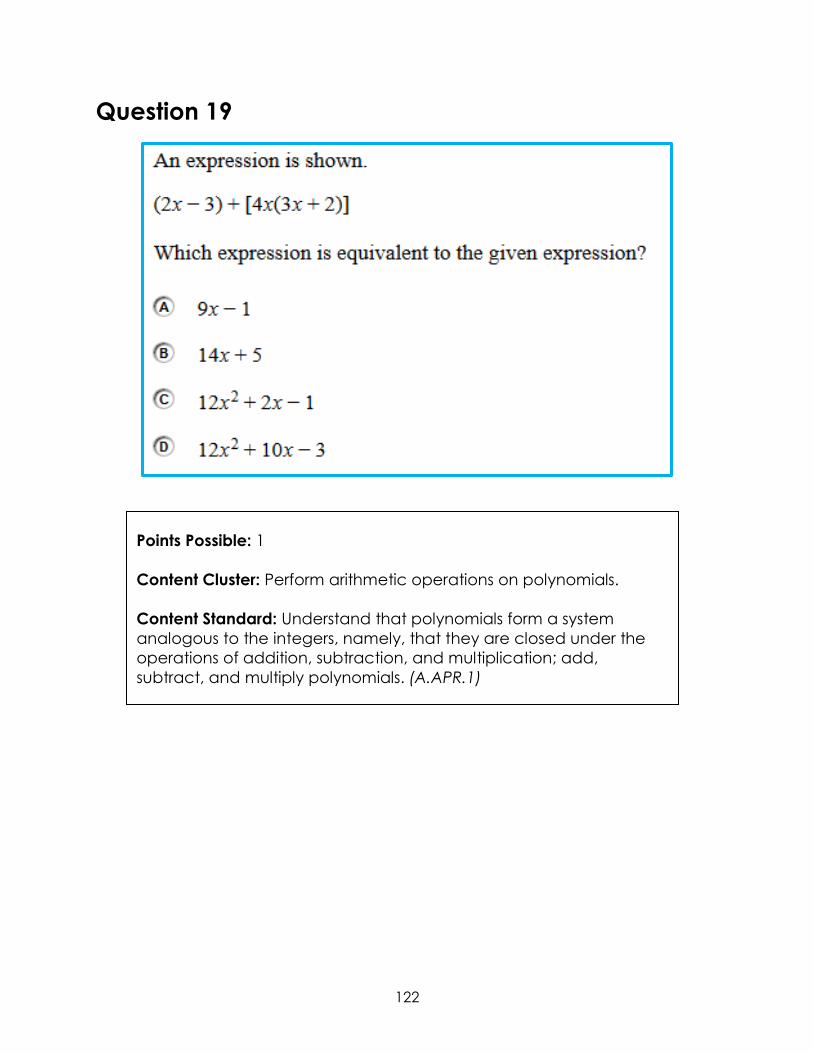
Question 19
16740
Points Possible: 1
Content Cluster: Perform arithmetic operations on polynomials.
Content Standard: Understand that polynomials form a system
analogous to the integers, namely, that they are closed under the
operations of addition, subtraction, and multiplication; add,
subtract, and multiply polynomials. (A.APR.1)

123
Scoring Guidelines
Rationale for Option A: This is incorrect. The student may have added all the
linear terms, 2x, 4x and 3x together, without applying the distributive property,
and then added all the constant terms, –3 and 2, together.
Rationale for Option B: This is incorrect. The student may have distributed the 4
instead of 4x which resulted incorrectly in 2𝑥 − 3 + 12𝑥 + 8 and then combined
like terms.
Rationale for Option C: This is incorrect. The student may have distributed the
4x term only to the 3x term, not the 2, thereby getting (2𝑥 − 3) + (12𝑥2 + 2).
Then after combining like terms, the result would be 12𝑥2 + 2𝑥 − 1.
Rationale for Option D: Key – The student correctly performed operations with
polynomials as (2𝑥 − 3) + [4𝑥(3𝑥 + 2)] = (2𝑥 − 3) + [12𝑥2 + 8𝑥] = 12𝑥2 + 10𝑥 − 3.
Sample Response: 1 point


125
Algebra I
Spring 2017 Item Release
Question 20
Question and Scoring Guidelines
126
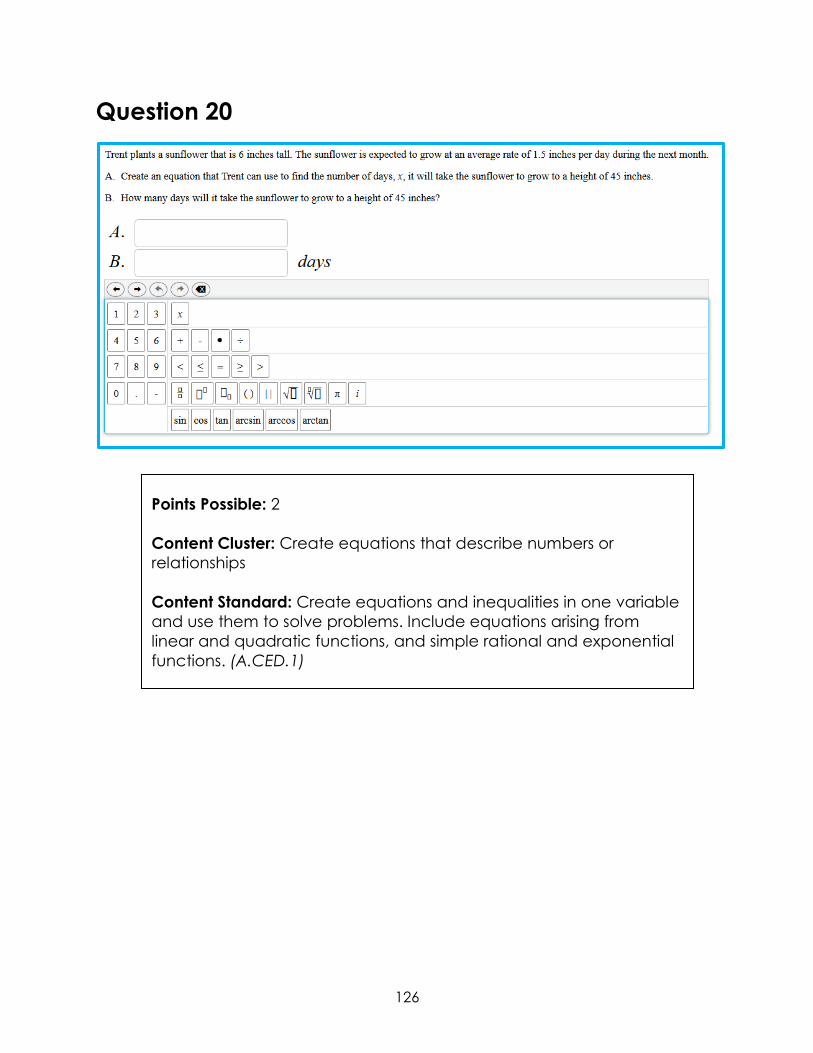
Question 20
16741
20512 Points Possible: 2
Content Cluster: Create equations that describe numbers or
relationships
Content Standard: Create equations and inequalities in one variable
and use them to solve problems. Include equations arising from
linear and quadratic functions, and simple rational and exponential
functions. (A.CED.1)

127
Scoring Guidelines
Exemplar Response
A. 1.5𝑥 + 6 = 45
B. 26
Other Correct Responses
Any equivalent equation for part A except 𝑥 = 26
𝑥 = 26 is also accepted for part B
For this item, a full-credit response includes:
A correct equation (1 point);
AND
The correct value (1 point).


129
Algebra I
Spring 2017 Item Release
Question 20
Sample Responses

130
Sample Response: 2 points
Notes on Scoring
This response earns full credit (2 points) because it shows a correct
linear equation in one variable that describes a relationship and
was used correctly to solve a problem.
A. The situation can be represented by a linear equation because
it has a constant rate of change. One form of a linear equation is
𝑦 = 𝑚𝑥 + 𝑏, where b is the initial height of the plant, m is the
average growth rate, x is the number of growing days, and y is the
total height of the plant. Since the sunflower is already 6 inches tall,
6 would be the initial height, or the b term. The average growth
rate of 1.5 would be the m term. The total plant height of 45 would
be the y term, so the equation is 1.5𝑥 + 6 = 45.
B. To find the number of days that it will take the sunflower to grow
to 45 inches, the equation needs to be solved for x. The first step is
to subtract 6 from each side to get 1.5𝑥 + 6 − 6 = 45 − 6, which
simplifies to 1.5𝑥 = 39. The second step is to divide each side by 1.5,
so 1.5𝑥
1.5=
39
1.5, which results in 26 days.

131
Sample Response: 2 points
Notes on Scoring
This response earns full credit (2 points) because it shows a correct
linear equation in one variable that describes a relationship and
was used correctly to solve a problem.
A. The situation can be represented by a linear equation because
it has a constant rate of change. One form of a linear equation is 𝑦 = 𝑚𝑥 + 𝑏, where b is the initial height of the plant, m is the average growth rate, x is the number of growing days, and y is the
total height of the plant. Since the sunflower is already 6 inches tall, 6 would be the initial height, or the b term. The average growth rate
of 1.5 would be the m term. The total plant height of 45 would be
the y term, so the equation is 1.5𝑥 + 6 = 45.
B. To find the number of days that it will take the sunflower to grow
to 45 inches, the equation needs to be solved for x. The first step is
to subtract 6 from each side to get 1.5𝑥 + 6 − 6 = 45 − 6, which
simplifies to 1.5𝑥 = 39. The second step is to divide each side by 1.5,
so 1.5𝑥
1.5=
39
1.5, which results in 26 days, or 𝑥 = 26 days.

132
Sample Response: 1 point
Notes on Scoring
This response earns partial credit (1 point) because it shows a
correct linear equation in one variable that describes a
relationship, but the equation was solved incorrectly.
A. The situation can be represented by a linear equation because
it has a constant rate of change. One form of a linear equation is
𝑦 = 𝑚𝑥 + 𝑏, where b is the initial height of the plant, m is the
average growth rate, x is the number of growing days, and y is the
total height of the plant. Since the sunflower is already 6 inches tall,
6 would be the initial height, or the b term. The average growth
rate of 1.5 would be the m term. The total plant height of 45 would
be the y term, so the equation is 1.5𝑥 + 6 = 45.
B. The student solved the equation incorrectly. When solving the
equation, the student may have added 6 to both sides, instead
of subtracting 6, to get 1.5𝑥 + 6 + 6 = 45 + 6, which simplifies to
1.5𝑥 = 51. Then, the student may have divided each side by 1.5 to
get 1.5𝑥
1.5=
54
1.5, which incorrectly resulted in 34 days.

133
Sample Response: 1 point
Notes on Scoring
This response earns partial credit (1 point) because it shows a
correct linear equation in one variable that describes a
relationship, but the equation was solved incorrectly.
A. The situation can be represented by a linear equation because
it has a constant rate of change. One form of a linear equation is
𝑦 = 𝑚𝑥 + 𝑏, where b is the initial height of the plant, m is the
average growth rate, x is the number of growing days, and y is the
total height of the plant. Since the sunflower is already 6 inches tall,
6 would be the initial height, or the b term. The average growth
rate of 1.5 would be the m term. The total plant height of 45 would
be the y term, so the equation is 1.5𝑥 + 6 = 45.
B. The student solved the equation incorrectly. To find the number
of days that it will take the sunflower to grow to 45 inches, the
equation needs to be solved for x. The first step is to subtract 6 from
each side to get 1.5𝑥 + 6 − 6 = 45 − 6, which simplifies to 1.5𝑥 = 39. However, then the student may have multiplied the right side by
1.5, instead of dividing the both sides by 1.5, to get an incorrect
response of 39(1.5) = 58.5.

134
Sample Response: 1 point
Notes on Scoring
This response earns partial credit (1 point) because it shows an
incorrect linear equation in one variable that describes a
relationship, but it uses the equation correctly to solve a problem.
A. The student created an incorrect equation. He or she may have
not realized that 6 inches represents the initial height in the
equation. The equation should be 1.5𝑥 + 6 = 45.
B. The student correctly solved his or her equation for x by dividing
45 by 1.5 to get 30 days.

135
Sample Response: 1 point
Notes on Scoring
This response earns partial credit (1 point) because it shows an
incorrect linear equation in one variable that describes a
relationship, but it uses the equation correctly to solve a problem.
A. The student created an incorrect equation. He or she may have
subtracted the initial height of the plant instead of adding it to the
daily growth of the plant. The equation should be 1.5𝑥 + 6 = 45.
B. The student correctly solved his or her equation for x by adding 6
to both sides of the equation 1.5𝑥 − 6 + 6 = 45 + 6 to get 1.5𝑥 = 51.
Then, he or she correctly divided each side by 1.5 to get 1.5𝑥
1.5=
51
1.5,
which results in 34 days.

The Ohio Department of Education does not discriminate on the basis of race, color, national origin, sex, religion, age, or disability in employment or the provision of services.
Copyright © 2017 by the Ohio Department of Education. All rights reserved.