Embed Size (px)
Citation preview

Ohio ROM ReportsOhio ROM ReportsOhio ROM ReportsOhio ROM Reports1
Ter r y MooreUniversity of KansasUniversity of Kansas
School of Social Welfare

Background
Ohio DJFS, in partnership with Casey Family Programs, l d hi l d li i i l d
2
selected ROM Reports as a vehicle to deliver critical data to DHS staff About ROMAbout ROM
ROM - Results Oriented ManagementProject started by University of Kansas School of Social Welfare
Started out of federal projects to train child welfare staff to use data Started out of federal projects to train child welfare staff to use data and increase state analytic capacity Responded to need for making data more accessible throughout an agency for improving outcomes for children and families
ROM training and ROM Reports
ROM Reports is a web-based reporting application Working agencies in 9 statesWorking agencies in 9 states

Today’s ObjectivesToday s Objectives
Able to navigate the reports system
3
Getting in, out and around the report system Access different reportsChange parameters of reports (e.g., time period, unit, filters) U d d i il bl Understand views available
Understand how the report measures are definedUnderstanding the data – using report labels, legend, and Help
h d fi d d i dKnow how cases are defined and assigned Become familiar with management reports in ROMBecome familiar with federal outcome measures
G i b tt d t di t ’ Gain a better understanding your county’s performance across measures Understanding the road ahead for using data
It’s a developmental process

Expectations of New Reporting System
Expect wrong dataG tti thi i ht i th t t k ti
4
Getting everything right is a process that takes time Think in terms of 6-12 months shake out
Problems may be at data entry, extracting data, or computing measures
It takes practice It takes practice Complicated measures Lots of flexibility of report system
Be part of the solution pReport wrong data Suggest improvements – labels, definitions, other reports, changes in how things are presented or calculatedS k h l i d t di t Seek help in understanding reports
Ultimately the reports should inform – be useful Let it be known how this can best happen
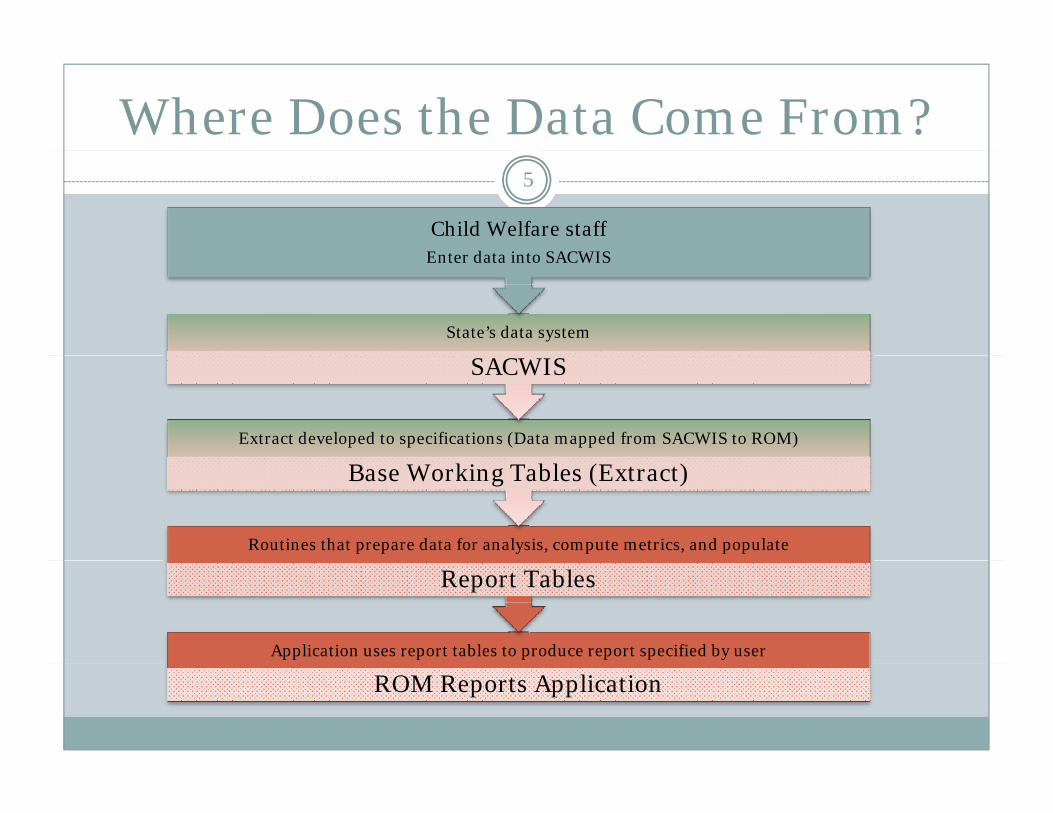
Where Does the Data Come From?
Child Welfare staffE t d t i t SACWIS
5
State’s data system
Enter data into SACWIS
Extract developed to specifications (Data mapped from SACWIS to ROM)
SACWIS
Routines that prepare data for analysis, compute metrics, and populate
Base Working Tables (Extract)
Application uses report tables to produce report specified by user
Report Tables
ROM Reports Application

About Ohio ROM Reports
Data source is the Ohio SACWIS system
6
y
Secured severCurrently reports are accessed on ODJFS server
Secure (https) server
Schedule for updating data –C tl d d b t i d ti i htlCurrently as needed but in production nightly
Amount of history 4 years – starting with children in care anytime after April 1 4 years – starting with children in care anytime after April 1, 2008
Reports system administered by ODJFS

Getting to the ROM
Browsers
7
Internet Explorer 7 or later IE-6 is possible but has problems
Fi fFirefox
Google Chrome
URL URL
Login Username
Password

ROM Reports: Hands-On
G O T O R O M R E P O R T S
p8
G O T O R O M R E P O R T S

Overview and Navigation 9
g

Login
Forgot Password?
10
g
Set new password - strong password rules
Other Rules Password expires in 60 days with a warning message starting 14 days before the password expires
M i l d il d b dMust wait at least 15 days until a password can be reused.
Must also change their password 3 different times before a password can be reused.p
Users have three attempts to login before their account is temporarily disabled.

My Home
Welcome with user’s name
11
News and Notices Changes in reports
New reports or features
Agency announcements Director message Director message
Reaching benchmarks or goals
Training
Report Header (top blue banner)
Report system name and state logo
12
p y g
User name
Logout g
Data current through
Main menu (mouse over)( )My Reports
Resources
Contact Us
Help

My Reports
My Reports – your customized report menu
13
y p y pDefault - get all of the reports (in All Reports)
To set up My Reports (add or delete reports off of My Reports) on All Reports page
Click on All Reports tab
Select or deselect checkbox in front of report Select or deselect checkbox in front of report
Save Selected Reports

My Reports Menu
Three columns
14
Measure categories Report measures grouped into categories
Report measure (link) Reunification in 12 months (of those reunified)
E l i f h Explanation of the measure
Accessing My ReportsReport toolboxReport toolbox
Main menu

Overview of Reports
CFSR Federal reports
15
OutcomesVisitation
Management Reports g pAlternative outcome reports Countdown reports Descriptive reports Descriptive reports
Case countsLevel of care Discharges Discharges
CompliancePending
Summary reports Summary reports

Overview of Reports Screen
Report header – describes the report measure
16
p p
Graph – displays met outcome or other descriptive data from the table
Two lines available for goals for outcomes
Data table - presents the data (numbers and percent) and enables drilldown to the case level enables drilldown to the case level
Legend – defines the labels used in the table
Views – provides different views of the data Views provides different views of the data
Toolbar and Toolboxes – sets parameters for the reports

Using the Main Controls17
g

Data Table Contents
Rows in typical outcome report table (# and %)Met the outcome was met
18
Met – the outcome was met Example: Reunified in less than 12 mos
Not Met - outcome not met Example: Reunified in 12 mos or more
Total n mber of children in the denominator of meas re (“Met” pl s “Not Total – number of children in the denominator of measure (“Met” plus “Not met”)Cohort label – Dates used to select children for the report
Grouped – can break down met and not met to finer categories Contents
Numbers and Percents
Blue numbers – clickable for drilldownRow labels sorts data ascending or descendingRow labels – sorts data ascending or descendingDrilldown to that group of children
Pick one Pick one -- describe it describe it –– click on it click on it

Drilldown
<Click on blue numbers for case specific data>d h f h l d
19
Generates a spreadsheet for the cases you selected Detailed data for each child – drilldown fields (can change)Sort columns
Cli k f di d li k i f d di Click once for ascending and click again for descending Data dictionary Save spreadsheet
Be Careful!!! Privacy only put on password protected or encrypted Be Careful!!! Privacy – only put on password protected or encrypted drives Open or save – do what you can do Parameters – settings are on second sheet in Excel
Data Display setting for the amount of data from most (full) to least (case)Getting back to the report (click on the view you were on)

Toolbar / Toolboxes Overview
General rule – changes made in the Toolboxes stay
20
Reports Selecting new reports
Unit Level Unit Level By management hierarchyPick from top to bottom
Time Period Time Period Set start and end dates
Data Display Controls for how the data are displayed in the report Controls for how the data are displayed in the report Different options depending on the report
Filters Up to 5 quick filtersUp to 5 quick filtersDetailed filter tools (more detail later )
Toolboxes: Reports
Navigating to other Reports b d
21
Current report being viewed
Related reports
Most recent reports Most recent reports
Other functions Generate direct link for this pagep g
Print Reports

Toolboxes: Unit
Unit Level h h
22
By management hierarchy
Pick from top to bottom
Mutually exclusive hierarchy (levels) Mutually exclusive hierarchy (levels) Case is assigned a
Worker who reports to ap
Supervisor who is assigned to an
Manager that is within a
A hi h i f Agency which is part of a
County which is part of the
State State

Unit Level: Ohio Management Levelsg
Statewide
23
Agency
Managerg
Supervisor
Worker

Practice Questions 24

Toolboxes: Time Period25
Start Date
End Date
Effective Date in Ohio – April 1, 2008?? p ,

Practice Questions 26
Toolboxes: Data Display 27
Controls for how the data are displayed in the report p y p
Different options depending on the report
Main options pCompare Time Periods By - Month, quarter, semi, etc.
Display type in graph – percent or counts
i l i bl G d dDisplay type in table – Grouped or Ungrouped
Data Orientation – Standard or Inverted
Select a drilldown display option – for Crosstab Select a drilldown display option for Crosstab

Practice Questions 28

Toolboxes: Other 29
Filters – talk more about laterUp to 5 quick filters
Detailed filter tools (more detail later )
Screen ControlsCollapse or expand toolboxes
Show Full Screen Show ToolbarShow Full Screen – Show Toolbar
Help with Toolboxes

Practice Questions 30

Primary Views
Trend – over time changes in outcomes
31
g
Unit – comparison between management units for a particular Report Time Period
Uses unit value in the toolbox and shows the units underneath
Crosstab – analyze outcome by available variablesl i bl i b i lbSelect variable in Crosstab Settings Toolbox
Range of variables (can change) Client characteristicsClient characteristics
Geographic areas
Case information (e.g. time in care, case plan goal, TPR)
ROM Views Types
Views available vary by Report and Measure type B t i d
32
By report periodTrend: Per Report Period – for each separate report period in reportUnit: In Time Period – for whole Time Period specifiedCrosstab: In Time Period for whole Time Period specified Crosstab: In Time Period – for whole Time Period specified
Annualized – each data point represents a year (rolling year based on end of report period)
Trend: Annualized – each report period is a rolling year Trend: Annualized each report period is a rolling year Unit: Annualized – the year of the last full month in the Time PeriodCrosstab: Annualized – same as Unit
Cumulative – each data point is cumulative for fiscal yearp yTrend: Cumulative – shows cumulative results by report periodUnit: Cumulative – shows most recent month in Time Period Crosstab: Cumulative – same as Unit

Practice Questions 33

Filters
Filters
34
Quick filters (up to 5 set by the State)
Clear filters
Fil M filFilter status Manage filters
Setting a filter by type Pick list (only one value) – ones used for Quick Filters( y ) Q
List (more than one hold control key down)
Select value (e.g. Current Age)
Save Filters and ReturnSave Filters and Return

Practice Questions 35

Odds and Ends
Main Menu – in blue section
36
My Reports
Resources
C U Contact Us
HelpAbout Page g
Report Definitions
My Settings
Change password
37
g p
Set DefaultsUnit Level
View and time period
Drilldown option – amount of data one received in drilldown

Review
Navigating S l ti t
38
Selecting reports Resources - help to resources
Customizing your report tool Your level Your level Your reports
Reading reports Selecting views Selecting views
Changing parameters UnitTime
Analysis CrosstabFilters

U d t di R t Understanding Report Measures
39

ROM Core Measures/Indicators
19 Federal measures
40
92 safety measures
15 outcome indicators
i i i i di2 visitation indicators
Federal measures have been positively oriented except for Median measures – the ones changed were g
1.4 Re-entry – ROM changed it to “maintaining reunification”
3.3 Emancipated or age out were discharged in over three years, ROM changed to under three years ROM changed to under three years
17 other management reports
Others may be developed Ot e s ay be de e oped

The most difficult part of using ROM is understanding the measures g
Some of the Federal measures are complex
41
pThey construct the measures differently
To understand what the data is saying one needs to understand how the measure is constructed
Management always looking at what (policies, practice, people) is impacting outcomes in order to focus improvement people) is impacting outcomes in order to focus improvement efforts
ROM provides information on the screen to help the user know how the measure is constructed
We will provide more information later on measure construction and types construction and types

Understanding the Data and Measures
Report header
42
Report title (note all denominators are in parenthesis) Report sub-title Report time period – the effective date of report Report time period the effective date of report
Data Table Row and column labels in table Cohort – event and time parameter in last row in the table
Legend All rows in the table defined All rows in the table defined
Help Report Definitions p

Tips for Understanding a Report Measure
First, look at the population (denominator) L b l d “T l” i h d bl (l k l d)
43
Labeled “Total” in the data table (look at legend) Case status and when (look at last row in table)
The status of the case, examples:Reunified Reunified entered care in a certain length of time ago in care 17+ months on first day of fiscal year
Report period in which children are included in the cohort p p
Second, look at the criteria for meeting the outcome (of those children in the denominator)
Reunified in 12 monthsAdopted within 12 months of TPR Permanency in 12 months Under 2 placement settings during time in care

Federal Removal Episodes
Data captures all removal episodes (spells)
44
p p ( p )Removal and Discharge
AFCARS only captures the last removal episode
Federal Removal Episode Starts with Federal Removal Date
Date the child starts first out of home placement - some special rulesDate the child starts first out of home placement some special rules
Ends with Federal Discharge Date Date upon which legal custody ended or
6 th f ll i th hild t i h hi h 6 months following the child returning home, whichever comes first
NOTE: child could still be in custody and in an open case
Practice Questions 45

Rules for Assigning Case Outcomes
Open Cases - assignment is made on the last day in the report period (month)
46
period (month) Example: Placement Stability 2 or fewer placement settingsExample: Level of care
Discharged Cases – assignment is made at the time of federal Discharged Cases assignment is made at the time of federal discharge
Example: Reunification in 12 mos. - assigned to hierarchy in place at the time of reunification
End of observation period – assignment made at the end of observation period for entry cohort measures
Example: Adopted in less than 12 months of TPR (of those TRP 12 months ago) months ago) Example: Reunified in 12 months (of 1st time removals)
Other Recurrence of maltreatment assigned as of date investigation completedRecurrence of maltreatment assigned as of date investigation completed

Terms
Permanency When children are discharged to either reunification (including other
47
When children are discharged to either reunification (including other relatives), adoption, or guardianship
CohortsA term used to refer to a group of children upon which the indicator g p pis based The denominator for a measure
Report Period Th i d f i h i h The period of time shown in the report
in trend view the month or quarter data are provided, in unit/crosstab the time the report is based upon a period of time within the Time Period
Time Period The period of time selected in the Control Panel toolbox that impacts the data shown
Report Time PeriodReport Time PeriodThe effective time period upon which a report is based
ROM Management Reportsg p48

Management Reports: Caseloads
Caseload Counts (foster care) on first day of month
49
( ) yOut-of-home or trial home visit
Entries and exits – (on chart y-axis to the right)
Caseload Counts (in care 17+ months)Without TPR, with TPR or in adoptive placement
i d i iEntering and exiting status Entered 17th month (during period)
Discharged to permanency (during period) Discharged to permanency (during period)
Discharged no permanency (during period)

Management Reports: Descriptive
Descriptive point in time (last day of the month)
50
p p ( y )Level of Care (of those in care)
Length of Stay (for those in care)
Descriptive during report period Discharge Reason (of those discharged)

Practice Questions 51

CPS Indicators52
Report Conclusions (of conclusions made) p ( )
Investigations Completed within 30 days (of reports received 30 days ago)
Initial Face-to-Face Contact within 24 hours (of accepted reports)
Pending Investigations (of accepted not completed reports)

Practice Questions 53

Worker-Child Visits54
Two federal measures - outgoing g gCaseworker visits every full mo. (in care 1+ mo. In Federal FY)
Visit Mos with in-home (for visit mos of those visited every month)month)
Monthly Worker-Child Visitation (of those in care the entire month) – in ROM but revisions pending the entire month) in ROM but revisions pending
Worker-Child Visitation Pending/Completed (those in care start of current month) )

Practice Questions 55
Other Management Report Types (part 3)
Permanency in 12 months / 24 months
56
y / 4Entry cohort
Permanency is reunification, adoption, guardianship, other relative relative
No Re-entry into Custody (of those discharged 12 months ago)months ago)
Entry cohort – entering discharged status (any discharge type)
Similar to federal measure except the federal measure only l k h ld h d h d flooks at children who were discharged to reunification

Practice Questions 57

Permanency Indicators: Countdown
Countdown to Permanency (of those entered care
58
y (in last 24 months)
by # months ago child entered care
Countdown to TPR (of those starting 17th month in last 24 mos)
hBy # months ago child started their 17th month
Countdown to Adoption/other Permanency (those given TPR in last 24 mos)given TPR in last 24 mos)
By # months ago child became free for adoption

Practice Questions 59

F d l O t M Federal Outcome Measures (Typology)
I F T I M E A L L O W S
( yp gy)60
I F T I M E A L L O W S

Summary of Federal Measures By Measure Type
Federal Composites/Indicators
Measure(with Federal Measure number)
Exit Cohort
Entry Cohort
Single Day Back
Cohort
During Time
Cohort
Composite 1:Timeliness and permanency of reunification
1.1: Reunification in 12 months (of those reunified)X
1.2: Median Moss to Reunification (of those reunified) X
1.3: Reunification in 12 months of Entry (of 1st time removals 12 mos ago) Ver-2
1.4: Maintain reunification (no re-entry) 12 months V 1a ta eu cat o ( o e e t y) o t s(of those reunified 12 mos ago) Ver-1
Composite 2:
2.1: Adopted in less than 24 months (of those adopted) X
2.2: Median Months to Adoption (of those adopted) X
2.3: Adopted within last 12 Months (of those in care 17+ mos as of 12 mos ago) Xp
Timeliness of Adoptions17+ mos as of 12 mos ago)2.4: Legally freed for adoption within last 6 months (of those in care 17+ mos not PRT 6 months ago) X
2.5: Adopted in less than 12 months of TPR (of those TPR 12 months ago) Ver-1
3.1: Exited to permanency prior to 18th birthday (of
Composite 3:Achieving permanency for children in foster care for long periods of time
those in care 24+ mos. as of 12 months ago) X
3.2: Permanency achieved (of those free for adoption and discharged) X
3.3: Emancipated but were in care less than 3 years (of those emancipated) X
4 1: Placement stability: 2 or fewer placements (of
Composite 4:Placement stability
4.1: Placement stability: 2 or fewer placements (of those in care under 12 mos) X
4.2: Placement stability: 2 or fewer placements (of those in care 12-23 mos) X
4.3: Placement Stability: 2 or fewer placements (of those in care 24+ mos) X
S fSafe from maltreatment recurrence for 6 mos (of s bstantiated ictims 6 mos ago) Ver-3
SafetyIndicators
substantiated victims 6 mos ago) Ver 3
Safe from Maltreatment by foster providers (of those in care last 12 months) X
61

Composite Scores
Federal measures are grouped into four groups or
62
g p g pcomposites
Composite scores are computed for each group of measures
Using Principal Components Analysis (Black Box)
F d l t h ld St t t bl f Federal government holds State accountable for achieving
Scores provided in ROM but not relevant past count Scores provided in ROM but not relevant past count level (some cases not relevant then)

Summary Reports
Now summary reports are by composites
63
y p y p
Can be developed for Ohio Groupings of up to 6 reports

Exit Cohorts
Groups children by when they exited care
64
p y yDischarged
Exit cohorts are reported in the Report Period the child was (federally) discharged
Can be added across timeli d dd h l hAnnualized add up the last 12 months
Per Report Period views looks at specific Report Periods
Exit cohorts are limited to those who dischargedExit cohorts are limited to those who discharged

Exit Cohort
b-10 r-10 -10
y-10 -10
10 g-10
p-10 -10
v-10
c-10 -11
Views Feb
Mar
Apr-
May
Jun-
Jul-
Aug
Sep
Oct
-
Nov
Dec
Jan-
Annualized 12 11 10 9 8 7 6 5 4 3 2 1Per Report Period (example – month)
Exit Cohort Measures1.1 Reunification in 12 mos (of those reunified)
Yellow is Report Month
1.2 Median Mos to Reunification (of those reunified) 2.1 Adopted in less than 24 mos (of those adopted)2.2 Median Mos to Adoption (of those adopted)3 2 Permanency achieved (of those free for adoption and discharged)3.2 Permanency achieved (of those free for adoption and discharged)3.3 Emancipated but in care less than 3 years (of those emancipated)
65

Entry Cohorts
Groups children by when the entered a status
66
p y
Each measure has an observation period
Entry cohorts are only reported after the observation y y pperiod ends for the whole cohort
Variation:length of the observation period
How many monthly cohorts are added together for the federal measures in the Annualized view measures in the Annualized view

Entr Cohort
09 09 09 09 09 9 09 09 9 09 09 0 0 0 0 10 0 0 10 10 0 10 10 1
Entry Cohort
View Type Feb-
0
Mar
-0
Apr
-0
May
-0
Jun-
0
Jul-0
9
Aug
-0
Sep-
0
Oct
-0
Nov
- 0
Dec
-0
Jan-
1
Feb-
1
Mar
-1
Apr
-1
May
-1
Jun-
1
Jul-1
0
Aug
-1
Sep-
1
Oct
-1
Nov
- 1
Dec
-1
Jan-
1
1.4 Maintain Reunify 12 mos Annualized 1 2 3 4 5 6 7 8 9 10 11 12 O‐1 O‐2 O‐3 O‐4 O‐5 O‐6 O‐7 O‐8 O‐9 O‐10 O‐11 O‐12
Per Rpt Period O‐1 O‐2 O‐3 O‐4 O‐5 O‐6 O‐7 O‐8 O‐9 O‐10 O‐11 O‐12
2.5 Adopted < 12 mos of TPR Annualized 1 2 3 4 5 6 7 8 9 10 11 12 O‐1 O‐2 O‐3 O‐4 O‐5 O‐6 O‐7 O‐8 O‐9 O‐10 O‐11 O‐12
Per Rpt Period O‐1 O‐2 O‐3 O‐4 O‐5 O‐6 O‐7 O‐8 O‐9 O‐10 O‐11 O‐12
1.3 Reunify in 12 mos of entry Annualized 1 2 3 4 5 6 O‐1 O‐2 O‐3 O‐4 O‐5 O‐6 O‐7 O‐8 O‐9 O‐10 O‐11 O‐12
Per Rpt Period O‐1 O‐2 O‐3 O‐4 O‐5 O‐6
Safe from Recurrence in 6 mos Annualized 1 2 3 4 5 6 O‐1 O‐2 O‐3 O‐4 O‐5 O‐6
Per Rpt Period O‐1 O‐2 O‐3 O‐4 O‐5 O‐6
Y ll i R M hYellow is Report Month
67

Single Day Back (in time)
Groups children by a single day back in time
68
p y g yAnnualized uses a floating single day back 12 months
Cumulative measure use October 1st federal fiscal year start
Each measure children meet a certain criteria for inclusion on that single day
In care 17 or more months as of that day In care 17 or more months as of that day
In care 17 or more months and not TPR as of that day
In care 24 months or more as of that dayy

Single Day Back Cohort
eb‐10
Mar‐10
Apr‐10
May‐10
un‐10
ul‐10
Aug
‐10
ep‐10
Oct‐10
Nov
‐10
Dec‐10
an‐11
Fe M A M Ju Ju A Se O N D Ja
Annualized 1st
Cumulative 1st
Point in Time Back Measures
Yellow is Report Month
Point in Time Back Measures2.3 Adopted within 12 months (of those in care 17+ mos as of 12 mos ago) 2.4 Legally freed for adoption within 6 months (of those in care 17+ mos not TRP) 3.1 Exited to permanency prior to 18th birthday (of those in care 24+ months as of 12 mos ago)
69

During Time Period
Includes children in care or discharged within a time
70
periodAnnualized views show children in care on last day of report period plus those discharged during last 12 monthsp p g gReport Period views shows children in care on the last day of the report period plus those discharged during the report period p
Placement stability measures further groups children by the length of time they were in care
O L h f f i f d f Open cases - Length of stay from time of entry to end of report periodDischarged – length of stay from entry to discharge
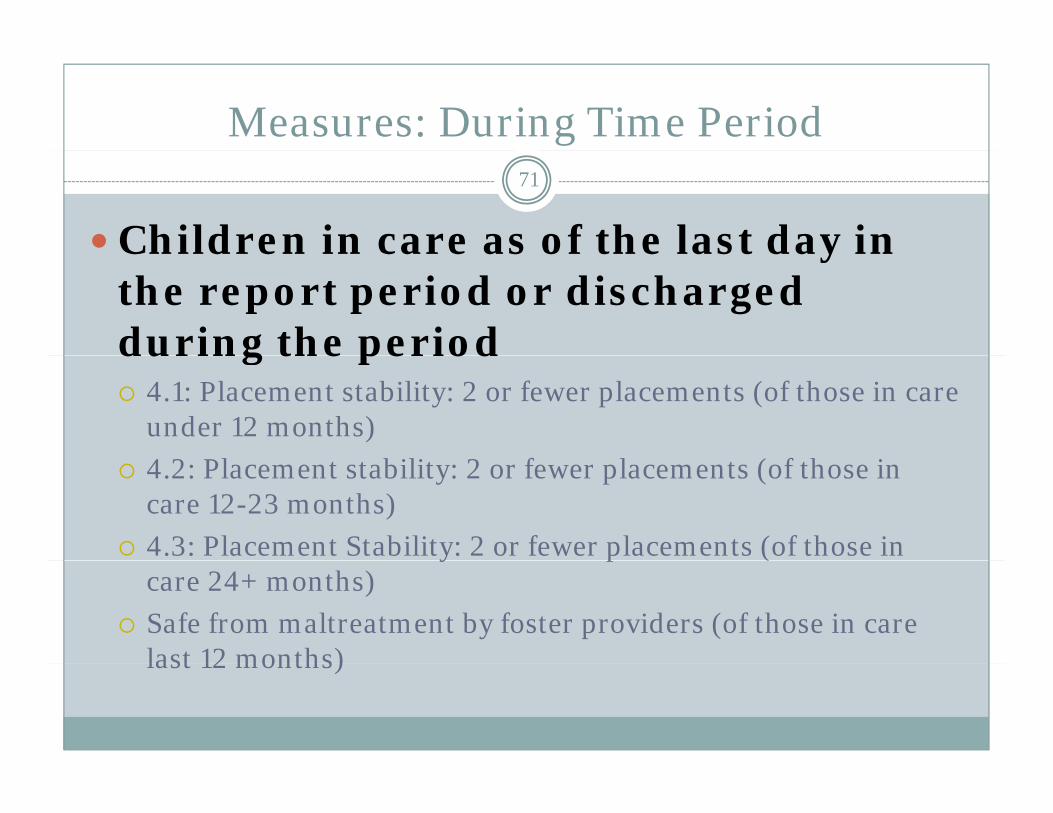
Measures: During Time Period
Children in care as of the last day in
71
Children in care as of the last day in the report period or discharged during the periodduring the period
4.1: Placement stability: 2 or fewer placements (of those in care under 12 months)
l bili f l ( f h i 4.2: Placement stability: 2 or fewer placements (of those in care 12-23 months)
4.3: Placement Stability: 2 or fewer placements (of those in 4 3 y pcare 24+ months)
Safe from maltreatment by foster providers (of those in care last 12 months)last 12 months)
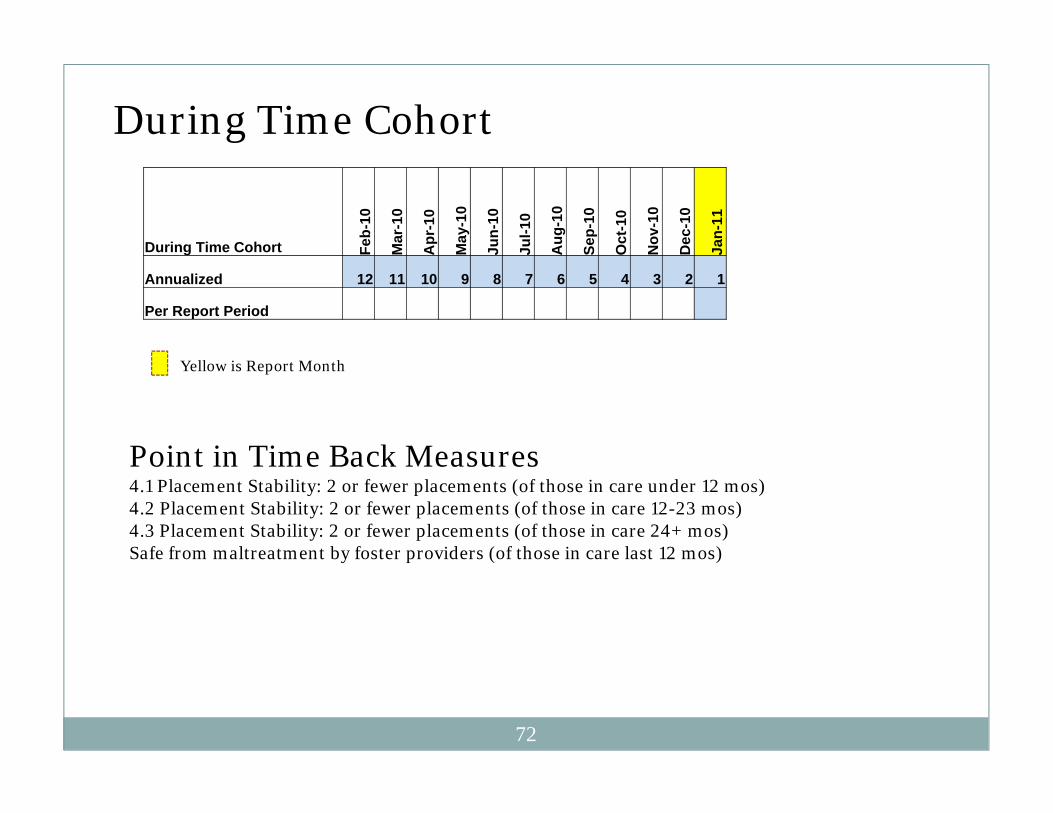
During Time Cohort
During Time Cohort Feb-
10
Mar
-10
Apr
-10
May
-10
Jun-
10
Jul-1
0
Aug
-10
Sep-
10
Oct
-10
Nov
-10
Dec
-10
Jan-
11
g F M A M J J A S O N D J
Annualized 12 11 10 9 8 7 6 5 4 3 2 1
Per Report Period
Point in Time Back Measures
Yellow is Report Month
Point in Time Back Measures4.1 Placement Stability: 2 or fewer placements (of those in care under 12 mos) 4.2 Placement Stability: 2 or fewer placements (of those in care 12-23 mos) 4.3 Placement Stability: 2 or fewer placements (of those in care 24+ mos) Safe from maltreatment by foster providers (of those in care last 12 mos) y p ( )
72

Will the data (performance levels) be the same as the federal CFSR outcomes data?
Close but not exact
73
The federal measures reported in ROM are computed in the same way as the feds do in the CFSR process (Data Profile)
The difference is in the completeness of the datasetROM uses a longitudinal data structure that captures all removal episodes
CFSR uses AFCARS which is a point in time dataset that does pnot count multiple removal episodes within each 6 month AFCARS reporting period -
misses episodes of care misses episodes of care

E l ti Y C t ’ D t Evaluating Your County’s Data: An Overview
F O S T E R C A R E P O P U L A T I O N
74
F O S T E R C A R E P O P U L A T I O N
S T R E N G T H S A N D C H A L L E N G E S W I T H I N O U T C O M E G R O U P
D I G G I N G D E E P E R I N T O A C H A L L E N G E

The Road Ahead for Using Data
R b it’ i
g75
Remember, it’s is a developmental process
ROM training:gh t t p s : / / r o m . s o c w e l . k u . e d u / R O M T r a i n i n g /

Major Factors Affecting Data UsageMajor Factors Affecting Data Usage
Reports
SkillsProgram
ImprovementAction
Interpretation
Organizational Culture
76

Need for Skills, Knowledge, ResourcesWhat good are data without skills or skills without data?g
U d t d
77
Understand measures
Interpret resultsCriticall anal e data for ca ses and correlates of o tcomes Critically analyze data for causes and correlates of outcomes performance
Take action to improve outcomesp
Developing learning/results-oriented culture

Manager Skills: Understand Performance MeasuresMeasures
How measures are constructed and their
78
How measures are constructed and their shortcomings
Think critically about the measure y
Know the group of children the measure uses (denominator) and who is not included
Wh i i d What time period
Small n’sResults relatively meaningless Results relatively meaningless
Relationship (tension) between measuresTimely reunification and re-entry Timely reunification and re entry
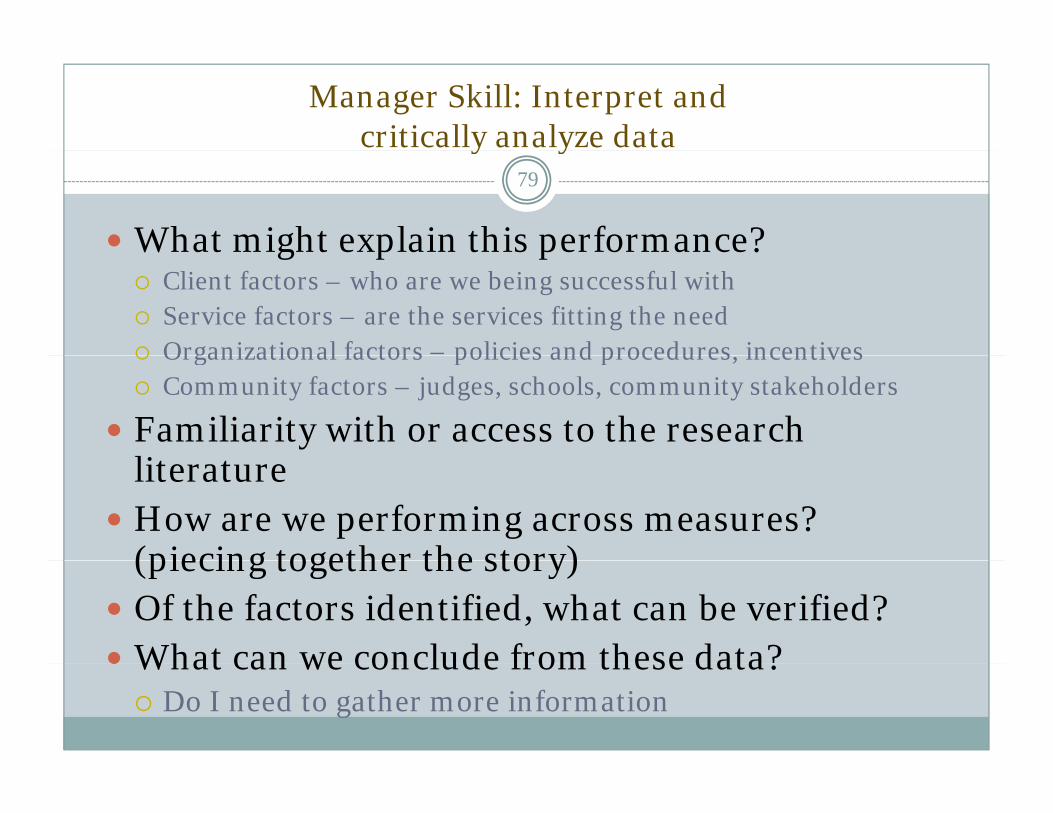
Manager Skill: Interpret and critically analyze datay y
What might explain this performance?
79
g p pClient factors – who are we being successful with Service factors – are the services fitting the needOrganizational factors – policies and procedures incentivesOrganizational factors policies and procedures, incentivesCommunity factors – judges, schools, community stakeholders
Familiarity with or access to the research li literature How are we performing across measures? (piecing together the story) (piecing together the story) Of the factors identified, what can be verified? What can we conclude from these data? What can we conclude from these data?
Do I need to gather more information

Manager Skills: Developing and Initiating program improvementprogram improvement
Take conclusions turn into positive goal statements
80
Take conclusions turn into positive goal statements Determine general strategies (multiple if needed) Involving key people/stakeholders in the process
Establish who will do what by whenAction steps (measurable) Who is responsible Who is responsible Benchmarks (behavioral indicators of action steps)
Time frame
Implement plan
Monitor progress

Manager Skills: Taking Action Menu
Target individual cases
81
g
Modify agency systems
Advocate for changes (agency, community) Advocate for changes (agency, community)
Create key actor collaborations
Develop staff capacity Develop staff capacity
Secure or reallocate resources
Rewards (internal and external)Rewards (internal and external)
Obtain more information (dig deeper)

Manager Skills: Creating a Results Oriented CultureCreating a Results Oriented Culture
Use Data routinely
82
Use Data routinely Start slow
Be non-judgmentalBe non judgmental
Throw a data party
Establish a routine
No not disclose individual performance data
Take responsibility – no blaming Explore data in non-blaming ways
Keep the focus on what you can do
h ll ff hChallenge staff without criticizing

Manager Skills: Creating a Results Oriented Culture (part 2)Creating a Results Oriented Culture (part 2)
Stimulate positive action
83
pSet goals and decide on action to take
Dare to think big
Innovate
Do something
d d fReward and reinforceUse variety of rewards and recognition
Ti l d Timely rewards
Encourage reward giving

Manager Skills:Creating a Results Oriented Culture (part 3)Creating a Results Oriented Culture (part 3)
Seek the involvement of others
84
Respect people’s timeInvolve key people up and down org chartInvolve community stakeholdersInvolve community stakeholders
Encourage learning Learn from those that do well R i d f ilReview successes and failuresArrange mentoring Seek input from consumerspInvite staff to be expertsAsk for help

Manager Skills:Creating a Results Oriented Culture (part 4)Creating a Results Oriented Culture (part 4)
Lead Program improvement efforts
85
g pDo as you say
Follow-through
B i i i ( b i i )Be optimistic (curb cynicism)
Establish your unit’s identity

Results Oriented Culture
Reward and recognize
86
Reward and recognize
Encourage learning
Seek involvement
UUse data routinely
Lead improvement effortsLead improvement efforts
Stimulate positive action

The End
G O F O R T H A N D D O G O O D W O R K !
87
G O F O R T H A N D D O G O O D W O R K !
C O N T A C T M E : T E R R Y M @ K U . E D U