Embed Size (px)
Citation preview
Officer Cadet Survey 2016-17

2
Contents
DISTRIBUTION EXECUTIVE SUMMARY INTRODUCTION
BACKGROUND SURVEY METHODOLOGY REPORTING RESPONSE RATES RESPONDENT PROFILES
DETAILED FINDINGS PREPARING FOR TRAINING FACILITIES AND AMENITIES SUPPORT FAIRNESS SETBACKS DURING TRAINING GENERAL HOPES FOR THE FUTURE
RESPONDENT PROFILES ANNEX A: STATISTICAL RELIATBILITY ANNEX B: SERVICE COMPARISONS
3 5
14
24 38 57 69 83 95
109 113 126
15 16 18 20 21
23
129
3
Distribution
ACTION MOD TESRR NAVY COMMAND LAND FORCES AIR COMMAND INFORMATION BRITANNIA ROYAL NAVAL COLLEGE DARTMOUTH (BRNC) COMMANDO TRAINING CENTRE ROYAL MARINES LYMPSTONE (CTCRM) ROYAL MILITARY ACADEMY SANDHURST (RMAS) ROYAL AIR FORCE COLLEGE CRANWELL (RAFC)

4
Ipsos MORI quality
Ipsos MORI’s reputation for excellence stems from our insistence on quality at every stage of a research project. We will not accept interference from clients who wish to bias results in any way. We are happy to confirm that at no stage in this project has the MOD or any other body attempted to impose leading questions, or seek anything other than a genuine representation of the views of the recruits, trainees and cadets.
This work was carried out in accordance with the requirements of the international quality standard for market research, ISO 20252:2012 and with the Ipsos MORI Terms and Conditions.

Executive summary

6
Army Executive Summary Key points
Officer Cadets
Responses were received from 319 Army officer cadets, a response rate of 57%.
Responses from Army officer cadets have been mixed this year, with falls in many categories but also gains in the facilities and amenities and general sections. Notably there has been a decrease in the proportion of cadets who knew how to complain about bad or unfair treatment and also a fall in those saying that complains were dealt with fairly.
Facilities and amenities Results in this section were mixed. There were improvements since 2015 in ratings for standard of living (50% to 69%),
access to the gym in spare time (69% to 80%) and provision of free Wi-Fi hotspots (52% to 63%). However, there were falls this year in ratings for opportunities for competitive sport and standard of training facilities (74% to 62% and 95% to 90% respectively).
Fairness There were several falls in the fairness category since 2015. This year, Army officer cadets were less likely to say they were
aware of how to complain about bad or unfair treatment (93% to 86%) or that they were fully knowledgeable about the Service Complaints Ombudsman (40% to 23%). A smaller proportion agreed that complaints were dealt with in a fair manner (62% to 46%).
Setbacks during training There were no gains or falls in this section compared with last year.
General Army officer cadets were less positive about some general aspects of their training experience than last year, including feeling
challenged (98% to 94%) and the commitment of staff to do everything they could to help the cadet succeed (85% to 77%). A particularly noteworthy fall was in ratings regarding morale being good on their course (84% to 68%).
However, a higher proportion of officer cadets received an explanation of training objectives and aims (78% to 86%).

7
Army Executive Summary Key areas of change
Officer cadets
Gains % 2015-16
% 2016-17
FACILITIES AND AMENITIES
Standard of living accommodation 50% 69%
Access to gym in spare time 69% 80%
Free WIFI hotspots 52% 63%
GENERAL
Explanation of training objectives and aims 78% 86%
Falls % 2015-16
% 2016-17
FACILITIES AND AMENITIES
Competitive sport opportunities 74% 62%
Standard of training facilities 95% 90%
FAIRNESS
Awareness how to complain 93% 86%
Knowledge of Service Complaints Ombudsman 40% 23%
Whether complaints dealt with in a fair manner 62% 46%
GENERAL
Felt challenged 98% 94%
Morale 84% 68%
Commitment of staff to support success 85% 77%
Please note the % is typically a top two box rating (e.g. ‘very good’ and ‘good’ or ‘strongly agree’ and ‘agree’). At times it may be the combination of two other measures (e.g. ‘all the time’ and ‘most of the time’) or a simple ‘yes’ statement.

8
Key points
Officer Cadets
Royal Navy Executive Summary
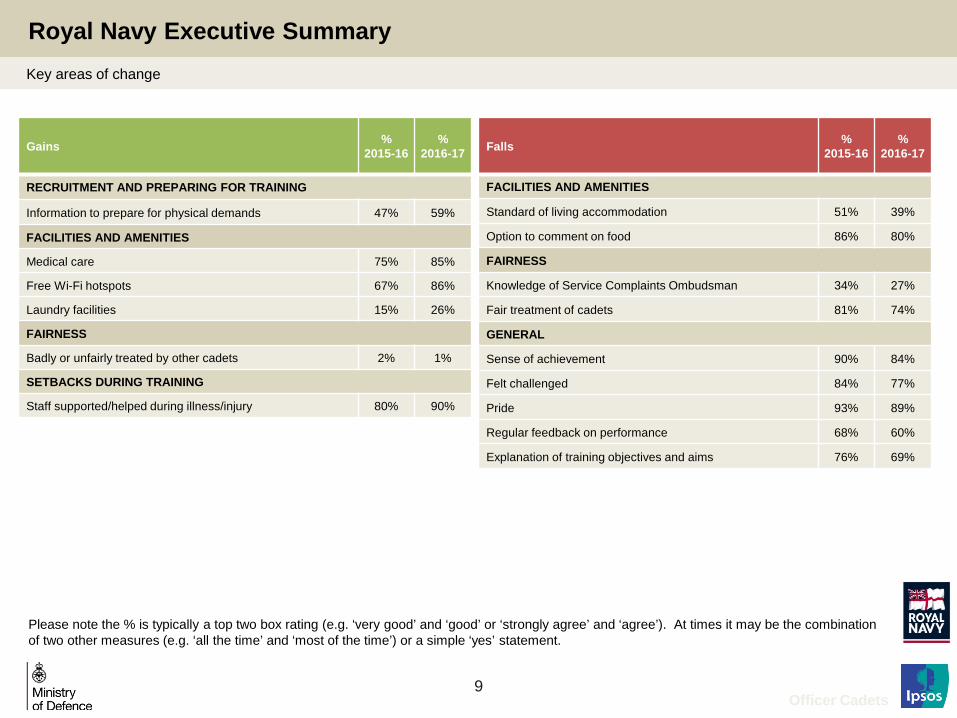
Response rates for Royal Navy officer cadets stand at (100%, 349 officer cadets).
Responses from Royal Navy officer cadets have been mixed this year. Whilst there have been some gains across the board, the general section has seen a fall for a number of the attributes, with no gains in this area.
Facilities and amenities This year, officer cadets were less positive about the standard of living accommodation (51% to 39%) and slightly fewer were
given the option to comment on the food (86% to 80%). However, cadets responded more positively about medical care (75% to 85%), the provision of free Wi-Fi hotspots (67% to
86%) and laundry facilities (15% to 26%).
Fairness Compared with 2015, officer cadets were less likely to have full knowledge of the Service Complaints Ombudsman (34% to
27%) and to agree that officer cadets were all treated fairly (81% to 74%). A slightly higher, but statistically significant, proportion felt they were badly treated by officer cadets (2% to 1%).
Setbacks during training A higher proportion of Royal Navy officer cadets agreed that staff supported them when they were ill or injured this year (80% to
90%).
General There were several falls in this category compared with last year. Smaller proportions of cadets felt a sense of achievement,
challenge and pride (90% to 84%, 84% to 77% and 93% to 89% respectively), and smaller proportions received regular feedback on performance (68% to 60%) or an explanation of the objectives and aims of the training (76% to 69%).
9
Royal Navy Executive Summary Key areas of change
Gains % 2015-16
% 2016-17
RECRUITMENT AND PREPARING FOR TRAINING
Information to prepare for physical demands 47% 59%
FACILITIES AND AMENITIES
Medical care 75% 85%
Free Wi-Fi hotspots 67% 86%
Laundry facilities 15% 26%
FAIRNESS
Badly or unfairly treated by other cadets 2% 1%
SETBACKS DURING TRAINING
Staff supported/helped during illness/injury 80% 90%
Falls % 2015-16
% 2016-17
FACILITIES AND AMENITIES
Standard of living accommodation 51% 39%
Option to comment on food 86% 80%
FAIRNESS
Knowledge of Service Complaints Ombudsman 34% 27%
Fair treatment of cadets 81% 74%
GENERAL
Sense of achievement 90% 84%
Felt challenged 84% 77%
Pride 93% 89%
Regular feedback on performance 68% 60%
Explanation of training objectives and aims 76% 69%
Please note the % is typically a top two box rating (e.g. ‘very good’ and ‘good’ or ‘strongly agree’ and ‘agree’). At times it may be the combination of two other measures (e.g. ‘all the time’ and ‘most of the time’) or a simple ‘yes’ statement.
Officer Cadets

10
RAF Executive Summary Key points
Officer Cadets
368 RAF officer cadets completed the survey, a response rate of 94%. This is consistent with last year. As with other services, some gains are seen in ratings by RAF officer cadets but these are outweighed by the number of
attributes that have fallen.
Recruitment and preparing for training There was a decrease in the proportion who thought the information provided prior to arrival gave an accurate picture of what
life was like at the unit, down from 61% to 52%.
Facilities and amenities There were increases in many of the ratings for facilities and amenities including access to IT for personal use and internet
access. There was however a fall in the rating for the opportunity for competitive sport (46% to 30%).
Support RAF officer cadet scores in the support section were broadly stable since 2015. However, there were falls in this area with a
fall in the proportion of officer cadets who thought that there was a member of staff available to help with personal or emotional problems (90% to 85%) and a fall in the proportion who felt they could practise their faith or religion (28% to 18%).
Fairness While RAF officer cadets generally felt that they were supported, there were falls in the fairness section. Of note, there was a
fall in the proportion of officer cadets who claimed all were treated fairly (74% to 67%) and an increase in the number of officer cadets saying that they were badly or unfairly treated by staff (3% to 7%).
General While RAF officer cadets are more satisfied with many aspects of the facilities, some attitudes towards the training itself have
declined since 2015; statements around a sense of achievement, enjoyment of the course, morale, feeling prepared for the next stage and believing that staff/instructors did all they could to help all falling by over four percentage points.

11
RAF Executive Summary Key areas of change
Gains % 2015-16
% 2016-17
FACILITIES AND AMENITIES
Access to IT for personal use 59 79
Internet Access 63 72
Access to gym in spare time 43 54
Provision of free Wi-Fi hotspots 14 22
IT support for hardware issues 19 27
Falls % 2015-16
% 2016-17
RECRUITMENT AND PREPARING FOR TRAINING
Information gave accurate picture of life at unit 61 52
FACILITIES AND AMENITIES
Opportunity for competitive sport 46 30
SUPPORT
Opportunity to practise your faith/religion 28 18
Someone for personal and emotional problems 90 85
FAIRNESS
Knowledge of Service Complaints Ombudsman 31 23
Cadets were all treated fairly 74 67
Believe unfairly treated by staff 3 7
Complaints dealt with in a fair manner 58 47
GENERAL
Feel sense of achievement 95 90
Enjoyed the course 79 69
Morale was good on my course 89 76
Staff/instructors did all they could to help me succeed 87 81
Feel prepared to go onto the next stage of my career 88 80
Please note the % is typically a top two box rating (e.g. ‘very good’ and ‘good’ or ‘strongly agree’ and ‘agree’). At times it may be the combination of two other measures (e.g. ‘all the time’ and ‘most of the time’) or a simple ‘yes’ statement.
Officer Cadets

12
Royal Marines Executive Summary Key points
Officer Cadets
32 Royal Marines officer cadets completed the survey, a response rate of 58%. As the number of Royal Marine cadets has tended to be low since the survey started, there can be large fluctuations in the trend data but very few significant changes over time.
Despite small base sizes, responses for Royal Marines officer cadets were extremely positive with 100% of officer cadets agreeing with certain questions, particularly those in the general section.
Recruitment and preparing for training There has been an increase in the proportion of Royal Marines officer cadets who believe that information prior to arrival
gave an accurate picture of what life would be like at their unit (35% to 63%). All other measures in this section remained stable.
Facilities and amenities There were large gains in multiple facilities ratings including the standard of living accommodation (32% to 88%), sports
facilities (65% to 97%) and internet access (48% to 84%). There was also an increase in scores for food (6% to 50%).
Support Encouragingly, there were no falls in the support section. There were gains in terms of the opportunity to talk privately with
staff, the opportunity to practise your faith/religion and the opportunity to raise all concerns with a person in authority.
Fairness Scores in the fairness section are encouraging as they show an increase in the proportion of officer cadets who believe that
all cadets were treated fairly and that complaints were handled in a fair manner. Importantly, awareness of how to complain has also improved (68% to 91%).
General There has only been one increase in the General section although this was in overall satisfaction with the training experience
(68% to 94%). There was however a fall in those saying that they received regular feedback on performance (77% to 38%).

13
Royal Marines Executive Summary Key areas of change
Gains % 2015-16 % 2016-17
RECRUITMENT AND PREPARING FOR TRAINING
Information gave accurate picture of life at unit 35 63
FACILITIES AND AMENITIES
Standard of living accommodation 32 88
Sports facilities 65 97
Internet Access 48 84
Provision of free Wi-Fi hotspots 52 88
Food 6 50
Given sufficient time to eat meals 42 75
Option to comment on food 84 100
SUPPORT
Opportunity to talk privately with training staff 74 94
Opportunity to practise your faith/religion 23 47
Opportunity to raise all concerns with authority 68 91
FAIRNESS
Cadets were all treated fairly 68 91
Awareness of how to complain 68 91
Complaints dealt with in a fair manner 52 88
GENERAL
Overall satisfaction with training experience 68 94
Falls % 2015-16
% 2016-17
GENERAL
Received regular feedback on my performance 77 38
Please note the % is typically a top two box rating (e.g. ‘very good’ and ‘good’ or ‘strongly agree’ and ‘agree’). At times it may be the combination of two other measures (e.g. ‘all the time’ and ‘most of the time’) or a simple ‘yes’ statement.
Officer Cadets
Introduction

15
Background
The Officer Cadet Survey (OCS) was established to monitor officer cadets’ experience of training at all four initial officer training colleges. It was created following the success of the Recruit Trainee Survey (RTS), a tri-Service survey administered to gauge Phase 1 recruits’ and Phase 2 trainees’ experience of training. The RTS was established following an appraisal of initial training by the Defence Operational Capability (DOC) in 2002. The aims of the survey are to: Elicit attitudes towards the quality and benefits of training provided
Identify any incidences of bad or unfair treatment, i.e. discrimination, harassment and bullying
Performance is reported by Service. By analysing all responses over this period we provide an overview of the results focusing on key findings, and in doing so complement and summarise the data available on the portal.
Officer Cadets

16
Survey methodology
Administration All officer cadets who have completed at least two weeks training are invited to participate in the survey. All respondents
complete an anonymous and confidential online questionnaire and are reassured that their responses cannot be attributed to them individually.
Questionnaire The questionnaire includes all the key questions raised by the Defence Operational Capability Audit and was developed by
a Tri-Service group. On commission, Ipsos MORI made minor adjustments to the format and design of the questionnaire. The content is based on the RTS questionnaire with some modifications.
Questions have been added, modified or removed during the course of the survey as part of a continuous improvement and review process. As such, there may be more trend data for questions which have not changed throughout the lifetime of the survey. In the last reporting period (2015) changes were implemented to make the questionnaire in line with the RTS survey, with most changes in the fairness and equality sections. For the purposes of this report, trend data is shown for the past 5 years, that is since 2011.
Continuous reporting During the course of the year the Services use the survey results to monitor the views of officer cadets to generally inform
continuous improvement activity and instigate changes to processes if required. The data is uploaded to an online portal to which each college has constant access.
A new online portal was implemented in June 2013 after consultation with various users of the results. Workshops have been conducted to gain feedback from survey administrators and the end users of the reports to support the process of continuous improvement.
Officer Cadets
17
Trends and past data
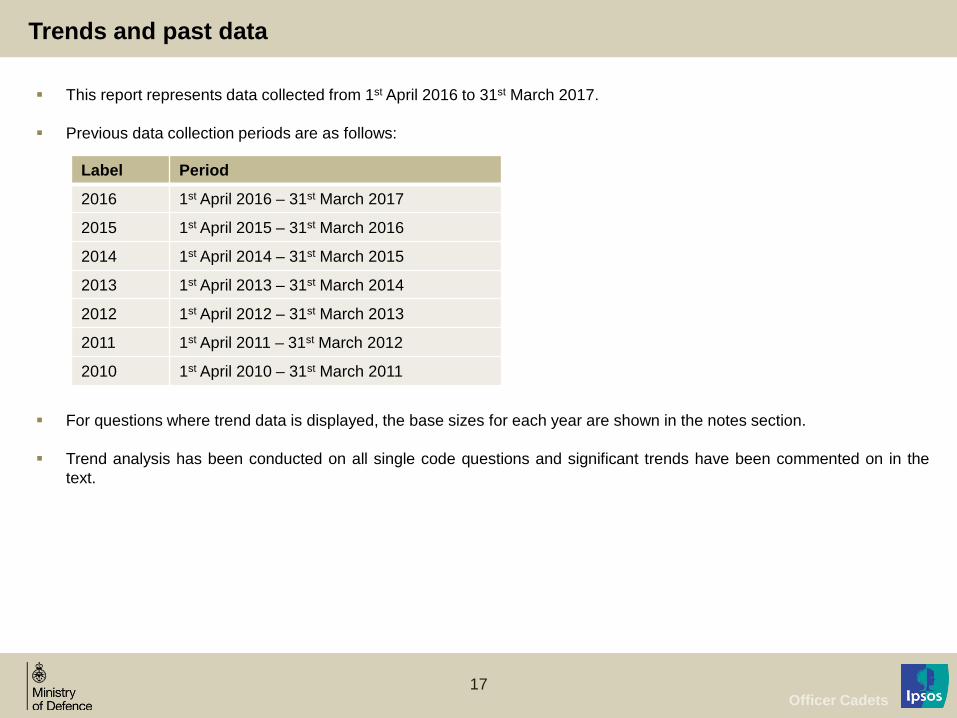
This report represents data collected from 1st April 2016 to 31st March 2017.
Previous data collection periods are as follows:
For questions where trend data is displayed, the base sizes for each year are shown in the notes section.
Trend analysis has been conducted on all single code questions and significant trends have been commented on in the text.
Label Period
2016 1st April 2016 – 31st March 2017
2015 1st April 2015 – 31st March 2016
2014 1st April 2014 – 31st March 2015
2013 1st April 2013 – 31st March 2014
2012 1st April 2012 – 31st March 2013
2011 1st April 2011 – 31st March 2012
2010 1st April 2010 – 31st March 2011
Officer Cadets
18
Reporting
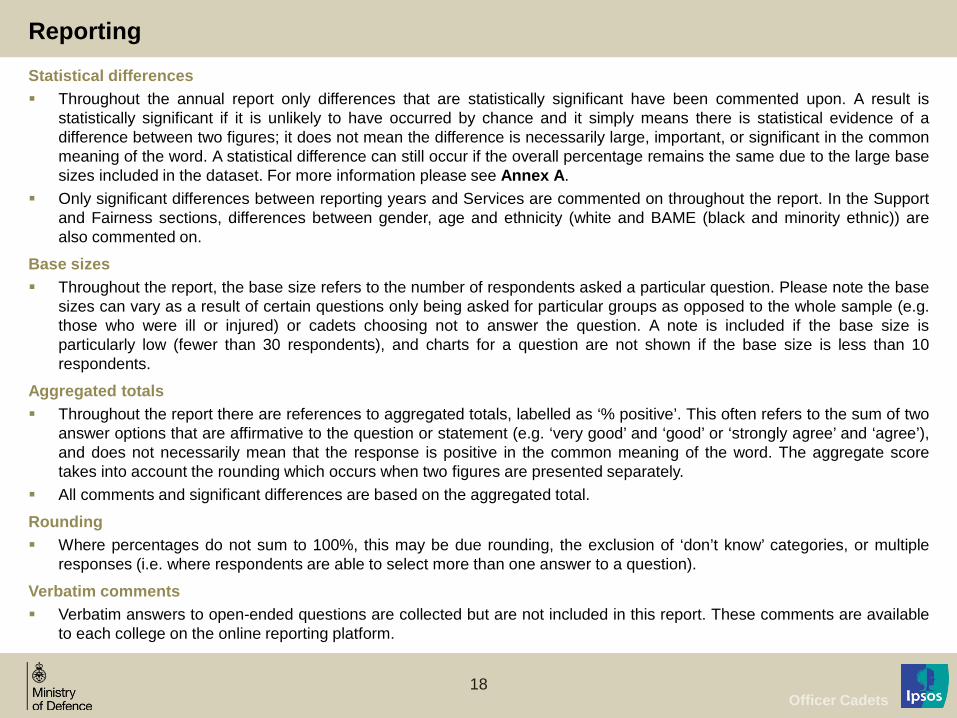
Statistical differences Throughout the annual report only differences that are statistically significant have been commented upon. A result is
statistically significant if it is unlikely to have occurred by chance and it simply means there is statistical evidence of a difference between two figures; it does not mean the difference is necessarily large, important, or significant in the common meaning of the word. A statistical difference can still occur if the overall percentage remains the same due to the large base sizes included in the dataset. For more information please see Annex A.
Only significant differences between reporting years and Services are commented on throughout the report. In the Support and Fairness sections, differences between gender, age and ethnicity (white and BAME (black and minority ethnic)) are also commented on.
Base sizes Throughout the report, the base size refers to the number of respondents asked a particular question. Please note the base
sizes can vary as a result of certain questions only being asked for particular groups as opposed to the whole sample (e.g. those who were ill or injured) or cadets choosing not to answer the question. A note is included if the base size is particularly low (fewer than 30 respondents), and charts for a question are not shown if the base size is less than 10 respondents.
Aggregated totals Throughout the report there are references to aggregated totals, labelled as ‘% positive’. This often refers to the sum of two
answer options that are affirmative to the question or statement (e.g. ‘very good’ and ‘good’ or ‘strongly agree’ and ‘agree’), and does not necessarily mean that the response is positive in the common meaning of the word. The aggregate score takes into account the rounding which occurs when two figures are presented separately.
All comments and significant differences are based on the aggregated total. Rounding Where percentages do not sum to 100%, this may be due rounding, the exclusion of ‘don’t know’ categories, or multiple
responses (i.e. where respondents are able to select more than one answer to a question).
Verbatim comments Verbatim answers to open-ended questions are collected but are not included in this report. These comments are available
to each college on the online reporting platform.
Officer Cadets

19
Report format
Question text as asked in the online survey
This annual report has been redesigned following a period of consultation with end users. The format of each page varies depending on the type of question but most features are the same. Please see the guide below for how to read the results:
Base size and question routing
Clarification on aggregated % positive answer options. Significant differences and trend data is based on this
Significant differences based on % positive. Comparisons are made between Services and previous years
Trend data for % positive responses. All years where results are available are displayed
Results for current year
Summary of results and additional information such as previous questionnaire changes
Officer Cadets
20
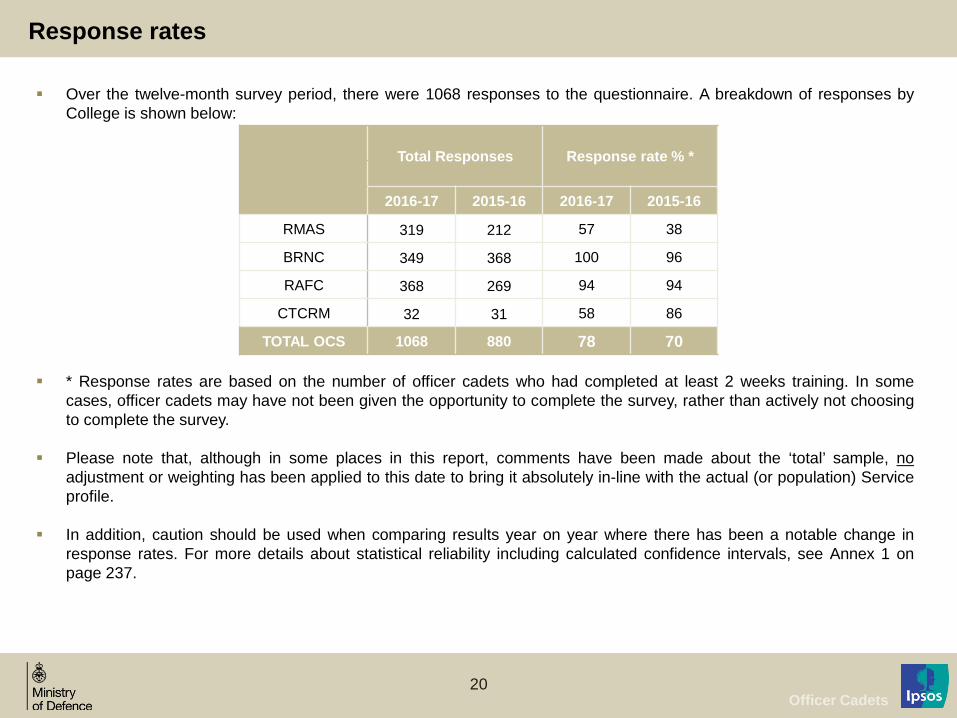
Over the twelve-month survey period, there were 1068 responses to the questionnaire. A breakdown of responses by College is shown below:
* Response rates are based on the number of officer cadets who had completed at least 2 weeks training. In some
cases, officer cadets may have not been given the opportunity to complete the survey, rather than actively not choosing to complete the survey.
Please note that, although in some places in this report, comments have been made about the ‘total’ sample, no
adjustment or weighting has been applied to this date to bring it absolutely in-line with the actual (or population) Service profile.
In addition, caution should be used when comparing results year on year where there has been a notable change in response rates. For more details about statistical reliability including calculated confidence intervals, see Annex 1 on page 237.
Response rates
Officer Cadets
Total Responses Response rate % *
2016-17 2015-16 2016-17 2015-16
RMAS 319 212 57 38
BRNC 349 368 100 96
RAFC 368 269 94 94
CTCRM 32 31 58 86
TOTAL OCS 1068 880 78 70

21
Respondent profiles Number of respondents 2016-17 (all respondents): Army (319), Navy (349), RAF (368), Marines (32)
30
33
34
3
2016-17
Army Navy RAF Marines
Service Profile (%)
89 86 84
100
11 14 16
Army Navy RAF Marines
Gender Profile (%)
Male Female
Officer Cadets
Totals may not add up to 100% due to rounding

22
Respondent profiles Number of respondents 2016-17 (all respondents): Army (319), Navy (349), RAF (368), Marines (32)
6 14
10 13
71
47 51
63
23
39 39
25
Army Navy RAF Marines
18-21 22-25 25+
93 90
93 94
5 5 5 6
Army Navy RAF Marines
Ethnicity Profile (%)
*BAME = Black and Minority Ethnic
Officer Cadets
Totals may not add up to 100% due to rounding
White BAME*
2015-16 2015-16 2015-16
Age Profile (%)
2015-16

Detailed findings
Preparing for training
25
59
56
51
51
40
34
40
30
28
26
9
11
5
3
36
37
39
39
42
45
39
45
39
38
47
26
14
7
4
5
8
8
12
17
17
19
27
23
35
35
27
19
3
4
4
6
6
8
8
28
52
66
5
6
Challenge/adventure
Lifestyle appealed
To keep fit
To travel
Want to defend country
To be a member of the Armed Services
To do sports
Gain skills/qualifications
Job security
To do a specific job
Salary
Family members/friends
Wanting to move away from home/current situation
No other job choices
Very important Fairly important Not very important Not at all important Don't know/ Not applicable/ No answer
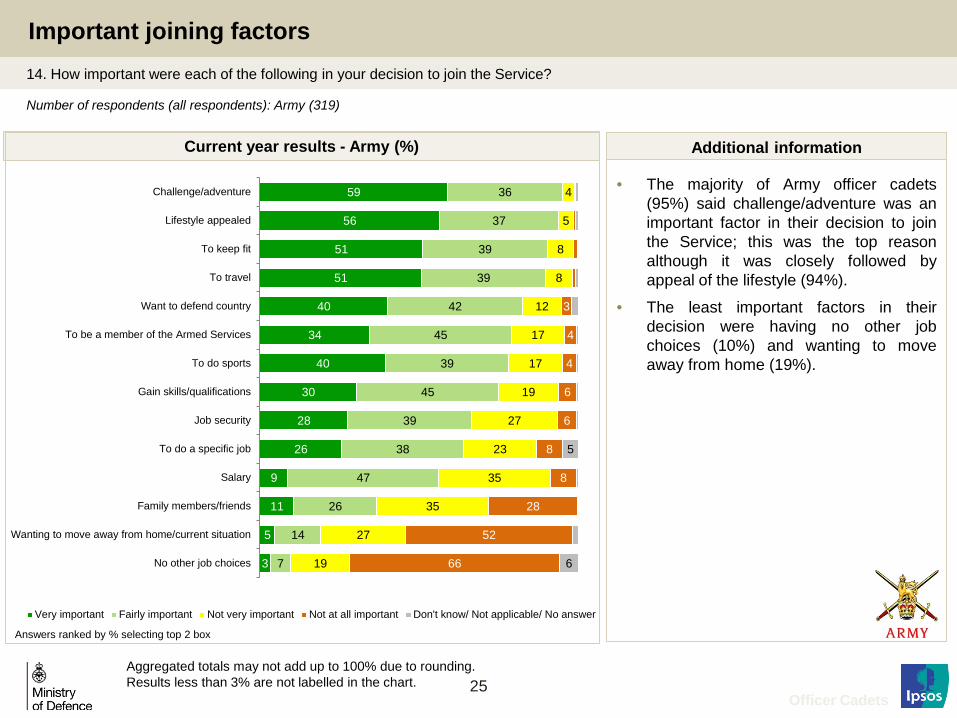
Important joining factors 14. How important were each of the following in your decision to join the Service?
Number of respondents (all respondents): Army (319)
Current year results - Army (%)
• The majority of Army officer cadets (95%) said challenge/adventure was an important factor in their decision to join the Service; this was the top reason although it was closely followed by appeal of the lifestyle (94%).
• The least important factors in their decision were having no other job choices (10%) and wanting to move away from home (19%).
Additional information
Officer Cadets
Answers ranked by % selecting top 2 box
Aggregated totals may not add up to 100% due to rounding. Results less than 3% are not labelled in the chart.

26
53
48
42
50
52
45
35
35
36
21
34
14
8
5
41
43
47
36
33
40
44
43
43
52
37
27
13
9
4
7
9
11
11
11
16
16
17
21
21
29
26
19
4
3
3
5
7
26
50
61
3
3
6
Challenge/adventure
Lifestyle appealed
Gain skills/qualifications
Job security
To travel
To do a specific job
To keep fit
Want to defend country
To be a member of the Armed Services
Salary
To do sports
Family members/friends
Wanting to move away from home/current situation
No other job choices
Very important Fairly important Not very important Not at all important Don't know/ Not applicable/ No answer
Important joining factors 14. How important were each of the following in your decision to join the Service?
Number of respondents (all respondents): Royal Navy (349)
Current year results - Royal Navy (%)
• The top ranking decision factors for Royal Navy officer cadets were challenge/adventure (94%) and lifestyle appealed (91%).
• The least important factors were having no other job choices and moving away from home or current situation (14% and 21% respectively).
Additional information
Officer Cadets
Answers ranked by % selecting top 2 box
Aggregated totals may not add up to 100% due to rounding. Results less than 3% are not labelled in the chart.

27
Important joining factors 14. How important were each of the following in your decision to join the Service?
Number of respondents (all respondents): RAF (368)
Current year results - RAF (%)
• RAF officer cadets were most likely to say that the appeal of the lifestyle (96%) and the challenge/adventure (94%) were important in their decision to join the Service.
• The least important factors were having no other job choices (9%) and wanting to move away from home or current situation (18%).
Additional information
Officer Cadets
Answers ranked by % selecting top 2 box
Aggregated totals may not add up to 100% due to rounding. Results less than 3% are not labelled in the chart.
60
46
41
53
44
51
36
31
33
41
19
8
4
36
48
48
36
43
35
48
53
49
40
52
29
14
7
3
8
10
10
8
13
14
14
15
23
35
30
21
3
4
6
25
48
64
3
3
4
6
Lifestyle appealed
Challenge/adventure
To keep fit
To travel
Job security
To do a specific job
To be a member of the Armed Services
Gain skills/qualifications
Want to defend country
To do sports
Salary
Family members/friends
Wanting to move away from home/current situation
No other job choices
Very important Fairly important Not very important Not at all important Don't know/ Not applicable/ No answer

28
Important joining factors 14. How important were each of the following in your decision to join the Service?
Number of respondents (all respondents): Marines (32)
Current year results – Royal Marines (%)
• The main decision factors for Royal Marines officer cadets were the appeal of the lifestyle, challenge/adventure and to keep fit. All cadets rated these as very or fairly important.
Additional information
Officer Cadets
Answers ranked by % selecting top 2 box
Aggregated totals may not add up to 100% due to rounding. Results less than 3% are not labelled in the chart.
75
72
59
47
47
25
31
44
25
6
22
9
3
25
28
41
50
44
66
53
34
44
53
31
19
9
3
3
9
9
16
16
19
31
41
38
31
19
0
0
0
0
3
13
6
3
31
53
72
3
3
3
3
3
6
Lifestyle appealed
Challenge/adventure
To keep fit
To travel
Want to defend country
To do sports
Job security
To be a member of the Armed Services
Gain skills/qualifications
Salary
To do a specific job
Family members/friends
Wanting to move away from home/current situation
No other job choices
Very important Fairly important Not very important Not at all important Don't know/ Not applicable/ No answer

29
Where learnt about careers in Armed Forces 14c. Where did you learn about careers in the Armed Forces?
Number of respondents (all respondents): Total (1,068), Army (319), Royal Navy (349), RAF (368), Marines (32)
Current year results (%)
Officer Cadets
• Half of officer cadets from all Services learned about careers in the Armed Forces from websites (49%) or from family and friends who have served (48%).
• For Army officer cadets, friends and family who served was the top source of information for careers in the Armed Forces (50%). However the top source for RAF officer cadets was the AFCO (53%) and the top source for Royal Navy and Royal Marines officer cadets was the internet (50% and 69% respectively).
Additional information
49 45
50 49
69
48 50 48 46
59
45
32
48 53
47
30 27 28
35 38 30
26
34 28
56
28 21
29 32
47
25 20
27 29 25 23 22
25 21
47
23 16
21
32
16 17 9
17 21
31
8 5 8 10
0 4
0
13
0 0 2 8
0 0 0
9 9 11 7 6
0
10
20
30
40
50
60
70
Total Army Navy RAF Marines Internet/websites Friends and family who have served/ are serving Armed Forces Careers Office (AFCO) In the Cadets TV/Newspaper coverage - documentaries Armed Forces Advertising Careers/recruitment fairs TV/Films/Books Military shows Site visits/ guided tours Youth organisations (e.g. Scouts, Guides) Royal Navy Careers Information Office (RNCIO) Army Careers Information Office (ACIO) Anything else/ something different from above

30
Usefulness of information provided before joining
Number of respondents (all respondents): Army (319)
Current year results - Army (%)
• The most useful information source for Army officer cadets was joining instructions (86%).
• The least useful source of information for Army officer cadets was the Potential Officers Course (40%), however 49% did not answer the question about this particular source.
• 26% did not find information from the AFCO/Recruiting Office useful.
Additional information
Officer Cadets
16. Please rate how useful you found the information provided in each of the media given
Aggregated totals may not add up to 100% due to rounding. Results less than 3% are not labelled in the chart.
14
17
10
7
15
7
12
72
62
54
58
37
43
29
11
16
9
19
5
24
9
3
1
24
14
42
22
49
Joining instructions
Pre Commissioning Course Briefing Course (PCCBC)
Pre-course briefing
Information packs
A & S recruiting visits
Information from AFCO/Recruiting Office
Potential Officers Course
Very useful Fairly useful Not very useful Not at all useful Don't know/ Not applicable/I did not read the information/ No answer
Answers ranked by % selecting top 2 box

31
Number of respondents (all respondents): Royal Navy (349)
Current year results - Royal Navy (%)
• Two thirds of Royal Navy officer cadets (66%) found the joining instructions useful. A similar proportion (65%) found the information packs useful.
• Many officer cadets did not comment on the pre-course briefing (49%), Potential Officers Course (71%), or Pre-Commissioning Briefing Course (80%).
Additional information
Officer Cadets
16. Please rate how useful you found the information provided in each of the media given
Usefulness of information provided before joining
Aggregated totals may not add up to 100% due to rounding. Results less than 3% are not labelled in the chart.
12
7
13
8
12
3
53
57
42
31
12
12
29
24
16
11
3
4
5
4
5
7
24
49
71
80
Joining instructions
Information packs
Information from AFCO/Recruiting Office
Pre-course briefing
Potential Officers Course
Pre Commissioning Course Briefing Course (PCCBC)
Very useful Fairly useful Not very useful Not at all useful Don't know/ Not applicable/I did not read the information/ No answer
Answers ranked by % selecting top 2 box

32
Number of respondents (all respondents): RAF (368)
Current year results - RAF (%)
• The most useful information source was the Pre-Course Briefing, with over nine in ten RAF officer cadets (90%) finding it useful.
• The majority of officer cadets did not comment on the Pre-Commissioning Course briefing course (64%) and Potential Officers Course (69%).
Additional information
Officer Cadets
16. Please rate how useful you found the information provided in each of the media given
Usefulness of information provided before joining
Aggregated totals may not add up to 100% due to rounding. Results less than 3% are not labelled in the chart.
31
17
7
7
5
5
60
68
63
57
23
19
6
13
19
25
7
7
5
4
10
7
64
69
Pre-course briefing
Joining instructions
Information packs
Information from AFCO/Recruiting Office
Pre Commissioning Course Briefing Course (PCCBC)
Potential Officers Course
Very useful Fairly useful Not very useful Not at all useful Don't know/ Not applicable/I did not read the information/ No answer
Answers ranked by % selecting top 2 box

33
Number of respondents (all respondents): Marines (32)
Current year results – Royal Marines (%)
• All Royal Marines officer cadets found the Potential Officers Course useful.
• This was followed by four in every five cadets (81%) stating that information from the AFCO/Recruiting Office was useful.
• Many officer cadets did not comment on the Pre-Course Briefing (34%) or Pre-Commissioning Course Briefing Course (72%).
Additional information
Officer Cadets
16. Please rate how useful you found the information provided in each of the media given
Usefulness of information provided before joining
Aggregated totals may not add up to 100% due to rounding. Results less than 3% are not labelled in the chart.
59
19
6
9
13
6
41
63
66
53
41
22
16
22
31
9
3
6
3
6
34
72
Potential Officers Course
Information from AFCO/Recruiting Office
Information packs
Joining instructions
Pre-course briefing
Pre Commissioning Course Briefing Course (PCCBC)
Very useful Fairly useful Not very useful Not at all useful Don't know/ Not applicable/I did not read the information/ No answer
Answers ranked by % selecting top 2 box

34
Information prior to arrival: Preparing for physical demands
17
20
11
20
25
59
65
47
64
69
13
9
19
12
3
9
5
18
4
3
4
Total
Army
Navy
RAF
Marines
Strongly agree Agree Neither agree nor disagree Disagree Strongly disagree
2011 2012 2013 2014 2015 2016Army 78 82 84 79 80 85Navy 63 61 43 37 47 59RAF 87 84 80 86 85 83Marines 89 64 87 94 87 94
0102030405060708090
100
% P
ositi
ve
Army
Navy
RAF
Marines
Trend
Current year results (%)
• Three quarters of officers cadets (76%) stated that the information they were given prior to arrival enabled them to prepare for the physical demands of the course. This was higher than in 2015 (68%).
• Royal Navy officer cadets were more likely to agree than in 2015 (47% to 59%).
Additional information
Please refer to notes page for base size of previous years
17. Please indicate your agreement with each of the following statements: The information I was given prior to arrival… Enabled me to prepare myself well enough for the physical demands of the course
Officer Cadets
Differences
Army Navy RAF Marines
Comparison with previous year
Number of respondents (all respondents): Total (1,068), Army (319), Royal Navy (349), RAF (368), Marines (32) % positive equals the proportion who say ‘strongly agree’ or ‘agree’ – significant differences and comments based on this
Aggregated totals may not add up to 100% due to rounding. Results less than 3% are not labelled in the chart.
35
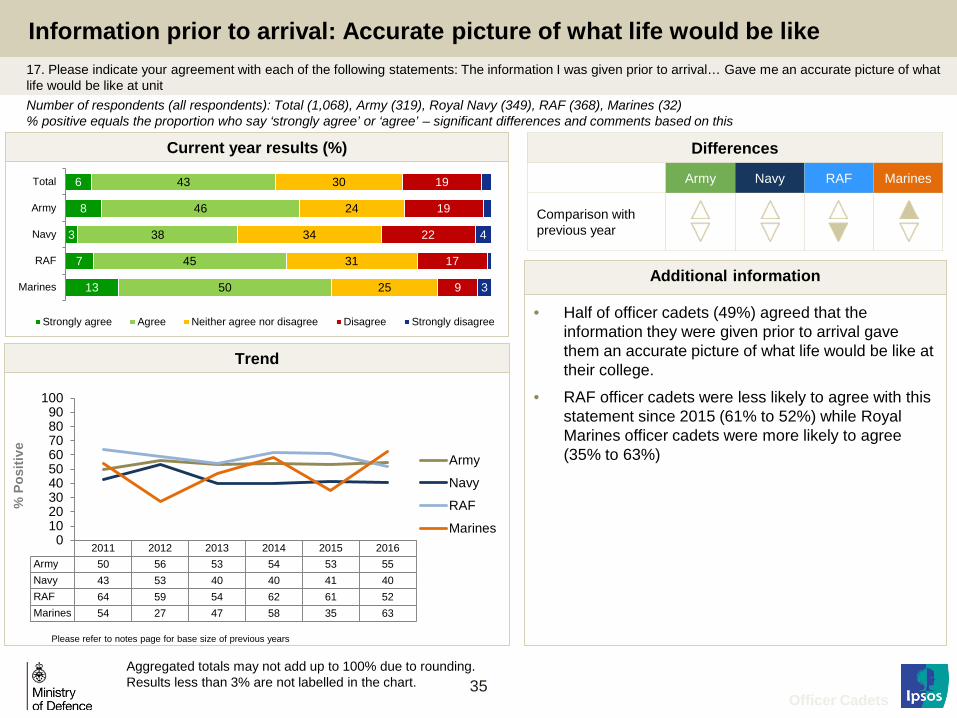
Information prior to arrival: Accurate picture of what life would be like
2011 2012 2013 2014 2015 2016Army 50 56 53 54 53 55Navy 43 53 40 40 41 40RAF 64 59 54 62 61 52Marines 54 27 47 58 35 63
0102030405060708090
100
% P
ositi
ve
Army
Navy
RAF
Marines
Trend
Current year results (%)
Please refer to notes page for base size of previous years
17. Please indicate your agreement with each of the following statements: The information I was given prior to arrival… Gave me an accurate picture of what life would be like at unit
• Half of officer cadets (49%) agreed that the information they were given prior to arrival gave them an accurate picture of what life would be like at their college.
• RAF officer cadets were less likely to agree with this statement since 2015 (61% to 52%) while Royal Marines officer cadets were more likely to agree (35% to 63%)
Additional information
Officer Cadets
Number of respondents (all respondents): Total (1,068), Army (319), Royal Navy (349), RAF (368), Marines (32) % positive equals the proportion who say ‘strongly agree’ or ‘agree’ – significant differences and comments based on this
Aggregated totals may not add up to 100% due to rounding. Results less than 3% are not labelled in the chart.
6
8
3
7
13
43
46
38
45
50
30
24
34
31
25
19
19
22
17
9
4
3
Total
Army
Navy
RAF
Marines
Strongly agree Agree Neither agree nor disagree Disagree Strongly disagree
Differences
Army Navy RAF Marines
Comparison with previous year

36
Information prior to arrival: Accurate information about what training involved
2011 2012 2013 2014 2015 2016Army 66 68 61 69 67 71Navy 58 59 51 49 46 51RAF 79 75 66 75 71 65Marines 82 45 53 58 68 81
0102030405060708090
100
% P
ositi
ve
Army
Navy
RAF
Marines
Trend
Current year results (%)
Please refer to notes page for base size of previous years
17. Please indicate your agreement with each of the following statements: The information I was given prior to arrival… Provided me with useful and accurate information about what the training involved
Additional information
Officer Cadets
Number of respondents (all respondents): Total (1,068), Army (319), Royal Navy (349), RAF (368), Marines (32) % positive equals the proportion who say ‘strongly agree’ or ‘agree’ – significant differences and comments based on this
Aggregated totals may not add up to 100% due to rounding. Results less than 3% are not labelled in the chart.
9
10
4
10
19
54
60
47
55
63
23
22
24
23
9
13
7
22
11
9
3
Total
Army
Navy
RAF
Marines
Strongly agree Agree Neither agree nor disagree Disagree Strongly disagree No answer
Differences
Army Navy RAF Marines
Comparison with previous year

37
Satisfaction with recruitment process
2015 2016Army 42 46Navy 57 61RAF 67 67Marines 68 81
0102030405060708090
100
% P
ositi
ve
Army
Navy
RAF
Marines
Trend
Current year results (%)
Please refer to notes page for base size of previous years
KPI2. Overall how satisfied were you with the recruitment process?
Additional information
Officer Cadets
Number of respondents :Total (1,068), Army (319), Royal Navy (349), RAF (368), Marines (32) % positive equals the proportion who say ‘very satisfied’ or ‘fairly satisfied’ – significant differences and comments based on this
Aggregated totals may not add up to 100% due to rounding. Results less than 3% are not labelled in the chart.
Differences
Army Navy RAF Marines
Comparison with previous year
11
8
12
13
25
48
38
49
55
56
18
17
19
18
9
15
23
13
11
9
6
12
4
4
3
Total
Army
Navy
RAF
Marines
Very satisfied Fairly Satisfied Neither satisfied nor dissatisfiedFairly unsatisfied Very unsatisfied No answer

Facilities and amenities

39
Rating: Standard of living accommodation
Number of respondents (all respondents): Total (1,068), Army (319), Royal Navy (349), RAF (368), Marines (32) % positive equals the proportion who say ‘very good or good’ – significant differences and comments based on this
2011 2012 2013 2014 2015 2016Army 68 70 70 57 50 69Navy 47 56 64 56 51 39RAF 83 81 73 86 86 80Marines 79 68 63 70 32 88
0
20
40
60
80
100
% P
ositi
ve
Army
Navy
RAF
Marines
Trend
Current year results (%)
Please refer to notes page for base size of previous years
19. How would you rate each of the following: Standard of living accommodation
• Overall, almost two thirds of officer cadets (64%) rated the standard of living accommodation as good or very good.
• Army and Royal Marines office cadets were both more likely to rate living accommodation as good or very good than in 2015 (50% to 69% and 32% to 88% respectively).
• However, Royal Navy officer cadets were less positive than last year (51% to 39%).
Additional information
Officer Cadets
Aggregated totals may not add up to 100% due to rounding. Results less than 3% are not labelled in the chart.
10
13
4
13
22
53
56
35
67
66
23
24
33
14
13
9
5
19
5
3
8
Total
Army
Navy
RAF
Marines
Very good Good Neither good nor poor Poor Very poor Don't know/ Not applicable/ No answer
Differences
Army Navy RAF Marines
Comparison with previous year

40
Rating: Sports facilities
2011 2012 2013 2014 2015 2016Army 88 90 90 93 95 93Navy 71 63 74 76 66 69RAF 98 94 93 90 91 89Marines 89 73 76 91 65 97
0
20
40
60
80
100
% P
ositi
ve
Army
Navy
RAF
Marines
Trend
Current year results (%)
19. How would you rate each of the following: Sports facilities
• Over four out of five officer cadets (84%) rated the sports facilities as good or very good.
• There was a rise in Royal Marines officer cadets rating the sports facilities as good or very good since 2015 (65% to 97%). It should be noted that the base size for the Royal Marines officer cadets is low.
Additional information
Officer Cadets
Number of respondents (all respondents): Total (1,068), Army (319), Royal Navy (349), RAF (368), Marines (32) % positive equals the proportion who say ‘very good ‘or ‘good’ – significant differences and comments based on this
Aggregated totals may not add up to 100% due to rounding. Results less than 3% are not labelled in the chart.
29
41
15
31
50
55
53
53
58
47
10
5
17
8
5
12
3
Total
Army
Navy
RAF
Marines
Very good Good Neither good nor poor Poor Very poor Don't know/ Not applicable/ No answer
Differences
Army Navy RAF Marines
Comparison with previous year
Please refer to notes page for base size of previous years

41
Rating: Opportunity for competitive sport
2011 2012 2013 2014 2015 2016Army 78 83 74 63 74 62Navy 60 28 11 43 66 73RAF 49 43 40 52 46 30Marines 4 9 8 9 10 25
0
20
40
60
80
100
% P
ositi
ve
Army
Navy
RAF
Marines
Trend
Current year results (%)
Please refer to notes page for base size of previous years
19. How would you rate each of the following: Opportunity for competitive sport
• Over half of officer cadets (53%) rated the opportunity for competitive sports as good or very good. This is a decrease since last year (60%).
• Both Army and RAF officer cadets were less likely to rate the opportunity for competitive sports as good or very good than last year (74% to 62% and 46% to 30% respectively).
Additional information
Officer Cadets
Number of respondents (all respondents): Total (1,068), Army (319), Royal Navy (349), RAF (368), Marines (32) % positive equals the proportion who say ‘very good ‘or ‘good’ – significant differences and comments based on this
Aggregated totals may not add up to 100% due to rounding. Results less than 3% are not labelled in the chart.
15
19
22
8
38
43
51
23
25
18
17
16
22
9
17
14
7
28
19
8
5
17
9
3
3
3
38
Total
Army
Navy
RAF
Marines
Very good Good Neither good nor poor Poor Very poor Don't know/ Not applicable/ No answer
Differences
Army Navy RAF Marines
Comparison with previous year

42
Rating: Medical care
2011 2012 2013 2014 2015 2016Army 87 89 89 91 95 91Navy 91 85 94 88 75 85RAF 93 96 94 93 93 91Marines 68 95 84 82 97 100
0
20
40
60
80
100
% P
ositi
ve
Army
Navy
RAF
Marines
Trend
Current year results (%)
19. How would you rate each of the following: Medical Care
• Medical care continued to be rated highly by officer cadets in all Services, with nine out of ten (90%) giving a positive rating. This is an increase since 2015 (86%).
• Since 2015 there has been an increase in Royal Navy officer cadets rating medical care as good (75% to 85%).
Additional information
Officer Cadets
Number of respondents (all respondents): Total (1,068), Army (319), Royal Navy (349), RAF (368), Marines (32) % positive equals the proportion who say ‘very good ‘or ‘good’ – significant differences and comments based on this
Aggregated totals may not add up to 100% due to rounding. Results less than 3% are not labelled in the chart.
44
43
39
49
53
46
48
46
42
47
5
5
5
4
5
3
8
4
Total
Army
Navy
RAF
Marines
Very good Good Neither good nor poor Poor Very poor Don't know/ Not applicable/ No answer
Differences
Army Navy RAF Marines
Comparison with previous year
Please refer to notes page for base size of previous years

43
Rating: Dental care
2011 2012 2013 2014 2015 2016Army 75 80 86 77 89 83Navy 72 73 38 48 44 50RAF 76 87 89 89 87 89Marines 100 95 84 94 94 94
0
20
40
60
80
100
% P
ositi
ve
Army
Navy
RAF
Marines
Trend
Current year results (%)
19. How would you rate each of the following: Dental Care
• Three out of four (75%) officer cadets give a positive rating to dental care which was higher than 2015 (70%), although on a par with the 2014 figure of 78%.
Additional information
Officer Cadets
Number of respondents (all respondents): Total (1,068), Army (319), Royal Navy (349), RAF (368), Marines (32) % positive equals the proportion who say ‘very good or good’ – significant differences and comments based on this
Aggregated totals may not add up to 100% due to rounding. Results less than 3% are not labelled in the chart.
34
36
18
46
50
41
47
32
42
44
9
9
14
5
3
3
6
13
5
28
6
3
Total
Army
Navy
RAF
Marines
Very good Good Neither good nor poor Poor Very poor Don't know/ Not applicable/ No answer
Differences
Army Navy RAF Marines
Comparison with previous year
Please refer to notes page for base size of previous years

44
Rating: Access to IT for personal use
2011 2012 2013 2014 2015 2016Army 29 33 34 51 52 52Navy 74 63 72 80 83 83RAF 43 56 67 60 59 79Marines 46 45 61 33 35 59
0
20
40
60
80
100
% P
ositi
ve
Army
Navy
RAF
Marines
Trend
Current year results (%)
19. How would you rate each of the following: Access to IT for personal use
• Seven in ten (72%) officer cadets rate access to IT for personal use as good or very good and this an increase since 2015 (67%).
• RAF officer cadets were more positive about access to IT for personal use than in 2015 (59% to 79%).
Additional information
Officer Cadets
Number of respondents (all respondents): Total (1,068), Army (319), Royal Navy (349), RAF (368), Marines (32) % positive equals the proportion who say ‘very good ‘or ‘good’ – significant differences and comments based on this
Aggregated totals may not add up to 100% due to rounding. Results less than 3% are not labelled in the chart.
27
12
32
34
28
45
40
50
45
31
15
25
9
12
16
8
13
5
6
25
3
5 4
Total
Army
Navy
RAF
Marines
Very good Good Neither good nor poor Poor Very poor Don't know/ Not applicable/ No answer
Differences
Army Navy RAF Marines
Comparison with previous year
Please refer to notes page for base size of previous years
45
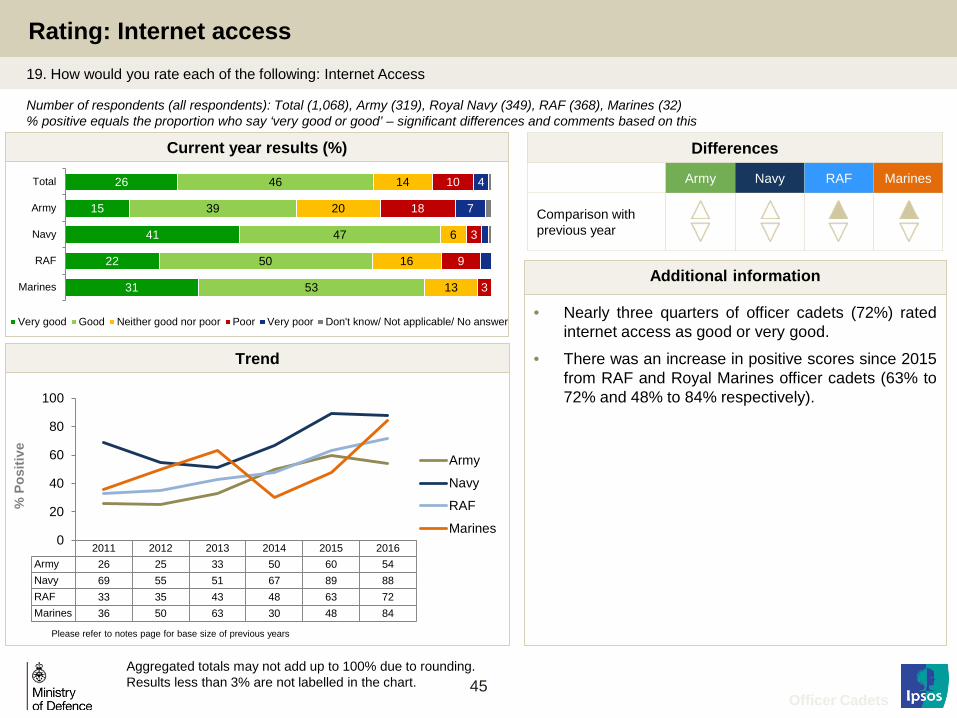
Rating: Internet access
2011 2012 2013 2014 2015 2016Army 26 25 33 50 60 54Navy 69 55 51 67 89 88RAF 33 35 43 48 63 72Marines 36 50 63 30 48 84
0
20
40
60
80
100
% P
ositi
ve
Army
Navy
RAF
Marines
Trend
Current year results (%)
19. How would you rate each of the following: Internet Access
• Nearly three quarters of officer cadets (72%) rated internet access as good or very good.
• There was an increase in positive scores since 2015 from RAF and Royal Marines officer cadets (63% to 72% and 48% to 84% respectively).
Additional information
Officer Cadets
Number of respondents (all respondents): Total (1,068), Army (319), Royal Navy (349), RAF (368), Marines (32) % positive equals the proportion who say ‘very good or good’ – significant differences and comments based on this
Aggregated totals may not add up to 100% due to rounding. Results less than 3% are not labelled in the chart.
26
15
41
22
31
46
39
47
50
53
14
20
6
16
13
10
18
3
9
3
4
7
Total
Army
Navy
RAF
Marines
Very good Good Neither good nor poor Poor Very poor Don't know/ Not applicable/ No answer
Differences
Army Navy RAF Marines
Comparison with previous year
Please refer to notes page for base size of previous years

46
Rating: Access to gym in spare time
2011 2012 2013 2014 2015 2016Army 56 65 67 65 69 80Navy 68 62 77 84 76 78RAF 61 41 44 46 43 54Marines 82 64 45 67 52 72
0
20
40
60
80
100
% P
ositi
ve
Army
Navy
RAF
Marines
Trend
Current year results (%)
19. How would you rate each of the following: Access to gym in spare time
• Seven out of ten officer cadets (70%) rated access to the gym as good or very good. This is an increase since 2015 (63%).
• This increase was primarily driven by Army and RAF officer cadets who were more positive about access to the gym than in 2015 (69% to 80% and 43% to 54% respectively).
Additional information
Officer Cadets
Number of respondents (all respondents): Total (1,068), Army (319), Royal Navy (349), RAF (368), Marines (32) % positive equals the proportion who say ‘very good ‘or ‘good’ – significant differences and comments based on this
Aggregated totals may not add up to 100% due to rounding. Results less than 3% are not labelled in the chart.
24
29
30
14
19
46
51
48
40
53
15
10
14
21
16
10
7
4
18
3
3
5
3 6
Total
Army
Navy
RAF
Marines
Very good Good Neither good nor poor Poor Very poor Don't know/ Not applicable/ No answer
Differences
Army Navy RAF Marines
Comparison with previous year
Please refer to notes page for base size of previous years

47
Rating: Provision of free Wi-Fi hotspots
Current year results (%)
Please refer to notes page for base size of previous years
19. How would you rate each of the following: Provision of free Wi-Fi hotspots
• Over half of officer cadets (57%) rated provision of free Wi-Fi hotspots as good or very good which was higher than 2015 (46%).
• All services saw increases in this amenity since last year.
Additional information
Officer Cadets
Number of respondents (all respondents): Total (1,068), Army (319), Royal Navy (349), RAF (368), Marines (32) % positive equals the proportion who say ‘very good ‘or ‘good’ – significant differences and comments based on this
Aggregated totals may not add up to 100% due to rounding. Results less than 3% are not labelled in the chart.
24
23
42
6
44
33
40
44
16
44
10
19
7
7
13
11
10
3
19
17
7
3
42
4
11
Total
Army
Navy
RAF
Marines
Very good Good Neither good nor poor Poor Very poor Don't know/ Not applicable/ No answer
Differences
Army Navy RAF Marines
Comparison with previous year
2014 2015 2016Army 33 52 63Navy 29 67 86RAF 12 14 22Marines 27 52 88
0
20
40
60
80
100
% P
ositi
ve
Army
Navy
RAF
Marines
Trend

48
Rating: IT support for hardware issues
Current year results (%)
Please refer to notes page for base size of previous years
19. How would you rate each of the following: IT support for hardware issues
• A quarter of officer cadets (27%) rated the IT support for hardware issues as good or very good. However, overall, 44% of officer cadets stated that they did not know, it was not applicable or gave no answer.
• There was an increase amongst RAF officer cadets stating that IT support for hardware issues was good (19% to 27%) following a fall in this score last year.
Additional information
Officer Cadets
Number of respondents (all respondents): Total (1,068), Army (319), Royal Navy (349), RAF (368), Marines (32) % positive equals the proportion who say ‘very good ‘or ‘good’ – significant differences and comments based on this
Aggregated totals may not add up to 100% due to rounding. Results less than 3% are not labelled in the chart.
5
4
8
3
6
22
18
25
23
19
21
25
13
25
13
6
6
11
6
4
44
46
53
34
56
Total
Army
Navy
RAF
Marines
Very good Good Neither good nor poor Poor Very poor Don't know/ Not applicable/ No answer
Differences
Army Navy RAF Marines
Comparison with previous year
2014 2015 2016Army 14 21 22Navy 34 32 33RAF 36 19 27Marines 24 13 25
0
20
40
60
80
100
% P
ositi
ve
Army
Navy
RAF
Marines
Trend

49
Rating: IT support for software issues
Current year results (%)
Please refer to notes page for base size of previous years
19. How would you rate each of the following: IT support for software issues
Additional information
Officer Cadets
Number of respondents (all respondents): Total (1,068), Army (319), Royal Navy (349), RAF (368), Marines (32) % positive equals the proportion who say ‘very good ‘or ‘good’ – significant differences and comments based on this
Aggregated totals may not add up to 100% due to rounding. Results less than 3% are not labelled in the chart.
5
4
8
3
6
23
19
27
23
19
20
24
13
23
13
6
6
11
6
3
45
46
52
36
56
Total
Army
Navy
RAF
Marines
Very good Good Neither good nor poor Poor Very poor Don't know/ Not applicable/ No answer
Differences
Army Navy RAF Marines
Comparison with previous year
2014 2015 2016Army 17 20 23Navy 36 32 35RAF 39 22 26Marines 24 10 25
0
20
40
60
80
100
% P
ositi
ve
Army
Navy
RAF
Marines
Trend

50
Rating: Leisure and retail facilities
Current year results (%)
19. How would you rate each of the following: Leisure and retail facilities
Additional information
Officer Cadets
Number of respondents (all respondents): Total (1,068), Army (319), Royal Navy (349), RAF (368), Marines (32) % positive equals the proportion who say ‘very good ‘or ‘good’ – significant differences and comments based on this
Aggregated totals may not add up to 100% due to rounding. Results less than 3% are not labelled in the chart.
4
7
5
13
37
50
34
27
34
35
34
35
37
41
15
5
19
21
9
4
5
7
4
4
6
3
Total
Army
Navy
RAF
Marines
Very good Good Neither good nor poor Poor Very poor Don't know/ Not applicable/ No answer
Differences
Army Navy RAF Marines
Comparison with previous year
2014 2015 2016Army 47 61 57Navy 39 42 39RAF 33 30 29Marines 33 35 47
0
20
40
60
80
100
% P
ositi
ve
Army
Navy
RAF
Marines
Trend
Please refer to notes page for base size of previous years

51
• Almost one quarter (23%) of officer cadets agreed laundry facilities were good or very good. This is an increase since 2015 (16%).
• In particular, Royal Navy officer cadets were more positive about laundry facilities than last year (15% to 26%).
Additional information
Differences
Army Navy RAF Marines
Comparison with previous year
Current year results (%)
Officer Cadets
Number of respondents (all respondents): Total (1,068), Army (319), Royal Navy (349), RAF (368), Marines (32) % positive equals the proportion who say ‘very good ‘or ‘good’ – significant differences and comments based on this
Aggregated totals may not add up to 100% due to rounding. Results less than 3% are not labelled in the chart.
19. How would you rate each of the following: Laundry facilities
Rating: Laundry facilities
4
7
6
19
21
24
14
16
20
13
24
21
22
35
32
33
38
38
20
24
14
21
19
3
3
4
3
Total
Army
Navy
RAF
Marines
Very good Good Neither good nor poor Poor Very poor Don't know/ Not applicable/ No answer
2015 2016Army 20 28Navy 15 26RAF 15 16Marines 10 22
0
20
40
60
80
100
% P
ositi
ve
Army
Navy
RAF
Marines
Trend
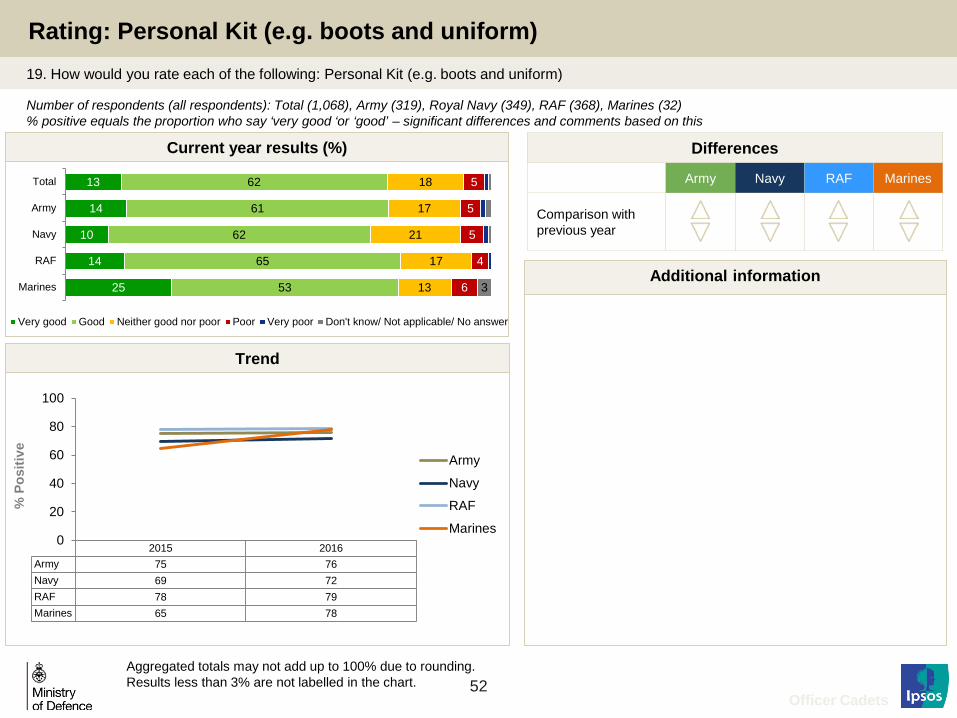
52
Current year results (%)
Officer Cadets
Number of respondents (all respondents): Total (1,068), Army (319), Royal Navy (349), RAF (368), Marines (32) % positive equals the proportion who say ‘very good ‘or ‘good’ – significant differences and comments based on this
Aggregated totals may not add up to 100% due to rounding. Results less than 3% are not labelled in the chart.
19. How would you rate each of the following: Personal Kit (e.g. boots and uniform)
Rating: Personal Kit (e.g. boots and uniform)
13
14
10
14
25
62
61
62
65
53
18
17
21
17
13
5
5
5
4
6 3
Total
Army
Navy
RAF
Marines
Very good Good Neither good nor poor Poor Very poor Don't know/ Not applicable/ No answer
Additional information
Differences
Army Navy RAF Marines
Comparison with previous year
2015 2016Army 75 76Navy 69 72RAF 78 79Marines 65 78
0
20
40
60
80
100
% P
ositi
ve
Army
Navy
RAF
Marines
Trend

53
Rating: Standard of training facilities
Current year results (%)
19. How would you rate each of the following: Standard of training facilities
Officer Cadets
Number of respondents (all respondents): Total (1,068), Army (319), Royal Navy (349), RAF (368), Marines (32) % positive equals the proportion who say good – significant differences and comments based on this
Aggregated totals may not add up to 100% due to rounding. Results less than 3% are not labelled in the chart.
16
23
9
14
47
68
67
69
70
53
13
8
17
13
3
Total
Army
Navy
RAF
Marines
Very good Good Neither good nor poor Poor Very poor Don't know/ Not applicable/ No answer• Over eight out of ten officer cadets (84%) rated the
standard of training facilities as good or very good.
• Army officer cadets were less satisfied with the standard of training facilities than in 2015 (95% to 90%).
• All Royal Marines officer cadets (100%) rated the standard of training facilities as good or very good. However, it should be noted that the base size for the Royal Marines officer cadets is low.
Additional information
Differences
Army Navy RAF Marines
Comparison with previous year
2015 2016Army 95 90Navy 79 78RAF 86 84Marines 100 100
0
20
40
60
80
100
% P
ositi
ve
Army
Navy
RAF
Marines
Trend

54
Current year results (%)
Officer Cadets
Number of respondents (all respondents): Total (1,068), Army (319), Royal Navy (349), RAF (368), Marines (32) % positive equals the proportion who say ‘very good ‘or ‘good’ – significant differences and comments based on this
Aggregated totals may not add up to 100% due to rounding. Results less than 3% are not labelled in the chart.
19. How would you rate each of the following: Food
Rating: Food
13
19
3
17
3
44
55
27
52
47
19
17
23
18
25
13
6
24
8
16
10
23
4
9
Total
Army
Navy
RAF
Marines
Very good Good Neither good nor poor Poor Very poor Don't know/ Not applicable/ No answer• Almost six in every ten officer cadets rated the food
positively (57%). This is an increase on last year (51%).
• Royal Marines officer cadets were more satisfied with food this year with a higher proportion rating the food as good or very good (6% to 50%).
Additional information
Differences
Army Navy RAF Marines
Comparison with previous year
2015 2016Army 80 74Navy 28 30RAF 65 70Marines 6 50
0
20
40
60
80
100
% P
ositi
ve
Army
Navy
RAF
Marines
Trend

55
Whether given enough time to eat meals
Number of respondents (all respondents): Total (1,068), Army (319), Royal Navy (349), RAF (368), Marines (32) % positive equals the proportion who say ‘always’ or ‘often’ – significant differences and comments based on this
2011 2012 2013 2014 2015 2016Army 59 65 64 73 59 59Navy 56 66 51 69 75 70RAF 61 47 48 69 69 75Marines 68 41 55 67 42 75
0
20
40
60
80
100
% P
ositi
ve
Army
Navy
RAF
Marines
Trend
Current year results (%)
25. Were you given enough time to eat your meals?
• Nearly seven out of ten officer cadets (69%) claimed they were given enough time to eat their meals always or often.
• Royal Marines officer cadets were more likely to be positive about this compared to 2015 (42% to 75%).
Additional information
Officer Cadets
Differences
Army Navy RAF Marines
Comparison with previous year
Aggregated totals may not add up to 100% due to rounding. Results less than 3% are not labelled in the chart.
Please refer to notes page for base size of previous years
17
11
18
20
22
52
49
52
55
53
27
35
26
22
25
4
5
3
3
Total
Army
Navy
RAF
Marines
Always Often Sometimes Rarely Never No answer

56
88
95
80
87
100
7
12
7
5
3
8
6
Total
Army
Navy
RAF
Marines
Yes No Don't know
Option to comment on food NEW26. Were you given the option to comment on the food whilst at XXX?
Number of respondents (all respondents): Total (1,068), Army (319), Royal Navy (349), RAF (368), Marines (32) % positive equals the proportion who say ‘yes’ – significant differences and comments based on this Current year results (%)
Officer Cadets
Aggregated totals may not add up to 100% due to rounding. Results less than 3% are not labelled in the chart.
• Nearly nine out of ten officer cadets (88%) stated that they had been given the option to comment on the food whilst at their unit.
• There has been a fall in the proportion of Royal Navy officer cadets who were given the option to comment on food since 2015 (86% to 80%).
• Conversely, RAF and Royal Marines officer cadets were more likely to be given the opportunity to comment (78% to 87% and 84% to 100% respectively).
Additional information
Differences
Army Navy RAF Marines
Comparison with previous year
2015 2016Army 97 95Navy 86 80RAF 78 87Marines 84 100
0
20
40
60
80
100
% P
ositi
ve
Army
Navy
RAF
Marines
Trend

Support

58
Differences
Army Navy RAF Marines
Comparison with previous year
7
7
9
4
9
91
92
86
93
88
3
5
3
Total
Army
Navy
RAF
Marines
Yes No No answer
Learning needs and difficulties 6a. Do you have any learning needs or difficulties?
Number of respondents at 6a: Total (1,068), Army (319), Navy (349), RAF (368), Marines (32) % positive equals the proportion who say ‘yes’ – significant differences and comments based on this
2015 2016Army 8 7Navy 5 9RAF 7 4Marines 6 9
0
20
40
60
80
100
% P
ositi
ve
Army
Navy
RAF
Marines
Trend
Please refer to notes page for base size of previous years
Current year results (%)
Additional information
Officer Cadets
Aggregated totals may not add up to 100% due to rounding. Results less than 3% are not labelled in the chart.

59
Differences
Army Navy RAF Marines
Comparison with previous year
80
82
87
75
20
18
13
25
Total
Army*
Navy
RAF*
Marines**
Yes No
Learning needs and difficulties 6b. Did you tell the staff at XXX that you had a learning need or difficulty?
Number of respondents at 6b: Total (71), Army (22*), Navy (30), RAF (16*), Marines (3**) % positive equals the proportion who say ‘yes’ – significant differences and comments based on this
2015 2016Army* 56 82Navy 63 87RAF* 100 75Marines**
0
20
40
60
80
100
% P
ositi
ve
Army*
Navy
RAF*
Marines**
Trend
Please refer to notes page for base size of previous years
Current year results (%)
Additional information
Officer Cadets
Aggregated totals may not add up to 100% due to rounding. Results less than 3% are not labelled in the chart. * Caution: low base (< 30 respondents)
** Base too small to report
** Base too small to report

60
Differences
Army Navy RAF Marines
Comparison with previous year
72
67
77
67
28
33
23
33
Total
Army*
Navy*
RAF*
Marines**
Yes No
Support for learning needs and difficulties Demog6c. Did you have all the support required for your learning need or difficulty?
Number of respondents: Total (57), Army (18*), Navy (26*), RAF (12*), Marines (1**) % positive equals the proportion who say ‘yes’ – significant differences and comments based on this
2015 2016Army* 60 67Navy* 92 77RAF* 100 67Marines**
0
20
40
60
80
100
% P
ositi
ve
Army*
Navy*
RAF*
Marines**
Trend
Please refer to notes page for base size of previous years
Current year results (%)
• Please note the low base sizes for this question.
Additional information
Officer Cadets
* Caution: low base (< 30 respondents) Aggregated totals may not add up to 100% due to rounding. Results less than 3% are not labelled in the chart.
** Base too small to report
Low base Low base
** Base too small to report

61
Opportunity to talk privately with training staff
Number of respondents (all respondents): Total (1,068), Army (319), Royal Navy (349), RAF (368), Marines (32) % positive equals the proportion who say ‘very good ‘or ‘good’ – significant differences and comments based on this
2011 2012 2013 2014 2015 2016Army 70 73 80 75 86 80Navy 63 75 89 79 84 87RAF 83 91 81 87 82 86Marines 93 82 66 91 74 94
0
20
40
60
80
100
% P
ositi
ve
Army
Navy
RAF
Marines
Trend
Current year results (%)
27. How would you rate the OPPORTUNITY you had to do each of the following at unit if you had wanted to… Talk privately with training staff
• Over four out of five officer cadets with a learning difficulty (85%) rated the opportunity to speak privately to training staff as good or very good.
• There was an increase in the proportion of Royal Marines officer cadets stating the opportunity to speak privately to training staff was good or very good (74% to 94%).
• Please note the answer option ‘not applicable’ was changed to ‘not available’ in 2015.
Additional information
Officer Cadets
Aggregated totals may not add up to 100% due to rounding. Results less than 3% are not labelled in the chart.
Please refer to notes page for base size of previous years
Differences
Army Navy RAF Marines
Comparison with previous year
33
31
33
35
41
51
49
54
50
53
9
13
7
8
6
3
4
4
3
Total
Army
Navy
RAF
Marines
Very good Good Neither good nor poor Poor Very poor Don't know/ Not applicable/ No answer

62
Opportunity to talk privately with Chaplains/Padre
Number of respondents (all respondents): Total (1,068), Army (319), Royal Navy (349), RAF (368), Marines (32) % positive equals the proportion who say ‘very good ‘or ‘good’ – significant differences and comments based on this
2011 2012 2013 2014 2015 2016Army 56 58 60 75 81 80Navy 85 82 85 83 87 88RAF 73 85 81 82 84 86Marines 82 86 92 91 90 91
0
20
40
60
80
100
% P
ositi
ve
Army
Navy
RAF
Marines
Trend
Please refer to notes page for base size of previous years
27. How would you rate the OPPORTUNITY you had to do each of the following at unit if you had wanted to …Talk privately with chaplains/padre
Current year results (%)
• Please note the answer option ‘not applicable’ was changed to ‘not available’ in 2015.
Additional information
Officer Cadets
Aggregated totals may not add up to 100% due to rounding. Results less than 3% are not labelled in the chart.
Differences
Army Navy RAF Marines
Comparison with previous year
46
38
54
46
41
39
41
34
40
50
5
9
4
9
9
10
8
9
Total
Army
Navy
RAF
Marines
Very good Good Neither good nor poor Poor Very poor Don't know/ Not applicable/ No answer

63
Opportunity to keep in contact with family and friends
Number of respondents (all respondents): Total (1,068), Army (319), Royal Navy (349), RAF (368), Marines (32) % positive equals the proportion who say ‘very good ‘or ‘good’ – significant differences and comments based on this
2011 2012 2013 2014 2015 2016Army 60 67 60 58 59 66Navy 71 83 83 87 90 87RAF 55 43 47 61 71 71Marines 96 77 58 58 68 81
0
20
40
60
80
100
% P
ositi
ve
Army
Navy
RAF
Marines
Trend
Please refer to notes page for base size of previous years
27. How would you rate the OPPORTUNITY you had to do each of the following at unit if you had wanted to …Keep in contact with family and friends
Current year results (%)
• Please note the answer option ‘not applicable’ was changed to ‘not available’ in 2015.
Additional information
Officer Cadets
Aggregated totals may not add up to 100% due to rounding. Results less than 3% are not labelled in the chart.
Differences
Army Navy RAF Marines
Comparison with previous year
22
16
31
19
34
52
50
56
52
47
15
20
8
18
13
8
11
4
10
6
3
Total
Army
Navy
RAF
Marines
Very good Good Neither good nor poor Poor Very poor Don't know/ Not applicable/ No answer

64
Opportunity to practice your faith/religion
Number of respondents (all respondents): Total (1,068), Army (319), Royal Navy (349), RAF (368), Marines (32) % positive equals the proportion who say ‘very good ‘or ‘good’ – significant differences and comments based on this
2011 2012 2013 2014 2015 2016Army 35 38 27 31 33 40Navy 54 52 60 58 52 51RAF 24 24 19 25 28 18Marines 18 23 37 27 23 47
0
20
40
60
80
100
% P
ositi
ve Army
Navy
RAF
Marines
Trend
Please refer to notes page for base size of previous years
27. How would you rate the OPPORTUNITY you had to do each of the following at unit if you had wanted to …Practise your faith/religion
Current year results (%)
• Just over a third of officer cadets (36%) said the opportunity to practice faith/religion was good or very good; this is stable since 2015.
• There has been a decrease in the proportion of RAF officer cadets rating the opportunity to practice their faith/religion as good and very good (28% to 18%). However 72% of RAF officer cadets said they didn’t know, that the question was not applicable or did not did not give an answer.
• Conversely, Royal Marines officer cadets were more positive on this element compared to 2015 (23% to 47%).
• Overall half of officer cadets answered ‘don’t know,’, ‘not applicable’ or ‘no answer’ (54%).
• Please note the answer option ‘not applicable’ was changed to ‘not available’ in 2015.
Additional information
Officer Cadets
Aggregated totals may not add up to 100% due to rounding. Results less than 3% are not labelled in the chart.
Differences
Army Navy RAF Marines
Comparison with previous year
14
11
24
7
16
22
29
28
11
31
7
10
3
7
9
4
3
54
45
46
72
44
Total
Army
Navy
RAF
Marines
Very good Good Neither good nor poor Poor Very poor Don't know/ Not applicable/ No answer

65
Differences
Army Navy RAF Marines
Comparison with previous year
40
34
52
33
50
11
10
10
11
19
49
55
39
56
31
Total
Army
Navy
RAF
Marines
Yes No Does not apply to me No answer
Someone to go to for administrative problems 28. Whether or not you needed to, if you had any problems with administration (pay, posting, JPA etc.) was there someone to help you deal with them?
Number of respondents (all respondents): Total (1,068), Army (319), Royal Navy (349), RAF (368), Marines (32) % positive equals the proportion who say ‘yes’ – significant differences and comments based on this
2011 2012 2013 2014 2015 2016Army 35 33 39 25 30 34Navy 41 46 36 54 54 52RAF 51 41 42 29 36 33Marines 50 36 55 33 42 50
0
20
40
60
80
100
% P
ositi
ve
Army
Navy
RAF
Marines
Trend
Please refer to notes page for base size of previous years
Current year results (%)
Additional information
Officer Cadets
Aggregated totals may not add up to 100% due to rounding. Results less than 3% are not labelled in the chart.

66
Availability of staff for problems out of training hours 30. Whether or not you needed to, was there a member of staff easily available for you to go to if you had a problem outside of training hours?
Number of respondents (all respondents): Total (1,068), Army (319), Royal Navy (349), RAF (368), Marines (32) % positive equals the proportion who say ‘yes’ – significant differences and comments based on this Current year results (%)
2011 2012 2013 2014 2015 2016Army 66 69 69 68 82 76Navy 49 52 70 77 71 70RAF 62 90 75 79 75 73Marines 71 55 68 82 84 75
0
20
40
60
80
100
% P
ositi
ve
Army
Navy
RAF
Marines
Please refer to notes page for base size of previous years
Trend
Additional information
Officer Cadets
Aggregated totals may not add up to 100% due to rounding. Results less than 3% are not labelled in the chart.
Differences
Army Navy RAF Marines
Comparison with previous year
73
76
70
73
75
8
9
11
5
3
19
14
18
22
19 3
Total
Army
Navy
RAF
Marines
Yes No Don't know No answer

67
Opportunity to raise all concerns with person in authority 30. Whether or not you needed to, did you feel that you had the opportunity to raise all your concerns with a person in authority at unit?
Number of respondents (all respondents): Total (1,068), Army (319), Royal Navy (349), RAF (368), Marines (32) % positive equals the proportion who say ‘yes’ – significant differences and comments based on this
2011 2012 2013 2014 2015 2016Army 70 76 71 63 79 76Navy 70 69 81 70 74 74RAF 81 87 73 85 81 76Marines 75 77 63 79 68 91
0
20
40
60
80
100
% P
ositi
ve
Army
Navy
RAF
Marines
Please refer to notes page for base size of previous years
Trend
Current year results (%)
• Just over three quarters of officer cadets (76%) felt they had the opportunity to raise all their concerns with a person in authority.
• Royal Marines officer cadets were more likely to give a positive response than in 2015 (68% to 91%).
Additional information
Officer Cadets
Differences
Army Navy RAF Marines
Comparison with previous year
Aggregated totals may not add up to 100% due to rounding. Results less than 3% are not labelled in the chart.
76
76
74
76
91
18
19
17
18
6
6
5
9
6
3
Total
Army
Navy
RAF
Marines
Yes No Don't know No answer

68
Someone to go to for personal or emotional problems 30. Whether or not you needed to, did you have someone at unit that you were happy to go to if you had any personal or emotional problems?
Number of respondents (all respondents): Total (1,068), Army (319), Royal Navy (349), RAF (368), Marines (32) % positive equals the proportion who say ‘yes’ – significant differences and comments based on this
2011 2012 2013 2014 2015 2016Army 70 76 73 77 83 82Navy 78 80 89 76 79 83RAF 86 91 79 88 90 85Marines 71 68 71 82 87 88
0
20
40
60
80
100
% P
ositi
ve
Army
Navy
RAF
Marines
Please refer to notes page for base size of previous years
Trend
Current year results (%)
• Over four out of every five officer cadets (83%) said they had someone to go to for personal and emotional problems.
• RAF officer cadets were less likely to give a positive response compared to 2015 (90%, down to 85%).
Additional information
Officer Cadets
Differences
Army Navy RAF Marines
Comparison with previous year
Aggregated totals may not add up to 100% due to rounding. Results less than 3% are not labelled in the chart.
83
82
83
85
88
10
13
9
8
3
6
3
8
8
6 3
Total
Army
Navy
RAF
Marines
Yes No Don't know No answer
Fairness

70
90
86
92
91
91
9
11
7
8
9
3
Total
Army
Navy
RAF
Marines
Yes No Do not wish to answer
Awareness of how to complain about poor or unfair treatment or bullying 37. Do you know how to complain about poor or unfair treatment or bullying at unit?
Number of respondents (all respondents): Total (1,068), Army (319), Royal Navy (349), RAF (368), Marines (32) % positive equals the proportion who say ‘yes’ – significant differences and comments based on this Current year results (%)
2014 2015 2016Army 92 93 86Navy 93 92 92RAF 93 92 91Marines 85 68 91
0
20
40
60
80
100
% P
ositi
ve
Army
Navy
RAF
Marines
Please refer to notes page for base size of previous years
Trend Trend
• Nine out of every ten officer cadets (90%) stated that they knew how to complain about poor or unfair treatment or bullying at their unit.
• Since last year, a lower proportion of Army officer cadets knew how to complain about poor or unfair treatment (93%, down to 86%).
• However, there has been an increase in Royal Marines officer cadets knowing how to complain since 2015 (68%, up to 91%).
Additional information
Officer Cadets
Aggregated totals may not add up to 100% due to rounding. Results less than 3% are not labelled in the chart.
Differences
Army Navy RAF Marines
Comparison with previous year

71
25
23
27
23
38
53
48
57
54
56
9
12
5
10
13
17
11
13
6
Total
Army
Navy
RAF
Marines
Yes, fully To some extent No, not at all Haven't heard of Service Complaints Comissioner
Number of respondents (all respondents): Total (1,068), Army (319), Royal Navy (349), RAF (368), Marines (32) % positive equals the proportion who say ‘yes fully’ – significant differences and comments based on this
2014 2015 2016Army 32 40 23Navy 31 34 27RAF 43 31 23Marines 21 26 38
0
20
40
60
80
100
% P
ositi
ve
Army
Navy
RAF
Marines
Please refer to notes page for base size of previous years
Trend Trend
Current year results (%)
• Overall, a quarter (25%) were fully aware of how the Service Complaints Ombudsman could help them with a complaint. This is a drop since 2015 (34%).
• Full awareness amongst Army, Royal Navy and RAF officer cadets has fallen since 2015 (40% to 23%, 34% to 27% and 31% to 23%, respectively).
Additional information
Officer Cadets
37scc. Do you know how the Services Complaints Ombudsman can help you with a discrimination, harassment and/or bullying complaint?
Knowledge of Service Complaints Ombudsman
Differences
Army Navy RAF Marines
Comparison with previous year
Aggregated totals may not add up to 100% due to rounding. Results less than 3% are not labelled in the chart.
(wording will change to Service Complaints Ombudsman from 2016)

72
48
46
46
47
88
14
17
14
13
3
32
29
35
36
9
6
8
6
5
Total
Army
Navy
RAF
Marines
Yes No I don't know Do not wish to answer
Whether believe complaints are dealt with in a fair manner 38a. Generally, do you believe that complaints are dealt with in a fair manner at unit?
Number of respondents (all respondents): Total (1,068), Army (319), Royal Navy (349), RAF (368), Marines (32) % positive equals the proportion who say ‘yes’ – significant differences and comments based on this
2014 2015 2016Army 52 62 46Navy 51 50 46RAF 61 58 47Marines 58 52 88
0
20
40
60
80
100
% P
ositi
ve
Army
Navy
RAF
Marines
Please refer to notes page for base size of previous years
Trend Trend
Current year results (%)
• Just under half (48%) of all officer cadets believed that complaints were dealt with in a fair manner. This is a decrease since last year (56%).
• The proportion of Army and RAF officer cadets who felt that complaints were dealt with in a fair manner has decreased since 2015 (62% to 46% and 58% to 47%, respectively).
• A higher proportion of Marines officer cadets believed complaints are dealt with fairly compared with last year (52%, up to 88%).
Additional information
Officer Cadets
Differences
Army Navy RAF Marines
Comparison with previous year
Aggregated totals may not add up to 100% due to rounding. Results less than 3% are not labelled in the chart.

73
38b. Why do you feel that complaints are not dealt with in a fair manner?
Number of respondents (all respondents who said that they did not feel that complaints were dealt with in a fair manner): Total (151), Army (55), Royal Navy (48), RAF (47), Marines (1**)
55 56
44
64
38 33
42 38 38 35
42 38 35 36 35 34 34
31
52
21 26
20
40
21 17
20 21
9 4 5
2 4
0
10
20
30
40
50
60
70
Total Army Navy RAF Marines**
If you complain it causes you problems on the course Complaining is bad for your career People are not believed/taken seriously People who complain are considered troublemakers Nothing is ever done about complaints Higher ranks are always taken more seriously Anything else/ something different from above Do not wish to answer
** Base too small to report
Current year results (%)
• The top reason for not believing that complaints were dealt with in a fair manner was that complaining causes you problems on the course (55%). This was followed by the beliefs that complaining is bad for your career (38%) and people who complain are not taken seriously (38%). However, quite a range of other options shown on the questionnaire were selected as well.
• Base sizes for this question are low so results should be viewed with caution.
Additional information
Reason why complaints are not dealt with in a fair manner
Officer Cadets
* Caution: low base (< 30 respondents)

74
Fair treatment of cadets
Number of respondents (all respondents): Total (1,068), Army (319), Royal Navy (349), RAF (368), Marines (32) % positive equals the proportion who say ‘always’ or ‘most of the time’ – significant differences and comments based on this
40. Please indicate how often the following statements apply: Cadets were all treated fairly
Officer Cadets
Aggregated totals may not add up to 100% due to rounding. Results less than 3% are not labelled in the chart.
Current year results (%)
17
13
18
15
53
54
56
56
51
38
21
21
19
25
6
7
7
5
8
3
Total
Army
Navy
RAF
Marines
Always Most of the time Sometimes Rarely Never Do not wish to answer
2015 2016Army 75 70Navy 81 74RAF 74 67Marines 68 91
0
20
40
60
80
100
% P
ositi
ve
Army
Navy
RAF
Marines
Trend Trend
• Seven in ten (71%) officer cadets felt that all cadets were treated fairly. This is a decrease since last year (77%).
• Since last year, there has been a decrease in the proportion of Royal Navy and RAF officer cadets who felt that all cadets were treated fairly (81% to 74% and 74% to 67%, respectively).
• In contrast there has been an increase in the proportion of Royal Marines cadets who felt that they were treated fairly compared with 2015 (68%, increased to 91%).
Additional information
Differences
Army Navy RAF Marines
Comparison with previous year

75
Fair treatment
Number of respondents (all respondents): Total (1,068), Army (319), Royal Navy (349), RAF (368), Marines (32) % positive equals the proportion who say ‘always’ or ‘most of the time’ – significant differences and comments based on this
2014 2015 2016Army 88 90 86Navy 88 92 90RAF 84 91 89Marines 85 81 94
0
20
40
60
80
100
% P
ositi
ve
Army
Navy
RAF
Marines
Trend Trend
Current year results (%)
Please refer to notes page for base size of previous years
40. Please indicate how often the following statements apply: I was treated fairly
• Nearly nine out of ten (88%) officer cadets felt that they were treated fairly always or most of the time.
• BAME officer cadets were less likely to feel that they had been treated fairly (77%), compared with white officer cadets (89%).
Additional information
Officer Cadets
Differences
Army Navy RAF Marines
Comparison with previous year
Aggregated totals may not add up to 100% due to rounding. Results less than 3% are not labelled in the chart.
41
32
45
43
50
48
54
44
46
44
9
11
8
9
6
Total
Army
Navy
RAF
Marines
Always Most of the time Sometimes Rarely Never Do not wish to answer

76
Sexual or racial harassment during training
Number of respondents (all respondents): Total (1,068), Army (319), Royal Navy (349), RAF (368), Marines (32) % positive equals the proportion who say ‘always’ or ‘most of the time’ – significant differences and comments based on this
2014 2015 2016Army 97 98 96Navy 91 92 95RAF 96 98 98Marines 88 97 94
0
20
40
60
80
100
% P
ositi
ve
Army
Navy
RAF
Marines
Trend
Current year results (%)
Please refer to notes page for base size of previous years
40. Please indicate how often the following statements apply: Training was conducted without sexual or racial harassment
• 96% of officer cadets reported that training was conducted without sexual or racial harassment always or most of the time.
• BAME officer cadets were less likely to agree, with 88% saying that training was conducted without sexual or racial harassment compared with 97% of white officer cadets.
Additional information
Officer Cadets
Differences
Army Navy RAF Marines
Comparison with previous year
Aggregated totals may not add up to 100% due to rounding. Results less than 3% are not labelled in the chart.
81
80
80
83
91
15
17
14
15
3
3
3
4
6
Total
Army
Navy
RAF
Marines
Always Most of the time Sometimes Rarely Never Do not wish to answer

77
5
5
4
7
86
85
88
84
97
9
10
8
9
3
Total
Army
Navy
RAF
Marines
Yes No Do not wish to answer
Whether badly or unfairly treated by staff 42a. Do you believe that you were badly or unfairly treated by the staff whilst at college?
Number of respondents (all respondents): Total (1,068), Army (319), Royal Navy (349), RAF (368), Marines (32) Significant differences based on % who say ‘yes’ Current year results (%)
2011 2012 2013 2014 2015 2016Army 13 5 8 5 5 5Navy 9 15 6 5 3 4RAF 3 7 12 6 3 7Marines 0 0 16 6 6 0
0
20
40
60
80
100
% Y
es
Army
Navy
RAF
Marines
Please refer to notes page for base size of previous years
Trend
• 5% of officer cadets thought they were badly or unfairly treated by staff.
• Compared to last year, more RAF officer cadets have felt that they were badly or unfairly treated (3% to 7%).
Additional information
Officer Cadets
Aggregated totals may not add up to 100% due to rounding. Results less than 3% are not labelled in the chart.
Differences
Army Navy RAF Marines
Comparison with previous year
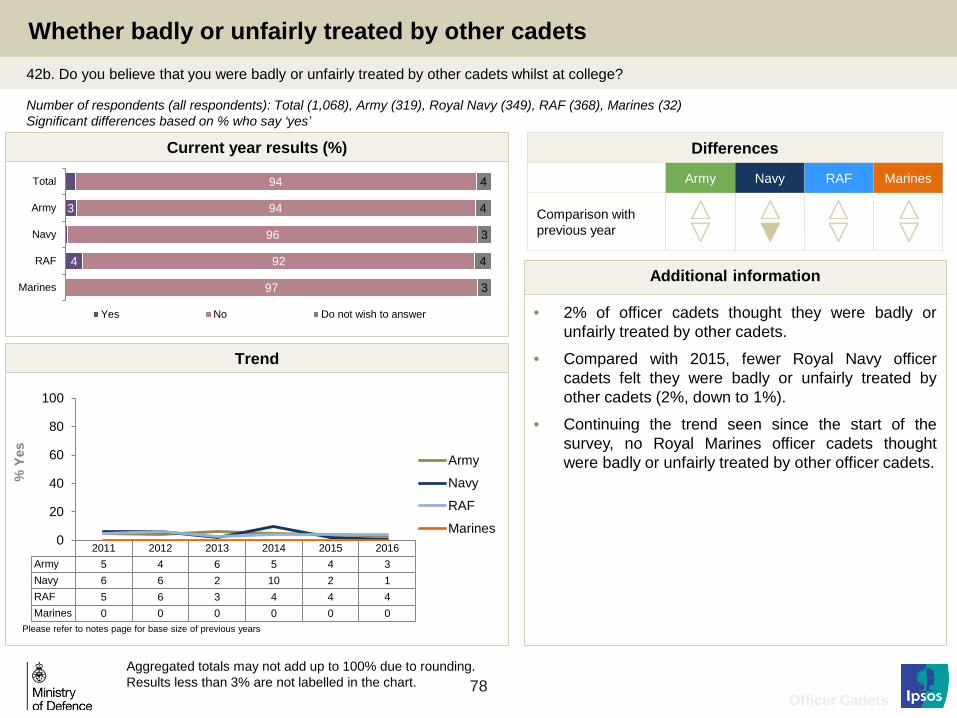
78
Whether badly or unfairly treated by other cadets 42b. Do you believe that you were badly or unfairly treated by other cadets whilst at college?
Number of respondents (all respondents): Total (1,068), Army (319), Royal Navy (349), RAF (368), Marines (32) Significant differences based on % who say ‘yes’ Current year results (%)
2011 2012 2013 2014 2015 2016Army 5 4 6 5 4 3Navy 6 6 2 10 2 1RAF 5 6 3 4 4 4Marines 0 0 0 0 0 0
0
20
40
60
80
100
% Y
es
Army
Navy
RAF
Marines
Please refer to notes page for base size of previous years
Trend
• 2% of officer cadets thought they were badly or unfairly treated by other cadets.
• Compared with 2015, fewer Royal Navy officer cadets felt they were badly or unfairly treated by other cadets (2%, down to 1%).
• Continuing the trend seen since the start of the survey, no Royal Marines officer cadets thought were badly or unfairly treated by other officer cadets.
Additional information
Officer Cadets
Aggregated totals may not add up to 100% due to rounding. Results less than 3% are not labelled in the chart.
Differences
Army Navy RAF Marines
Comparison with previous year
3
4
94
94
96
92
97
4
4
3
4
3
Total
Army
Navy
RAF
Marines
Yes No Do not wish to answer

79
42a. Do you believe that you were badly or unfairly treated by other cadets whilst at unit? 42b. Do you believe that you were badly or unfairly treated by the staff whilst at unit?
Whether badly or unfairly treated by staff or other cadets
Number of respondents (all respondents): Total (1,068), Army (319), Royal Navy (349), RAF (368), Marines (32) Significant differences based on % who say ‘yes’ to either question Current year results (%)
2011 2012 2013 2014 2015 2016Army 16 8 13 9 8 6Navy 14 17 9 13 4 4RAF 8 10 14 9 6 8Marines 0 0 16 6 6 0
0
20
40
60
80
100
% Y
es
Army
Navy
RAF
Marines
Please refer to notes page for base size of previous years
Trend
• The responses to the two questions about bad or unfair treatment by staff and other officer cadets have been combined to show reported levels of officer cadets experiencing bad or unfair treatment overall.
• 6% of officer cadets believed they were badly or unfairly treated by staff or other officer cadets.
• Female officer cadets are more likely to say they were badly or unfairly treated than male officer cadets (13% and 5%, respectively).
Additional information
Officer Cadets
Aggregated totals may not add up to 100% due to rounding. Results less than 3% are not labelled in the chart.
Differences
Army Navy RAF Marines
Comparison with previous year
6
6
4
8
92
92
95
89
100
Total
Army
Navy
RAF
Marines
Yes No Do not wish to answer

80
37 35
29
42
35 30
21
45
34
40 36
29 26
35 36
16 12
0 0
26
11 10 7
13
3 0
7 3 3 5
0 3
9 10
0
13 8
0
7
13
05
101520253035404550
Total Army* Navy* RAF Marines**
I spoke to my friends/family I spoke to a fellow cadet I did nothing I spoke to a member of military staff I spoke to the Padre/Chaplain
I made an informal complaint I made a formal complaint I spoke to a member of civilian staff Anything else/ something different Do not wish to answer
44. Which of the following did you do following the unfair treatment you experienced?
Number of respondents (all respondents who felt that they were badly or unfairly treated): Total (65), Army (20*), Royal Navy (14*), RAF (31), Marines (0**)
Current year results (% of officer cadets)
• Base sizes for this question are particularly low (especially within Service) so results should be viewed with caution.
• The top action by officer cadets who felt they were badly or unfairly treated was to speak to friends and family (37%), closely followed by speaking to a fellow cadet (35%) and doing nothing (34%).
Additional information
Action taken as a result of bad or unfair treatment
Officer Cadets
* Caution: low base (< 30 respondents)
** Base too small to report

81
18
30
14 13 12 15
0
16
9 15
0
10 5
0 0
10 3
0
7 3 2 0
7
0
37 40
29
39 35
20
50
39
0
10
20
30
40
50
60
Total Army* Navy* RAF Marines**
Because of your sex Because of where you come from Because of your social background/class Because of your age
Because of your race, colour or ethnic origin Because of your sexual orientation Anything else/ something different from above Do not wish to answer
45. Why do you think you were badly or unfairly treated?
Number of respondents (all respondents who felt they were badly or unfairly treated): Total (65), Army (20*), Royal Navy (14*), RAF (31), Marines (0**)
Current year results (% of officer cadets)
• Base sizes for this question are particularly low (especially within Service) so results should be viewed with caution.
• The top perceived reason for bad or unfair treatment was because of the cadet’s sex (18%), followed by where they come from (12%). However, a higher proportion of cadets felt that their poor treatment was due to other unspecified reasons. A number chose not to answer this question.
Additional information
Perceived reason for bad or unfair treatment
Officer Cadets
* Caution: low base (< 30 respondents)
** Base too small to report

82
45. If you did not complain about any incident of bad or unfair treatment, why was this?
Number of respondents (all respondents who said they were badly or unfairly treated by staff or other trainees and who did not make a complaint): Total (65), Army (20*), Royal Navy (13*), RAF (31), Marines (0**)
48 55
23
55
41 40
62
32
41 40
54
35 38 40 38 35 31 30 31 32 30
45
8
29 30 25
46
26 25 20
38
23
9 15 15
3 6 0
15
6 5 5 0
6 3 0 0
6 8 5 0
13 9
5
15 10
0
10
20
30
40
50
60
70
Total Army* Navy* RAF Marines** I thought it would cause problems on the course I thought I would be considered a troublemaker I thought it might be bad for my career I did not believe anything would be done if I did complain I thought that it would be repeated or get worse I considered the incident(s) to be too minor to report I did not want to go through the complaints procedure I did not think people would believe me/take me seriously It was too difficult I did not know what to do I was persuaded not to I did not know who to complain to Anything else/ something different from above Do not wish to answer
Current year results (% of officer cadets)
• Base sizes for this question are particularly low (especially within Service) so results should be viewed with caution.
• A sizeable number of officer cadets who did not complain said this was because they thought it would cause problems on their course (48%). In addition, 41% of officer cadets said that they would be considered a troublemaker or they thought it might be bad for their career. Generally a number of the pre-coded answers were selected in response to this question.
Additional information
Reason for not complaining about bad or unfair treatment
Officer Cadets
* Caution: low base (< 30 respondents)
** Base too small to report

Setbacks during training

84
52
61
49
44
84
10
9
8
12
3
38
30
43
44
13
Total
Army
Navy
RAF
Marines
Yes and I reported it. Yes but I did not report it. No
Illness or injury during training 51. Were you ever ill or injured during training?
Number of respondents (all respondents ): Total (1,068), Army (319), Royal Navy (349), RAF (368), Marines (32) Comments and significant differences based on % saying ‘yes and I reported it’ Current year results (%)
2011 2012 2013 2014 2015 2016Army 65 66 62 61 59 61Navy 56 53 79 48 55 49RAF 53 62 51 47 58 44Marines 64 77 79 45 81 84
0
20
40
60
80
100
% Y
es a
nd I
repo
rted
it
Army
Navy
RAF
Marines
Please refer to notes page for base size of previous years
Trend
• 52% of officer cadets were ill or injured during training and reported it. This is a decrease since last year (58% to 52%), back to the level reported in 2014.
• There was a decrease in reported injuries amongst RAF officer cadets (58% to 44%).
Additional information
Officer Cadets
Aggregated totals may not add up to 100% due to rounding. Results less than 3% are not labelled in the chart.
Differences
Army Navy RAF Marines
Comparison with previous year

85
Whether illness/injury was properly dealt with
Number of respondents (all respondents who were ill or injured and reported it): Total (553), Army (193), Royal Navy (171), RAF (162), Marines (27*) % positive equals the proportion who say ‘strongly agree’ or ‘agree’ – significant differences and comments based on this
2011 2012 2013 2014 2015 2016Army 85 85 84 92 81 87Navy 83 88 92 83 83 88RAF 89 90 86 86 92 92Marines* 72 71 83 93 88 96
0
20
40
60
80
100
% P
ositi
ve
Army
Navy
RAF
Marines*
Trend
Current year results (%)
Please refer to notes page for base size of previous years
52. Please indicate how you feel about the following statements: My injury/illness was properly dealt with
Additional information
Officer Cadets Aggregated totals may not add up to 100% due to rounding. Results less than 3% are not labelled in the chart.
Differences
Army Navy RAF Marines
Comparison with previous year
47
44
47
48
59
42
42
41
44
37
4
6
4
4
5
6
7
3
4
Total
Army
Navy
RAF
Marines*
Strongly agree Agree Neither agree nor disagree Disagree Strongly disagree Don't Know
* Caution: low base (< 30 respondents)
Base size too low to
test significant differences

86
Staff help and support during illness/injury
2011 2012 2013 2014 2015 2016Army 71 75 73 75 74 71Navy 73 86 95 85 80 90RAF 89 90 81 90 85 85Marines* 72 82 63 80 84 93
0
20
40
60
80
100
% P
ositi
ve
Army
Navy
RAF
Marines*
Trend
Current year results (%)
Please refer to notes page for base size of previous years
52. Please indicate how you feel about the following statements: Staff helped and supported me when I was ill/injured
Number of respondents (all respondents who were ill or injured and reported it): Total (553), Army (193), Royal Navy (171), RAF (162), Marines (27*) % positive equals the proportion who say ‘strongly agree’ or ‘agree’ – significant differences and comments based on this
• Four in every five (82%) officer cadets who were ill or injured felt that staff helped and supported them when they were ill.
• The proportion of ill or injured Royal Navy officer cadets who felt that staff helped and supported them during their illness or injury has increased since last year (80% to 90%).
Additional information
Officer Cadets
Differences
Army Navy RAF Marines
Comparison with previous year
43
35
49
43
59
39
36
42
43
33
10
13
8
11
6
13
7
3
Total
Army
Navy
RAF
Marines*
Strongly agree Agree Neither agree nor disagree Disagree Strongly disagree Don't Know
Aggregated totals may not add up to 100% due to rounding. Results less than 3% are not labelled in the chart.
* Caution: low base (< 30 respondents)
Base size too low to
test significant differences

87
Advice for others on reporting sick
2011 2012 2013 2014 2015 2016Army 38 40 36 38 21 34Navy 12 11 19 40 24 20RAF 25 33 22 24 20 23Marines* 44 47 27 27 16 26
0
20
40
60
80
100
% M
easu
re
Army
Navy
RAF
Marines*
Trend
Current year results (%)
Please refer to notes page for base size of previous years
52. Please indicate how you feel about the following statements: I would advise others in a similar situation not to report sick if they can avoid it
Number of respondents (all respondents who were ill or injured and reported it): Total (553), Army (193), Royal Navy (171), RAF (162), Marines (27*) % measure equals the proportion who say ‘strongly agree’ or ‘agree’ – significant differences and comments based on this
• Just over a quarter (26%) of officer cadets said they would advise other cadets in a similar situation not to report sick if they can avoid it.
• There was a rise in the proportion of Army officer cadets who would advise others not to report sick (21%, increased to 34%).
Additional information
Officer Cadets
Differences
Army Navy RAF Marines
Comparison with previous year
10
15
8
8
7
16
19
13
15
19
17
16
17
20
7
32
31
31
29
56
24
19
29
27
11
3
Total
Army
Navy
RAF
Marines*
Strongly agree Agree Neither agree nor disagree Disagree Strongly disagree Don't Know
Aggregated totals may not add up to 100% due to rounding. Results less than 3% are not labelled in the chart.
* Caution: low base (< 30 respondents)
Base size too low to
test significant differences

88
53. Why did you not report it?
Number of respondents (all respondents who were ill or injured and did not report it): Total (105), Army (30), Royal Navy (29*), RAF (45), Marines (1**)
70
57
76 76
50 47 52 51
29
47
24 20
13
23 17
4 11
20
10 7 10
17 14
4 8 10 7 7 1 0 0 2
0
10
20
30
40
50
60
70
80
Total Army Navy* RAF Marines** I did not wish to risk delaying my training It was too minor I felt that other trainees or staff would consider me weak if I did so I was afraid I would be medically discharged I would not report sick, unless I was told to I feel that people who report sick are weak Other No answer
Current year results (%)
• The most common reason for not reporting an illness or injury was that officer cadets did not wish to risk delaying their training (70%), and this was also the main reason given by officer cadets in 2015.
• The second and third ranked reasons were that the illness/injury was too minor (50%) and the fear that other trainees or staff would consider them weak (29%), respectively.
• There was a rise in the proportion of officer cadets feeling that other trainees or staff would consider them weak if they reported their injury (13% in 2015, up to 29% in 2016).
Additional information
Reason for not reporting illness or injury
Officer Cadets
* Caution: low base (< 30 respondents)
** Base too small to report

89
Differences
Army Navy RAF Marines
Comparison with previous year
Result of not reporting sick 54. What was the result of not reporting sick?
89
80
97
89
3
7
7
10
3
7
3
Total
Army
Navy*
RAF
Marines**No impactIllness/injury worsened - forced to temporarily leave training to recoverIllness/injury worsened - forced to leave unit to recoverOther impactNo answer
Number of respondents (all respondents who were ill or injured and did not report it): Total (105), Army (30), Royal Navy (29*), RAF (45), Marines (1**) Significant differences and comments based on proportion who say ‘No impact’
Current year results (%)
Additional information
Officer Cadets
2011 2012 2013 2014 2015 2016Army 68 83 81 58 81 80Navy* 88 91 86RAF 90 92 91 100 89Marines**
0
20
40
60
80
100
% N
o im
pact
Army
Navy*
RAF
Marines**
Trend
Aggregated totals may not add up to 100% due to rounding. Results less than 3% are not labelled in the chart.
* Caution: low base (< 30 respondents)
Base size too low to
test significant differences
Base size too low to
test significant differences
** Base too small to report
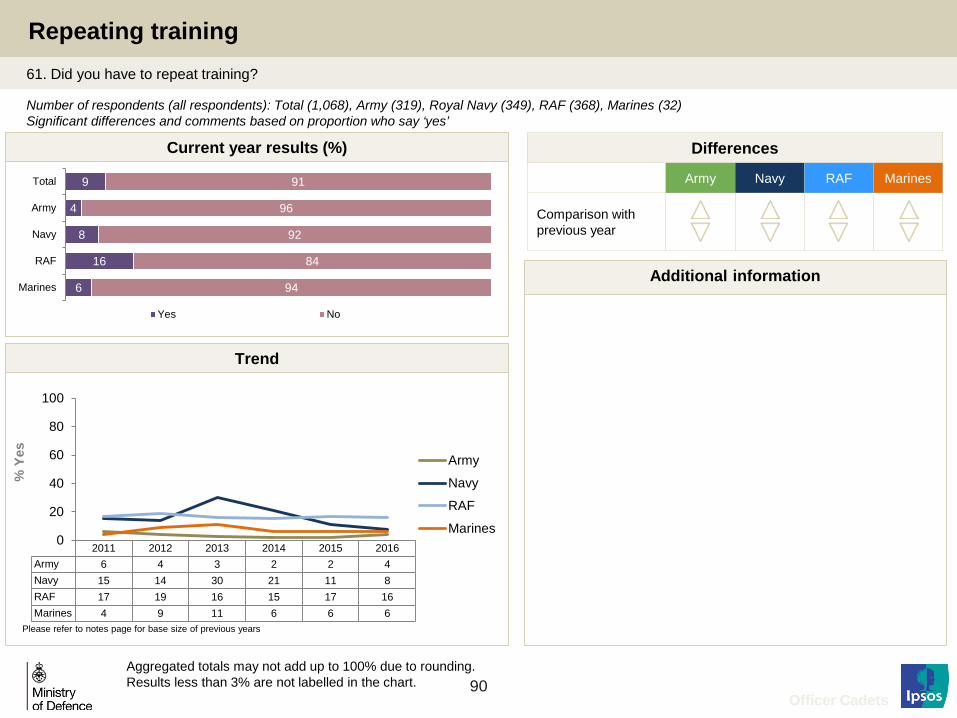
90
Repeating training 61. Did you have to repeat training?
Number of respondents (all respondents): Total (1,068), Army (319), Royal Navy (349), RAF (368), Marines (32) Significant differences and comments based on proportion who say ‘yes’ Current year results (%)
2011 2012 2013 2014 2015 2016Army 6 4 3 2 2 4Navy 15 14 30 21 11 8RAF 17 19 16 15 17 16Marines 4 9 11 6 6 6
0
20
40
60
80
100
% Y
es
Army
Navy
RAF
Marines
Please refer to notes page for base size of previous years
Trend
Additional information
Officer Cadets
9
4
8
16
6
91
96
92
84
94
Total
Army
Navy
RAF
Marines
Yes No
Aggregated totals may not add up to 100% due to rounding. Results less than 3% are not labelled in the chart.
Differences
Army Navy RAF Marines
Comparison with previous year
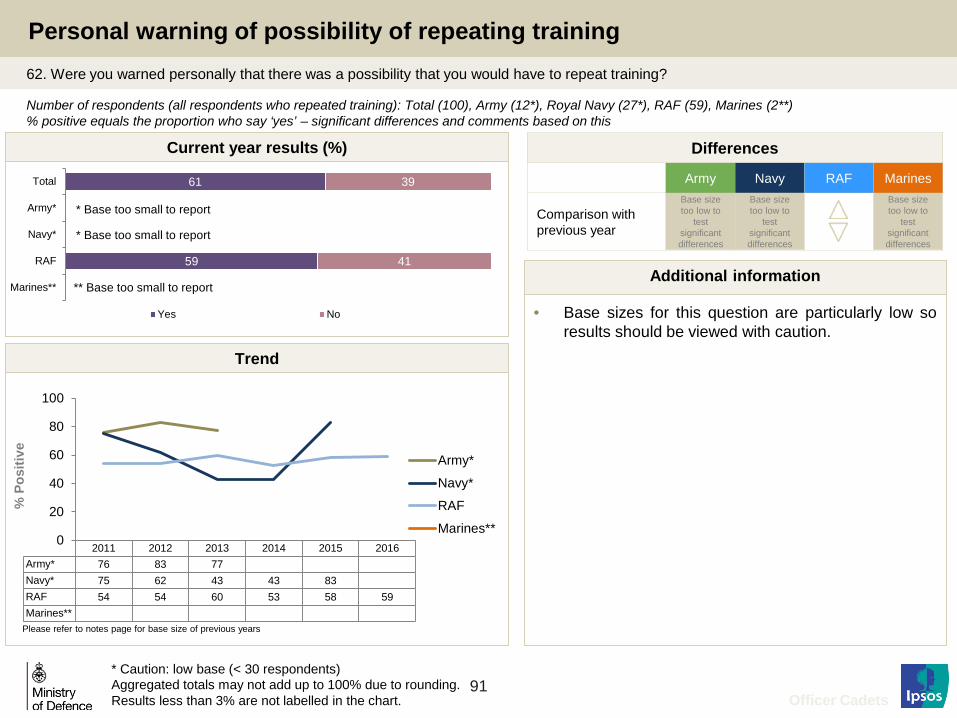
91
62. Were you warned personally that there was a possibility that you would have to repeat training?
Personal warning of possibility of repeating training
Number of respondents (all respondents who repeated training): Total (100), Army (12*), Royal Navy (27*), RAF (59), Marines (2**) % positive equals the proportion who say ‘yes’ – significant differences and comments based on this Current year results (%)
2011 2012 2013 2014 2015 2016Army* 76 83 77Navy* 75 62 43 43 83RAF 54 54 60 53 58 59Marines**
0
20
40
60
80
100
% P
ositi
ve
Army*
Navy*
RAF
Marines**
Please refer to notes page for base size of previous years
Trend
• Base sizes for this question are particularly low so results should be viewed with caution.
Additional information
Officer Cadets
Differences
Army Navy RAF Marines
Comparison with previous year
61
59
39
41
Total
Army*
Navy*
RAF
Marines**
Yes No
Aggregated totals may not add up to 100% due to rounding. Results less than 3% are not labelled in the chart.
* Caution: low base (< 30 respondents)
Base size too low to
test significant differences
Base size too low to
test significant differences
Base size too low to
test significant differences
** Base too small to report
* Base too small to report
* Base too small to report

92
63. What reasons were you given for being repeating training?
Number of respondents (all respondents who had to repeat training): Total (100), Army (12*), Royal Navy (27*), RAF (59), Marines (2**)
35
41
24 25 21
14 15 14
5 7
05
1015202530354045
Total Army* Navy* RAF Marines**
Anything else/something different I was told my attitude or behaviour/conduct was inappropriate Failed a trade or skill test Medical Failed a fitness test
Current year results (%)
• The top reason given from the answer options on the questionnaire for having to repeat training was inappropriate attitude or behaviour (24%). This is a change since last year, when the top reason was failing a trade or skills test (28%). Please note, however, that a sizeable proportion selected the ‘something else’ answer option.
• Base sizes for this question are particularly low so results should be viewed with caution.
Additional information
Reason given for repeating training
Officer Cadets
* Caution: low base (< 30 respondents)
** Base too small to report * Base too small to report * Base too small to report

93
62
75
63
58
38
25
37
42
Total
Army*
Navy*
RAF
Marines**
Yes No
Whether agreed with repeating training 64. Did you agree with the reasons given for repeating training?
Number of respondents (all respondents who had to repeat training): Total (100), Army (12*), Royal Navy (27*), RAF (59), Marines (2**) % positive equals the proportion who say ‘yes’ – significant differences and comments based on this Current year results (%)
2011 2012 2013 2014 2015 2016Army* 64 71 54 75Navy* 78 76 71 62 73 63RAF 73 77 70 69 62 58Marines**
0
20
40
60
80
100
% P
ositi
ve
Army*
Navy*
RAF
Marines**
Please refer to notes page for base size of previous years
Trend
• Base sizes for this question are particularly low so results should be viewed with caution.
Additional information
Officer Cadets
Differences
Army Navy RAF Marines
Comparison with previous year
Aggregated totals may not add up to 100% due to rounding. Results less than 3% are not labelled in the chart.
* Caution: low base (< 30 respondents)
Base size too low to
test significant differences
Base size too low to
test significant differences
Base size too low to
test significant differences
** Base too small to report

94
66. Do you feel you were given every opportunity to improve in order to avoid repeating training?
35
50
33
31
52
42
56
54
13
8
11
15
Total
Army*
Navy*
RAF
Marines**
Yes No Not applicable
Opportunity to avoid repeating training
Number of respondents (all respondents who had to repeat training): Total (100), Army (12*), Royal Navy (27*), RAF (59), Marines (2**) % positive equals the proportion who say ‘yes’ – significant differences and comments based on this Current year results (%)
2011 2012 2013 2014 2015 2016Army* 12 42 46 50Navy* 25 48 36 24 39 33RAF 31 31 15 22 47 31Marines**
0
20
40
60
80
100
% P
ositi
ve
Army*
Navy*
RAF
Marines**
Please refer to notes page for base size of previous years
Trend
• Base sizes for this question are particularly low so results should be viewed with caution.
Additional information
Officer Cadets
Differences
Army Navy RAF Marines
Comparison with previous year
Base size too low to
test significant differences
Aggregated totals may not add up to 100% due to rounding. Results less than 3% are not labelled in the chart.
* Caution: low base (< 30 respondents)
Base size too low to
test significant differences
Base size too low to
test significant differences
** Base too small to report

General

96
Satisfaction with training experience
Number of respondents: Total (1,068), Army (319), Navy (349), RAF (368), Marines (32) % positive equals the proportion who say ‘extremely satisfied’ or ‘satisfied’ – significant differences and comments based on this
2015 2016Army 92 89Navy 69 65RAF 88 85Marines 68 94
0
20
40
60
80
100
% P
ositi
ve
Army
Navy
RAF
Marines
Trend
Current year results (%)
Please refer to notes page for base size of previous years
KPI1. Taking everything into account, how would you rate your overall satisfaction with the training experience you have had at your unit?
• Four fifths (80%) of officer cadets said they were satisfied with the training experience at their college.
• There has been an increase in the proportion of Royal Marines officer cadets rating their satisfaction with the training experience positively since last year (68%, up to 94%).
Additional information
Officer Cadets
Aggregated totals may not add up to 100% due to rounding. Results less than 3% are not labelled in the chart.
Differences
Army Navy RAF Marines
Comparison with previous year
4
6
5
13
26
37
13
26
44
50
46
51
53
38
8
6
13
7
3
8
4
14
6
3
3
4
Total
Army
Navy
RAF
Marines
Extremely satisfied Very satisfied Satisfied Neither satisfied nor dissatisfied Unsatisfied Very unsatisfied Extremely unsatisfied
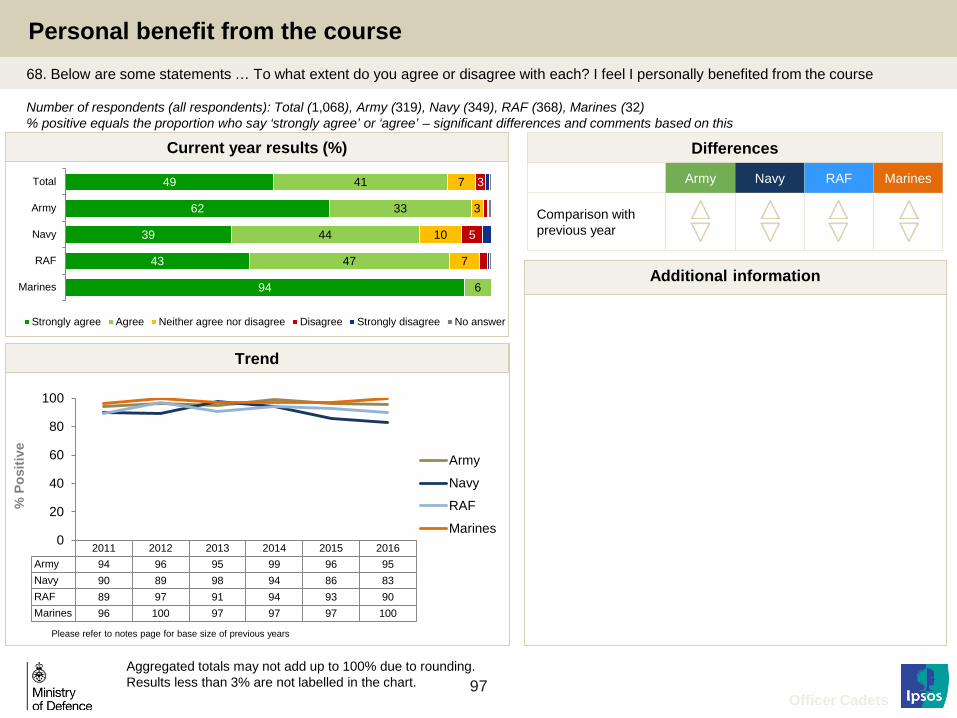
97
Personal benefit from the course
Number of respondents (all respondents): Total (1,068), Army (319), Navy (349), RAF (368), Marines (32) % positive equals the proportion who say ‘strongly agree’ or ‘agree’ – significant differences and comments based on this
2011 2012 2013 2014 2015 2016Army 94 96 95 99 96 95Navy 90 89 98 94 86 83RAF 89 97 91 94 93 90Marines 96 100 97 97 97 100
0
20
40
60
80
100
% P
ositi
ve
Army
Navy
RAF
Marines
Trend
Current year results (%)
Please refer to notes page for base size of previous years
68. Below are some statements … To what extent do you agree or disagree with each? I feel I personally benefited from the course
Additional information
Officer Cadets
Aggregated totals may not add up to 100% due to rounding. Results less than 3% are not labelled in the chart.
Differences
Army Navy RAF Marines
Comparison with previous year
49
62
39
43
94
41
33
44
47
6
7
3
10
7
3
5
Total
Army
Navy
RAF
Marines
Strongly agree Agree Neither agree nor disagree Disagree Strongly disagree No answer

98
Sense of achievement
2011 2012 2013 2014 2015 2016Army 93 96 93 95 95 96Navy 86 91 98 89 90 84RAF 94 93 90 95 95 90Marines 96 100 95 97 100 100
0
20
40
60
80
100
% P
ositi
ve
Army
Navy
RAF
Marines
Trend
Current year results (%)
Please refer to notes page for base size of previous years
Number of respondents (all respondents): Total (1,068), Army (319), Navy (349), RAF (368), Marines (32) % positive equals the proportion who say ‘strongly agree’ or ‘agree’ – significant differences and comments based on this
• Nine in ten (90%) officer cadets felt a sense of achievement. This is a decrease since last year (93%).
• This decrease is driven by a decline in the number of Royal Navy and RAF officer cadets who agreed that they felt a sense of achievement (90% to 84% and 95% to 90%, respectively).
Additional information
Officer Cadets
68. Below are some statements … To what extent do you agree or disagree with each? I feel a sense of achievement
Aggregated totals may not add up to 100% due to rounding. Results less than 3% are not labelled in the chart.
Differences
Army Navy RAF Marines
Comparison with previous year
54
65
45
50
97
35
31
39
39
3
6
3
9
6
3
5
3
Total
Army
Navy
RAF
Marines
Strongly agree Agree Neither agree nor disagree Disagree Strongly disagree No answer

99
Challenge
2011 2012 2013 2014 2015 2016Army 91 97 92 94 98 94Navy 81 79 98 86 84 77RAF 88 93 89 85 87 84Marines 96 100 97 100 100 100
0
20
40
60
80
100
% P
ositi
ve
Army
Navy
RAF
Marines
Trend
Current year results (%)
Please refer to notes page for base size of previous years
Number of respondents (all respondents): Total (1,068), Army (319), Navy (349), RAF (368), Marines (32) % positive equals the proportion who say ‘strongly agree’ or ‘agree’ – significant differences and comments based on this
• 85% of officer cadets agreed that they felt challenged. This is a fall since last year (89%).
• This decrease is due in part to a drop in the proportion of Army and Royal Navy officer cadets who felt challenged compared with 2015 (98% to 94% and 84% to 77%, respectively).
Additional information
Officer Cadets
68. Below are some statements … To what extent do you agree or disagree with each? I felt challenged
Aggregated totals may not add up to 100% due to rounding. Results less than 3% are not labelled in the chart.
Differences
Army Navy RAF Marines
Comparison with previous year
44
61
36
33
88
41
33
41
52
13
9
4
13
10
4
8
4
Total
Army
Navy
RAF
Marines
Strongly agree Agree Neither agree nor disagree Disagree Strongly disagree No answer

100
Training comparison to expectations
2011 2012 2013 2014 2015 2016Army 70 74 65 74 77 76Navy 51 67 64 58 54 53RAF 63 65 60 63 62 57Marines 79 64 63 79 90 84
0
20
40
60
80
100
% P
ositi
ve
Army
Navy
RAF
Marines
Trend
Current year results (%)
Please refer to notes page for base size of previous years
Number of respondents (all respondents): Total (1,068), Army (319), Navy (349), RAF (368), Marines (32) % positive equals the proportion who say ‘strongly agree’ or ‘agree’ – significant differences and comments based on this
Additional information
Officer Cadets
68. Below are some statements … To what extent do you agree or disagree with each? The training was what I expected
Aggregated totals may not add up to 100% due to rounding. Results less than 3% are not labelled in the chart.
Differences
Army Navy RAF Marines
Comparison with previous year
16
27
10
10
50
46
50
43
47
34
20
13
26
23
13
15
9
19
18
3
Total
Army
Navy
RAF
Marines
Strongly agree Agree Neither agree nor disagree Disagree Strongly disagree No answer
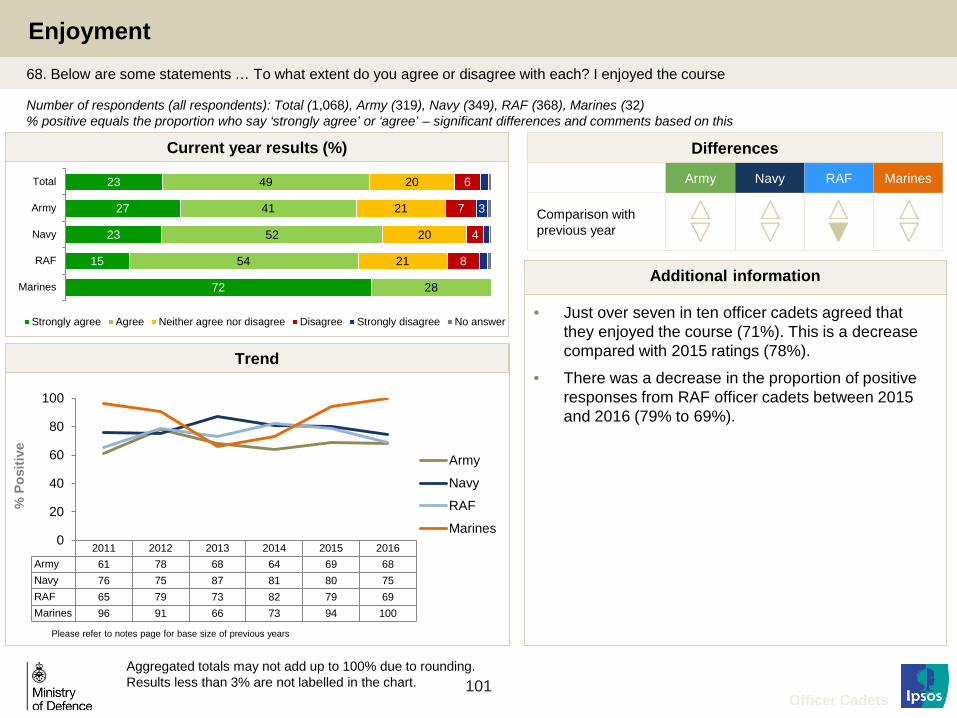
101
Enjoyment
2011 2012 2013 2014 2015 2016Army 61 78 68 64 69 68Navy 76 75 87 81 80 75RAF 65 79 73 82 79 69Marines 96 91 66 73 94 100
0
20
40
60
80
100
% P
ositi
ve
Army
Navy
RAF
Marines
Trend
Current year results (%)
Please refer to notes page for base size of previous years
Number of respondents (all respondents): Total (1,068), Army (319), Navy (349), RAF (368), Marines (32) % positive equals the proportion who say ‘strongly agree’ or ‘agree’ – significant differences and comments based on this
• Just over seven in ten officer cadets agreed that they enjoyed the course (71%). This is a decrease compared with 2015 ratings (78%).
• There was a decrease in the proportion of positive responses from RAF officer cadets between 2015 and 2016 (79% to 69%).
Additional information
Officer Cadets
68. Below are some statements … To what extent do you agree or disagree with each? I enjoyed the course
Aggregated totals may not add up to 100% due to rounding. Results less than 3% are not labelled in the chart.
Differences
Army Navy RAF Marines
Comparison with previous year
23
27
23
15
72
49
41
52
54
28
20
21
20
21
6
7
4
8
3
Total
Army
Navy
RAF
Marines
Strongly agree Agree Neither agree nor disagree Disagree Strongly disagree No answer
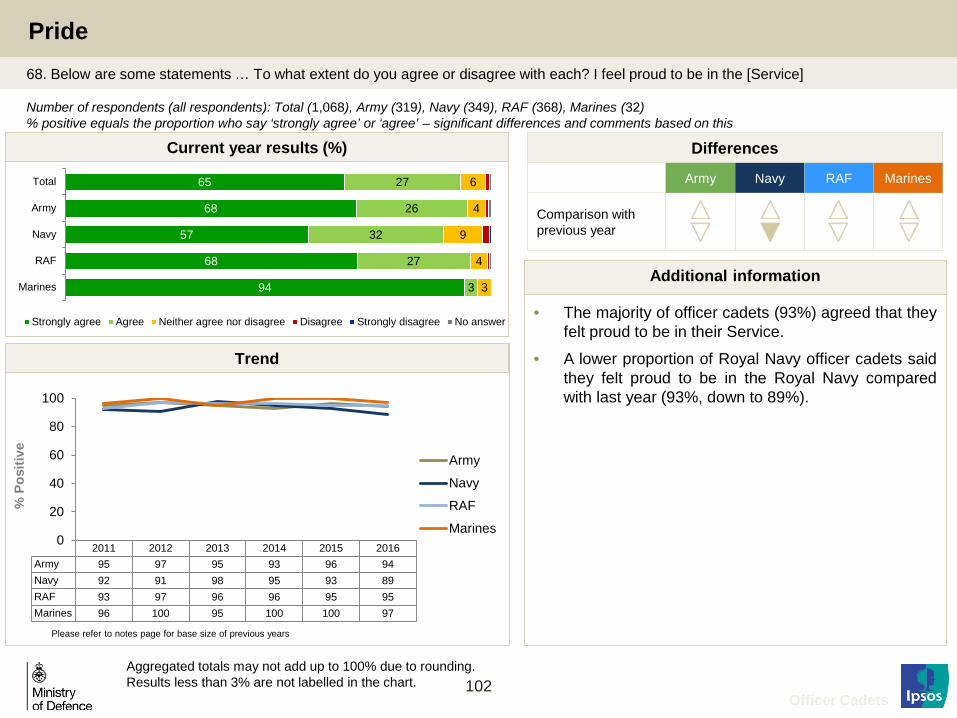
102
Pride
2011 2012 2013 2014 2015 2016Army 95 97 95 93 96 94Navy 92 91 98 95 93 89RAF 93 97 96 96 95 95Marines 96 100 95 100 100 97
0
20
40
60
80
100
% P
ositi
ve
Army
Navy
RAF
Marines
Trend
Current year results (%)
Please refer to notes page for base size of previous years
Number of respondents (all respondents): Total (1,068), Army (319), Navy (349), RAF (368), Marines (32) % positive equals the proportion who say ‘strongly agree’ or ‘agree’ – significant differences and comments based on this
• The majority of officer cadets (93%) agreed that they felt proud to be in their Service.
• A lower proportion of Royal Navy officer cadets said they felt proud to be in the Royal Navy compared with last year (93%, down to 89%).
Additional information
Officer Cadets
68. Below are some statements … To what extent do you agree or disagree with each? I feel proud to be in the [Service]
Aggregated totals may not add up to 100% due to rounding. Results less than 3% are not labelled in the chart.
Differences
Army Navy RAF Marines
Comparison with previous year
65
68
57
68
94
27
26
32
27
3
6
4
9
4
3
Total
Army
Navy
RAF
Marines
Strongly agree Agree Neither agree nor disagree Disagree Strongly disagree No answer

103
Morale
2011 2012 2013 2014 2015 2016Army 83 90 85 77 84 68Navy 85 86 94 91 86 84RAF 84 75 87 89 89 76Marines 93 95 63 88 100 97
0
20
40
60
80
100
% P
ositi
ve
Army
Navy
RAF
Marines
Trend
Current year results (%)
Please refer to notes page for base size of previous years
Number of respondents (all respondents): Total (1,068), Army (319), Navy (349), RAF (368), Marines (32) % positive equals the proportion who say ‘strongly agree’ or ‘agree’ – significant differences and comments based on this
• Over three quarters (77%) of officer cadets felt morale was good on their course. This is a drop of ten percentage points since 2015 (87%).
• This decrease is partly driven by a decrease in the number of Army and RAF officer cadets feeling that morale was good (84% to 68% and 89% to 76%, respectively).
Additional information
Officer Cadets
68. Below are some statements … To what extent do you agree or disagree with each? Morale was good on my course
Aggregated totals may not add up to 100% due to rounding. Results less than 3% are not labelled in the chart.
Differences
Army Navy RAF Marines
Comparison with previous year
38
34
41
33
81
40
34
44
43
16
15
21
11
15
3
6
9
3
7
Total
Army
Navy
RAF
Marines
Strongly agree Agree Neither agree nor disagree Disagree Strongly disagree No answer

104
Regular feedback on performance
Number of respondents (all respondents): Total (1,068), Army (319), Navy (349), RAF (368), Marines (32) % positive equals the proportion who say ‘strongly agree’ or ‘agree’ – significant differences and comments based on this
2011 2012 2013 2014 2015 2016Army 67 71 66 69 77 77Navy 58 62 66 69 68 60RAF 77 78 77 64 63 66Marines 61 50 55 85 77 38
0
20
40
60
80
100
% P
ositi
ve
Army
Navy
RAF
Marines
Trend
Current year results (%)
Please refer to notes page for base size of previous years
68. Below are some statements … To what extent do you agree or disagree with each? I received regular feedback on my performance
• Two thirds of officer cadets (66%) agreed or strongly agreed that they received regular feedback on their performance.
• Since last year, less Royal Navy and Royal Marines officer cadets received regular feedback (68% to 60% and 77% to 38%, respectively).
Additional information
Officer Cadets
Aggregated totals may not add up to 100% due to rounding. Results less than 3% are not labelled in the chart.
Differences
Army Navy RAF Marines
Comparison with previous year
19
23
19
17
13
47
54
41
48
25
19
15
21
20
31
12
7
15
13
25
4
6
Total
Army
Navy
RAF
Marines
Strongly agree Agree Neither agree nor disagree Disagree Strongly disagree No answer

105
Explanation of training objectives and aims
2011 2012 2013 2014 2015 2016Army 75 82 77 74 78 86Navy 70 70 83 75 76 69RAF 83 69 81 81 78 79Marines 89 73 61 97 84 81
0
20
40
60
80
100
% P
ositi
ve
Army
Navy
RAF
Marines
Trend
Current year results (%)
Please refer to notes page for base size of previous years
Number of respondents (all respondents): Total (1,068), Army (319), Navy (349), RAF (368), Marines (32) % positive equals the proportion who say ‘strongly agree’ or ‘agree’ – significant differences and comments based on this
• Almost four in every five (78%) cadets agreed that training objectives and aims were explained to them.
• Since 2015, there has been an increase in the proportion of Army officer cadets agreeing with this statement (78%, up to 86%).
• However, there has been a decline in the proportion of Royal Navy officer cadets who felt that the training objectives and aims were explained to them since last year (76%, down to 69%).
Additional information
Officer Cadets
68. Below are some statements … To what extent do you agree or disagree with each? Training objectives and aims were explained to me
Aggregated totals may not add up to 100% due to rounding. Results less than 3% are not labelled in the chart.
Differences
Army Navy RAF Marines
Comparison with previous year
21
25
20
19
31
56
61
49
60
50
14
10
17
15
19
6
3
9
5
5
Total
Army
Navy
RAF
Marines
Strongly agree Agree Neither agree nor disagree Disagree Strongly disagree No answer

106
Commitment of staff/instructors to support success
2011 2012 2013 2014 2015 2016Army 75 81 80 77 85 77Navy 73 72 91 75 78 75RAF 84 81 85 87 87 81Marines 89 77 61 91 84 91
0
20
40
60
80
100
% P
ositi
ve
Army
Navy
RAF
Marines
Trend
Current year results (%)
Please refer to notes page for base size of previous years
Number of respondents (all respondents): Total (1,068), Army (319), Navy (349), RAF (368), Marines (32) % positive equals the proportion who say ‘‘strongly agree’ or ‘agree’ – significant differences and comments based on this
• Just under four fifths of cadets (78%) agreed that staff and instructors did everything they could to help cadets succeed. This is a decrease since last year (83%).
• Falls in the proportions of Army and RAF officer cadets who felt that staff were committed to their success since last year (85% to 77% and 87% to 81% respectively) have contributed to this overall decrease.
Additional information
Officer Cadets
68. Below are some statements … To what extent do you agree or disagree with each? The staff/instructors did all they could to help me succeed
Aggregated totals may not add up to 100% due to rounding. Results less than 3% are not labelled in the chart.
Differences
Army Navy RAF Marines
Comparison with previous year
30
38
25
26
59
48
40
50
55
31
16
15
19
15
6
5
7
5
3
3
Total
Army
Navy
RAF
Marines
Strongly agree Agree Neither agree nor disagree Disagree Strongly disagree No answer
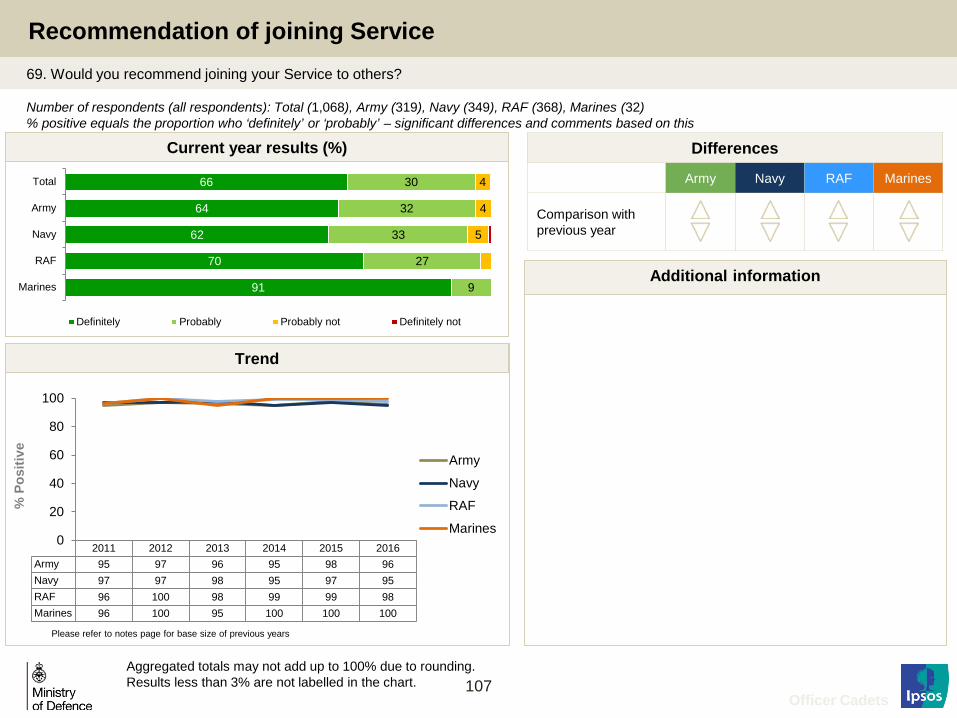
107
Recommendation of joining Service
2011 2012 2013 2014 2015 2016Army 95 97 96 95 98 96Navy 97 97 98 95 97 95RAF 96 100 98 99 99 98Marines 96 100 95 100 100 100
0
20
40
60
80
100
% P
ositi
ve
Army
Navy
RAF
Marines
Trend
Current year results (%)
Please refer to notes page for base size of previous years
Number of respondents (all respondents): Total (1,068), Army (319), Navy (349), RAF (368), Marines (32) % positive equals the proportion who ‘definitely’ or ‘probably’ – significant differences and comments based on this
Additional information
Officer Cadets
69. Would you recommend joining your Service to others?
Aggregated totals may not add up to 100% due to rounding. Results less than 3% are not labelled in the chart.
Differences
Army Navy RAF Marines
Comparison with previous year
66
64
62
70
91
30
32
33
27
9
4
4
5
Total
Army
Navy
RAF
Marines
Definitely Probably Probably not Definitely not

108
Perceptions of pay compared with non-military friends at home
Number of respondents (all respondents): Total (1,068), Army (319), Navy (349), RAF (368), Marines (32) % positive equals the proportion who say ‘mine is much better ‘or ‘mine is better’ – significant differences and comments based on this
2011 2012 2013 2014 2015 2016Army 36 34 33 34 40 34Navy 65 61 68 57 58 52RAF 55 56 48 47 46 48Marines 54 73 63 42 23 38
0
20
40
60
80
100
% P
ositi
ve
Army
Navy
RAF
Marines
Trend
Current year results (%)
Please refer to notes page for base size of previous years
71. How do you think your pay compares with your non-military friends at home?
Additional information
Officer Cadets
Aggregated totals may not add up to 100% due to rounding. Results less than 3% are not labelled in the chart.
Differences
Army Navy RAF Marines
Comparison with previous year
12
4
19
13
6
33
30
33
36
31
30
30
32
28
28
21
31
12
19
34
4
5
3
4
Total
Army
Navy
RAF
Marines
Much better Better About the same Worse Much worse No answer

Hopes for the future
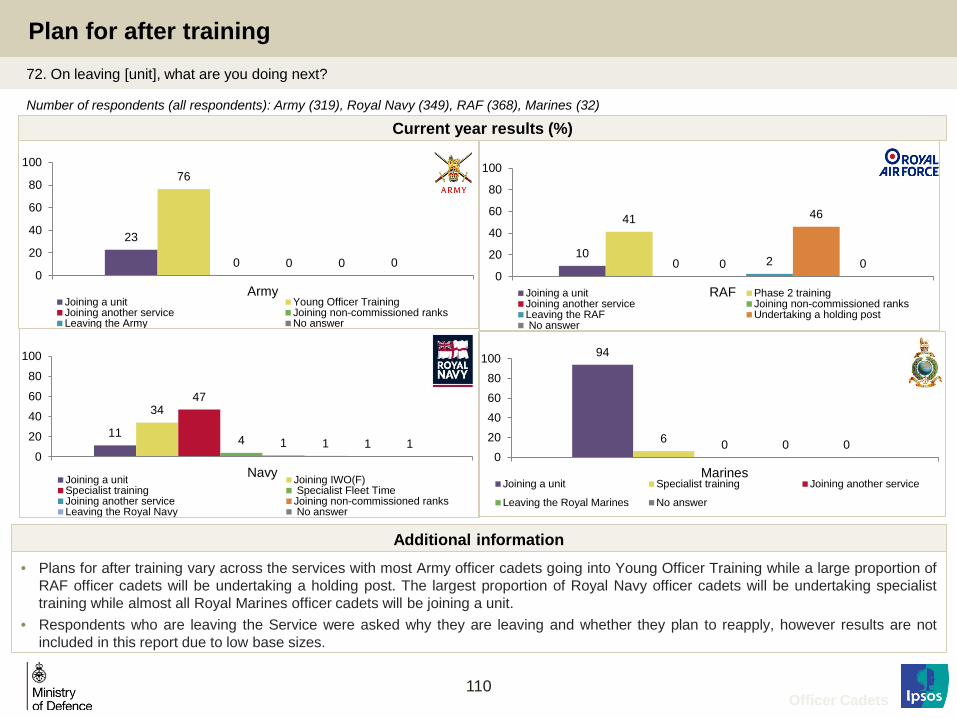
110
23
76
0 0 0 0 0
20
40
60
80
100
ArmyJoining a unit Young Officer TrainingJoining another service Joining non-commissioned ranksLeaving the Army No answer
Current year results (%)
Plan for after training
Officer Cadets
72. On leaving [unit], what are you doing next?
Number of respondents (all respondents): Army (319), Royal Navy (349), RAF (368), Marines (32)
11
34 47
4 1 1 1 1 0
20
40
60
80
100
NavyJoining a unit Joining IWO(F)Specialist training Specialist Fleet TimeJoining another service Joining non-commissioned ranksLeaving the Royal Navy No answer
94
6 0 0 0 0
20406080
100
MarinesJoining a unit Specialist training Joining another service
Leaving the Royal Marines No answer
• Plans for after training vary across the services with most Army officer cadets going into Young Officer Training while a large proportion of RAF officer cadets will be undertaking a holding post. The largest proportion of Royal Navy officer cadets will be undertaking specialist training while almost all Royal Marines officer cadets will be joining a unit.
• Respondents who are leaving the Service were asked why they are leaving and whether they plan to reapply, however results are not included in this report due to low base sizes.
Additional information
10
41
0 0 2
46
0 0
20
40
60
80
100
RAFJoining a unit Phase 2 trainingJoining another service Joining non-commissioned ranksLeaving the RAF Undertaking a holding post No answer

111
11
65
23
1 0
10203040506070
Army3 years 4-12 years 13 years or more No answer
Current year results (%)
Intended length of stay in the Service
Officer Cadets
78. How long do you intend to stay in the Service?
Number of respondents (all respondents): Army (319), Royal Navy (347), RAF (359), Marines (32)
2
13
35
50
0 0
10
20
30
40
50
60
RAFLess than 6 years 7-11 years 12-16 years 17 years or more No answer
2
27 33
38
0 05
10152025303540
NavyLess than 3 years 4-9 years 10-16 years 16 years or more No answer
6
44
19
31
0 05
101520253035404550
MarinesLess than 5 years 6-10 years 11-15 years 16 years or more No answer

112
24
21
26
22
41
59
66
54
58
59
12
9
16
12
4
3
3
8
Total
Army
Navy
RAF
Marines
Strongly agree Agree Neither agree nor disagree Disagree Strongly disagree No answer
Preparedness to go onto the next stage of career
Number of respondents (all respondents who are not leaving the Service): Total (1,057), Army (319), Royal Navy (347), RAF (359), Marines (32) % positive equals the proportion who ‘‘strongly agree’ or ‘agree’ – significant differences and comments based on this
2011 2012 2013 2014 2015 2016Army 89 92 88 83 91 87Navy 88 89 87 83 84 80RAF 93 97 88 91 88 80Marines 93 95 86 91 100 100
0
20
40
60
80
100
% P
ositi
ve
Army
Navy
RAF
Marines
Trend
Current year results (%)
Please refer to notes page for base size of previous years
79. To what extent do you agree with the following statement? – I feel prepared to go on to the next stage of my career/training
• 83% of officer cadets from all services feel prepared to go on to the next stage of their career or training. This is a smaller proportion than seen last year (87%).
• Fewer RAF officer cadets feel prepared to go on to the next stage of training compared with 2015 (88% to 80%).
• Notable, all Royal Marines officer cadets (100%) agreed or strongly agreed that they felt prepared to go onto the next stage of their career or training (no change since last year).
Additional information
Officer Cadets
Totals may not add up to 100% due to rounding. Scores of less than 3% are not labelled.
Differences
Army Navy RAF Marines
Comparison with previous year

Respondent profiles

114
87 3 3 6
England Ireland Northern Ireland Scotland Wales Something different from above
Sample Profile: where from, background, religion 11. Where are you from?, 12. What is your background, 13. Are you…? [religion]
Officer Cadets
93
Any white background Asian Mixed Ethnic background Any other ethnic background I'd rather not say
55 39 3
Christian No religion Other I'd rather not say
Where are you from?
Background
Religion
Number of respondents (all respondents): Army (319)
Totals may not add up to 100% due to rounding Results less than 3% are not labelled in the chart.
The image part with relationship ID rId6 was not found in the file.
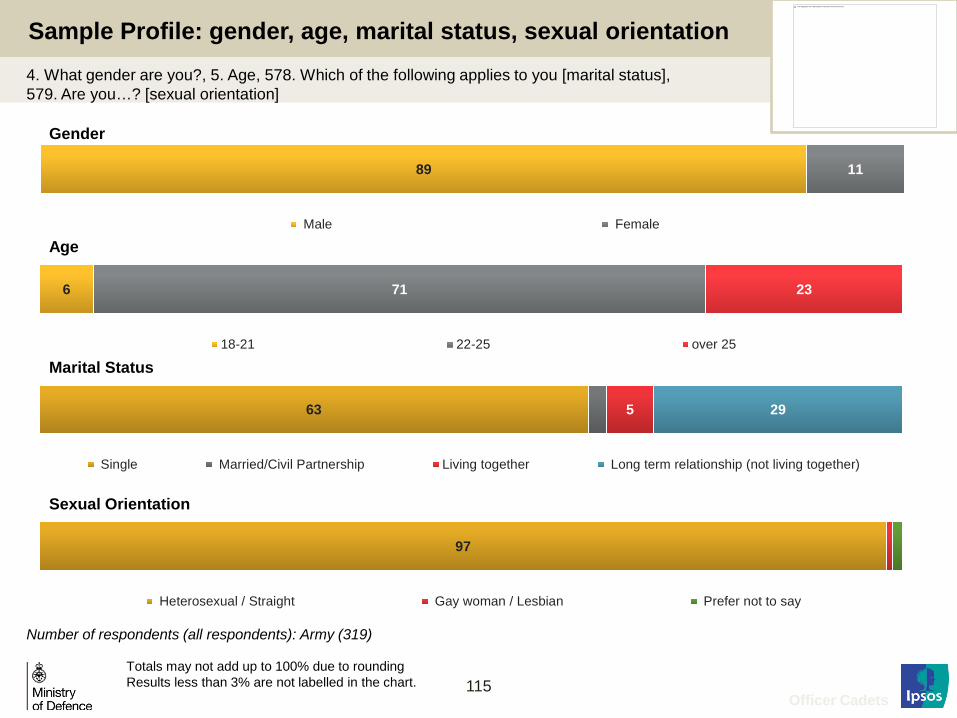
115
97
Heterosexual / Straight Gay woman / Lesbian Prefer not to say
Sample Profile: gender, age, marital status, sexual orientation 4. What gender are you?, 5. Age, 578. Which of the following applies to you [marital status], 579. Are you…? [sexual orientation]
89 11
Male Female
Gender
Age
Marital Status
Sexual Orientation
Officer Cadets
Number of respondents (all respondents): Army (319)
The image part with relationship ID rId5 was not found in the file.
Totals may not add up to 100% due to rounding Results less than 3% are not labelled in the chart.
6 71 23
18-21 22-25 over 25
63 5 29
Single Married/Civil Partnership Living together Long term relationship (not living together)

116
35 44 14 38
Cadet organisations University units Reserve forces None No answer
Sample Profile: membership of other organisations and previous Service 7. Prior to joining have you been a member of any of the following organisations for longer than 6 months? 8. Have you previously served in the Regular Armed Forces?
7 89
Army (regular service) Army (commissioned service) I have not previously served in the Regular Armed Forces No answer
Previous Service in Armed Forces
Membership of other organisations
Officer Cadets
Number of respondents (all respondents): Army (319)
The image part with relationship ID rId5 was not found in the file.
Totals may not add up to 100% due to rounding Results less than 3% are not labelled in the chart.
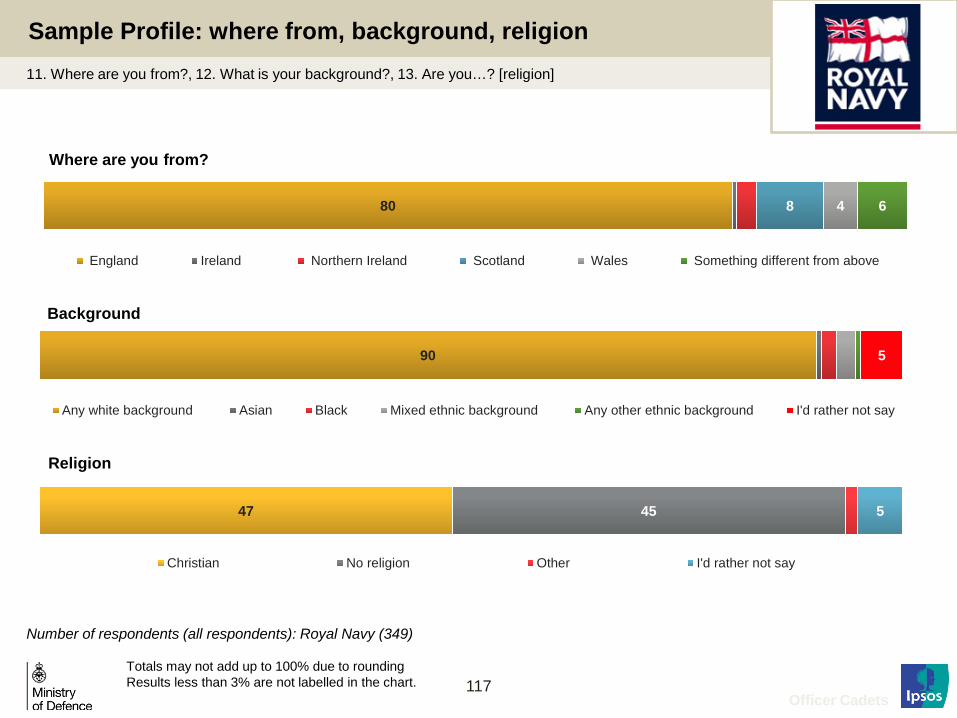
117
Sample Profile: where from, background, religion 11. Where are you from?, 12. What is your background?, 13. Are you…? [religion]
90 5
Any white background Asian Black Mixed ethnic background Any other ethnic background I'd rather not say
Where are you from?
Background
Religion
Officer Cadets
Number of respondents (all respondents): Royal Navy (349)
47 45 5
Christian No religion Other I'd rather not say
Totals may not add up to 100% due to rounding Results less than 3% are not labelled in the chart.
80 8 4 6
England Ireland Northern Ireland Scotland Wales Something different from above

118
91 3 4
Heterosexual / Straight Gay man Gay woman / Lesbian Bisexual Don't know Prefer not to say
86 14
Male Female
Number of respondents (all respondents): Royal Navy (349)
Sample Profile: gender, age, marital status, sexual orientation 4. What gender are you?, 5. Age, 578. Which of the following applies to you [marital status], 579. Are you…? [sexual orientation]
14 47 39
18-21 22-25 over 25
Gender
Age
Marital Status
Sexual Orientation
Officer Cadets
54 17 10 16
Single Married/Civil Partnership Living together Long term relationship (not living together) Don't Know Prefer not to say
Totals may not add up to 100% due to rounding Results less than 3% are not labelled in the chart.

119
Sample Profile: membership of other organisations and previous Service 7. Prior to joining have you been a member of any of the following organisations for longer than 6 months? 8. Have you previously served in the Regular Armed Forces?
21 76
Navy (regular service) Royal Marines (regular service)Royal Marines (commissioned service) I have not previously served in the Regular Armed ForcesNo answer
Previous Service in Armed Forces
36 28 11 44
Cadet organisations University units Reserve forces None No answer
Membership of other organisations
Officer Cadets
Number of respondents (all respondents): Royal Navy (349)
Totals may not add up to 100% due to rounding Results less than 3% are not labelled in the chart.

120
49 47
Christian No religion Other I'd rather not say
Sample Profile: where from, background, religion 11. Where are you from?, 12. What is your background?, 13. Are you…? [religion]
93 3
Any white background Black Mixed ethnic background I'd rather not say
87 4 5 4
England Northern Ireland Scotland Wales Something different from above
Where are you from?
Background
Religion
Officer Cadets
Number of respondents (all respondents): RAF (368)
The image part with relationship ID rId6 was not found in the file.
Totals may not add up to 100% due to rounding Results less than 3% are not labelled in the chart.

121
95
Heterosexual / Straight Gay Man Bisexual Prefer not to say
84 16
Male Female
Number of respondents (all respondents): RAF (368)
Sample Profile: gender, age, marital status, sexual orientation 4. What gender are you?, 5. Age, 578. Which of the following applies to you [marital status], 579. Are you…? [sexual orientation]
10 51 39
18-21 22-25 over 25
Gender
Age
Marital Status
Sexual Orientation
Officer Cadets
The image part with relationship ID rId6 was not found in the file.
52 18 7 20
Single Married/Civil Partnership Living together Long term relationship (not living together) Divorced Separated Don't Know Prefer not to say
Totals may not add up to 100% due to rounding Results less than 3% are not labelled in the chart.
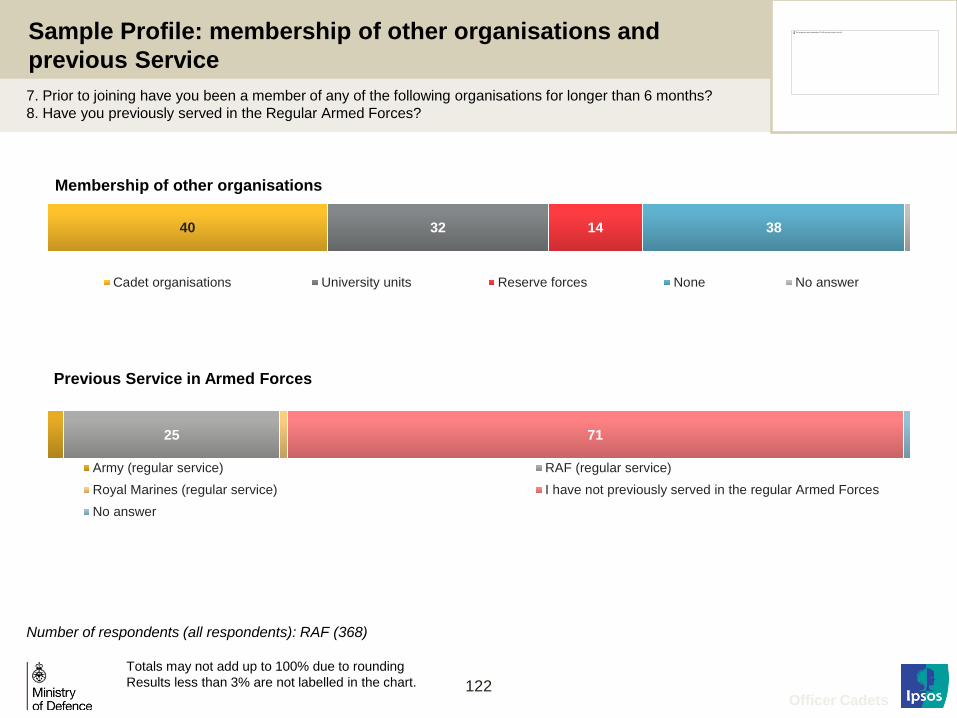
122
Sample Profile: membership of other organisations and previous Service 7. Prior to joining have you been a member of any of the following organisations for longer than 6 months? 8. Have you previously served in the Regular Armed Forces?
25 71
Army (regular service) RAF (regular service)Royal Marines (regular service) I have not previously served in the regular Armed ForcesNo answer
Previous Service in Armed Forces
40 32 14 38
Cadet organisations University units Reserve forces None No answer
Membership of other organisations
Officer Cadets
Number of respondents (all respondents): RAF (368)
The image part with relationship ID rId5 was not found in the file.
Totals may not add up to 100% due to rounding Results less than 3% are not labelled in the chart.

123
Sample Profile: where from, background, religion 11. Where are you from?, 12. What is your background?, 13. Are you…? [religion]
94 6
Any white background Mixed ethnic background
88 6 3 3
England Northern Ireland Wales Something different from above
63 34 3
Christian No religion Other
Where are you from?
Background
Religion
Officer Cadets
Number of respondents (all respondents): Marines (32)
Totals may not add up to 100% due to rounding Results less than 3% are not labelled in the chart.
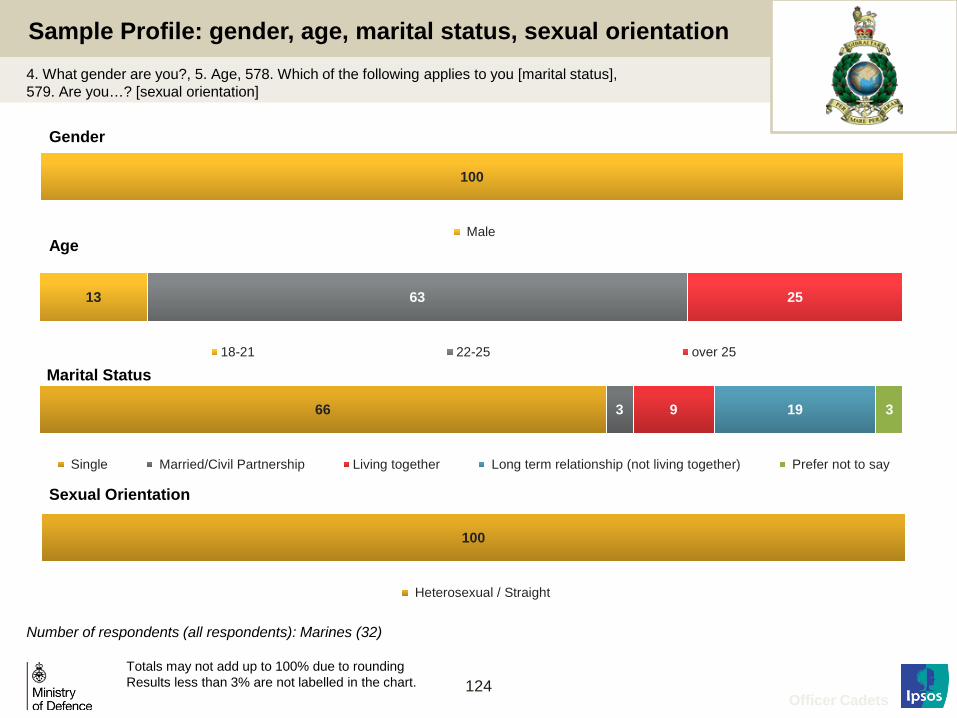
124
100
Heterosexual / Straight
100
Male
Number of respondents (all respondents): Marines (32)
Sample Profile: gender, age, marital status, sexual orientation 4. What gender are you?, 5. Age, 578. Which of the following applies to you [marital status], 579. Are you…? [sexual orientation]
13 63 25
18-21 22-25 over 25
Gender
Age
Marital Status
Sexual Orientation
Officer Cadets
66 3 9 19 3
Single Married/Civil Partnership Living together Long term relationship (not living together) Prefer not to say
Totals may not add up to 100% due to rounding Results less than 3% are not labelled in the chart.

125
Sample Profile: membership of other organisations and previous Service 7. Prior to joining have you been a member of any of the following organisations for longer than 6 months? 8. Have you previously served in the Regular Armed Forces?
3 3 94
Royal Marines (regular service) Royal Marines (commissioned service) I have not previously served in the regular Armed Forces
Previous Service in Armed Forces
47 31 9 34
Cadet organisations University units Reserve forces None
Membership of other organisations
Officer Cadets
Number of respondents (all respondents): Marines (32)
Totals may not add up to 100% due to rounding Results less than 3% are not labelled in the chart.

Annex A Statistical reliability

127
Annex A: Statistical reliability
Only a sample of the overall ‘population’ has been surveyed so we cannot be certain that the figures obtained are exactly those that would have been found had everybody been interviewed (the ‘true’ values). For any percentage given, however, we can estimate ‘confidence intervals’ within which the true values are likely to fall. For example; if 50% of our sample of 1068 officer cadets strongly agreed that the training was what they expected, we can be 95% confident that the ‘true’ value would be between 46.7% and 53.3%, i.e. a margin of 3.3% on each side. Similar margins for other percentages and sub-groups of the respondents are given in the following table. It should be remembered that the ‘true’ finding is much more likely to be towards the centre of the possible range of responses than towards the margins. For similar reasons, apparent differences in results relating to sub groups may, if small, not necessarily reflect genuine attitudinal differences. We can be 95% confident that differences exceeding those in the table on the next page are genuine or ‘significant’ differences. Please note confidence intervals in the table overleaf refer to questions where all respondents are asked. For routed questions where only a sub-set of respondents are asked (e.g. those who were ill or injured during training), confidence intervals will be larger.

128
Annex A: Statistical reliability
95% Confidence Intervals Size of sample on which survey results are based
10% or 90%
±
20% or 80%
±
30% or 70%
±
40% or 60%
±
50%
±
All Officer Cadets (1068) 1.8 2.4 2.7 2.9 3.0 Army officer cadets (319) 3.3 4.4 5.0 5.4 5.5 Royal Navy officer cadets (349) 3.2 4.2 4.8 5.1 5.3 RAF officer cadets (368) 3.1 4.1 4.7 5.0 5.1 Royal Marines officer cadets (32) 10.6 14.1 16.1 17.2 17.6
Source: Ipsos MORI

Annex B Service Comparisons

130
Significant Differences between Services
Officer Cadets
The following pages show significant differences between Services.
A result is statistically significant if it is unlikely to have occurred by chance and it simply means there is statistical evidence of a difference between two figures; it does not mean the difference is necessarily large, important, or significant in the common meaning of the word. A statistical difference can still occur if the overall percentage remains the same due to the large base sizes included in the dataset.
Please note the % is typically a top two box rating (e.g. ‘very good’ and ‘good’ or ‘strongly agree’ and ‘agree’). At times it may be the combination of two other measures (e.g. ‘all the time’ and ‘most of the time’) or a simple ‘yes’ statement.

131
Significant Differences between Services
Officer Cadets
Army Royal Navy RAF Royal Marines % Higher than % Higher than % Higher than % Higher than
PREPARING FOR TRAINING Information prior to arrival: Prepared self for physical demands 85% R Navy - - 59% - - - 83% - R Navy - 94% - R Navy -
Information prior to arrival: Accurate picture of what life would be like
55% R Navy - - 40% - - - 52% - R Navy - 63% - R Navy -
Information prior to arrival: Accurate information about what training involved
71% R Navy - - 51% - - - 65% - R Navy - 81% - R Navy -
Satisfaction with recruitment 46% - - - 61% Army - - 67% Army - - 81% Army R Navy -
FACILITIES AND AMMENITIES Standard of living accommodation 69% R Navy - - 39% - - - 80% Army R Navy - 88% Army R Navy - Sports facilities 93% R Navy - - 69% - - - 89% - R Navy - 97% - R Navy - Opportunity for competitive sports 62% - RAF RM 73% Army RAF RM 30% - - - 25% - - - Medical care 91% R Navy - - 85% - - - 91% - R Navy - 100% - R Navy - Dental care 83% R Navy - - 50% - - - 89% Army R Navy - 94% - R Navy - Access to IT for personal use 52% - - - 83% Army - RM 79% Army - RM 59% - - - Internet access 54% - - - 88% Army RAF - 72% Army - - 84% Army - - Laundry facilities 28% - RAF - 26% - RAF - 16% - - - 22% - - - Personal kit 76% - - - 72% - - - 79% - R Navy - 78% - - - Training facilities 90% R Navy RAF - 78% - - - 84% - - - 100% - R Navy RAF Food 74% R Navy - RM 30% - - - 70% - R Navy RM 50% - R Navy - IT support for software issues 23% - - - 35% Army RAF - 26% - - - 25% - - - Access to gym in spare time 80% - RAF - 78% - RAF - 54% - - - 72% - - RAF Provision of free WiFi hotspots 63% - RAF - 86% Army RAF - 22% - - - 88% Army - RAF IT support for hardware issues 22% - - - 33% Army - - 27% - - - 25% - - - Leisure and retail facilities 57% R Navy RAF - 39% - RAF - 29% - - - 47% - - RAF Whether given enough time to eat meals 59% - - - 70% Army - - 75% Army - - 75% - - -
Given option to comment on meals 95% R Navy RAF - 80% - - - 87% - R Navy - 100% - R Navy RAF
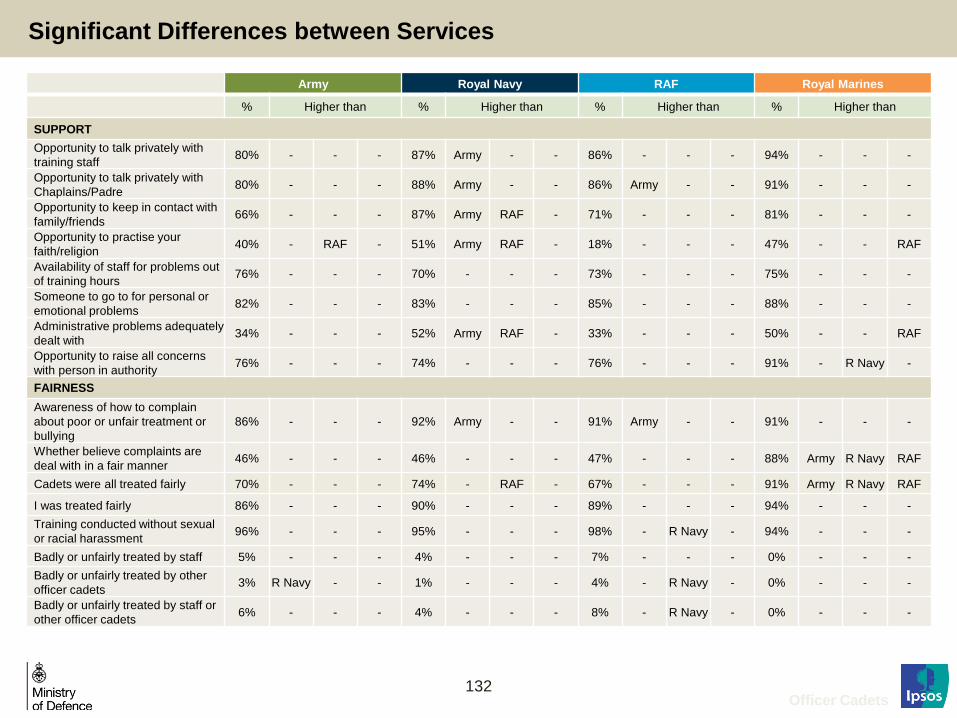
132
Significant Differences between Services
Officer Cadets
Army Royal Navy RAF Royal Marines
% Higher than % Higher than % Higher than % Higher than
SUPPORT Opportunity to talk privately with training staff 80% - - - 87% Army - - 86% - - - 94% - - -
Opportunity to talk privately with Chaplains/Padre 80% - - - 88% Army - - 86% Army - - 91% - - -
Opportunity to keep in contact with family/friends 66% - - - 87% Army RAF - 71% - - - 81% - - -
Opportunity to practise your faith/religion 40% - RAF - 51% Army RAF - 18% - - - 47% - - RAF
Availability of staff for problems out of training hours 76% - - - 70% - - - 73% - - - 75% - - -
Someone to go to for personal or emotional problems 82% - - - 83% - - - 85% - - - 88% - - -
Administrative problems adequately dealt with 34% - - - 52% Army RAF - 33% - - - 50% - - RAF
Opportunity to raise all concerns with person in authority 76% - - - 74% - - - 76% - - - 91% - R Navy -
FAIRNESS Awareness of how to complain about poor or unfair treatment or bullying
86% - - - 92% Army - - 91% Army - - 91% - - -
Whether believe complaints are deal with in a fair manner 46% - - - 46% - - - 47% - - - 88% Army R Navy RAF
Cadets were all treated fairly 70% - - - 74% - RAF - 67% - - - 91% Army R Navy RAF
I was treated fairly 86% - - - 90% - - - 89% - - - 94% - - - Training conducted without sexual or racial harassment 96% - - - 95% - - - 98% - R Navy - 94% - - -
Badly or unfairly treated by staff 5% - - - 4% - - - 7% - - - 0% - - - Badly or unfairly treated by other officer cadets 3% R Navy - - 1% - - - 4% - R Navy - 0% - - -
Badly or unfairly treated by staff or other officer cadets 6% - - - 4% - - - 8% - R Navy - 0% - - -

133
Significant Differences between Services
Officer Cadets
Army Royal Navy RAF Royal Marines
% Higher than % Higher than % Higher than % Higher than
SETBACKS DURING TRAINING
Injury was properly dealt with 87% - - - 88% - - - 92% - - - 96% - - - Staff helped and supported when ill/injured 71% - - - 90% Army - - 85% Army - - 93% - - -
Would advise others in a similar situation not to report sick if they can avoid it
34% R Navy RAF - 20% - - - 23% - - - 26% - - -
GENERAL Overall satisfaction with training experience 89% R Navy - - 65% - - - 85% - R Navy - 94% - R Navy -
Received regular feedback on performance 77% R Navy RAF RM 60% - - RM 66% - - RM 38% - - -
Training objectives and aims were explained 86% R Navy RAF - 69% - - - 79% - R Navy - 81% - - -
Staff/instructors did all they could to help succeed in training 77% - - - 75% - - - 81% - R Navy - 91% - R Navy -
Felt personally benefited from the course 95% R Navy RAF - 83% - - - 90% - R Navy - 100% - R Navy -
Feel a sense of achievement 96% R Navy RAF - 84% - - - 90% - R Navy - 100% - R Navy -
Felt challenged 94% R Navy RAF - 77% - - - 84% - R Navy - 100% - R Navy RAF
Training was what expected 76% R Navy RAF - 53% - - - 57% - - - 84% - R Navy RAF
Enjoyed the course 68% - - - 75% - - - 69% - - - 100% Army R Navy RAF Feel proud to be in the Navy/RM/Army/RAF 94% R Navy - - 89% - - - 95% - R Navy - 97% - - -
Prepared to go onto next stage of career 87% R Navy RAF - 80% - - - 80% - - - 100% Army R Navy RAF
Would recommend joining Service to others 96% - - - 95% - - - 98% - R Navy - 100% - - -
Morale was good on my course 68% - - - 84% Army RAF - 76% Army - - 97% Army - RAF