Embed Size (px)
Citation preview

Office of the Assistant Secretary of Defense
for
Energy, Installations, and Environment
Department of Defense
Annual Energy Management and
Resilience Report (AEMRR)
Fiscal Year 2017
July 2018
COST ESTIMATE The estimated cost of this report for the Department of Defense is approximately $303,000 in Fiscal Years 2017‒2018. This includes $235,000 in expenses and $68,000 in DoD labor. Cost
estimate generated on June 8, 2018 / RefID: 4-DFD4FDC

i
(This page is intentionally left blank)

ii
Table of Contents 1. Introduction ........................................................................................................................... 1
2. Installation Energy Program Management ........................................................................ 4
The Office of the Deputy Assistant Secretary of Defense for Energy (ODASD(IE)) Installation Energy Program ...................................................................................................................... 4
Army Installation Energy Program ......................................................................................... 4
Department of the Navy (DON) Installation Energy Program ............................................... 5
Air Force Installation Energy Program .................................................................................. 6
Defense Agencies Installation Energy Program ..................................................................... 8
3. Enhancing Energy Resilience ............................................................................................... 9
4. DoD’s Progress To Achieve Federal and DoD Goals ....................................................... 11
Installation Energy Demand Overview ................................................................................. 11
Energy Intensity ..................................................................................................................... 11
Army ..................................................................................................................... 14
DON ...................................................................................................................... 15
Air Force ............................................................................................................... 16
Defense Agencies.................................................................................................. 16
Potable Water Consumption and Intensity ............................................................................ 18
Army ..................................................................................................................... 19
DON ...................................................................................................................... 20
Air Force ............................................................................................................... 21
Defense Agencies.................................................................................................. 22
Industrial, Landscaping, and Agricultural (ILA) Water Consumption ................................. 22
Non-Tactical Fleet Vehicle Petroleum Consumption ............................................................ 23
Army ..................................................................................................................... 24
DON ...................................................................................................................... 24
Air Force ............................................................................................................... 25
Defense Agencies.................................................................................................. 26
5. Increasing DoD Distributed (On-site) and Renewable Energy Resources ....................... 27
DoD Renewable Energy Performance .................................................................................. 27
Army ..................................................................................................................... 29
DON ...................................................................................................................... 30
Air Force ............................................................................................................... 31
Defense Agencies.................................................................................................. 32
iii
6. Reporting Utility Outages on Military Installations ............................................................ 33
7. Additional Reporting Requirements .................................................................................... 34
Appendix A - List of Energy Acronyms ..................................................................................... A-1
Appendix B - Compliance Matrix............................................................................................... B-1
Appendix C - Energy Performance Master Plan......................................................................... C-1
Appendix D - DoD Energy Performance Summary ................................................................... D-1
Appendix E - Section 315, P.L. 114-328 (S 2943), the National Defense Authorization Act (NDAA) for FY 2017................................................................................................................... E-1
Appendix F - Senate Report 115-125, to accompany S 1519, the NDAA for FY 2018.............. F-1
Appendix G - House Report 115-200, to accompany HR 2810, the NDAA for FY 2018 ......... G-1
Appendix H - House Report 115-219, to accompany HR 3219, Department of Defense Appropriations Bill for FY 2018................................................................................................. H-1
Appendix I - Senate Reports 114-237 & 115-188, Military Construction, Veterans’ Affairs, and Related Agencies Appropriations Bills, FYs 2017 and 2018 ....................................................... I-1
Appendix J - Energy Intensity by Installation ............................................................................. J-1
Appendix K - References ............................................................................................................ K-1

1
1. Introduction
The chief priority of the Department of Defense (DoD) energy policy is to ensure the mission readiness of the armed forces by pursuing energy security and energy resilience. In today’s technology-dependent environment, energy is inextricably combined with the Department’s missions, from the directly employed weapons systems to the installations and systems that support missions around the globe. In this environment, energy resilience, which enables the capabilities of weapons platforms, facilities, and equipment, is a critical investment that must be part of the Department’s research, acquisition, operations, and sustainment conversations. An important opportunity exists for the Department to improve its energy resilience on its fixed installations, as the Department’s 500 installations worldwide, comprising nearly 300,000 buildings, account for nearly 30 percent of DoD’s total energy use1. Aligning installation energy requirements, agnostic of specific technologies or practices, directly to mission assurance requirements is the Department’s key opportunity to improve energy resilience. Energy resilience, in accordance with section 101(e) of title 10, United States Code (U.S.C.), is “the ability to avoid, prepare for, minimize, adapt to, and recover from anticipated and unanticipated energy disruptions in order to ensure energy availability and reliability sufficient to provide for mission assurance and readiness, including task critical assets and other mission essential operations related to readiness, and to execute or rapidly reestablish mission essential requirements.” Increasing efficiencies, lowering costs, and enhancing backup power options bolsters energy resilience when implemented as part of a comprehensive strategy rather than as disparate efforts to meet specific goals for the sake of the goals themselves. The Department will ensure energy resilience and reliability for critical missions while treating installation energy as a force multiplier in support of military readiness. Accurate measurement of installation energy augments these principles allowing DoD to monitor and maintain an aggressive pace toward its larger energy objectives. To that end, this Annual Energy Management and Resilience Report (AEMRR) details the Department’s Fiscal Year (FY) 2017 performance toward achieving greater energy resilience by leveraging objectives in energy efficiency, demand reduction, and energy supply expansion on fixed installations.
1 Installation energy includes energy needed to power fixed installations and enduring locations as well as non-tactical vehicles (NTVs), whereas operational energy is the energy required for training, moving, and sustaining military forces and weapons platforms for military operations and training—including energy used by tactical power systems and generators at non-enduring locations.

2
DoD reports on its annual installation energy performance in the FY 2017 AEMRR.2 Table 1-1 summarizes the Department’s progress toward its FY 2017 energy goals3; Appendix D presents the Department’s energy-related performance metrics in greater detail. As shown, although DoD fell short of its FY 2017 goal for renewable energy, it exceeded its energy use intensity (EUI) reduction goal and continued to exceed its goals for potable water intensity and petroleum consumption reduction4. The FY 2017 AEMRR is compiled based upon the following mandates (Appendix B):
• Section 548 of the National Energy Conservation Policy Act (NECPA) of 1978 (section 8258 of title 42, U.S.C.) which requires Federal agencies to describe their energy management activities;
• Section 2925 of title 10, U.S.C., which requires DoD to submit to Congress an AEMRR describing its installation energy activities;
• Section 2911(d) of title 10, U.S.C., which requires DoD to establish energy performance goals for transportation systems, support systems, utilities, and infrastructure and facilities.
2 This report includes the installation energy activities of the Air Force, Army, Navy, and Marine Corps, and the following Defense Agencies: Defense Contract Management Agency (DCMA); Defense Commissary Agency (DeCA); Defense Finance and Accounting Service (DFAS); Defense Intelligence Agency (DIA); Defense Logistics Agency (DLA); Missile Defense Agency (MDA); National Geospatial-Intelligence Agency (NGA); National Reconnaissance Office (NRO); National Security Agency (NSA); and Washington Headquarters Services (WHS). 3 Executive Order (E.O.) 13693 was revoked and replaced on May 17, 2018; however, since the E.O. was in effect during FY 2017, this report will reflect DoD’s performance against the E.O.’s stated requirements. 4 Energy Independence and Security Act of 2007 (EISA), Energy Policy Act of 2005 (EPAct), U.S.C. and E.O. E.O. 13693 extended and modified the EPAct 2005 renewable energy goal. E.O. 13693 also extended and modified the energy intensity goal to re-baseline to 2015 from 2003.
Figure 1-1:FY 2017 DoD Progress Toward Installation Energy and Water Goals
3
This report also responds to the following reporting requirements:
• Section 315 of the NDAA for Fiscal Year 2017 (P.L. 114-328) (Appendix E) o Efforts to reduce the high energy costs on military installations
• Senate Report 115-125, to accompany S. 1519, the NDAA for FY 2018 (Appendix F)
o Energy Savings Performance Contracts Assessment o Energy Assurance on Military Installations
• House Report 115-200, to accompany H.R. 2810, the NDAA for FY 2018 (Appendix G)
o Energy Resilience of Overseas Military Installations
• House Report 115-219, to accompany H.R. 3219, Department of Defense Appropriations Bill for FY 2018 (Appendix H) o Energy Security of Overseas Military Installations
• Senate Report 114-237 and House Report 115-188, Water Report (Appendix I)
The remainder of this report discusses DoD efforts related to managing its installation energy program, reducing energy demand, increasing distributed (on-site) and renewable energy, and enhancing energy resilience.
4
2. Installation Energy Program Management
The Office of the Deputy Assistant Secretary of Defense for Installation Energy
(ODASD(IE)), Installation Energy Program
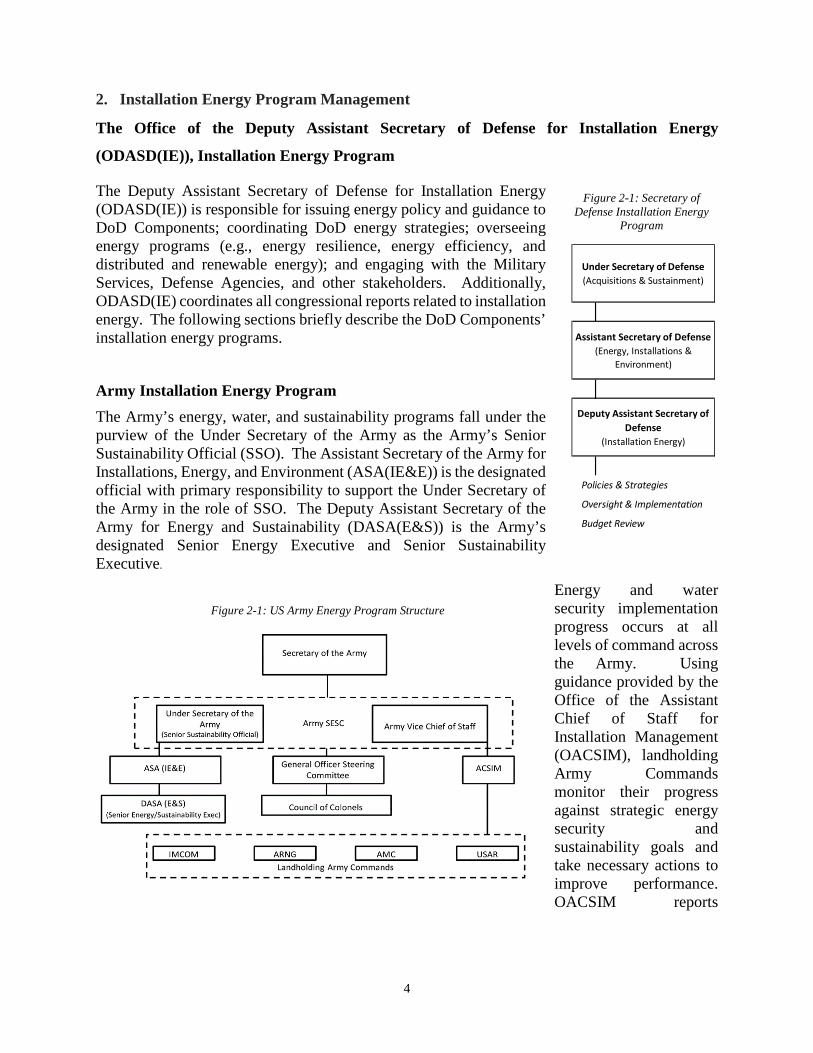
The Deputy Assistant Secretary of Defense for Installation Energy (ODASD(IE)) is responsible for issuing energy policy and guidance to DoD Components; coordinating DoD energy strategies; overseeing energy programs (e.g., energy resilience, energy efficiency, and distributed and renewable energy); and engaging with the Military Services, Defense Agencies, and other stakeholders. Additionally, ODASD(IE) coordinates all congressional reports related to installation energy. The following sections briefly describe the DoD Components’ installation energy programs.
Army Installation Energy Program The Army’s energy, water, and sustainability programs fall under the purview of the Under Secretary of the Army as the Army’s Senior Sustainability Official (SSO). The Assistant Secretary of the Army for Installations, Energy, and Environment (ASA(IE&E)) is the designated official with primary responsibility to support the Under Secretary of the Army in the role of SSO. The Deputy Assistant Secretary of the Army for Energy and Sustainability (DASA(E&S)) is the Army’s designated Senior Energy Executive and Senior Sustainability Executive.
Energy and water security implementation progress occurs at all levels of command across the Army. Using guidance provided by the Office of the Assistant Chief of Staff for Installation Management (OACSIM), landholding Army Commands monitor their progress against strategic energy security and sustainability goals and take necessary actions to improve performance. OACSIM reports
Figure 2-1: US Army Energy Program Structure
Figure 2-1: Secretary of Defense Installation Energy
Program
Budget Review
Under Secretary of Defense(Acquisitions & Sustainment)
Assistant Secretary of Defense(Energy, Installations &
Environment)
Deputy Assistant Secretary of Defense
(Installation Energy)
Policies & Strategies
Oversight & Implementation
5
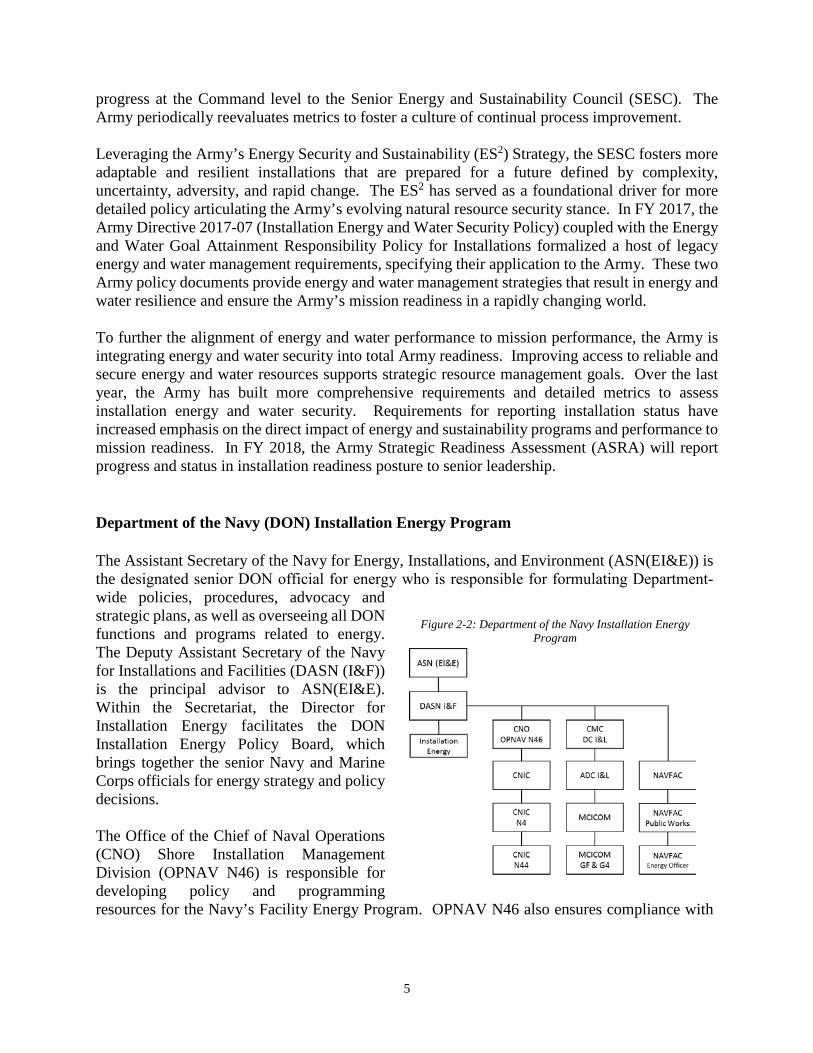
progress at the Command level to the Senior Energy and Sustainability Council (SESC). The Army periodically reevaluates metrics to foster a culture of continual process improvement. Leveraging the Army’s Energy Security and Sustainability (ES2) Strategy, the SESC fosters more adaptable and resilient installations that are prepared for a future defined by complexity, uncertainty, adversity, and rapid change. The ES2 has served as a foundational driver for more detailed policy articulating the Army’s evolving natural resource security stance. In FY 2017, the Army Directive 2017-07 (Installation Energy and Water Security Policy) coupled with the Energy and Water Goal Attainment Responsibility Policy for Installations formalized a host of legacy energy and water management requirements, specifying their application to the Army. These two Army policy documents provide energy and water management strategies that result in energy and water resilience and ensure the Army’s mission readiness in a rapidly changing world. To further the alignment of energy and water performance to mission performance, the Army is integrating energy and water security into total Army readiness. Improving access to reliable and secure energy and water resources supports strategic resource management goals. Over the last year, the Army has built more comprehensive requirements and detailed metrics to assess installation energy and water security. Requirements for reporting installation status have increased emphasis on the direct impact of energy and sustainability programs and performance to mission readiness. In FY 2018, the Army Strategic Readiness Assessment (ASRA) will report progress and status in installation readiness posture to senior leadership. Department of the Navy (DON) Installation Energy Program The Assistant Secretary of the Navy for Energy, Installations, and Environment (ASN(EI&E)) is the designated senior DON official for energy who is responsible for formulating Department‐wide policies, procedures, advocacy and strategic plans, as well as overseeing all DON functions and programs related to energy. The Deputy Assistant Secretary of the Navy for Installations and Facilities (DASN (I&F)) is the principal advisor to ASN(EI&E). Within the Secretariat, the Director for Installation Energy facilitates the DON Installation Energy Policy Board, which brings together the senior Navy and Marine Corps officials for energy strategy and policy decisions. The Office of the Chief of Naval Operations (CNO) Shore Installation Management Division (OPNAV N46) is responsible for developing policy and programming resources for the Navy’s Facility Energy Program. OPNAV N46 also ensures compliance with
Figure 2-2: Department of the Navy Installation Energy Program

6
DON shore energy goals. The Commander, Navy Installations Command (CNIC) is responsible for current and future shore energy requirements across warfare enterprises. Within the Facilities and Environmental Department (CNIC N4) CNIC N44 is responsible for developing and integrating shore energy requirements across the Shore Enterprise. For the Marine Corps, the Deputy Commandant for Installations and Logistics (DC I&L) is responsible for establishing energy and water management policy for Marine Corps installations in accordance with the Commandant’s direction. The Assistant Deputy Commandant for Installations and Logistics (Facilities) serves as the single point of contact responsible for program management and resourcing. The Commander, Marine Corps Installations Command (MCICOM) oversees program planning and execution with direct support provided by the Director, Facilities (MCICOM GF). The Energy and Facility Operations Section (MCICOM GF‐1) serves as the Marine Corps Installations Energy Program Manager. The Naval Facilities Engineering Command (NAVFAC) provides technical and business expertise for facilities, utilities, energy, and other infrastructure support services to the Navy and Marine Corps. The Assistant Commander for Public Works at NAVFAC Headquarters serves as the NAVFAC Energy Officer and oversees the development of relevant energy guidance, standards, processes and internal policy forc NAVFAC. Air Force Installation Energy Program Each component of the Air Force Energy Team plays an important role in striving to meet the service-wide energy priorities to: (1) improve resilience, (2) optimize demand, and (3) assure supply. These priorities support the Air Force vision to “enhance mission assurance through energy assurance,” which moves the Air Force toward the “sweet spot” of facility energy that is resilient, cost-effective, and cleaner. The Assistant Secretary of the Air Force for Installations, Environment, and Energy (SAF/IE) is the Air Force’s Senior Energy Official and provides guidance, direction, and oversight for all matters pertaining to the formulation, review, and execution of plans, policies, programs, and budgets, as well as Air Force positions regarding federal and state legislation and regulations related to energy and water use. Headquarters Air Force provides:
• Information to support governance and oversight of energy management activities;
• Procedures and objectives to address and manage Air Force facility energy and water consumption, throughput, and requirements, in alignment with policies and strategic direction;
• Policies, guidance, procedures, and practices to enhance Air Force energy assurance with the goal of energy resilience and develop a state of energy security to meet mission essential requirements.

7
Air Force Installation and Mission Support Center (AFIMSC) and its primary subordinate unit, Air Force Civil Engineer Center (AFCEC) develop and execute facility energy programs, plans, and policies in support of the Air Force strategic energy priorities and goals and are responsible for the integration of major command mission requirements with Air Force strategic energy priorities and goals. Specifically, AFIMSC:
• Assesses energy use and risks to identify investment opportunities and efficiency measures to enhance capability and mission success.
• Provides guidance on energy project development, utility recommendations and requirements validation, capabilities oversight and resource advocacy, and oversight and guidance on budgeting and execution funding.
• Promotes policies, procedures, and practices to enhance Air Force energy security and resilience; and develops standardized processes for the facility energy program.
The Air Force Office of Energy Assurance (OEA) develops, implements, and oversees the integrated facility energy portfolio, including privately financed, large-scale clean energy projects that will provide uninterrupted access to the electricity necessary for mission success. At the tactical level, installations, supported by Installation Energy Managers (IEMs), develop and execute the installation energy and water plans to support or supplement Air Force energy goals/strategies and measure and evaluate their base energy usage and costs, promote total energy awareness, and nominate successful people and units for energy awards.

8
Defense Agencies Installation Energy Program The Defense Agencies continue to enhance their Installation Energy Management Programs and each agency has a designated Senior Energy Official to administer their respective programs (Table 2).
The Intelligence Community (IC), in particular, has adopted a community-wide approach to maximizing energy opportunities. Within the Office of the Director of National Intelligence there is an IC Energy Management Working Group composed of representatives from the intelligence agencies with the subject matter expertise and authority to speak for their agency on energy matters.
Table 1: Defense Agencies Senior Energy Officials
DoD Component Senior Energy OfficialDefense Contact Management Agency (DCMA) Energy Program ManagerDefense Commissary Agency (DeCA) Energy Program ManagerDefense Finance and Accounting Service (DFAS) Director, Support ServicesDefense Intelligence Agency (DIA) Chief, Engineering and Logistics OfficerDefense Logistics Agency (DLA) Installation Management DirectorMissle Defense Agency (MDA) Environmental ExecutiveNational Reconnaissance Office (NRO) Director, Management Services and OperationsNational Geospatial-Intelligence Agency (NGA) Director, Installation Operations OfficeNational Security Agency (NSA) Chief of Facilities and Infrastructure ServicesWashington Headquarters Services (WHS) Pentagon Sustainability Program Manager

9
3. Enhancing Energy Resilience The specific definition of energy resilience provided in section 101(e) of title 10, U.S.C., guides energy policy across the Department. It is important to note that energy resilience is not the same as either energy reliability or energy security. Reliability is a measure both of an electric system’s ability to supply the aggregate demand (adequacy) and the system’s ability to withstand disruptions (operating reliability). 5 Energy security, defined by section 101(e)(7) of title 10 U.S.C., “means having assured access to reliable supplies of energy and the ability to protect and deliver sufficient energy to meet mission essential requirements.” Resilience, as defined for DoD, includes both these abilities, as well as two additional, critical parameters: (1) resilience includes the additional capability to adapt to the environment caused by disruptions; and (2) resilience is targeted at one aspect of the enterprise, mission assurance and readiness. DoD relies on commercial power to conduct missions from its installations. Commercial power supplies can be threatened by a variety of events ranging from natural hazards to physical attacks on infrastructure and cyber-attacks on networks. DoD recognizes that such events could result in power outages affecting critical DoD missions involving power projection, defense of the homeland, or operations conducted at installations in the United States directly supporting warfighting missions overseas. Therefore, installation commanders must understand and address the vulnerabilities and risk of power disruptions that can impact mission assurance6. Energy resilience can be achieved in a variety of ways, including redundant power supplies (generators); integrated or distributed fossil, alternative, or renewable energy technologies; microgrid applications including storage; diversified or alternate fuel supplies; upgrading, replacing, operating, maintaining, or testing current energy generation systems, infrastructure, and equipment; as well as mission alternative such as reconstitution or mission-to-mission redundancy. DoD is agnostic toward any specific technologies and practices that are employed to achieve resilience. Ultimately, energy resilience is a binary measure; either missions have the energy that is required, when and where it is needed, or they do not. What follows from this foundation is an iterative planning and implementation cycle in which mission owners conduct the risk analysis and specify the requirements, infrastructure stakeholders solve for the specified requirements, and the process repeats itself as needed to meet changing mission parameters.
5 NERC. 2013. “Reliability Terminology.” http://www.nerc.com/AboutNERC/Documents/Terms%20AUG13.pdf 6 DoD publishes the status of its energy resilience program at the following: http://www.acq.osd.mil/eie/IE/FEP_Energy_Resilience.html.
Per section 101(e)(6) of title 10, U.S.C., the “term ‘energy resilience’ means the ability to avoid, prepare for, minimize,
adapt to, and recover from anticipated and unanticipated energy disruptions in order to ensure energy availability and reliability
sufficient to provide for mission assurance and readiness, including task critical assets and other mission essential operations related to readiness, and to execute or rapidly
reestablish mission essential requirements.”
10
As part of its energy resilience strategy, DoD adapted policies and guidance related to energy infrastructure. In addition to updating DoD Directive (DoDD) 4180.01, “DoD Energy Policy,” and DoD Instruction (DoDI) 4170.11, “Installation Energy Management” in FY 2016, in FY 2017 DoD published the “Energy Resilience: Operations, Maintenance, and Training (OM&T) Strategy and Implementation Guidance.” The OM&T Guidance outlines a comprehensive strategy, including a development and implementation plan that replaces or improves emergency power generation readiness, reduces system maintenance, and improves fuel flexibility to ensure the supportability of all Department emergency power generation systems in operation. Further, DoD has incorporated resilience in its annual update of the primary federal investment program specific to energy infrastructure, the Energy Resilience and Conservation Investment Program (ERCIP). On May 30, 2018, DoD released a memorandum to update the OASD(EI&E) memorandum, “Installation Energy Plans (IEPs),” dated March 31, 2016. This update clarifies and provides further direction to installations with regard to energy resilience and cybersecurity. Chief among the updates are requirements that: (1) by the end of FY 2019 all installations identified by the Deputy Assistant Secretary of Defense for Defense Continuity and Mission Assurance as priority installations will complete IEPs; (2) by the end of FY 2020, all installations that constitute 75 percent of each Component’s consumption will complete updated IEPs; and (3) by the end of FY 2021, IEPs will be completed for all installations not included in the previous categories. These IEPs provide Components with the opportunity to present their installation-specific long-range plans for energy resilience. Amendments to sectuin 2925 if title 10, U.S.C., included in the FY 2018 NDAA address how DoD will report to Congress on efforts aimed at increasing energy resilience across the Department. In future AEMRRs, the Department will report on installation energy requirements and critical energy requirements, as well as energy resilience and emergency backup systems serving critical energy requirements. Per section 2925(a)(4) of title 10, U.S.C., the reporting will cover, at a minimum:
(A) Energy resilience and emergency backup systems power requirements;
(B) Critical missions, facility, or facilities serviced;
(C) System service life;
(D) Capital, operations, maintenance, and testing costs; and
(E) Other information the Secretary determines necessary.
ODASD(IE) is actively working with the Services and Defense Agencies to identify and implement best practices to gather and report against these new requirements.

11
4. DoD’s Progress To Achieve Federal & DoD Goals Installation Energy Demand Overview This section describes the scope of the Department’s installation energy demand in terms of cost and consumption. DoD is the largest single energy-consuming entity in the United States, both within the Federal Government and as compared to any single private-sector entity. DoD operational and installation energy consumption represents approximately 80 percent of total Federal energy consumption, more than sixteen times the total energy consumption of the next closest Federal agency (the United States Postal Service).7 In FY 2017, DoD spent approximately $3.48 billion on installation energy, which included $3.3 billion to power, heat, and cool buildings; and $0.18 billion to supply fuel to the fleet of NTVs8. The Department also spent $274 million for water in FY 2017, raising the overall cost of energy and water to $3.72 billion. DoD consumed 207,907 billion British thermal units (BBtus) of installation energy; 199,143 BBtus in buildings (stationary combustion) and 8,764 BBtus in NTV fleet (mobile combustion). DoD consumed 89,705 million gallons (MGal) of water; 82,499 MGal in potable water; and 7,205 MGal in industrial, landscaping, and agricultural (ILA) and non-potable freshwater. The Army was the largest consumer of installation energy (36 percent), followed by the Air Force (30 percent), and DoN (29 percent). Electricity and natural gas accounted for 80.5 percent of DoD installation energy consumption. The remaining portion of installation energy consumption included fuel oil, coal, and liquefied petroleum gas (LPG) (Figure 4-1)9. DoD’s installation energy consumption mix mirrors that of the U.S. commercial sector, where natural gas and electricity dominate the supply mix. Energy Intensity DoD measures energy intensity in Btus per gross square foot (GSF) of facility space.10 Section 543 of the National Energy Conservation Policy Act (NECPA) mandates a 3.0 percent annual reduction in energy intensity relative to a baseline year (FY 2003) or a 30 percent overall reduction from the baseline by FY 2015. E.O. 1369311 extended the goal to 2.5 percent annual reductions through 2025, with the baseline reestablished to 2015. The EISA of 2007 further distinguishes two categories of buildings: those subject to the energy intensity reduction goal and those that can
7 FEMP, Comprehensive Annual Energy Data and Sustainability Performance [online source] (Washington, D.C. April 26, 2018, accessed May 18, 2018), available from http://ctsedwweb.ee.doe.gov/Annual/Report/TotalSiteDeliveredEnergyUseInAllEndUseSectorsByFederalAgencyBillionBtu.aspx 8 Total DoD consumption and costs for energy in FY 2017 were not available for inclusion in this report. 9 EIA, 2018 Energy Consumption by Sector, Table 2.1 [online source] (Washington, D.C. April 26, 2018 accessed April 27, 2018), available from http://www.eia.gov/totalenergy/data/monthly/ 10 Energy intensity does not include energy consumption from NTVs. 11 Since revoked by EO 13834.

12
be excluded. 12 This section discusses energy intensity for DoD goal-subject buildings. In FY 2017, DoD consumed approximately 190,076 BBtus of energy in its goal-subject buildings and 9,067 BBtus in its goal-excluded buildings. Total consumption decreases to 189,474 BBtus when the value is adjusted to reflect for renewable energy credits (RECs). Figure 4-1 illustrates recent historical trends in installation energy consumption by DoD Components across goal-subject buildings.
DoD energy intensity has decreased since FY 2003, but in FY 2016 DoD and the Military Services’ progress was recalibrated to an FY 2015 baseline to comply with the new E.O. 13693 guidance. In FY 2017 DoD reduced its energy intensity by 6.4 percent from the FY 2015 baseline, exceeding the goal of 2.5 percent.
12 The criteria evaluated for excluding facilities include impracticability due to energy intensiveness or national security function, completed energy management reports, compliance with all energy efficiency requirements, or implementation of all cost-effective energy projects in the buildings. This energy intensity section discusses only goal-subject buildings. Source: U.S. Department of Energy (DOE), Energy Efficiency and Renewable Energy, Federal Energy Management Program, Guidelines Establishing Criteria for Excluding Buildings [online source] Washington, D.C. 2006, accessed January 2, 2015, available from http://www1.eere.energy.gov/femp/pdfs/exclusion_criteria.pdf.
Figure 4-1: FY 2017 Installation Energy (Goal Subject) Consumption by Military Service

13
DoD has reported its energy intensity progress to the Department of Energy (DOE) since FY 1975. 13 Since this time, DoD has reduced its energy intensity from 182,153 BBtus/ft2 in FY 1975 to 91,714 BBtus/ft2 in FY 2017 (adjusted for on-site renewables and source energy credits), representing an energy intensity reduction of nearly 50 percent. Figure 4-2 illustrates historical trends in DoD reductions of energy intensity since FY 1975. These
reductions are not the result of any single change in technology or practice, but rather reflect a continuous effort to implement solutions across the spectrum of opportunities, from low- and no- cost energy efficiency and conservation measures to larger scale projects to replace and/or upgrade inefficient energy generation, transmission, and distribution infrastructures both on DoD installations and the in the broader commercial energy sector.14
13 EIA, 2018 Energy Consumption by Sector, Table 2.7 [online source] (Washington, D.C. April 26, 2018 accessed April 27, 2018), available from http://www.eia.gov/totalenergy/data/monthly/ 14 Appendix E provides an installation-by-installation breakdown on energy intensity.
Figure 4-2: DoD Energy Intensity Progress Since FY 1975

14
Army In FY 2017, the Army reduced its EUI by 9.6 percent from its FY 2015 baseline. The Army’s perspective on facility and installation energy efficiency has evolved from viewing energy efficiency as a means for lowering costs to one that understands that effective and holistic energy management contributes to resilience. Increased energy efficiency is the first step for Army installations to reduce reliance on commercial energy supplies and improve overall energy security. To this end, the Army took specific steps during FY 2017 to build out legacy energy efficiency programs to prioritize energy security/resilience. In FY 2017, the Army awarded 12 ESPC task orders and modifications with an investment value of $257.4 million, and nine UESC projects worth $31.9 million, for a total of $289.3 million. This represents the second highest year of ESPC/UESC investment ever for the Army. These projects will save 1,132 billion BTUs annually and avoid costs of more than $17.2 million per year which will be used to repay the investments over the life of the contracts. The combined total of all Army ESPC and UESC investments over the life of the program exceeds $2.85 billion. More than 12 additional projects are currently under development. The Army anticipates awarding on average $150 million worth of ESPC/UESC projects each year for the foreseeable future. Another important action was the update of the Army’s ERCIP guidance. The Army collaborated closely with the Office of the Secretary of Defense (OSD) ERCIP Working Group to increase focus of the ERCIP on projects that contribute to energy resilience. The Army’s annual ERCIP guidance requires each candidate project to describe how it would contribute to energy resilience and mission assurance (e.g., electricity outage mitigation, energy resource profile diversification, and water resource availability). The Army continues to leverage its utilities privatization (UP) to achieve significant energy efficiency and modernization upgrades to utility infrastructure. UP represents a cost-effective strategy for addressing deferred maintenance backlogs. The reduced risk and liability associated with transferring infrastructure assets to local utilities, which are often better positioned to initiate corrective actions, represents an energy and water resilience benefit to the Army. As of October 2017, 145 Army utility systems had been privatized across the enterprise. The Army encourages installations to participate in demand response (DR) programs with their electric and/or water utility providers or through the DLA agreement with curtailment service providers. By shifting energy and/or water use to off-peak hours, DR enables utility customers to reduce utility costs or receive incentives. The Army is assessing market opportunities, developing strategies, and conducting site-specific assessments to determine where DR can reduce and manage utility costs. The Army established a DR database in FY 2017 to track participation and utility savings. In FY 2017, there were 16 Army installations participating in the DR program with financial benefits of $4.2 million credited toward the utility bills of the participating sites. Combined heat and power (CHP) systems also play a role in the Army’s efforts to increase resilience. CHP systems, commonly referred to as cogeneration, recycle thermal energy from electricity generation for heating, cooling, and/or industrial processes. CHP systems typically operate on a near-continuous basis and are more reliable than backup generators, which may not always perform or have the required fuel to operate during prolonged power outages. CHP units

15
range from large industrial systems to distributed components having capacities less than 100 kW. The Maine Army National Guard (ARNG) recently deployed such a novel “micro” CHP design by installing a 75 kW unit in an aviation support facility in Bangor, Maine. This project enhances energy security by significantly reducing energy demand and generating onsite electricity and heat for the Maine ARNG’s largest facility. This year Army has renewed its efforts to deploy new CHP systems by establishing a CHP integrated process team that engages Army stakeholders in a collaborative process to ensure CHP is considered as a key piece of the Army’s ES2 Strategy. Army FY 2017 initiated a new strategy to guide future deployment of CHP. This document was signed by the Secretary of the Army in December 2017. The Army awarded approximately 2 MW of new CHP in FY 2017. The aforementioned energy program priorities have enabled the Army to better measure and manage its energy consumption. With an overall EUI of 77.8 thousand BTU per square foot per year, the Army has a lower EUI than most other Federal Agencies and is the lowest among the four Services. The Army will continue to identify and implement the most cost-effective EUI reduction measures while still maintaining mission readiness. DON In FY 2017, the DON reduced its EUI by 6.2 percent compared to its FY 2015 baseline. The Navy reduced its EUI by 5.0 percent, while the Marine Corps reduced its EUI relative to the FY 2015 baseline by 9.8 percent. Both the Navy and the Marine Corps expect progress to continue toward building greater energy resilience at installations utilizing federal and non-federal financing during FY 2018. By early FY 2017, the Navy and Marine Corps had awarded $654 million in projects designed to leverage energy savings potential to increase installation energy resilience. These investments are expected to help DON continue to reduce its energy use by 165 BBtus each year for the next 20 years. The following are examples of energy resilience projects in FY 2017:
• The $92 million Energy Savings Performance Contract (ESPC) at MCRD Parris Island includes eight energy conservation measures that result in a total energy use reduction of 35 percent and total water use reduction of 25 percent. It also includes a new central plant with microgrid and island mode capability and a total of nine MWs of on-site electrical generation, which will improve the energy reliability and resilience of the installation as well.
• The $150 million steam decentralization project at Camp Lejeune that replaced five outdated steam utility systems with 641 small high-efficiency natural gas hot water condensing boilers. This project used multiple funding streams (Energy Investment Program [EIP] - $73.8 million, ERCIP - $11.7 million, MILCON - $26 million, UESC - $38 million) and accounted for the operation of 548 buildings at the base through the life of the project. The project eliminated 50 miles of steam and condensate piping, improving the efficiency of the system by more than 50 percent, reducing vulnerabilities, and limiting
16
maintenance. Additionally, the switch to hot water condensing boilers eliminated the need for steam make-up water systems, saving the base approximately 87 million gallons of water per year. In total, the base is expected to save approximately $15.3 million in annual savings with a payback period of less than 10 years.
Air Force In FY 2017, the Air Force reduced its EUI by 4.6 percent compared to its FY 2015 baseline. The Air Force did not meet the EUI reduction goal of 5.0 percent, due primarily to environmental impacts at certain installations. Total reportable energy consumption for the Air Force did decrease by 0.2 percent in FY 2017 resulting in savings of $17 million, down from $939 million in FY 2016. The Air Force continues to use Facility Sustainment, Restoration and Modernization (FRSM) and ERCIP funds, along with various third-party financing opportunities such as ESPCS, and UESCs. Funds were primarily used to convert to high efficiency lighting and replace inefficient heating, ventilation, and air conditioning (HVAC) systems with more efficient systems. Several installations indicated that improving the facility related control systems (FRCS) significantly improved energy conservation. Various awareness programs continue to educate and motivate personnel across installations to contribute to energy reductions. Review of information received from installations where consumption increased indicated more extreme weather conditions and intensive construction activities. For example, the F-35 beddown, or the Beneficial Occupancy for KC-47 buildings contributed to a nine percent energy consumption increase at McConnell Air Force Base (AFB), KS. Several installations also noted that the lack of energy management personnel and reduced resource efficiency manager (REM) support hinders energy program effectiveness. With regard to weather conditions, several Air Force locations were affected by natural disasters: Offutt AFB, NE was without electricity for 2½ days due to tornado damage in June 2017; Hurricanes Matthew (October 2016), Irma (September 2017) and Maria (September 2017) affected Patrick AFB, FL, Cape Canaveral, FL and Seymour Johnson AFB, SC, with total electrical outage time of six days. Additionally, the Air National Guard was also significantly impacted at its locations in Puerto Rico and the Virgin Islands due to hurricanes Irma and Maria. Defense Agencies In FY 2017, the Defense Agencies continued to pursue opportunities to reduce EUI. Some highlights of successes are included below:
• FY 2017 was a successful year for DLA with total energy consumption reduced by 1.01 percent and EUI decreased by 3.01 percent, exceeding the 2.5 percent per year goal set by E.O. 13693. All four DLA host sites reduced EUI in FY 2017.

17
• WHS decreased EUI at the Pentagon and Mark Center by 8.6 percent from the FY 2015 baseline. Electricity is the main driver of EUI for the Pentagon, accounting for roughly two-thirds of total energy use. The Pentagon’s energy usage continues to decrease because of investments in energy conservation. One of the primary drivers has been the recommissioning and ongoing commissioning projects, which restore, maintain, and increase mechanical system energy efficiency; reduce maintenance burdens; and improve tenant satisfaction. Recommissioning and commissioning activities include optimizing computer room air-conditioning (CRAC) unit set points, repairing or replacing fans, correcting damper air leaks, fixing leaking cooling and heating valves, and more. Additionally, in accordance with new AHSRAE 62.1 guidelines, WHS has optimized outside air set points for several air handling units, with a plan to complete optimization on the remaining units in FY 2018. WHS building maintenance staff are also using fault detection and diagnostics to prioritize and correct energy issues that would go unnoticed under normal tenant feedback channels.
18
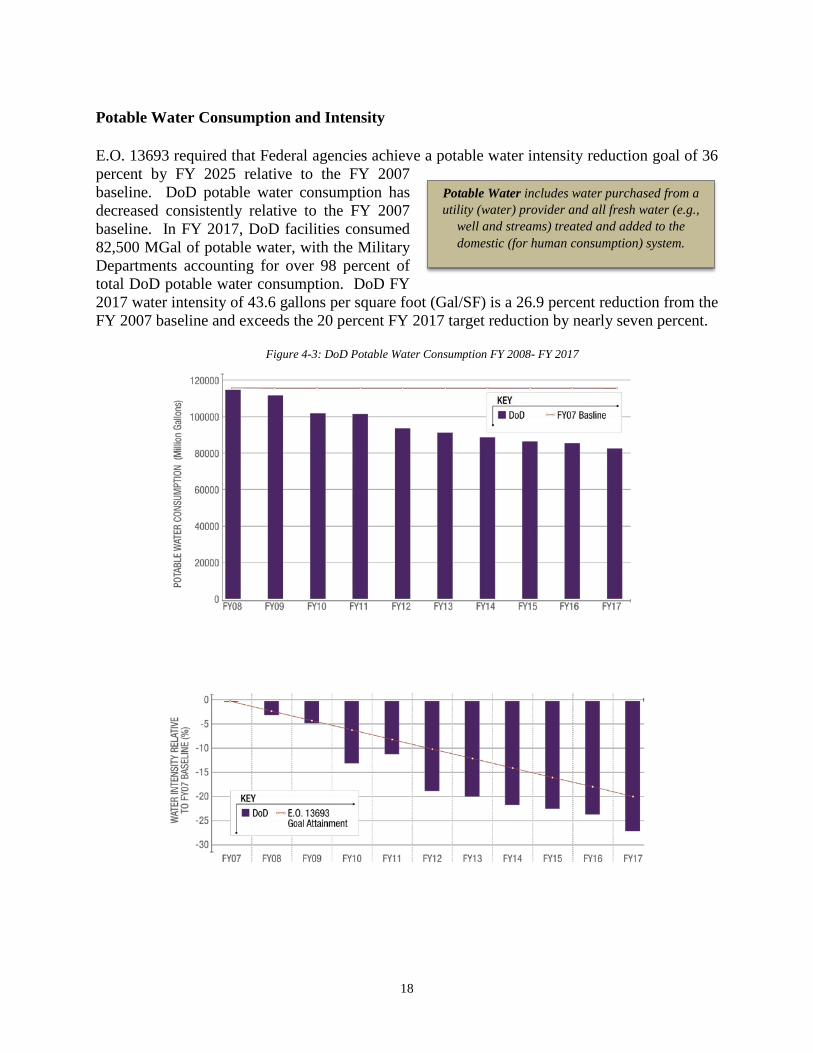
Potable Water Consumption and Intensity E.O. 13693 required that Federal agencies achieve a potable water intensity reduction goal of 36 percent by FY 2025 relative to the FY 2007 baseline. DoD potable water consumption has decreased consistently relative to the FY 2007 baseline. In FY 2017, DoD facilities consumed 82,500 MGal of potable water, with the Military Departments accounting for over 98 percent of total DoD potable water consumption. DoD FY 2017 water intensity of 43.6 gallons per square foot (Gal/SF) is a 26.9 percent reduction from the FY 2007 baseline and exceeds the 20 percent FY 2017 target reduction by nearly seven percent.
Potable Water includes water purchased from a utility (water) provider and all fresh water (e.g.,
well and streams) treated and added to the domestic (for human consumption) system.
Figure 4-3: DoD Potable Water Consumption FY 2008- FY 2017

19
Army Similar to energy management, the Army maintains a focus on water security and resilience. Guided by both the recently published Army Directive 2017-07 (Installation Energy and Water Security Policy) and the Energy and Water Goal Attainment Responsibility Policy for Installations, the Army exceeded potable water intensity and ILA water reduction goals in FY 2017. The FY 2017 potable water intensity of 39.2 Gal/SF is a 32.0 percent reduction from the Army’s FY 2007 baseline, which is 12.0 percent ahead of the FY 2017 target of 20 percent. The first “line of defense” of the Army’s focus on water security is to reduce water demand and increase efficiency. By reducing water use, Army installations have lower critical water loads that in turn create a more resilient installation. Examples of exemplary programs include water conservation achieved at the Presidio of Monterey. The installation implemented native landscaping and installed a stormwater reuse system to irrigate the installation’s athletic field. These projects reduced irrigation water use by 70 percent. Sierra Army Depot implemented low-cost water conservation measures that included lawn irrigation restriction, reduction of operation hours at wash rack facilities, and installation of high-efficiency showerheads in on-post apartments and barracks, resulting in a 25 percent water reduction. Fort McCoy implemented water conservation measures such as irrigation efficiency projects and synchronization of fire flow testing with annual distribution system flushing that reduced the amount of water lost through these required system testing activities. The Army’s UP program improves the reliability of Army water systems, which minimizes potential disruption to operations. The Army has privatized 41 water systems to date. Army installations are implementing infrastructure projects to help increase water security. For example, Fort Irwin completed construction of a new highly efficient water treatment plant that has a 99 percent water recovery rate, substantially reducing waste in the treatment process. Both Fort Irwin and Fort McCoy upgraded aging potable water lines to increase the reliability of their distribution systems, which are critical to installations’ water resilience. The Fort Irwin Department of Public Works (DPW) staff also collaborated with their privatized housing contractor to initiate mock billing of housing, which reduced water consumption by 26 percent in the housing area. In terms of ILA water performance the Army established an FY 2013 baseline because data quality was higher than had been available during earlier fiscal years. The Army expects to continue exceeding ILA water reduction goals in future FYs due to recent reporting modifications and robust training efforts. The Army is developing alternative sources for water, such as rainwater harvesting and reclaimed wastewater, to improve resilience by reducing dependency on groundwater and potable water supplied through municipalities. The new water treatment plant at Fort Irwin, described above, enabled construction of a new recycled water line for irrigation through the UP contract. This capital investment was credited with reducing potable water consumption by 11.9 MGal annually.
20
The Army Reserve developed an alternative water strategy to prioritize implementation of alternative water to increase water resilience at Army Reserve facilities. As part of this strategy, the Army Reserve evaluated regions of the US that are best suited for rainwater harvesting and implemented two pilot projects at Army Reserve Centers in Savannah, GA and Grand Prairie, TX. The projects supply rainwater for the facilities’ vehicle wash systems. In addition, Fort Buchanan received funding from the Installation Technology Transition Program to implement a solar-powered potable rainwater harvesting system in FY 2017. The system will demonstrate how a self-contained potable water system can provide a reliable source of water to an Army facility. DON In FY 2017, DON’s potable water intensity was 23.5 percent below the FY 2007 baseline. This high level of performance is driven by the Marine Corps, with a reduction of more than 39.6 percent from its FY 2007 baseline. The Navy’s potable water intensity was 18.1 percent above its FY 2007 baseline15. Water intensity performance for the Navy is expected to improve as ESPC and UESCs with water conservation measures that were awarded under the PPCC complete construction. For example, a UESC under construction in FY 2017 is expected to save more than 42 million gallons annually once it is complete in FY 2018. Water conservation efforts were largely incorporated into larger ESPC and UESC project scopes in FY 2017, such as in the case of the UESC at NCBC Gulfport. Consistent with the holistic and strategic perspective of the Installation Energy Security Framework, the DON worked throughout the fiscal year to examine the relationship between water and energy in the southwestern United States in executing installation mission requirements and the contributions water resiliency has to the overall energy security posture of an installation. This analysis of factors that impact, and thereby can improve, the integrated management of water and associated energy resources at select installations, gives the DON a greater understanding of water resilient operations. In FY 2017, the DON identified a portfolio of potential opportunities and associated project funding mechanisms that could be pursued in accordance with the Department’s overall energy security strategy in the coming years.
15 DON Defense Utility Energy Reporting System (DUERS) reports DON’s FY17 potable water intensity decrease at 18.35% below the FY 2007 baseline. For the sake of consistency in reporting across the Department, the report has retained the FEMP-reported value in the main text of the report.

21
Air Force Overall the Air Force continued to reduce potable water intensity relative to the FY 2007 baseline, reducing intensity by 24.1 percent in FY 2017, although intensity was 0.48 percent higher than FY 2016. Specifically, water intensity increased from 42.1 Gal/SF in FY 2016 to 42.3 Gal/SF in FY 2017 and water consumption increased from 22,000 MGal in FY 2016 to 22,200 MGal in FY 2017. Overall, however, consumption was reduced from 34,000 MGal in 2007 to 22,000 MGal in 2017. Installation inputs indicate standard practices continue to support water conservation efforts. The primary factors include: (1) leak detection and infrastructure repair, (2) fixture replacement and upgrade, (3) moving toward xeriscaping, and (4) using non-potable sources whenever possible. By focusing on the above areas, along with other water conservation initiatives, the Air Force will continue to meet water conservation goals. The Air Force will continue to emphasize water conservation awareness through Energy Action Month and various other educational and public awareness avenues. The following examples are indicative of water conservation efforts around the Air Force:
• Kadena AB, Japan, reduced consumption 35 percent (690 MGal) by repairing significant water leaks early in the FY.
• Hill AFB, UT, upgraded the water system and steam condensate return systems.
• Eglin AFB, FL, reduced water consumption 32 percent (106 MGal). The energy management team and the 796 CEO flight work closely with ASUS (Utilities Privatization contractor) to support, identify, validate and implement common sense strategies to mitigate leaks and formalize processes to maximize avoided water/wastewater related energy costs through innovative load avoidance and reduction techniques.
• Nellis AFB, NV, reduced water consumption 10 percent (54 MGal). Nellis AFB is located
in the Mojave Desert and receives only 3.5 inches of rain per year on average; water conservation is critical. Past projects to replace water thirsty grass with efficient desert landscaping have led to significant water usage intensity reductions.
• Although Peterson AFB, CO, experienced a 25 percent increase in water consumption in
FY 2017 due to low precipitation, a 10-acre turf grass reduction project was begun in FY 2017 and is expected to save 14 MGal per year.
• Travis AFB, CA, is implementing a Smartscape policy after California eased drought
restrictions and the installation had a measurable increase in consumption. This policy will re-evaluate irrigation priorities and replace current landscaping with more drought tolerant species.
• Wright Patterson AFB, OH, indicates an upcoming Energy Savings Performance Contract
is expected to reduce water consumption by approximately 4.8 MGal per year.

22
Defense Agencies
In FY 2017, Defense Agencies consumed 53 percent less potable water than the FY 2007 baseline and the Agencies continue to pursue additional opportunities to reduce potable water intensity.
• In FY 2017, NSA initiated the purchase of reclaimed water, primarily as make-up waterfor cooling towers, resulting in an approximately 58 percent decrease in potable water usefrom FY 2016.
• Defense Intelligence Agency (DIA) continued to leverage a comprehensive waterconservation program that includes optimized use of industrialized chilled water at all ofits facilities, resulting in a 37 percent decrease in water use intensity. In FY 2018, DIAwill continue to pursue permits to allow on-site groundwater for non-potable use in itscooling towers, further decreasing DIA’s potable water consumption.
Industrial, Landscaping, and Agricultural (ILA) Water Consumption In FY 2009, E.O. 13514 established a new water reduction goal. The goal requires Federal agencies to reduce ILA water consumption by two percent annually, or 20 percent by FY 2020, relative to an FY 2010 baseline. This was extended through 2025 in E.O. 13693. In FY 2015, DoD established supplemental guidance for Components to establish a baseline, and measure and estimate ILA water use that sets Components’ baseline year to FY 2016 as opposed to EO 13693’s baseline year of 2010. In FY 2017, DoD reduced ILA water consumption by 39 percent relative to the FY 2010 federal baseline.
ILA Water includes naturally occurring water (e.g., lake, well, river water that is not treated [fresh]) used
in an ILA application. ILA also includes any non-potable water purchased from a third party.

23
Non-Tactical Fleet Vehicle Petroleum Consumption
E.O. 13693 requires Federal agencies to reduce per-mile greenhouse gas (GHG) emissions 30 percent by FY 2025 from a FY 2014 baseline. This requirement, along with alternative fuel progress, is reported in the DoD Strategic Sustainability Performance Plan (SSPP). Fleet vehicle
fuel consumption in FY 2017 accounted for about 4.3 percent of DoD installation energy consumption and 5.2 percent of DoD installation energy cost. The energy mix consisted of 67 percent gasoline, 30 percent diesel, and the remaining three percent was alternative fuels. The Military Departments accounted for slightly more than 98 percent of the Department’s fleet vehicle petroleum consumption (Figure 4-5).
In FY 2017, DoD fleet vehicles consumed 70.1 million gallons of gasoline equivalent (GGE), which includes gasoline and diesel. The mix of petroleum fuel types has remained relatively stable over the past seven years, and the use of alternative fuel vehicles (AFVs) has steadily increased. In FY 2016, 10.4 percent of the total fleet vehicle consumption was from alternative fuels, an increase over the 2005 baseline of 2.2 percent. Alternative fuels include biodiesel, compressed natural gas (CNG), 85 percent ethanol fuel (E85), and hydrogen. DoD continues to pursue replacement of fleet vehicles with more efficient models, AFVs, and hybrid-electric vehicles to decrease petroleum consumption. Overall, DoD fleet vehicles
consumed 68.3 percent of the fuel, which is nearly 17 percent less than the EISA-established 80 percent reduction target for FY 2017 (Figure 4-6).
Figure 4-5: FY 2017 Fleet Vehicle Petroleum Consumption

24
Army
In FY 2017, the Army furthered its energy security by exceeding the cumulative fossil fuel reduction goal of 24 percent with an approximate 40 percent reduction. This also exceeds the mandated FY 2020 cumulative goal of 30 percent. The Army continues to follow the E.O. 13693 to guide its fossil fuel consumption reduction efforts. The Army’s non-tactical vehicle (NTV) fleet decreased by 923 NTVs in FY 2017, which increased the Army’s overall reduction of NTVs to 14,355 vehicles since FY 2011. The Army is optimizing its NTV fleet annually through the Vehicle Allocation Methodology (VAM)/Vehicle Utilization Review Board (VURB) process. Every NTV not meeting utilization goals must be validated and approved by the Senior Commander for retention. The strategy to meet and exceed the GHG goals is to replace passenger vehicles meeting age or mileage criteria with hybrid, plug-in hybrid, or zero emission vehicles. Buses and larger trucks are being replaced with compressed natural gas or liquid petroleum gas vehicles. This strategy facilitates fossil fuel reduction and lowers greenhouse gas emissions in the most economical and mission-effective manner. The Army continues to leverage assistance from the U.S. Department of Energy (DOE) to conduct installation site surveys for properly locating electric vehicle charging infrastructure. Site surveys are considering current requirements and an estimate of future requirements through FY 2030.
DON
The DON continued to improve NTV fleet operations in replacing internal combustion engine (ICE) vehicles with electric vehicles (EVs) and implementing alternate transportation methods. In FY 2017, the USMC launched a Mobility Transformation Strategy (MTS) to develop mobility solutions that: advance the incorporation of analytics into NTV fleet operations to improve safety and maintenance; partner with industry leaders to identify and implement cost savings strategies; improve accessibility and convenience; and right-size the NTV fleet in to increase efficiency and
Figure 4-6: FY 2017 Fleet Vehicle Consumption Relative to FY 2005 Baseline
25
resilience in fleet operations. The MTS identified a variety of elements that will be further researched, including: on-demand mobility services (Car-sharing and Ride-hailing), consolidated vehicle pools, electric and autonomous vehicles, telematics, public transportation, bike sharing and walkability, and troop and cargo movement.
For the first reporting year since establishment of the NTV fleet-wide per-mile GHG emission reduction goal, the DON exceeded the two percent target by achieving an overall 12.8 percent reduction. Navy NTV fleet carbon dioxide equivalent/mile (CO2e/mile) decreased from 565.35 to 507.15 (10.3 percent) and Marine Corps NTV fleet CO2e/mile decreased from 483.4 to 388.7 (19.6 percent). The DON continues to pursue effective use of alternative fuel vehicles (AFVs), fuel-efficient technologies, and fleet optimization in order to meet the 30 percent NTV fleet-wide per-mile GHG emission reduction goal by FY 2025.
Air Force
Although the Air Force has experienced a 9.3 percent increase in fuel consumption relative to the FY 2005 baseline, the Air Force remains committed to reducing the use of petroleum products in its NTV fleet as well as increasing the use of alternative fuels in order to meet E.O. 13693. The Air Force’s enterprise-wide fleet managers, the 441 Vehicle Support Chain Operations Squadron (VSCOS), has implemented many programs that directly contribute to the success of this federal mandate by way of procurement, plug-in electric vehicle (PEV) fleets, Vehicle Validations (VV) and the testing of new products intended to assist the USAF in meeting Federal and DoD sustainable procurement directives, Federal Acquisition Regulations and Reduce dependence on foreign petroleum.
The bio-based four cycle engine oil project is demonstrating bio-based engine oil in NTVs at eight sites (four USAF sites) with 68 vehicles in varying climate locations over four seasons. The test is designed to evaluate the impact on overall maintenance performance, longevity, and environmental or “green” impact. This demonstration is underway with final report (and anticipating established National Stock Number) expected in early 2018.
The Air Force is also evaluating other technologies that can reduce energy consumption, like commercial off the shelf kits that can reduce engine idling. Additionally, the Air Force is developing a framework to improve agility, energy efficiency, safety, reliability, maintainability, operator environmental conditions, and reduce hazardous greenhouse gas emissions by demonstrating the feasibility of hybridizing low density, mission specific vehicles. The 25K Halvorsen Loader, an operational, air-transportable and worldwide deployable vehicle, will be the first subject of this hybrid demonstration. The project just initiated and demonstration results are expected in 2020.

26
Defense Agencies
In FY 2017, the Defense Agencies accounted for 3.2 percent of DoD fleet petroleum consumption and continued to pursue opportunities to reduce petroleum consumption.
• In FY 2017, DIA reported a 12.3 percent decrease in fuel use in the vehicles it leases fromthe Gernal Services Administration (GSA), exceeding the DoD requirement of ninepercent, and even improving on the previous FY’s 11.7 percent reduction. DIA’s fuel usereduction was achieved by reducing the amount of driving done by the vehicles it operates,along with replacing many of its larger sedans with more fuel efficient vehicles. In FY2018, DIA plans to add additional GSA EVs when it opens a new parking garage at DIAHQ equipped with EV charging stations. In addition, the DIA Vehicle Program Managerwill continue to request that GSA provide DIA with the most fuel efficient vehicles thatmeet mission requirements.
• DLA continues to make positive efforts in consumption of vehicle petroleum use withDefense Supply Center Columbus further reducing its use by 9.41 percent for an overall59 percent decrease against the FY 2007 baseline.
27
5. Increasing DoD Distributed (On-site) and Renewable Energy Resources
In addition to reducing facility energy demand, DoD is increasing the supply of distributed (on-site) and renewable energy on installations. DoD continues to invest in cost-effective renewable and distributed energy solutions that meet the Department’s strategy to prioritize energy resilience and bolster mission assurance.
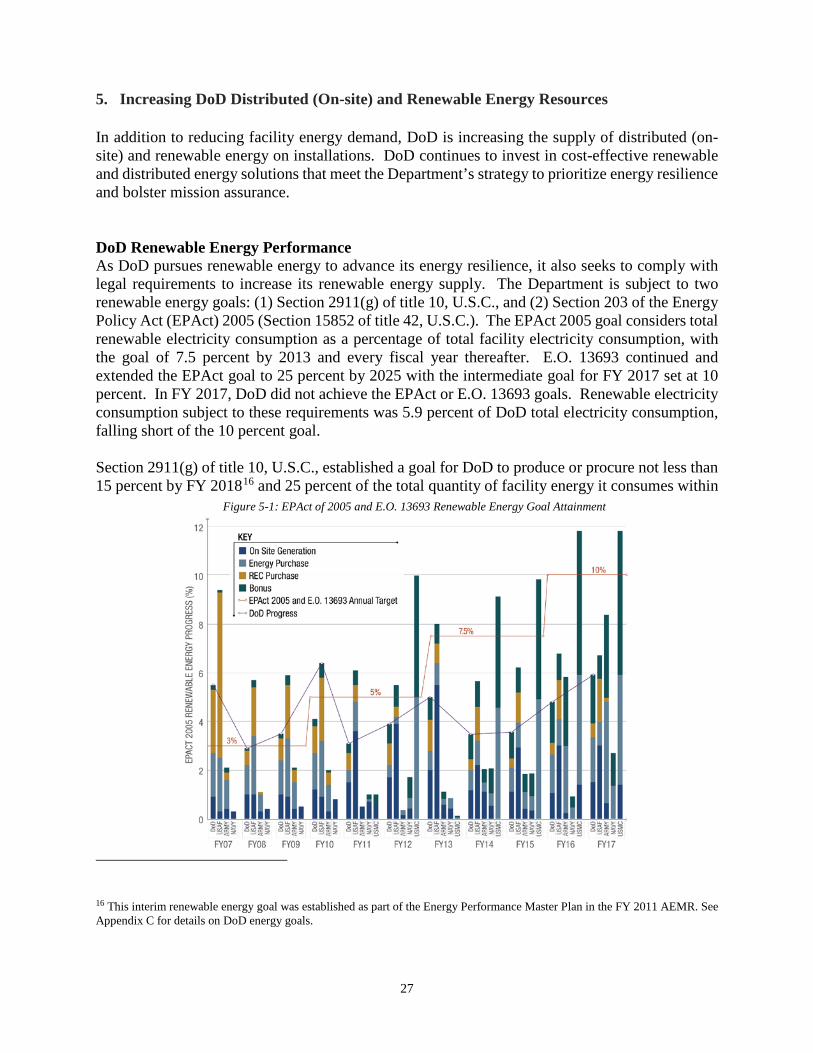
DoD Renewable Energy Performance As DoD pursues renewable energy to advance its energy resilience, it also seeks to comply with legal requirements to increase its renewable energy supply. The Department is subject to two renewable energy goals: (1) Section 2911(g) of title 10, U.S.C., and (2) Section 203 of the Energy Policy Act (EPAct) 2005 (Section 15852 of title 42, U.S.C.). The EPAct 2005 goal considers total renewable electricity consumption as a percentage of total facility electricity consumption, with the goal of 7.5 percent by 2013 and every fiscal year thereafter. E.O. 13693 continued and extended the EPAct goal to 25 percent by 2025 with the intermediate goal for FY 2017 set at 10 percent. In FY 2017, DoD did not achieve the EPAct or E.O. 13693 goals. Renewable electricity consumption subject to these requirements was 5.9 percent of DoD total electricity consumption, falling short of the 10 percent goal.
Section 2911(g) of title 10, U.S.C., established a goal for DoD to produce or procure not less than 15 percent by FY 201816 and 25 percent of the total quantity of facility energy it consumes within
16 This interim renewable energy goal was established as part of the Energy Performance Master Plan in the FY 2011 AEMR. See Appendix C for details on DoD energy goals.
Figure 5-1: EPAct of 2005 and E.O. 13693 Renewable Energy Goal Attainment

28
its facilities by FY 2025 and each fiscal year thereafter from renewable energy sources. DoD progress toward the section 2911(g) of title 10, U.S.C., renewable energy goal in FY 2017 was 8.74 percent (Figure 5-2).
The Department uses various authorities to increase the supply of distributed (on-site) and renewable energy sources on its installations. DoD uses both appropriated funds and
non-Governmental (often referred to as ‘third-party’) financing to pursue renewable energy projects. DoD partners with private entities to enable the development of large-scale renewable (or other distributed) energy projects and relies on congressional appropriations to fund cost-effective, small-scale distributed generation projects. The main authorities utilized to pursue third-party financing of renewable energy projects are Utility Service Contracts (USCs), Power Purchase Agreements (PPAs), and outgrants (Table 5-1). Sections 2922(a) and 2667 of title 10, U.S.C. are not limited to renewable energy sources and can also be used for non-renewable energy sources such as natural gas and other fuel types. Section 2410(q) of title 10, U.S.C. is limited to renewable energy sources.
Figure 5-2: 10 U.S.C. Section 2911(g) Renewable Energy Goal

29
Army
Renewable energy production and utilization is essential to meeting the Army energy resilience goals. Assured access to reliable supplies of energy and the ability to protect and deliver sufficient energy to meet operational needs is a chief goal of Directive 2017-07, and the “Assured Access” category within the revised ISR-MC metrics now includes questions to determine the percent of onsite generation from renewable energy sources. Onsite renewable energy provides a means to diversify supply at installations and reduce reliance on commercial energy grids in cases where the energy can be used on the installation. Securing reliable energy supplies to support the Army’s mission is a primary goal of the Army’s renewable energy strategy.
In FY 2017, the Army increased its renewable energy capacity for a third year in a row. The Army added 176.1 MW of renewable electricity capacity in FY 2017 through 33 new projects for a total of 428.6 MW, a 69.7 percent increase from FY1 2016. The total percentage of renewable electric energy eligible toward the EPAct 2005 goal increased from 5.8 percent in FY 2016 to 8.4 percent. The renewable energy production credited toward the NDAA 2010 goal increased by 3.6 percent
Table 5-1: Non-Federal Funding Mechanisms

30
from FY 2016 to FY 2017. The Clean Energy goal is not comparable year over year, as it was a new metric in FY 2016 and the calculation methodology for FY 2017 changed.
The Army continues to employ a comprehensive approach to renewable energy, focusing on supporting installation mission requirements. The Army’s cost-effective investments include small-scale projects on rooftops and parking areas, larger projects funded through ERCIP or financed through ESPCs and UESCs, as well as utility-scale projects leveraging private financing through available Federal and DoD authorities. In FY 2017, the Army added 14.8 MW of renewable electricity capacity through a variety of programs that leverage private or third-party financing, such as Power Purchase Agreements (PPAs), ESPC/UESC, or GSA area-wide utility contracts. The Army’s Office of Energy Initiatives (OEI) facilitates utility-scale projects by leveraging private equity. In FY 2017, the OEI added 142.0 MW of renewable electricity capacity with efforts focused on the development of generation projects that include energy storage and controls to allow the power to support the installation requirements in the event of a grid outage. Examples of this are agreements with local utilities, such as the 10 MW and 7 MW projects at Fort Rucker and Anniston Army Depot in Alabama. Other efforts were forged with independent renewable energy providers, such as the new 50 MW of off-site wind generation combined with a 15 MW onsite solar facility at Fort Hood, TX.
The Army also leveraged third party financing to install 15.3 MW of renewable electricity generation through the Residential Communities Initiative. Finally, 2.1 MW of renewable electric generation was brought online through ERCIP and MILCON funded projects.
DON
In FY 2017, Navy did not achieve the E.O. 13693 renewable electricity annual target of 10 percent, consuming only 2.1 percent of electricity from renewable energy sources for the year. The Marine Corps progress toward meeting the E.O. 13693 target was 10.5 percent. The Navy’s performance regarding the renewable electricity goal is a function of the strategic decision to allow other parties to monetize the value of RECs associated with its financed energy projects. Because REC ownership is a requirement to claim credit towards the E.O. 13693 renewable electricity goal, the Navy is unlikely to show significant progress towards this particular goal despite intensive efforts to facilitate renewable energy production and consumption on, and for, its installations.
Finally, the DON continued to make exceptional progress against the DoD renewable goal established in section 2911(g) of title 10, U.S.C. In FY 2017, the Navy produced or procured 16.17 percent of renewable energy relative to electricity consumed. This marks the fourth consecutive year the Navy has achieved the interim FY targets toward the 25 percent by FY 2025 2911(g) goal. The Marine Corps produced or procured 12.26 percent of renewable energy relative to electricity consumed.
31
Air Force In FY 2017, 6.7 percent of the electrical energy used by the Air Force was produced from renewable sources. This represents a decrease of 17,759 MWh from the 6.8 percent in FY 2016, and is below the FY 2017 EPAct 2005 /E.O. 13693 goal of 10 percent. In addition, the Air Force performance toward the section 2911(g) of 10, U.S.C. goal (producing or procuring at least 25 percent of facility energy from renewable energy sources by the year 2025) was 8.4 percent for both electric and non-electric energy used in FY 2017.
Renewable performance in FY 2017 was negatively impacted primarily due to the termination of a contract at Hill AFB, UT, to purchase steam from an energy recovery facility with municipal solid waste. Additionally, Robins AFB, GA, terminated green energy purchases from the local utility and the Landfill Gas generation plant at Joint Base Elmendorf Richardson, AK, produced less than expected.
Major operational renewable energy projects in FY 2017 included:
• 14.2 MW and 19 MW arrays using a Power Purchased Agreement at Nellis AFB, NV.
• 16.4 MW Power Purchased Agreement array at Davis Monthan AFB, AZ, using anindefinite term Federal Acquisition Regulation Part 41 contract mechanism.
• Six MW Power Purchased Agreement array at US Air Force Academy, CO.
• Three MW Power Purchased Agreement array at Edwards AFB, CA.
• 3.4 MW wind project at Cape Cod AFS, MA.
• One MW solar photovoltaic project at Buckley AFB, CO.
• 2.3 MW landfill gas generation plant at Hill AFB, UT, and 7 MW landfill gas generationplant at Joint Base Elmendorf Richardson-Richardson, AK.
• 10 MW solar photovoltaic array at Luke AFB, AZ.
• 20 MW solar photovoltaic array at Air Force Plant 42, Palmdale, CA.
Ground Source Heat Pump (GSHP) projects within the Air Force have a 11,277 ton total operating capacity which is equivalent to approximately 6,100 MWh resilient renewable energy. Ground Source Heat Pump projects were executed using various funding sources including Energy Savings Performance Contract, Utility Energy Service Contract and the Energy Resilience and Conservation Investment Program.
32
Defense Agencies The Defense Agencies continue to implement renewable energy projects on their facilities. In many cases, Defense Agencies operate in individual buildings rather than campuses or installations, limiting their ability to implement renewable energy projects. However, Defense Agencies continue to consider cost-effective, small-scale, and distributed renewable energy generation. DLA renewable energy projects continue in spite of limited geographic locations and low cost of utilities often resulting in a lack of economic feasibility for most renewable energy options. Examples where progress was made include DLA Aviation Operations Center in Richmond, VA, and the new DLA Distribution Operations Center building at Susquehanna, PA. The Aviation Operations Center HVAC was designed to use of ground source heat pumps and the Distribution Operations Center has 130 kW solar panel system on the roof. In addition, construction of solar walls at both Susquehanna, PA, and San Joaquin, CA, have been completed.

33
6. Reporting Utility Outages on Military Installations
Section 2925(a)(2) of title 10, U.S.C., requires the reporting of utility outages at military installations and in FY 2017 DoD Components reported approximately 1,205 utility outages that lasted eight hours or longer, an increase from the 507 events reported in FY 2016. Electrical disruptions account for the majority of these utility outages (72 percent). The increase in the number of reported events is primarily a result of higher incidence of reporting and is not indicative of a substantial increase in actual outage events lasting longer than eight hours. Of the 1,205 reported outage events lasting longer than eight hours, the Services provided financial impacts for 274 of the events. The combined length of outages for these 274 events was 2,179.34 days; the estimated financial impact of these outages was $27,615,061 ($12,671 per outage day). In the utility and master planning communities, cost in dollars per kilowatt hour is the standard measurement used to distinguish the financial impacts of electric outages. DoD does not have the modeling capability in place to readily evaluate the outage data in accordance with this industry best practice. In FY 2018, DoD will continue to refine its outage data collection techniques and future Annual Energy Management Reports will reference the impact of outages accordingly. As in previous years’ reporting, in FY 2017, the mitigation efforts associated with DoD utility outages included upgrading infrastructure, increasing servicing efforts with the local utility, and pursuit of emergency or redundant power supplies such as backup generators. These utility outages were caused by acts of nature, equipment failure, or planned maintenance. In FY 2017, equipment failure (e.g., reliability or mechanical issues) accounted for 43 percent of the reported utility outages, 35 percent were caused by planned maintenance, and 15 percent outages were caused by acts of nature (e.g., weather, storms). The remaining seven percent were considered “other” since they did not fall under these categories (for example, vehicle accidents causing power outages or operator error).
Figure 6-1: FY 2017 Utility Outages by Cause

34
7. Additional Reporting Requirements
• Section 315, the National Defense Authorization Act (NDAA) for Fiscal Year 2017 (Pub. L. 114-328) (Appendix E)
o Efforts to reduce the high energy costs on military installations • Senate Report 115-125, to accompany S. 1519, the NDAA for FY 2018 (Appendix F)
o Energy Savings Performance Contracts Assessment o Energy Assurance on Military Installations
• House Report 115-200, to accompany H.R. 2810, the NDAA for FY 2018 (Appendix G) o Energy Resilience of Overseas Military Installations
• House Report 115-219, to accompany H.R. 3219, Department of Defense Appropriations Bill for FY 2018 (Appendix H)
o Energy Security of Overseas Military Installations • Senate Report 114-237 & House Report 115-188, Water Report (Appendix I)

A-1
Appendix A - List of Energy Acronyms
Acronym Definition AEMRR Annual Energy Management and Resilience Report AFB Air Force Base AFCEC Air Force Civil Engineer Center AFIMSC Air Force Installation and Mission Support Center AFV Alternative Fuel Vehicle ANGB Air National Guard Base ARNG Army National Guard ASA(EI&E) Assistant Secretary of the Army for Installations, Energy and Environment ASN(EI&E) Assistant Secretary of the Navy for Energy, Installations and Environment ASRA Army Strategic Readiness Assessment BBtu Billion British Thermal Unit Btu British Thermal Unit CNG Compressed Natural Gas CNIC Commander, Navy Installations Command CNO Office of the Chief of Naval Operations CO2e Carbon Dioxide Equivalent CONUS Contiguous United States DASA(E&S) Deputy Assistant Secretary of the Army for Energy and Sustainability DASN(Energy) Deputy Assistant Secretary of the Navy for Energy DC I&L Deputy Commandant for Installations and Logistics DCMA Defense Contract Management Agency DeCA Defense Commissary Agency DFAS Defense Finance and Accounting Service DIA Defense Intelligence Agency DLA Defense Logistics Agency DoD Department of Defense DoDI Department of Defense Instruction DOE Department of Energy DON Department of the Navy DUSD (I&E) Deputy Under Secretary of Defense (Installations and Environment) E85 85 percent ethanol fuel EIA Energy Information Administration EISA Energy Independence and Security Act EO Executive Order EPAct Energy Policy Act ES2 Energy Security and Sustainability ERCIP Energy Resilience Conservation Investment Program
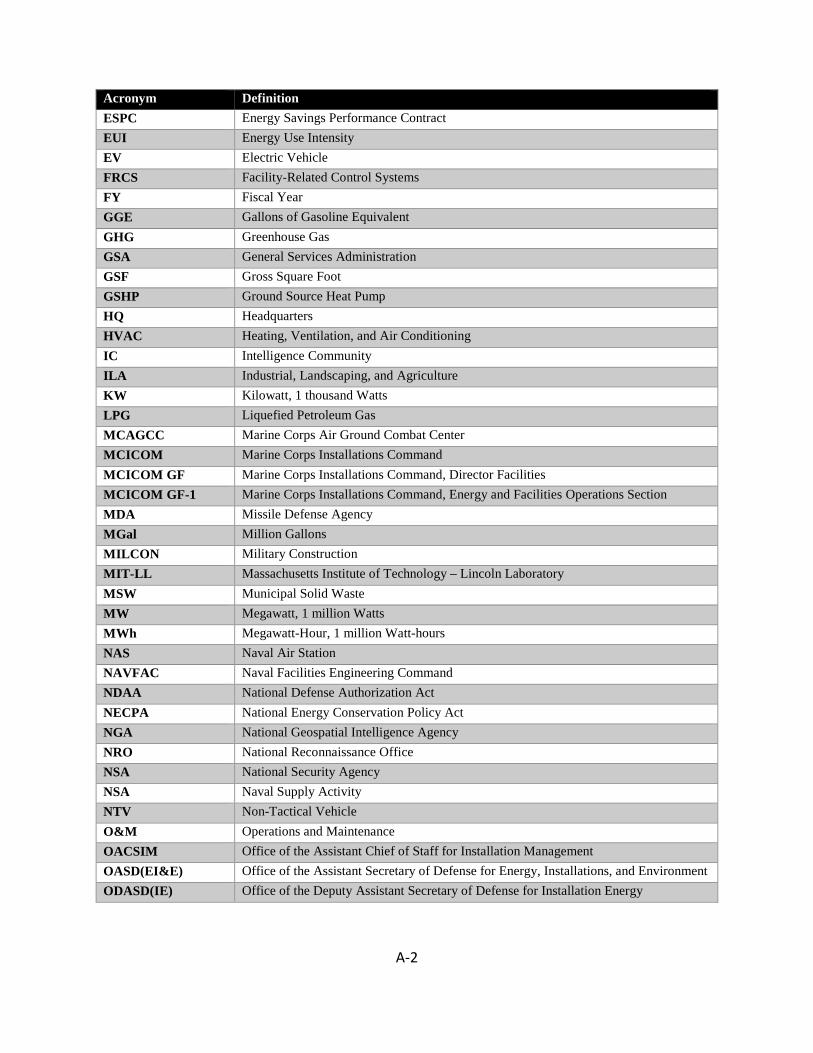
A-2
Acronym Definition ESPC Energy Savings Performance Contract EUI Energy Use Intensity EV Electric Vehicle FRCS Facility-Related Control Systems FY Fiscal Year GGE Gallons of Gasoline Equivalent GHG Greenhouse Gas GSA General Services Administration GSF Gross Square Foot GSHP Ground Source Heat Pump HQ Headquarters HVAC Heating, Ventilation, and Air Conditioning IC Intelligence Community ILA Industrial, Landscaping, and Agriculture KW Kilowatt, 1 thousand Watts LPG Liquefied Petroleum Gas MCAGCC Marine Corps Air Ground Combat Center MCICOM Marine Corps Installations Command MCICOM GF Marine Corps Installations Command, Director Facilities MCICOM GF-1 Marine Corps Installations Command, Energy and Facilities Operations Section MDA Missile Defense Agency MGal Million Gallons MILCON Military Construction MIT-LL Massachusetts Institute of Technology – Lincoln Laboratory MSW Municipal Solid Waste MW Megawatt, 1 million Watts MWh Megawatt-Hour, 1 million Watt-hours NAS Naval Air Station NAVFAC Naval Facilities Engineering Command NDAA National Defense Authorization Act NECPA National Energy Conservation Policy Act NGA National Geospatial Intelligence Agency NRO National Reconnaissance Office NSA National Security Agency NSA Naval Supply Activity NTV Non-Tactical Vehicle O&M Operations and Maintenance OACSIM Office of the Assistant Chief of Staff for Installation Management OASD(EI&E) Office of the Assistant Secretary of Defense for Energy, Installations, and Environment ODASD(IE) Office of the Deputy Assistant Secretary of Defense for Installation Energy

A-3
Acronym Definition OPNAV-N46 CNO Shore Installation Management Division PEV Plug-in Electric Vehicle PPA Power Purchase Agreement PV Photovoltaic REC Renewable Energy Credit SAF/IE Deputy Assistant Secretary of the Air Force for Energy SESC Senior Energy and Sustainability Council SMR Small Modular Reactor SRM Sustainment, Restoration, and Modernization SSPP Strategic Sustainability Performance Plan UESC Utility Energy Services Contract UFC Unified Facilities Criteria UP Utilities Privatization U.S. United States U.S.C United States Code USC Utility Service Contract VAM Vehicle Allocation Methodology WHS Washington Headquarters Service

B-1
Appendix B - Compliance Matrix
Subsection / Paragraph Description
FY 2017 AEMRR Chapter / Appendix
Page Number
10 USC § 2925
(a)
Annual Report Related to Installations Energy Management. Not later than 120 days after the end of each fiscal year, the Secretary of Defense shall submit to the congressional defense committees an installation energy report detailing the fulfillment during that fiscal year of the energy performance goals for the Department of Defense under section 2911 of this title. Each report shall contain the following:
(a)(1)
A description of the progress made to achieve the goals of the Energy Policy Act of 2005 (Public Law 109–58), section 2911(g) of this title, section 553 of the National Energy Conservation Policy Act (42 U.S.C. 8259b), the Energy Independence and Security Act of 2007 (Public Law 110–140), and the energy performance goals for the Department of Defense during the preceding fiscal year.
4,5 10-31
(a)(2) A description of the energy savings, return on investment, and enhancements to mission assurance realized by the fulfillment of the goals described in paragraph (1).
3,4,5 8-31
(a)(3)
Details of all commercial utility outages caused by threats and those caused by hazards at military installations that last eight hours or longer, whether or not the outage was mitigated by backup power, including non-commercial utility outages and Department of Defense-owned infrastructure, including the total number and location of outages, the financial impact of the outages, and measure taken to mitigate outages in the future at the affected locations and across the Department of Defense.
6 31
10 USC § 2911
(a)(1)
Energy Performance Goals. The DoD shall submit to the congressional defense committees the energy performance goals for the Department of Defense regarding transportation systems, support systems, utilities, and infrastructure and facilities.
Appendix C C-1
(b)(1)
Energy Performance Master Plan. The DoD shall develop a comprehensive master plan for the achievement of the energy performance goals of the Department of Defense, as set forth in laws, executive orders, and Department of Defense policies.
Appendix C C-1
(e)(2) Interim Renewable Energy Goal. Requires the DoD to establish an interim FY 2018 goal for the production or procurement of facility energy from renewable sources.
Appendix C C-1
P.L. 114-328, NDAA FY 2017
(S. 2943 Sec. 315)
p.
The Senate Armed Services Committee directed the Under Secretary of Defense for Acquisition, Technology, and Logistics to report to Congress on efforts to achieve cost savings at military installations with high levels of energy intensity.
Appendix E E-1
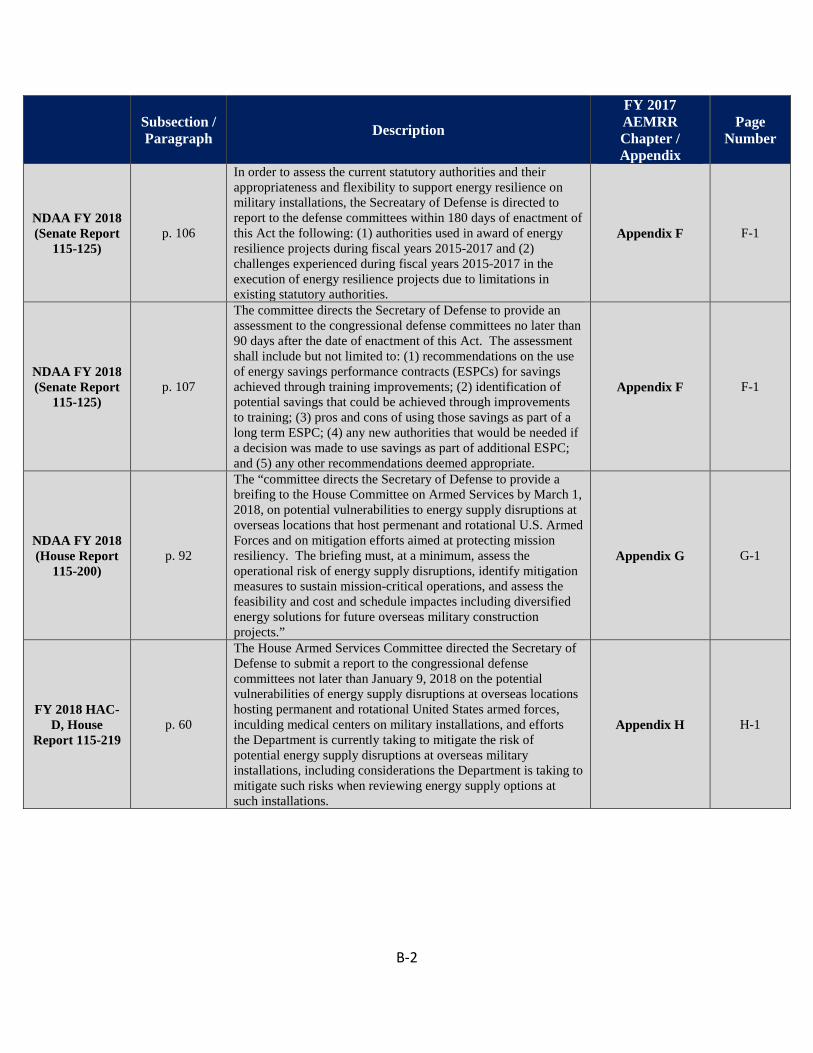
B-2
Subsection / Paragraph Description
FY 2017 AEMRR Chapter / Appendix
Page Number
NDAA FY 2018 (Senate Report
115-125) p. 106
In order to assess the current statutory authorities and their appropriateness and flexibility to support energy resilience on military installations, the Secreatary of Defense is directed to report to the defense committees within 180 days of enactment of this Act the following: (1) authorities used in award of energy resilience projects during fiscal years 2015-2017 and (2) challenges experienced during fiscal years 2015-2017 in the execution of energy resilience projects due to limitations in existing statutory authorities.
Appendix F F-1
NDAA FY 2018 (Senate Report
115-125) p. 107
The committee directs the Secretary of Defense to provide an assessment to the congressional defense committees no later than 90 days after the date of enactment of this Act. The assessment shall include but not limited to: (1) recommendations on the use of energy savings performance contracts (ESPCs) for savings achieved through training improvements; (2) identification of potential savings that could be achieved through improvements to training; (3) pros and cons of using those savings as part of a long term ESPC; (4) any new authorities that would be needed if a decision was made to use savings as part of additional ESPC; and (5) any other recommendations deemed appropriate.
Appendix F F-1
NDAA FY 2018 (House Report
115-200) p. 92
The “committee directs the Secretary of Defense to provide a breifing to the House Committee on Armed Services by March 1, 2018, on potential vulnerabilities to energy supply disruptions at overseas locations that host permenant and rotational U.S. Armed Forces and on mitigation efforts aimed at protecting mission resiliency. The briefing must, at a minimum, assess the operational risk of energy supply disruptions, identify mitigation measures to sustain mission-critical operations, and assess the feasibility and cost and schedule impactes including diversified energy solutions for future overseas military construction projects.”
Appendix G G-1
FY 2018 HAC-D, House
Report 115-219 p. 60
The House Armed Services Committee directed the Secretary of Defense to submit a report to the congressional defense committees not later than January 9, 2018 on the potential vulnerabilities of energy supply disruptions at overseas locations hosting permanent and rotational United States armed forces, inculding medical centers on military installations, and efforts the Department is currently taking to mitigate the risk of potential energy supply disruptions at overseas military installations, including considerations the Department is taking to mitigate such risks when reviewing energy supply options at such installations.
Appendix H H-1
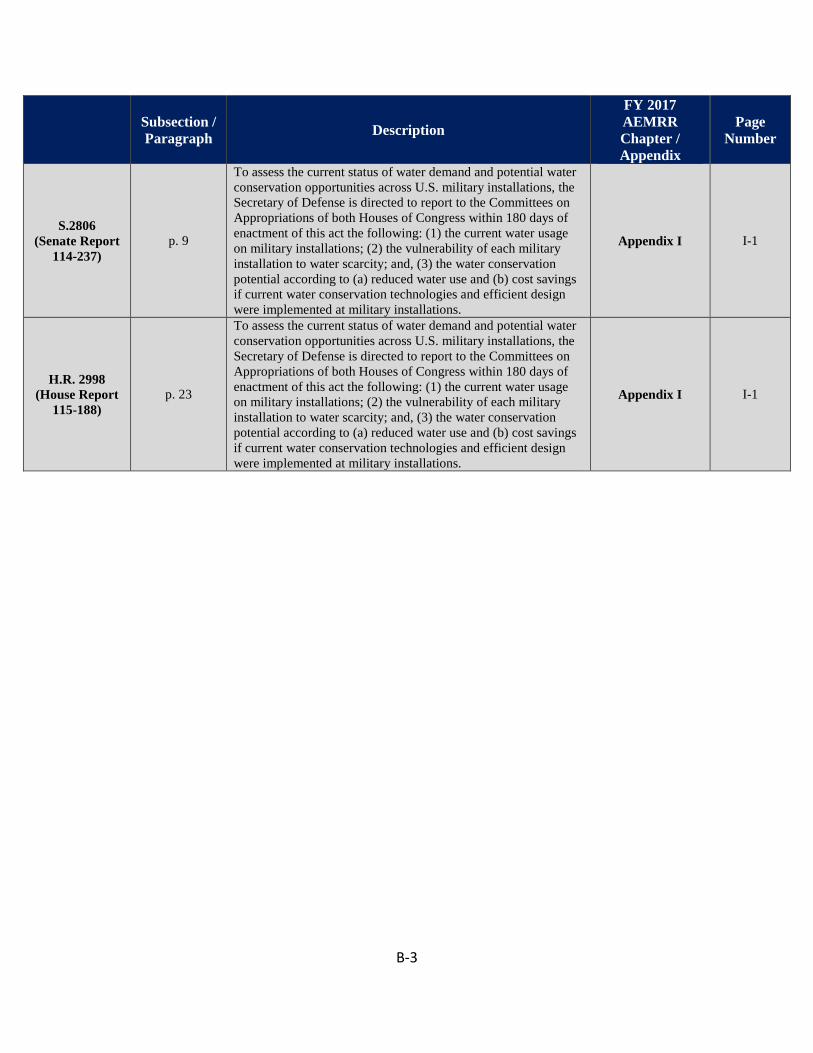
B-3
Subsection / Paragraph Description
FY 2017 AEMRR Chapter / Appendix
Page Number
S.2806 (Senate Report
114-237) p. 9
To assess the current status of water demand and potential water conservation opportunities across U.S. military installations, the Secretary of Defense is directed to report to the Committees on Appropriations of both Houses of Congress within 180 days of enactment of this act the following: (1) the current water usage on military installations; (2) the vulnerability of each military installation to water scarcity; and, (3) the water conservation potential according to (a) reduced water use and (b) cost savings if current water conservation technologies and efficient design were implemented at military installations.
Appendix I I-1
H.R. 2998 (House Report
115-188) p. 23
To assess the current status of water demand and potential water conservation opportunities across U.S. military installations, the Secretary of Defense is directed to report to the Committees on Appropriations of both Houses of Congress within 180 days of enactment of this act the following: (1) the current water usage on military installations; (2) the vulnerability of each military installation to water scarcity; and, (3) the water conservation potential according to (a) reduced water use and (b) cost savings if current water conservation technologies and efficient design were implemented at military installations.
Appendix I I-1

C-1
Appendix C - Energy Performance Master Plan
DoD Energy Performance Master Plan
Introduction
The Energy Performance Master Plan (hereafter referred to as Master Plan) aligns investments to installation energy objectives, enables consistent Department-wide decision-making, and establishes metrics to evaluate DoD’s progress against installation energy performance goals. The Master Plan was established and reported in the FY 2011 AEMR. The goals outlined in the Master Plan align with the Department’s facility energy strategy designed to reduce energy costs and improve the energy resilience of fixed installations. The key elements of the installation energy strategy are (Figure C-1):
• Maximize Efficient Energy Use • Expand Supply for Mission Assurance • Enhance Energy Resilience
In FY 2011, the then Office of the Deputy Under Secretary of Defense for Installations and Environment (ODUSD(I&E)) developed its energy performance goals and its first Master Plan with input from DoD Components. The Office of the Assistance Secretary of Defense for Sustainment (OASD(S)) is in the process of updating the Master Plan to meet the emerging energy requirements and to address energy security challenges specified in the Secretary of Defense’s National Defense Strategy (NDS) released in February 2018. The energy performance goals will be updated and reported annually, while the Master Plan will be updated periodically in the AEMRR. However, DoD Components are required to submit their facility energy investment projections for the Future Years Defense Program (FYDP) as part of their Master Plan submittal. The DoD Components’ submissions to the President Budget, investment profile, energy benefit analyses, and narratives will be the basis for any periodic updates of the Master Plan within the AEMRR.
Installation energy is the energy necessary to support the functions of over 500 fixed installations on nearly 29 million acres of land within the United States and internationally. This energy is distinct from operational energy, which consists largely of mobility fuel that is used by operational aircraft, ships, and tanks, as well as generators at forward operating bases.
Figure C-1: Installation Energy Approach
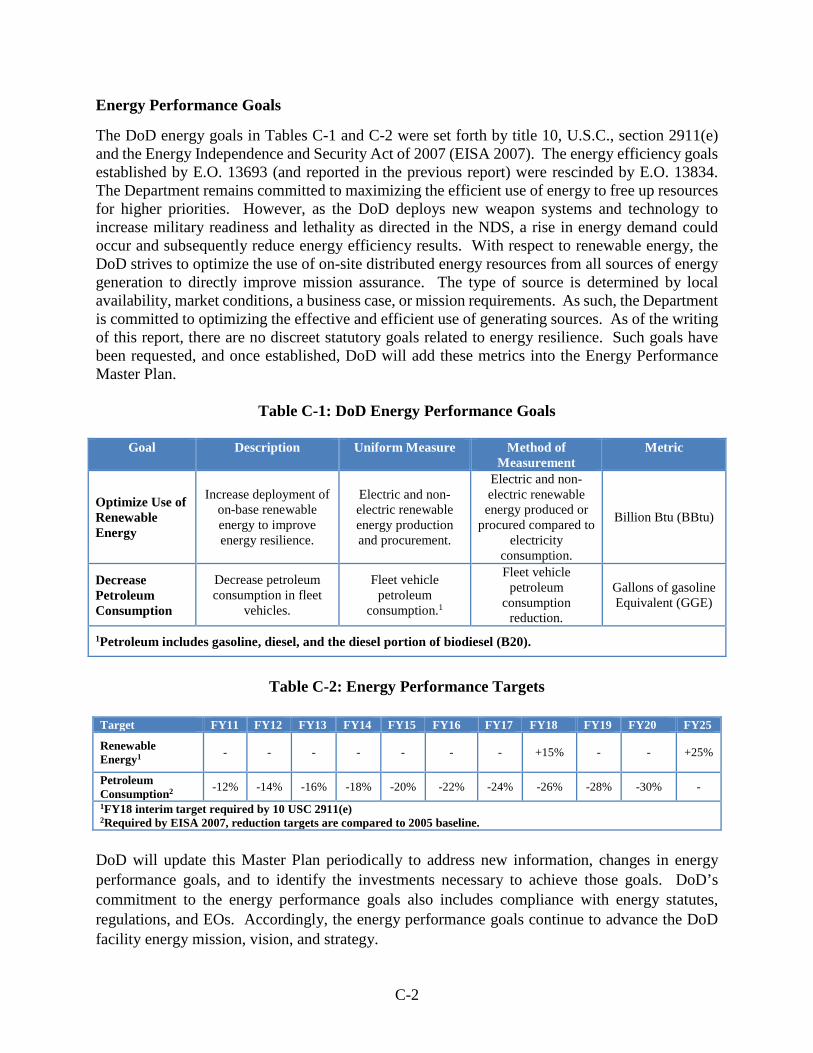
C-2
Energy Performance Goals
The DoD energy goals in Tables C-1 and C-2 were set forth by title 10, U.S.C., section 2911(e) and the Energy Independence and Security Act of 2007 (EISA 2007). The energy efficiency goals established by E.O. 13693 (and reported in the previous report) were rescinded by E.O. 13834. The Department remains committed to maximizing the efficient use of energy to free up resources for higher priorities. However, as the DoD deploys new weapon systems and technology to increase military readiness and lethality as directed in the NDS, a rise in energy demand could occur and subsequently reduce energy efficiency results. With respect to renewable energy, the DoD strives to optimize the use of on-site distributed energy resources from all sources of energy generation to directly improve mission assurance. The type of source is determined by local availability, market conditions, a business case, or mission requirements. As such, the Department is committed to optimizing the effective and efficient use of generating sources. As of the writing of this report, there are no discreet statutory goals related to energy resilience. Such goals have been requested, and once established, DoD will add these metrics into the Energy Performance Master Plan.
Table C-1: DoD Energy Performance Goals
Goal Description Uniform Measure Method of
Measurement Metric
Optimize Use of Renewable Energy
Increase deployment of on-base renewable energy to improve energy resilience.
Electric and non-electric renewable energy production and procurement.
Electric and non-electric renewable energy produced or
procured compared to electricity
consumption.
Billion Btu (BBtu)
Decrease Petroleum Consumption
Decrease petroleum consumption in fleet
vehicles.
Fleet vehicle petroleum
consumption.1
Fleet vehicle petroleum
consumption reduction.
Gallons of gasoline Equivalent (GGE)
1Petroleum includes gasoline, diesel, and the diesel portion of biodiesel (B20).
Table C-2: Energy Performance Targets
Target FY11 FY12 FY13 FY14 FY15 FY16 FY17 FY18 FY19 FY20 FY25
Renewable Energy1 - - - - - - - +15% - - +25%
Petroleum Consumption2 -12% -14% -16% -18% -20% -22% -24% -26% -28% -30% - 1FY18 interim target required by 10 USC 2911(e) 2Required by EISA 2007, reduction targets are compared to 2005 baseline.
DoD will update this Master Plan periodically to address new information, changes in energy performance goals, and to identify the investments necessary to achieve those goals. DoD’s commitment to the energy performance goals also includes compliance with energy statutes, regulations, and EOs. Accordingly, the energy performance goals continue to advance the DoD facility energy mission, vision, and strategy.
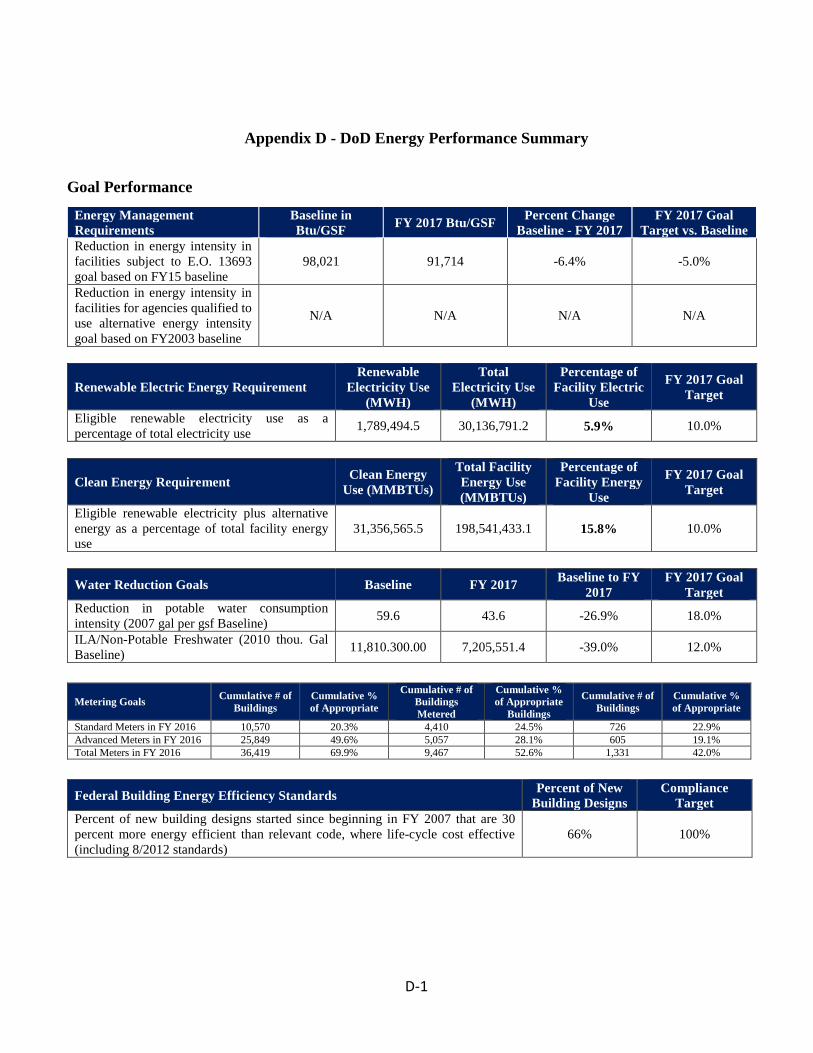
D-1
Appendix D - DoD Energy Performance Summary
Goal Performance
Energy Management Requirements
Baseline in Btu/GSF FY 2017 Btu/GSF Percent Change
Baseline - FY 2017 FY 2017 Goal
Target vs. Baseline Reduction in energy intensity in facilities subject to E.O. 13693 goal based on FY15 baseline
98,021 91,714 -6.4% -5.0%
Reduction in energy intensity in facilities for agencies qualified to use alternative energy intensity goal based on FY2003 baseline
N/A N/A N/A N/A
Renewable Electric Energy Requirement Renewable
Electricity Use (MWH)
Total Electricity Use
(MWH)
Percentage of Facility Electric
Use
FY 2017 Goal Target
Eligible renewable electricity use as a percentage of total electricity use 1,789,494.5 30,136,791.2 5.9% 10.0%
Clean Energy Requirement Clean Energy Use (MMBTUs)
Total Facility Energy Use (MMBTUs)
Percentage of Facility Energy
Use
FY 2017 Goal Target
Eligible renewable electricity plus alternative energy as a percentage of total facility energy use
31,356,565.5 198,541,433.1 15.8% 10.0%
Water Reduction Goals Baseline FY 2017 Baseline to FY 2017
FY 2017 Goal Target
Reduction in potable water consumption intensity (2007 gal per gsf Baseline) 59.6 43.6 -26.9% 18.0%
ILA/Non-Potable Freshwater (2010 thou. Gal Baseline) 11,810.300.00 7,205,551.4 -39.0% 12.0%
Metering Goals Cumulative # of Buildings
Cumulative % of Appropriate
Cumulative # of Buildings Metered
Cumulative % of Appropriate
Buildings
Cumulative # of Buildings
Cumulative % of Appropriate
Standard Meters in FY 2016 10,570 20.3% 4,410 24.5% 726 22.9% Advanced Meters in FY 2016 25,849 49.6% 5,057 28.1% 605 19.1% Total Meters in FY 2016 36,419 69.9% 9,467 52.6% 1,331 42.0%
Federal Building Energy Efficiency Standards Percent of New
Building Designs Compliance
Target Percent of new building designs started since beginning in FY 2007 that are 30 percent more energy efficient than relevant code, where life-cycle cost effective (including 8/2012 standards)
66% 100%
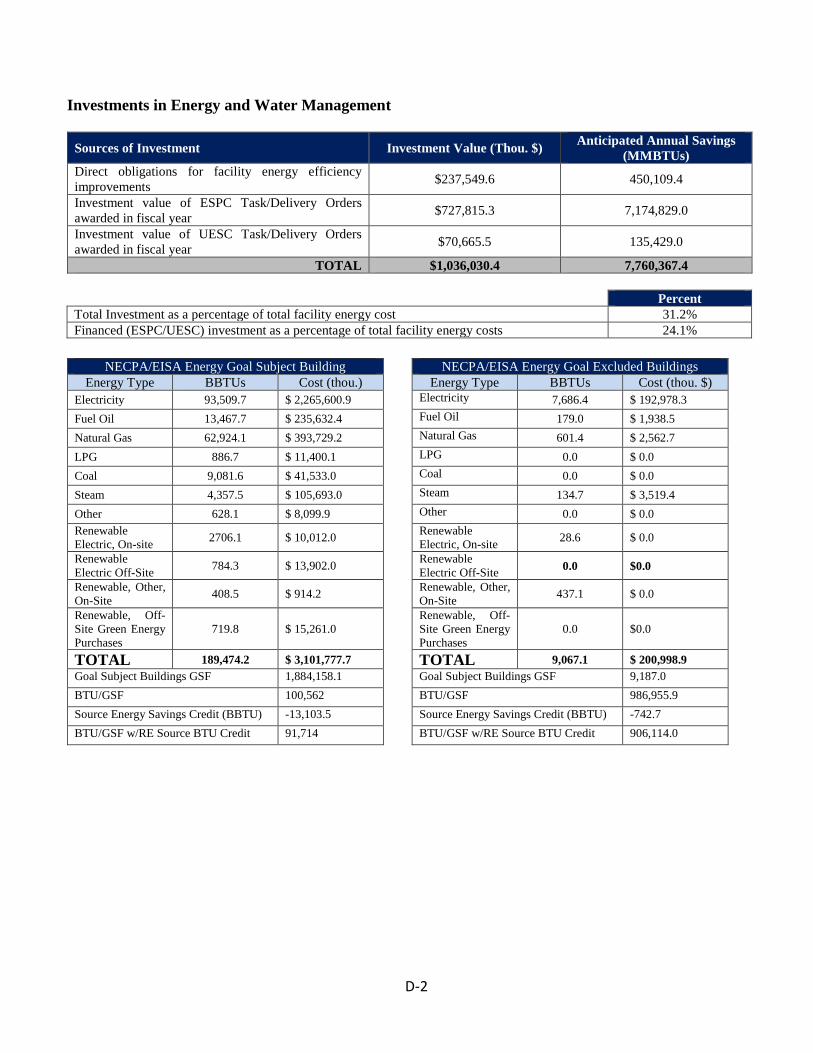
D-2
Investments in Energy and Water Management
Sources of Investment Investment Value (Thou. $) Anticipated Annual Savings (MMBTUs)
Direct obligations for facility energy efficiency improvements $237,549.6 450,109.4
Investment value of ESPC Task/Delivery Orders awarded in fiscal year $727,815.3 7,174,829.0
Investment value of UESC Task/Delivery Orders awarded in fiscal year $70,665.5 135,429.0
TOTAL $1,036,030.4 7,760,367.4
Percent Total Investment as a percentage of total facility energy cost 31.2% Financed (ESPC/UESC) investment as a percentage of total facility energy costs 24.1%
NECPA/EISA Energy Goal Subject Building NECPA/EISA Energy Goal Excluded Buildings
Energy Type BBTUs Cost (thou.) Energy Type BBTUs Cost (thou. $) Electricity 93,509.7 $ 2,265,600.9 Electricity 7,686.4 $ 192,978.3 Fuel Oil 13,467.7 $ 235,632.4 Fuel Oil 179.0 $ 1,938.5 Natural Gas 62,924.1 $ 393,729.2 Natural Gas 601.4 $ 2,562.7 LPG 886.7 $ 11,400.1 LPG 0.0 $ 0.0 Coal 9,081.6 $ 41,533.0 Coal 0.0 $ 0.0 Steam 4,357.5 $ 105,693.0 Steam 134.7 $ 3,519.4 Other 628.1 $ 8,099.9 Other 0.0 $ 0.0 Renewable Electric, On-site 2706.1 $ 10,012.0 Renewable
Electric, On-site 28.6 $ 0.0
Renewable Electric Off-Site 784.3 $ 13,902.0 Renewable
Electric Off-Site 0.0 $0.0
Renewable, Other, On-Site 408.5 $ 914.2 Renewable, Other,
On-Site 437.1 $ 0.0
Renewable, Off-Site Green Energy Purchases
719.8 $ 15,261.0 Renewable, Off-Site Green Energy Purchases
0.0 $0.0
TOTAL 189,474.2 $ 3,101,777.7 TOTAL 9,067.1 $ 200,998.9 Goal Subject Buildings GSF 1,884,158.1 Goal Subject Buildings GSF 9,187.0 BTU/GSF 100,562 BTU/GSF 986,955.9 Source Energy Savings Credit (BBTU) -13,103.5 Source Energy Savings Credit (BBTU) -742.7 BTU/GSF w/RE Source BTU Credit 91,714 BTU/GSF w/RE Source BTU Credit 906,114.0

E-1
Appendix E - Section 315, P.L. 114-328 (S 2943), the National Defense Authorization Act (NDAA) for FY 2017
Efforts to reduce the high energy costs on military installations
SUMMARY
10 U.S.C. §2911(a) states that the energy policy of the United States “…shall ensure the readiness of the armed forces for their military missions by pursuing energy security and energy resilience.” The two definitions of critical importance to the Department of Defense (DoD) energy policy are outlined in 10 U.S.C. §101(e). First, “…the term ‘energy resilience’ means the ability to avoid, prepare for, minimize, adapt to, and recover from anticipated and unanticipated energy disruptions in order to ensure energy availability and reliability sufficient to provide for mission assurance and readiness, including task critical assets and other mission essential operations related to readiness, and to execute or rapidly reestablish mission essential requirements.” Second, “…the “term ‘energy security’ means having assured access to reliable supplies of energy and the ability to protect and deliver sufficient energy to meet mission essential requirements.”
Outside of DoD, resilience is often defined as the opposite of efficiency; efficiency creates ideal operation within a very narrow scope of conditions, while resilience expands the capability of a system to operate across a variety of conditions, absorb disruptions and adapt to a changing environment. The DoD installation energy enterprise, however, does not exist in an abstract thought experiment; it is a multi-billion dollar enterprise that that must provide power to DoD missions operating out of more than 400 installations around the globe. In this environment, reducing consumption and increasing efficiencies actually contributes to the resilience of system so long as the tactics are employed with consideration toward resilience. DoD is able to balance these simultaneous requirements by leveraging strategies that target specific energy efficiency and consumption reduction measures that support, rather than detract from, the pursuit of energy resilience and energy security.
The remainder of this Summary outlines the Department’s efforts to reduce energy consumption and costs on installations across the enterprise. Following that, Sections (A)-(F) address the specific concerns raised by Congress in Section 315, P.L. 114-328 (S 2943), the National Defense Authorization Act (NDAA) for FY 2017.
Department of Defense (DoD) Energy Costs and Consumption, 1975-2017
Since 1975, on the aggregate, the Department has reduced its energy consumption, increased the efficiency of its energy infrastructure, and decreased the costs of providing power to Department’s Military Components and the Defense Agencies. These efforts continue today with the express purpose of creating an environment where the rising costs of energy and the increasing demand required to meet critical mission requirements do not create a ‘must-pay’ burden that has a negative impact on DoD installations’ ability to enable mission readiness.
In 1975, the federal government’s energy consumption was 1,565,000 Billion Btus (BBtu); DoD accounted for 1,360,200 BBtus (or 86.9 percent) of the total. The total cost of energy consumption for DoD was $11.59 billion, or 83 percent of the federal government’s $13.96 billion total

E-2
consumption bill. By FY 2016, DoD reduced its consumption to 709,200 BBtus, a 47.9 percent reduction in consumption, although its costs rose to $12.56 billion, a 8.4 percent increase.
In 1975, DoD installations accounted for 32.3 percent (439,200 BBtus) of DoD’s total consumption and 36.5 percent of the total cost ($4.23 billion). By FY 2016, DoD installations reduced consumption to 198,031 BBtus, a 54.9 percent reduction, and costs to $3.5 billion, a 17.3 percent reduction. However, due to the rising costs of energy, DoD’s cost per BBtu has risen from $0.96/BBtu to $1.77/BBtu, representing a 83.4 percent increase in per BBtu cost. Figure E-217 below depicts the contrast of decreasing consumption as compared to the increasing cost per BBtu for DoD installations, as well as DoD as a whole.
Table E-3 shows the Department’s decrease in energy consumption per square foot (Energy Intensity); the figure depicts a drop in intensity from 182,153 BBtus/ft 2 in FY 1975 to 97,714 BBtus/ft2 in FY 2017, a 49.7 percent reduction (which parallel’s DoD’s nearly 55 percent reduction in consumption during the same period).
17 Department of Energy (DOE), Federal Facility Reporting and Data, Comprehensive Annual Energy Data and Sustainability Performance, Table A-7: Energy Cost Metrics for Federal Facilities By Agency; found at: http://ctsedwweb.ee.doe.gov/Annual/Report/Report.aspx (accessed on 18 June 2018).
Figure E-1: DoD Consumption and $/MMBtu, 1975-2016

E-3
In FY 2017, the Department spent $3.3 billion on installation (stationary combustion) energy and $178 million on fuels to power its non-tactical vehicle (NTV) fleet for a total of $3.48 billion; the Department consumed a total 207,306 BBtus (198,541 BBtu for buildings and 8,764 BBtu in NTVs). Although FY 2017 saw a 0.3 percent increase from FY 2016, overall, FY 2017 consumption was reflective of a trend of reduction, 54.8 percent less than 1975 consumption levels and the second lowest consumption total during the same period. Beginning in FY 2007, in accordance with the metrics put forth in EISA 2007, the Department has calculated estimated energy and costs savings in comparison to the FY 2005 baselines. Incorporating FY 2017 values, the Department calculates a $5.11 billion savings in installation energy and more than $563 million in savings for NTVs against FY 2005 baselines ($5.67 billion total since FY 2005).
Figure E-3: DoD Cost Avoidance
Figure E-2: DoD Installation Energy Intensity (1975-2017)
E-4
Tools, Techniques, & Procedures to Reduce Cost and Consumption
DoD leverages a variety of strategies that have differing impacts toward reductions, ranging from longer-term sustained, cumulative impacts such as replacing aging equipment with new, more efficient equipment and behavior change campaigns to more aggressive tactics with immediate impacts such as leveraging different, more efficient power generation technologies and sources at more energy intensive installations. For instance, the Energy Independence and Security Act of 2007 (EISA 2007) outlined a variety of statutory requirements to incorporate more efficient technologies and more diverse power sources. In large part due to these requirements, since the passage of EISA 2007, DoD has reduced consumption by 7.6 percent or more than 15,600 BBtu, relative to FY 2005 baselines. The Department leverages three primary, broad tools to accomplish reductions in costs and consumption while still meeting the 10 U.S.C. §2911 energy policy requirement to support mission assurance and readiness: Policy, MILCON Investment, and Non-Federal Investment.
Policy
Policy, regardless of whether it is developed within the Office of the Secretary of Defense (OSD), at the Service-level, or on individual installations, is the most flexible, responsive tool available to shape how the Department uses energy. At the Department-level, DoD has multiple, current policy and guidance documents that address energy use.
DoD Instruction (DoDI) 4170.11, updated on March 16, 2016, “Installation Energy Management”, provides the Department with guidance to reduce energy consumption and further invest in energy reduction measures to leverage our finite energy resources in a manner that make good business sense, but still supports readiness, efforts to realign the Department’s focus on near-peer adversaries, and protection of the homeland. Specifically DoDI 4170.11 sets forth instructions on energy use awareness campaigns; energy and water project development, execution and financing; energy resilience, in accordance FY 2016 changes to Title 10 definitions; efficiency measures; and utilities privatization (UP).
In 2016, OASD(EI&E) also released an Installation Energy Plan memorandum that set forth guidance for installations to implement more structured processes for developing and tracking their respective energy plans. This memorandum was updated on May 30, 2018 to includes an expanded requirement to include all DoD installations; clarifies energy resilience requirements; clarifies cybersecurity requirements; and outlines an implementation framework for installations to complete their IEP based on the Deputy Assistant Secretary of Defense, Defense Continuity and Mission Assurance (DASD(DC&MA)) priority installations.
On March 17, 2017, the Department released guidance that specifically targets how installations maintain their energy infrastructure to ensure systems are operating effectively and supporting resilience. “Energy Resilience: Operations, Maintenance, & Testing (OM&T) Strategy and Implementation Guidance” was developed to assist installation commanders, mission owners, operations and maintenance staff, utility managers, energy managers, and other installation support personnel on DoD installations and at facilities to collaborate and ensure appropriate OM&T. The safety and reliability of an installation’s power system largely depends on its OM&T strategy and effective OM&T programs can save between 5 and 20 percent on utility bills without the need for significant capital investment, while simultaneously costing approximately 20 times less than

E-5
retrofits.18 More important, an effective OM&T program quantifies and mitigates risks in the power systems that could negatively impact mission readiness.
In addition to energy specific guidance, the Department also leverages a variety of other policies and guidance documents to inform operations that contribute to reducing the costs, particularly at those installations with higher energy requirements and/or in areas with higher utility costs. The Unified Facilities Criteria (UFC), developed internally by relevant stakeholders such as the Army Corps of Engineers, Naval Facilities Engineering Command, and Air Force Civil Engineering Center, provide planning, design, construction, sustainment, restoration, and modernization criteria that apply to DoD-owned and operated infrastructure (as well as infrastructure operating on DoD installations). Similar to the OM&T guidance referenced earlier, the UFC set forth practices that, in addition to providing for safety and security, encourage efficiencies that ultimately reduce the costs shouldered by installations to develop, operate, and maintain energy infrastructure, whether those operations are handled by the installation or a third-party stakeholder (e.g., local utility in a UP contract).
Installations also leverage applicable cyber security and mission assurance-related policy and guidance, such as DoD Directive (DoDD) 3020.40, Mission Assurance, DoDI 3020.45, Mission Assurance Construct, and OASD(EI&E) memorandum “Managing Cyber Risks to Facility-Related Control Systems” (dated March 31, 2016) to address the readiness and security of energy infrastructure at their respective installations. While cyber security and mission assurance policy may not, at first, seem to have practical application toward reducing the costs of operating and maintaining energy infrastructure, the unavoidable truth is that disruptions, whether caused by maintenance deficiencies or intentional attack by adversaries, are rarely characterized by low-cost impacts. A short duration disruption at a single installation can easily result in several thousands of dollars costs to repair faulty equipment or remove vegetation and larger disruptions that impact entire states and regions can result in multi-billion dollar impacts. The blackout that affected the Northeast and Southern Canada in 2003 cut power to more than 50,000,000 customers, caused a loss of 70,000 MW, cost between $4-10 billion, and is believed to have contributed to 11 deaths.
MILCON Investment
While the Department can use Congressional-appropriated Military Construction (MILCON) funds in multiple ways to develop and construct infrastructure that has a positive impact on the energy costs borne by fixed installations, the most flexible and frequently-used method employed by DoD is the “Energy Resiliency and Conservation Investment Program” (ERCIP). ERCIP has traditionally been used by installations to fund small projects that are forecast to provide substantial payback in reduced energy costs. ERCIP has grown from a $35 million program started in FY 2008 to address only energy conservation programs to a $150 million program that is now primarily intended to fund energy projects that can improve energy resilience, availability, reliability, and economic performance. The Department gives priority to projects to fund based on the criteria listed below. To be labeled as a priority, a project must:
18 Sullivan G, R Pugh, AP Melendez, and WD Hunt. 2010. Operations & Maintenance Best Practices – A Guide to Achieving Operational Efficiency (Release 3). PNNL-19634, Pacific Northwest National Laboratory, Richland, WA.
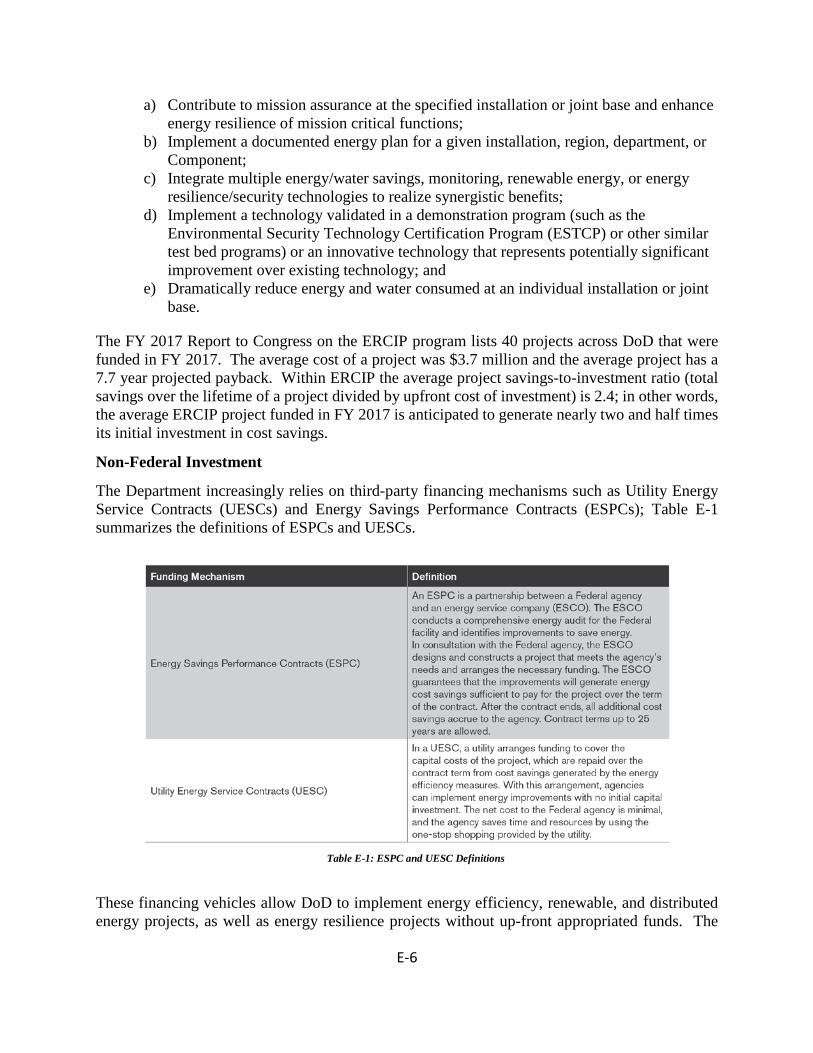
E-6
a) Contribute to mission assurance at the specified installation or joint base and enhance energy resilience of mission critical functions;
b) Implement a documented energy plan for a given installation, region, department, or Component;
c) Integrate multiple energy/water savings, monitoring, renewable energy, or energy resilience/security technologies to realize synergistic benefits;
d) Implement a technology validated in a demonstration program (such as the Environmental Security Technology Certification Program (ESTCP) or other similar test bed programs) or an innovative technology that represents potentially significant improvement over existing technology; and
e) Dramatically reduce energy and water consumed at an individual installation or joint base.
The FY 2017 Report to Congress on the ERCIP program lists 40 projects across DoD that were funded in FY 2017. The average cost of a project was $3.7 million and the average project has a 7.7 year projected payback. Within ERCIP the average project savings-to-investment ratio (total savings over the lifetime of a project divided by upfront cost of investment) is 2.4; in other words, the average ERCIP project funded in FY 2017 is anticipated to generate nearly two and half times its initial investment in cost savings.
Non-Federal Investment
The Department increasingly relies on third-party financing mechanisms such as Utility Energy Service Contracts (UESCs) and Energy Savings Performance Contracts (ESPCs); Table E-1 summarizes the definitions of ESPCs and UESCs.
These financing vehicles allow DoD to implement energy efficiency, renewable, and distributed energy projects, as well as energy resilience projects without up-front appropriated funds. The
Table E-1: ESPC and UESC Definitions
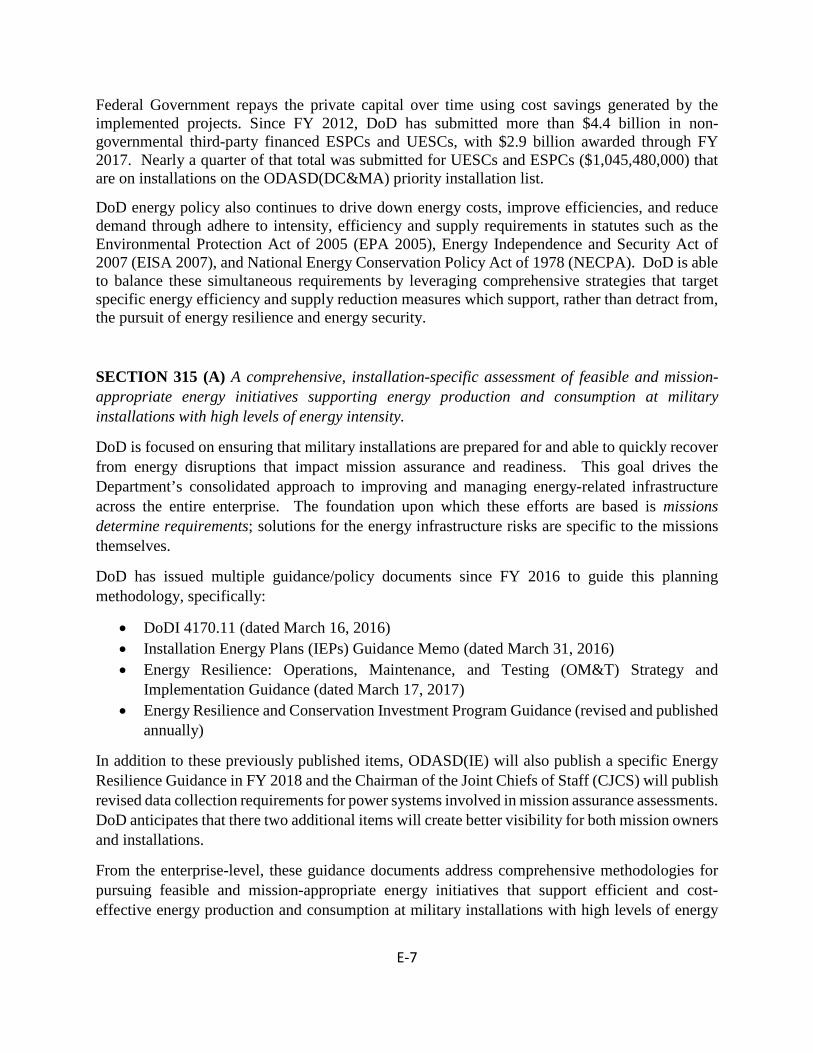
E-7
Federal Government repays the private capital over time using cost savings generated by the implemented projects. Since FY 2012, DoD has submitted more than $4.4 billion in non-governmental third-party financed ESPCs and UESCs, with $2.9 billion awarded through FY 2017. Nearly a quarter of that total was submitted for UESCs and ESPCs ($1,045,480,000) that are on installations on the ODASD(DC&MA) priority installation list.
DoD energy policy also continues to drive down energy costs, improve efficiencies, and reduce demand through adhere to intensity, efficiency and supply requirements in statutes such as the Environmental Protection Act of 2005 (EPA 2005), Energy Independence and Security Act of 2007 (EISA 2007), and National Energy Conservation Policy Act of 1978 (NECPA). DoD is able to balance these simultaneous requirements by leveraging comprehensive strategies that target specific energy efficiency and supply reduction measures which support, rather than detract from, the pursuit of energy resilience and energy security.
SECTION 315 (A) A comprehensive, installation-specific assessment of feasible and mission-appropriate energy initiatives supporting energy production and consumption at military installations with high levels of energy intensity.
DoD is focused on ensuring that military installations are prepared for and able to quickly recover from energy disruptions that impact mission assurance and readiness. This goal drives the Department’s consolidated approach to improving and managing energy-related infrastructure across the entire enterprise. The foundation upon which these efforts are based is missions determine requirements; solutions for the energy infrastructure risks are specific to the missions themselves.
DoD has issued multiple guidance/policy documents since FY 2016 to guide this planning methodology, specifically:
• DoDI 4170.11 (dated March 16, 2016) • Installation Energy Plans (IEPs) Guidance Memo (dated March 31, 2016) • Energy Resilience: Operations, Maintenance, and Testing (OM&T) Strategy and
Implementation Guidance (dated March 17, 2017) • Energy Resilience and Conservation Investment Program Guidance (revised and published
annually)
In addition to these previously published items, ODASD(IE) will also publish a specific Energy Resilience Guidance in FY 2018 and the Chairman of the Joint Chiefs of Staff (CJCS) will publish revised data collection requirements for power systems involved in mission assurance assessments. DoD anticipates that there two additional items will create better visibility for both mission owners and installations.
From the enterprise-level, these guidance documents address comprehensive methodologies for pursuing feasible and mission-appropriate energy initiatives that support efficient and cost-effective energy production and consumption at military installations with high levels of energy

E-8
intensity. The Military Departments are then able to leverage these policies to pursue tailored efforts specific to their requirements at the Service, regional, and installation levels.
To measure implementation, ODASD(IE) has initiated a series of on-site, installation-specific assessments that review the current status of infrastructure. The lessons learned in these site-specific assessments will be used to identify practices that apply across the entire enterprise, facilitate improvements, and decrease the burden of conducting assessments at all of DoD’s more than 400 installations.
The list below outlines the methodology that was used to determine the initial assessment locations:
1. First, the top 20 percent of installations from each Service, based on intensity, were designated.
2. Next, installations not in the U.S. were withdrawn from consideration due to the limited control DoD has to influence infrastructure investment decisions at foreign locations.
3. Then all installations with annual energy costs below $2 million were removed from consideration.
4. Last, the list was consolidated with a list of installations that were previously identified by either the Services or OSD as priority installations.
Table E-1 demonstrates the values that resulted from each stage of the methodology; Table E-2 lists the final list of installations that resulted from consolidation with the critical installations the Services identified for assessment.
USA USAF USN USMC TOTAL All Installations 156 184 70 28 425 Top 20% Consumption 29 37 14 6 85
Installations in CONUS 17 22 4 4 45
In CONUS, >$2M+ 4 21 2 2 21
Table E-2: Determination of Initial Assessment Locations (w/out Services’ Critical Installation Input)
Installation State Fort Greely Alaska Joint Base Pearl Harbor-Hickam Hawaii Naval Submarine Base Kings Bay Georgia Fort Stewart Georgia Vandenberg AFB California
Table E-3: Final Installation Assessment Locations
In addition, ODASD(IE) is leveraging information from critical mission energy resilience site assessments conducted by ODASE(IE), the Navy, and the Air Force. The primary lesson evident from these assessments is that stakeholders lack a fundamental awareness about what energy
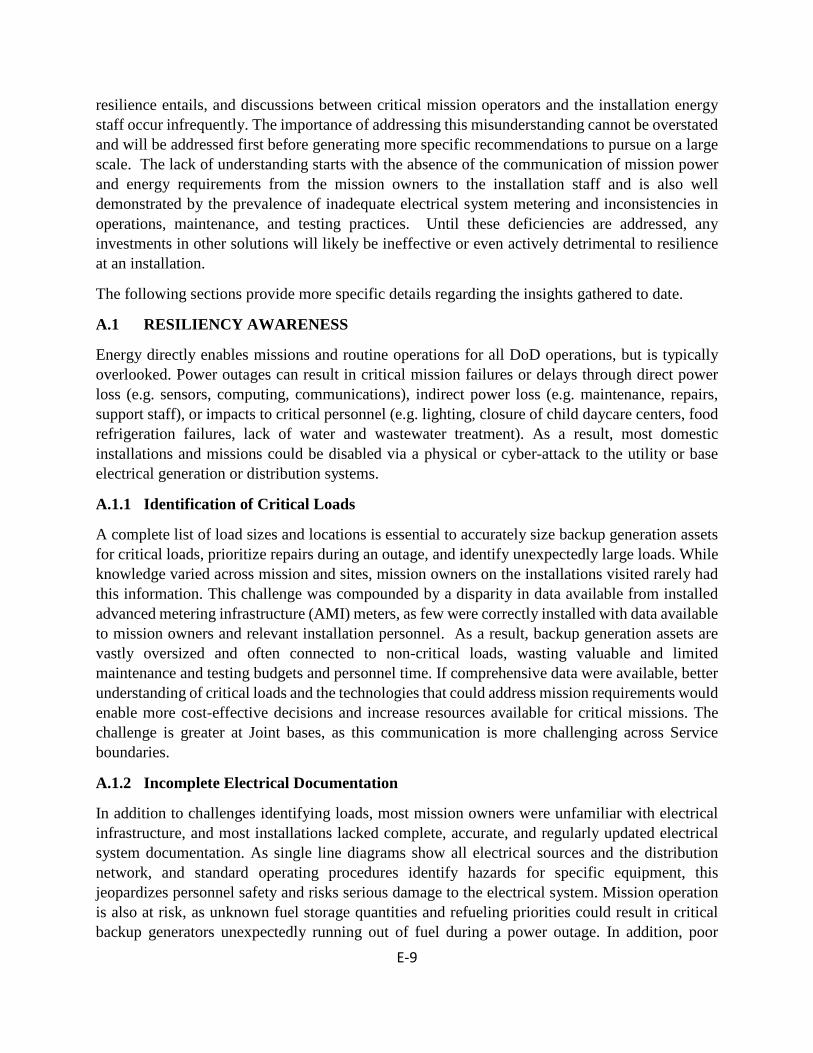
E-9
resilience entails, and discussions between critical mission operators and the installation energy staff occur infrequently. The importance of addressing this misunderstanding cannot be overstated and will be addressed first before generating more specific recommendations to pursue on a large scale. The lack of understanding starts with the absence of the communication of mission power and energy requirements from the mission owners to the installation staff and is also well demonstrated by the prevalence of inadequate electrical system metering and inconsistencies in operations, maintenance, and testing practices. Until these deficiencies are addressed, any investments in other solutions will likely be ineffective or even actively detrimental to resilience at an installation.
The following sections provide more specific details regarding the insights gathered to date.
A.1 RESILIENCY AWARENESS
Energy directly enables missions and routine operations for all DoD operations, but is typically overlooked. Power outages can result in critical mission failures or delays through direct power loss (e.g. sensors, computing, communications), indirect power loss (e.g. maintenance, repairs, support staff), or impacts to critical personnel (e.g. lighting, closure of child daycare centers, food refrigeration failures, lack of water and wastewater treatment). As a result, most domestic installations and missions could be disabled via a physical or cyber-attack to the utility or base electrical generation or distribution systems.
A.1.1 Identification of Critical Loads
A complete list of load sizes and locations is essential to accurately size backup generation assets for critical loads, prioritize repairs during an outage, and identify unexpectedly large loads. While knowledge varied across mission and sites, mission owners on the installations visited rarely had this information. This challenge was compounded by a disparity in data available from installed advanced metering infrastructure (AMI) meters, as few were correctly installed with data available to mission owners and relevant installation personnel. As a result, backup generation assets are vastly oversized and often connected to non-critical loads, wasting valuable and limited maintenance and testing budgets and personnel time. If comprehensive data were available, better understanding of critical loads and the technologies that could address mission requirements would enable more cost-effective decisions and increase resources available for critical missions. The challenge is greater at Joint bases, as this communication is more challenging across Service boundaries.
A.1.2 Incomplete Electrical Documentation
In addition to challenges identifying loads, most mission owners were unfamiliar with electrical infrastructure, and most installations lacked complete, accurate, and regularly updated electrical system documentation. As single line diagrams show all electrical sources and the distribution network, and standard operating procedures identify hazards for specific equipment, this jeopardizes personnel safety and risks serious damage to the electrical system. Mission operation is also at risk, as unknown fuel storage quantities and refueling priorities could result in critical backup generators unexpectedly running out of fuel during a power outage. In addition, poor

E-10
documentation frequently results in deferred maintenance resulting from miscommunications within installation personnel or between the installation and the utility provider. Updates to this documentation must be done immediately to avoid serious delays to critical missions, and hazardous working conditions that could lead to serious injury or death.
A.2 RESILIENCY MAINTENANCE AND TESTING FOR POWER OUTAGES
Identifying and documenting loads, generation assets, and infrastructure must be completed in order to properly assess an installation’s current resilience capabilities. Installations must then maintain assets and routinely and rigorously test their entire backup power systems under relevant conditions to ensure that everything will function as expected during a power outage. At most sites visited however, maintenance personnel were short-staffed and insufficiently funded (partly due to budgets based on outdated and incomplete documentation). The majority of backup generation units were oversized requiring additional maintenance and repair, and the large number of unnecessary generators serving non-critical loads often resulted in widespread deferment of testing and maintenance. In some cases, the lack of generator prioritization resulted in non-critical generators receiving maintenance, while critical generators were neglected for months or years.
When generators are tested, it is extremely rare for the testing to accurately assess readiness and is often counterproductive. While this varies between the Services, a common testing procedure found during assessments consisted of starting the generators without load and then idling them for 10-30 minutes before shut down. These tests do not provide any information into the ability of the system to automatically black start the generators, the status of the transfer switches, or the capacity to distribute power to loads. Furthermore, this type of testing results in wet stacking19, increasing the risk that generators will fail during outage events.
At sites that require black start generator testing, it was not uncommon to find the requirement ignored by mission owners due to short-sighted assumptions about risk to mission with a full system test. When mission owners/back up power system operators choose to forgo system assessments during normal grid operations, failures and deficiencies in the systems will likely not be detected until a real, unplanned disruption occurs. Until this mindset is changed, these missions will be unprepared for power disruptions that can easily degrade and/or eliminate critical capabilities.
19 Wet stacking refers to a condition in diesel engines when unburned fuel passes into and collects in the exhaust system. This can result in fouled injectors and a buildup of carbon on exhaust values, turbo chargers, and exhaust, leading to a loss in engine performance. While the impacts are often negligible over the short term, over the long term the deposits can scar and erode critical engine surfaces, leading to severe degradation of load capacity.

E-11
SECTION 315 (B) An assessment of current sources of energy in areas with high energy costs and potential future sources that are technologically feasible, cost-effective, and mission appropriate for military installations.
As discussed in Section 315(A), missions determine requirements and the solutions for the energy infrastructure risks are specific to the missions supported by the infrastructure. In this construct, the Department, from the enterprise to the installation level, continually evaluates what technologies are available and applicable to address the scope of missions that are assigned to DoD operational forces.
A wide variety of energy technologies have the potential to provide resilient backup or prime energy generation. These range from small backup generation units to microgrids, large scale solar photovoltaic arrays, energy storage systems, and co-generation plants. However, implementing solutions that actually meet mission requirements is not as simple as choosing the latest efficient technology. Unfortunately, in the present environment, the typical energy posture often favors the newest, largest technologies available and fails to recognize the necessity of both properly sizing assets to requirements and accounting for maintenance and testing. In addition, as complexity increases and technologies are less established, repairs become more specialized, expensive, and time intensive. Installation personnel and local contracting companies must have the requisite knowledge and parts to repair any power system deployed to support critical missions, especially for remote installations.
In FY 2018 DoD will release a comprehensive resilience strategy that includes modeling capabilities that the Services can leverage to determine the best fit for their mission specific requirements. The modeling capability, called the Energy Resilience Assessment (ERA) Tool, uses industry-standard analytical methodologies to assess potential energy infrastructure architectures at installations. The output of the assessment provides decision makers with specific recommendations for each installation ranked by cost and impact on resilience.
The following sections provide a brief overview of the various solutions that are either already implemented or are under consideration at installations across DoD.
B.1 Backup Generators
Diesel generators dominate backup power needs across all installations and can provide a reliable power source if sufficiently maintained and fueled. Uninterruptable power supplies are also commonly used to bridge the generator startup time for critical loads that cannot experience brief power outages. Many installations would both increase resiliency and save costs by removing generators connected to non-critical loads, clustering critical loads to consolidate generation when oversized units have been installed, and performing adequate testing as described above.
B.2 Microgrids
Once the fundamental resilience baseline previously described is implemented, other energy technologies enabled by a microgrid can be considered to further increase resilience (and in some cases, reduce expenses). Microgrids allow multiple power sources to be connected through the

E-12
power distribution system, while allowing the installation to isolate, or island, its power system. Depending on the microgrid architecture, they can also maintain power with outages at one or more power sources, assuming functional capacity is still sufficient, or loads are appropriately prioritized. They can also save fuel by only running the generation assets required to meet the current or expected loads, though this functionality requires an understanding of installations loads and some advanced planning for large load swings. There are a few examples of long-established and successful microgrids at DoD installations (NBGTS Finegayan, Guam; the Marine Corps Air and Ground Combat Center (MCAGCC) Twentynine Palms, CA), however cooperation with local utilities, customized engineering to match operation requirements, and large capital investments are required.
B.3 Distributed Power Generation and Energy Storage
Installations in locations with significant solar or wind resources can consider adding renewable energy sources that should operate in an islandable mode when the main utility grid has failed to reduce fuel consumption. Well located solar photovoltaic (PV) arrays or wind farms in combination with an islandable inverter can produce significant power without requiring a fuel supply chain. As solar and wind power is intermittent, however, significant penetration of renewable power typically requires large energy storage systems. While energy storage can increase grid reliability and smooth power fluctuations, round trip efficiency will increase total energy used on site and add capital and maintenance expenses. However, much of the existing deployed solar PV is installed without islanding capability, preventing use as a backup generation asset.
B.4 Prime Power Generation and Natural Gas
Prime power co-generation plants can provide much or all of an installations’ electricity requirements. These plants may be cost effective where natural gas prices are low and grid power prices are high, but will incur a significant capital expense and require a designated staff to operate and maintain them. When an integrated natural gas pipeline is available, multi-fueled backup generators should also be considered. This will not only minimize the on-base main fuel storage requirement, but also enable the installation to continue operations in the event of an extended outage that has disrupted the external liquid fuel supply chain.
B.5 Developing Technologies
Other new energy technologies (e.g. fuel cells, flywheels, advanced microgrids, etc.) may have a significant future impact for energy resilience. While DoD funding should continue to be allocated for research and development, these systems must be thoroughly tested at designated testbeds before wide scale integration. Premature rollout is extremely expensive and resource intensive and is likely to fail quickly, increasing the possibility of residual damage to the installation and power distribution system.
Recently small and very small modular nuclear reactors (SMRs and vSMRs, respectively) have received substantial attention from both industry and government stakeholders. This technology is still very early in development and DoD will continue to monitor its progress. Like with many
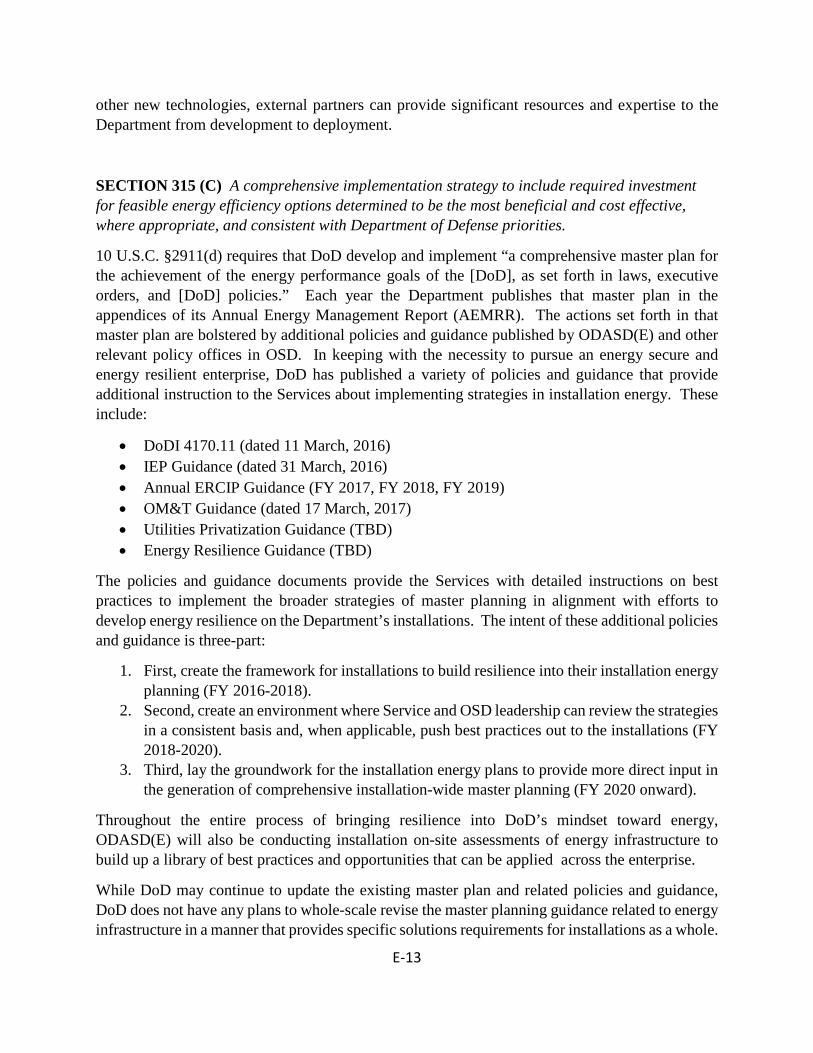
E-13
other new technologies, external partners can provide significant resources and expertise to the Department from development to deployment.
SECTION 315 (C) A comprehensive implementation strategy to include required investment for feasible energy efficiency options determined to be the most beneficial and cost effective, where appropriate, and consistent with Department of Defense priorities.
10 U.S.C. §2911(d) requires that DoD develop and implement “a comprehensive master plan for the achievement of the energy performance goals of the [DoD], as set forth in laws, executive orders, and [DoD] policies.” Each year the Department publishes that master plan in the appendices of its Annual Energy Management Report (AEMRR). The actions set forth in that master plan are bolstered by additional policies and guidance published by ODASD(E) and other relevant policy offices in OSD. In keeping with the necessity to pursue an energy secure and energy resilient enterprise, DoD has published a variety of policies and guidance that provide additional instruction to the Services about implementing strategies in installation energy. These include:
• DoDI 4170.11 (dated 11 March, 2016) • IEP Guidance (dated 31 March, 2016) • Annual ERCIP Guidance (FY 2017, FY 2018, FY 2019) • OM&T Guidance (dated 17 March, 2017) • Utilities Privatization Guidance (TBD) • Energy Resilience Guidance (TBD)
The policies and guidance documents provide the Services with detailed instructions on best practices to implement the broader strategies of master planning in alignment with efforts to develop energy resilience on the Department’s installations. The intent of these additional policies and guidance is three-part:
1. First, create the framework for installations to build resilience into their installation energy planning (FY 2016-2018).
2. Second, create an environment where Service and OSD leadership can review the strategies in a consistent basis and, when applicable, push best practices out to the installations (FY 2018-2020).
3. Third, lay the groundwork for the installation energy plans to provide more direct input in the generation of comprehensive installation-wide master planning (FY 2020 onward).
Throughout the entire process of bringing resilience into DoD’s mindset toward energy, ODASD(E) will also be conducting installation on-site assessments of energy infrastructure to build up a library of best practices and opportunities that can be applied across the enterprise.
While DoD may continue to update the existing master plan and related policies and guidance, DoD does not have any plans to whole-scale revise the master planning guidance related to energy infrastructure in a manner that provides specific solutions requirements for installations as a whole.

E-14
This aligns to DoD policy stating that resilience solutions are specific to the mission requirements and that each installation (or regional command) must work directly with mission, capability, and asset owners to build out solutions that are tailored to the specific requirements of the relevant mission(s).
SECTION 315 (D) An explanation of how military services are working collaboratively in order to leverage lessons learned on potential energy efficiency solutions.
OSD typically provides overall guidance and direction, while allowing individual Services the flexibility to implement the requirements in a manner best tailored to individual missions and environments. The current structure within the Department facilitates broad communication and cooperation between the Services on energy infrastructure efficiency solutions.
At the Department-level, DoD has issued multiple policies and guidance that create a structure for the Services to communicate and cooperate with a shared understanding of the Department’s intent and vision. These references are listed throughout this document, but include, DoDI 4170.11, as well as the Installation Energy Plan, annual ERCIP guidance, OM&T, and Energy Resilience Guidance documents. In addition to creating a shared language amongst the Services, the Department also encourages cooperation between the Services by instituting Department-wide Working Groups that bring together key stakeholders to disseminate information and elicit input to on-going efforts. With regards to energy resilience and installation energy infrastructure, OSD currently manages the following working groups: Energy Resilience, Cybersecurity, Utilities Privatization, Energy Efficiency, and Distributed Energy.
Lastly, DoD is a substantial stakeholder in DOE’s Federal Energy Management Program (FEMP) annual federal government-wide educational activities such as the Federal Utility Partnerships Working Group (FUPWG) and Energy Exchange. These activities allow the Services to share best practices both within the Department and across the federal space (or, in the case of FUPWG, industry).
SECTION 315 (E) An assessment of the extent to which activities administered under the Federal Energy Management Program (FEMP) could be used to assist with the implementation strategy.
The Department has an energy focus that differs in many respects than other federal agencies due to the zero-sum nature of linking mission success to energy resilience measurements. To a greater extent than many other agencies, there is little room for error in the execution of DoD missions and, as such, DoD’s view of and operations regarding energy occur within a more binary context that is not relevant to other departments (as well as the energy industry as a whole).
The primary benefit to DoD achieved through cooperation with FEMP rests primarily in FEMP’s capabilities to provide training on issues related to energy across the entire energy infrastructure domain for the OSD and Service-level staff. This training occurs at annual conferences hosted by
E-15
FEMP (FUPWG and Energy Exchange), as well as via FEMP’s hosted online training courses for ESPCs and UESCs. DoD will continue to leverage these training opportunities and resources hosted by FEMP as the Department works to support mission assurance within in its energy enterprise.
SECTION 315 (F) An assessment of state and local partnership opportunities that could achieve efficiency and cost savings, and any legislative authorities required to carry out such partnerships or agreements.
At present DoD communicates and coordinates with States and local governments, as well as utilities stakeholders, via two distinct channels. At the strategic level, the Department aligns its communications and cooperation through the Mission Assurance (MA) community. DoD’s coordinated communications route through DOE, who serves as the primary, although not the only, conduit for communicating with other government organizations at the federal, state, and local levels. Often DHS is also involved in DoD’s communications and partnerships via its Critical Infrastructure Partnership Advisory Council (CIPAC) and the coordinating councils/sub-sector councils nestled below it. These are the Energy Governing Coordinating Council and its Subsector Councils, the Electric Sub-Sector Coordinating Council (ESCC) and the Oil and Natural Gas Subsector Coordinating Council (ONGSCC). It is at the Subsector Coordinating Councils that DoD communicates and coordinates with both state and industry executive level stakeholders.
At the regional and installation levels, coordination occurs in a much more dispersed fashion with installations and regional DoD stakeholders serving as the primary communicators. At these levels, installation and regional command stakeholders coordinate directly with state and local governments, as well as the utilities and similar-level energy industry representatives, concerning issues pertaining to matters at that level.
F-1
Appendix F - Senate Report 115-125, to accompany S 1519, the NDAA for FY 2018
Energy Assurance on Military Installations, page 106
In order to assess the current statutory authorities and their appropriateness and flexibility to support energy resilience on military installations, the Secretary of Defense is directed to report to the defense committees within 180 days of enactment of this Act the following: (1) authorities used in award of energy resilience projects during fiscal years 2015-2017 and (2) challenges experienced during fiscal years 2015-2017 in the execution of energy resilience projects due to limitations in existing statutory authorities.
The Energy Resilience and Conservation Investment Program (ERCIP), previously known as the Energy Conservation Investment Program (ECIP), is the only current authority granted to the Secretary of Defense (OSD) for the specific purpose of awarding energy resilience projects. This authority was originally established by the Department of Defense (DoD) in 1976 at the recommendation of the DoD Energy Task Group. The National Defense Authorization Act (NDAA) of 1990 and 1991 formalized energy conservation construction projects under 10 U.S.C. 2865 Energy savings at military installations, paragraph (e), and the NDAA of 2007 created 10 U.S.C. 2914, energy conservation construction projects. The NDAA of 2017 added language to specifically include energy resiliency and energy security as projects that can be executed under 10 U.S.C. § 2914, Energy resiliency and conservation construction projects, in addition to energy conservation projects. DoD revised the name of the program to align with the new language. ERCIP is funded through the Military Construction (MILCON) appropriations process and is centrally managed by the Office of the Deputy Assistant Secretary of Defense for Sustainment, Energy (ODASD(E)).
ERCIP pays for energy resiliency, energy security, or energy conservation projects that are mutually complimentary, to construct new high-efficiency energy systems, or improve and modernize existing ones. The program is managed to maximize the energy benefit to DoD installations by minimizing energy consumption and improving energy resilience of critical energy systems and infrastructure.
Departmental guidance and a rigorous review process direct funding to projects that save energy, reduce DoD's energy costs, improve energy resilience and contribute to mission assurance. The program has implemented energy and water efficiency projects that have assisted with meeting legislated energy conservation targets while providing a significant return-on-investment of more than $2 for every dollar invested (since 2001). The ERCIP has grown to $165M in FY 2018 and the current emphasis on improving energy resilience, saving energy, reducing DoD's energy costs, and contributing to mission assurance together with the competitive nature of the application process should ensure ERCIP project selection is consistent with DoD’s strategic goals. Outside of the inherent challenges of balancing priorities within the necessary constraints of the federal budget environment, a challenge shared by organizations across the federal

F-2
government, DoD has no specific lessons learned to communicate with Congress regarding the ERCIP program.
At present DoD is reviewing the applicable statutes and authorities, recent academic and technical reports, and information from other federal agencies and the energy industry in order to determine the most effective methods for measuring the current status of resilience in the Department’s energy infrastructure. This effort includes an aggressive schedule of rigorous on-site assessments at multiple installations that host defense critical infrastructure and forces conducting strategic missions. The outputs from this effort will inform a solid understanding of the best courses of action available to the Department to continue increasing resilience and put DoD in position to provide Congress with more detailed suggestions to add to or improve authorities pertaining to energy resilience.
Energy Savings Performance Contracts Assessment, page 107
The committee directs the Secretary of Defense to provide an assessment to the congressional defense committees no later than 90 days after the date of enactment of this Act. The assessment shall include but not limited to: (1) recommendations on the use of energy savings performance contracts (ESPCs) for savings achieved through training improvements; (2) identification of potential savings that could be achieved through improvements to training; (3) pros and cons of using those savings as part of a long term ESPC; (4) any new authorities that would be needed if a decision was made to use savings as part of additional ESPC; and (5) any other recommendations deemed appropriate.
As the Department understands this reporting requirement, the requirement's primary assumption is that improvements to training for energy service performance contracts (ESPC) will result in behavior change that contributes to an increase in energy savings. Those savings would then be leveraged and used in additional ESPCs. While it may indeed be possible to generate additional savings from training improvements, the Department does not believe that it can commit to and/or predict good behavior with sufficient enough guarantees to be an effective tool in negotiating future contracts with energy savings companies (ESCOs). DoD believes that the financial risk is too high to implement these training improvements based on assumptions about future savings and therefore will not commit limited resources to an assessment that would draw from efforts focused on energy resilience and mission assurance.
G-1
Appendix G - House Report 115-200, to accompany HR 2810, the NDAA for FY 2018
Energy Resilience of Overseas Military Installations, page 92
The “committee directs the Secretary of Defense to provide a briefing to the House Committee on Armed Services by March 1, 2018, on potential vulnerabilities to energy supply disruptions at overseas locations that host permanent and rotational U.S. Armed Forces and on mitigation efforts aimed at protecting mission resiliency. The briefing must, at a minimum, assess the operational risk of energy supply disruptions, identify mitigation measures to sustain mission-critical operations, and assess the feasibility and cost and schedule impactes including diversified energy solutions for future overseas military construction projects.”
As defined in 10 U.S.C §101(e)(6), energy resilience directly supports mission assurance and readiness. Energy resilience at DoD installations, whether home or abroad, results from an iterative evaluation, planning and implementation cycle in which mission owners conduct the risk analysis and specify the requirement(s), infrastructure stakeholders solve for the specified requirements, and the process repeats itself as needed to meet changing mission parameters. In this construct, the solutions are unique to the specific mission and its risks as defined by the mission owners.
Energy resilience is achieved in a variety of ways, including redundant power supplies (generators); integrated or distributed fossil, alternative, or renewable energy technologies; microgrid applications including storage; diversified or alternate fuel supplies; upgrading, replacing, operating, maintaining, or testing current energy generation systems, infrastructure, and equipment; as well as mission alternative such as reconstitution or mission-to-mission redundancy. DoD is agnostic toward any specific technologies and practices that are employed to achieve resilience. Ultimately, energy resilience is a binary measure; either missions have the energy that is required, when and where it is needed, or they don’t.
As part of its energy resilience strategy, DoD pursued changes to policies and guidance related to energy infrastructure. In addition to the updates to Department of Defense Instruction (DoDI) 4170.11, “Installation Energy Management” in FY 2016, the Department updated Department of Defense Directive (DoDD) 4180.01, DoD Energy Policy and published the “Energy Resilience: Operations, Maintenance, & Training (OM&T) Strategy and Implementation Guidance” in FY 2017. The latter guidance outlines a comprehensive strategy to replace or improve emergency power generation readiness, reduce system maintenance, and improve fuel flexibility to ensure the sustainability of all Department emergency power generation systems in operation. Further, DoD has incorporated resilience in its annual update of the primary federal investment program specific to energy infrastructure, the Energy Resilience and Conservation Investment Program (ERCIP).
On May 30, 2018, DoD released a memo to update the March 31, 2016 OASD(EI&E) memorandum “Installation Energy Plans (IEPs)”. This update clarifies and provides further direction to installations with regards to energy resilience and cybersecurity. Chief among the

G-2
updates are requirements that: (1) by the end of FY 2019 all installations identified Deputy Assistance Secretary of Defense for Defense Continuity and Mission Assurance as priority installations will complete IEPs; (2) by the end of FY 2020, all installations that constitute 75% of each Component’s consumption will complete updated IEPs; and (3) by the end of FY 2021, IEPs will be completed for all installations not included in the previous categories. These IEPs provide Components with the opportunity to present their installation-specific long-range plans for energy resilience.
DoD relies on commercial power to conduct missions from its installations. Commercial power supplies can be threatened by a variety of events ranging from natural hazards to physical attacks on infrastructure and cyber-attacks on networks. DoD recognizes that such events could result in power outages affecting critical DoD missions involving power projection, defense of the homeland, and/or operations conducted at installations that are directly supporting warfighting missions overseas. Therefore, installation commanders must understand and address the vulnerabilities and risk of power disruptions that can impact mission assurance20.
Overseas locations that host permanent and rotational U.S. Armed Forces can face heightened risks associated the supply of energy. These risks are primarily centered on the fact that U.S. Armed Forces generally have even less control than their counterparts in CONUS over the energy supply infrastructure outside the perimeter of their respective locations and, in general, are more proximate to threats and risks. The energy infrastructure outside installations is developed, built and maintained by host nation governments and commercial stakeholders. The agreements regarding how U.S. Armed Forces receive energy supplies and the respective costs are developed in negotiations between the Department of State (DoS) and the respective host nations. DoD, along with other applicable U.S. Government stakeholders, can only advise DoS on existing risks and suggested changes to mitigate these risks in future negotiations.
However, inside the perimeter of U.S. Armed Forces’ installation overseas, DoD has greater opportunities to assess and implement solutions for risks to its supply of energy. From a broader mission assurance perspective, in accordance with DoD Directives (DoDDs) 5111.1 and 3020.40, DoD has established and maintains robust mission assurance activities that continuously identify, assess, manage, and monitor the risks to DoD’s strategic missions. These activities are managed by the Under Secretary of Defense for Policy (USD(P)) in conjunction with the Chairman of the Joint Chiefs of Staff (CJCS) and they leverage direct input from stakeholders across the Department, ranging from Military Services Secretaries to Combatant Commands to offices throughout OSD. From an installation energy perspective, ODASD(E), the Services, and installation stakeholders leverage the iterative process outlined previously to obtain input from USD(P) and CJCS via the formal Joint Mission Assurance Assessment (JMAA) process and to craft solutions accordingly.
20 DoD publishes the status of its energy resilience program at the following: http://www.acq.osd.mil/eie/IE/FEP_Energy_Resilience.html.
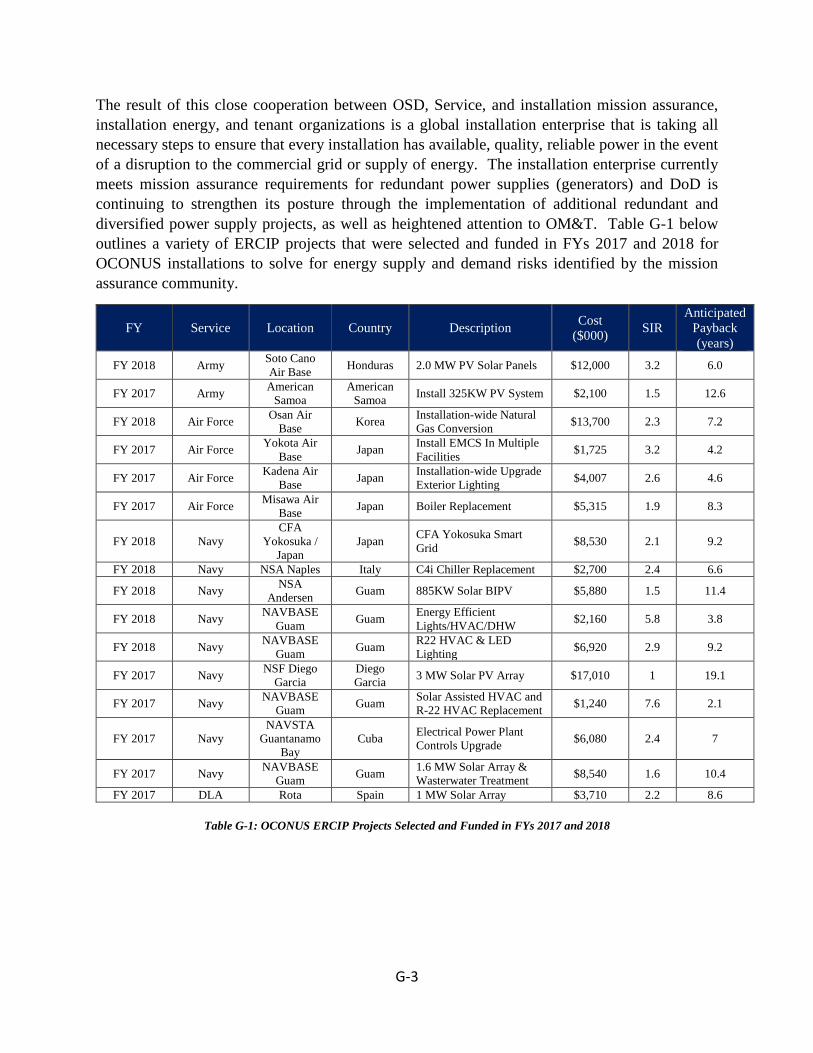
G-3
The result of this close cooperation between OSD, Service, and installation mission assurance, installation energy, and tenant organizations is a global installation enterprise that is taking all necessary steps to ensure that every installation has available, quality, reliable power in the event of a disruption to the commercial grid or supply of energy. The installation enterprise currently meets mission assurance requirements for redundant power supplies (generators) and DoD is continuing to strengthen its posture through the implementation of additional redundant and diversified power supply projects, as well as heightened attention to OM&T. Table G-1 below outlines a variety of ERCIP projects that were selected and funded in FYs 2017 and 2018 for OCONUS installations to solve for energy supply and demand risks identified by the mission assurance community.
FY Service Location Country Description Cost ($000) SIR
Anticipated Payback (years)
FY 2018 Army Soto Cano Air Base Honduras 2.0 MW PV Solar Panels $12,000 3.2 6.0
FY 2017 Army American Samoa
American Samoa Install 325KW PV System $2,100 1.5 12.6
FY 2018 Air Force Osan Air Base Korea Installation-wide Natural
Gas Conversion $13,700 2.3 7.2
FY 2017 Air Force Yokota Air Base Japan Install EMCS In Multiple
Facilities $1,725 3.2 4.2
FY 2017 Air Force Kadena Air Base Japan Installation-wide Upgrade
Exterior Lighting $4,007 2.6 4.6
FY 2017 Air Force Misawa Air Base Japan Boiler Replacement $5,315 1.9 8.3
FY 2018 Navy CFA
Yokosuka / Japan
Japan CFA Yokosuka Smart Grid $8,530 2.1 9.2
FY 2018 Navy NSA Naples Italy C4i Chiller Replacement $2,700 2.4 6.6
FY 2018 Navy NSA Andersen Guam 885KW Solar BIPV $5,880 1.5 11.4
FY 2018 Navy NAVBASE Guam Guam Energy Efficient
Lights/HVAC/DHW $2,160 5.8 3.8
FY 2018 Navy NAVBASE Guam Guam R22 HVAC & LED
Lighting $6,920 2.9 9.2
FY 2017 Navy NSF Diego Garcia
Diego Garcia 3 MW Solar PV Array $17,010 1 19.1
FY 2017 Navy NAVBASE Guam Guam Solar Assisted HVAC and
R-22 HVAC Replacement $1,240 7.6 2.1
FY 2017 Navy NAVSTA
Guantanamo Bay
Cuba Electrical Power Plant Controls Upgrade $6,080 2.4 7
FY 2017 Navy NAVBASE Guam Guam 1.6 MW Solar Array &
Wasterwater Treatment $8,540 1.6 10.4
FY 2017 DLA Rota Spain 1 MW Solar Array $3,710 2.2 8.6
Table G-1: OCONUS ERCIP Projects Selected and Funded in FYs 2017 and 2018
H-1
Appendix H - House Report 115-219, to accompany HR 3219, Department of Defense Appropriations Bill for FY 2018
Energy Security of Overseas Military Installations, page 60
The House Armed Services Committee directed the Secretary of Defense to submit a report to the congressional defense committees not later than January 9, 2018 on the potential vulnerabilities of energy supply disruptions at overseas locations hosting permanent and rotational United States armed forces, including medical centers on military installations, and efforts the Department is currently taking to mitigate the risk of potential energy supply disruptions at overseas military installations, including considerations the Department is taking to mitigate such risks when reviewing energy supply options at such installations.
The Department’s response for House Report 115-200, to accompany HR 2810, the NDAA for FY 2018 (Appendix G, FY 2017 AEMRR) satisfies this Congressional reporting requirement.

I-1
Appendix I - Senate Reports 114-237 & 115-188, Military Construction, Veterans’ Affairs, and Related Agencies Appropriations Bills, FYs 2017 & 2018
INTRODUCTION The Secretary of Defense is directed to report to the Committees on Appropriations of both Houses of Congress and to the Congressional Defense Committees on Water Conservation on Military Installations, in accordance with the Military Construction, Veterans Affairs and related agencies appropriation Bill, 2017 Senate Report 114-237 and the Military Construction, Veterans Affairs and related agencies appropriation Bill, 2018 House of Representatives Report 115-188. Water Conservation on Military Installations.—The Committee recognizes that the Department of Defense has the opportunity to play a key role in advancing our Nation’s water security by implementing water conservation, reuse, and recharge practices on military installations. This should include efforts to incorporate water conservation technologies into new infrastructure design, as well as to update existing infrastructure to make it more water efficient. The Committee also recognizes that many technologies that in-crease water efficiency do not result in competitive returns on in-vestment. Therefore, the Department of Defense is encouraged to implement water conservation projects that are not solely contingent on cost savings performance, but also take into account reduced water use. To assess the current status of water demand and potential water conservation opportunities across U.S. military installations, the Secretary of Defense is directed to report to the congressional defense committees not later than 180 days of enactment of this Act the following: (1) the current water usage on military installations; (2) the vulnerability of each military installation to water scarcity; and, (3) the water conservation potential according to (a) reduced water use and (b) cost savings if current water conservation technologies and efficient design were implemented at military installations. THE CURRENT WATER USAGE ON MILITARY INSTALLATIONS
The current water usage on military installations is calculated by using water bills, which represent strictly potable water. Potable water includes water purchased from a utility and all fresh water (e.g., well and streams) treated and added to the domestic system for human consumption. During FY 2017, DoD consumed over 81 billion gallons of potable water at a cost of approximately, $262 million. Figure 1 provides a breakout of total water consumption and costs by Military Service, respectively .

I-2
FY 2017 DOD POTABLE WATER
Costs ($Thou) Consumption (Thou Gal)
ARMY $86,923 31,230,400 NAVY $82,991 21,306,413 USMC $21,613 6,530,498
AIR FORCE $70,503 22,175,162 TOTAL $262,030 81,242,473
Figure I-1. DoD Water Costs and Consumption
THE VULNERABILITY OF MILITARY INSTALLATION TO WATER SCARCITY
In the context of mission readiness across DoD installations and for purposes of this report, DoD defines scarcity as a condition of drought prone areas. Figure 2 is a map of DoD military installations overlaid on top of drought areas identified by the U.S. Drought Monitor21 as of April 2018.
Figure I-2. DoD Military Installation Overlay on Drought Area
21 The U.S. Drought Monitor website is hosted and maintained by the drought center. U.S. Drought Monitor is jointly produced by the National Drought Mitigation Center at the University of Nebraska-Lincoln, the United States Department of Agriculture, and the National Oceanic and Atmospheric Administration. Map courtesy of NDMC-UNL.

I-3
Figure 3 provides a description of the different categories of draught conditions.
Figure I-3. Drought Range Categories There are 21 DoD Installations that fall into either the “Severe” and “Extreme” categories, Figures 3 and 4, respectively.
Category 2 Installations – Severe Drought STATE INSTALLATION SERVICE Georgia Fort Stewart USA Kansas Fort Riley USA
New Mexico White Sands USA California NAVBASE Ventura USN California NAVWPNSTA Seal Beach USN Arizona MCAS Yuma AZ USMC
South Carolina MCAS Beaufort SC USMC Arizona Davis Monthan AFB USAF
California Los Angeles AFB USAF California Vandenberg AFB USAF Georgia Moody AFB USAF Kansas McConnell AFB USAF
New Mexico Cannon AFB USAF New Mexico Holloman AFB USAF New Mexico Kirtland AFB USAF
Texas Laughlin AFB USAF
Figure I-4. DoD Installations in Severe Drought Areas
Category Description Implication Gray None Yellow 0 Abnormally
Dry Going into drought: short-term dryness slowing planting, growth of crops/pastures. Coming out of drought: some lingering water deficits/pastures or crops not fully recovered
Beige 1 Moderate Dry
Some damage to crops, pastures. Streams, reservoirs, or wells low, some water shortages developing or imminent/ Voluntary water-use restrictions requested
Orange 2 Severe Drought
Crop or pasture losses likely/Water shortages common. Water restrictions imposed
Red 3 Extreme Drought
Major crop/pasture losses. Widespread water shortages or restrictions
Maroon 4 Exceptional Drought
Exceptional and widespread crop/pasture losses. Shortages of water in reservoirs, streams, and wells creating water emergencies

I-4
Category 3 Installations –Extreme Drought STATE INSTALLATION SERVICE Arizona Fort Huachuca USA California NAF El Centro CA USN Arizona Luke AFB USAF Oklahoma Altus AFB USAF Oklahoma Vance AFB USAF
Figure I-5. DoD Installations in Extreme Drought Areas WATER CONSERVATION POTENTIAL ON DOD INSTALLATIONS
DoD has steadily reduced its potable water consumption at its installations in excess of the Energy Independence and Security Act of 2007 goal (Figure 7). During FY 2017, DoD reduced its potable water intensity by 26.9% from the 2007 baseline against a goal of 20%. DoD has had great success in achieving water efficiencies through routine maintenance and upgrades of water infrastructure, water efficiency projects, water utilities privatization (UP), and third-party financed projects such as Energy Savings Performance Contracts (ESPCs) and Utility Energy Services Contracts (UESC), which have included water savings investments.
Figure I-6. DoD Potable Water Intensity Reductions against the 2007 Intensity Baseline DoD has strived for better water management across installations through several policies. First, the Unified Facilities Criteria (UFC) 1-200-02 High Performance and Sustainable Buildings requires compliance with industry standard water efficiency practices in new construction and major renovation, where cost-effective. Second, DoD issued an Industrial, Landscaping and Agriculture (ILA) Water Use policy in 2015, and a separate Landscape Architecture water use policy in 2016, to guide the minimal use of water in these applications. Third, DoD is in the process of updating DoD Instruction (DODI) 4170.11 Installation Energy Management, the overarching policy guidance document for the Department on installation energy, to explicitly require water management and resilience planning and practices. The Department will continue to undertake the following approaches to achieve water efficiencies:
• Install water meters at main distribution lines, central heat and chiller plants, and other large uses such as barracks, pools, hospitals, and gyms.
• Increase focus on leak detection and repair
-40%
-30%
-20%
-10%
0%
10%
FY2007
FY2008
FY2009
FY2010
FY2011
FY2012
FY2013
FY2014
FY2015
FY2016
FY2017
Air Force
Army
DON
DoD
EISA 2007

I-5
• Support water efficiency projects in existing buildings, such as chiller system improvements, high efficiency cooling towers, low-flow fixtures, and plumbing retrofits.
• Increase use of rainwater harvesting systems, drought-tolerant landscaping and water-efficient irrigation.
Funding for these activities will come from four fund sources: Sustainment, Restoration, and Modernization (SRM) funds, the Energy Resilience and Conservation Investment Program (ERCIP), Energy Savings Performance Contracts (ESPC), and/or Utility Energy Service Contracts (UESC). While there may be water conservation potential on all DoD installations, there is not always an acceptable business case to invest in all water projects. However, regular maintenance is the most advantageous way towards becoming more resilient. Replacing aging infrastructure reduces consumption and cost, and also controls water loss, a key issue across DoD installations. WAY FORWARD Though DoD cannot prepare for every risk and situation, the Department is beginning to include the implications of the changing water landscape in resilience and mission framework. Long-term planning and investment are essential to water infrastructure across DoD installations and have the capacity to mitigate recurring impacts of drought. Estimating the water conservation potential of DoD installations is challenging due to the diversity of building types and purposes, the deficit of building-level water meters, and installations’ capacity to perform the comprehensive water audits that would identify potential water savings. Furthermore, water is a relatively inexpensive commodity, and even some of the most promising water projects can be cost-prohibitive, resulting in low return on investment (ROI). Nevertheless, DoD installations will identify and pursue water conservation projects where cost-effective, and continue to save water through routine operations and maintenance practices such as leak detection and infrastructure upgrades.
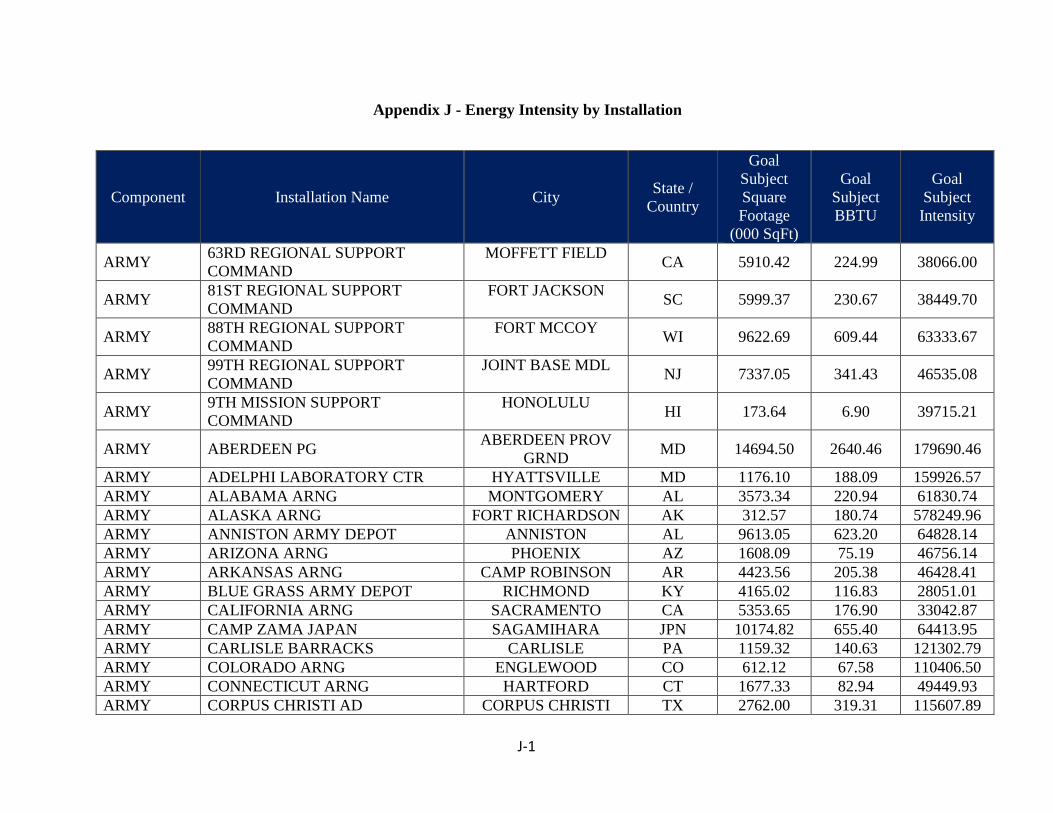
J-1
Appendix J - Energy Intensity by Installation
Component Installation Name City State / Country
Goal Subject Square Footage
(000 SqFt)
Goal Subject BBTU
Goal Subject Intensity
ARMY 63RD REGIONAL SUPPORT COMMAND
MOFFETT FIELD CA 5910.42 224.99 38066.00
ARMY 81ST REGIONAL SUPPORT COMMAND
FORT JACKSON SC 5999.37 230.67 38449.70
ARMY 88TH REGIONAL SUPPORT COMMAND
FORT MCCOY WI 9622.69 609.44 63333.67
ARMY 99TH REGIONAL SUPPORT COMMAND
JOINT BASE MDL NJ 7337.05 341.43 46535.08
ARMY 9TH MISSION SUPPORT COMMAND
HONOLULU HI 173.64 6.90 39715.21
ARMY ABERDEEN PG ABERDEEN PROV GRND MD 14694.50 2640.46 179690.46
ARMY ADELPHI LABORATORY CTR HYATTSVILLE MD 1176.10 188.09 159926.57 ARMY ALABAMA ARNG MONTGOMERY AL 3573.34 220.94 61830.74 ARMY ALASKA ARNG FORT RICHARDSON AK 312.57 180.74 578249.96 ARMY ANNISTON ARMY DEPOT ANNISTON AL 9613.05 623.20 64828.14 ARMY ARIZONA ARNG PHOENIX AZ 1608.09 75.19 46756.14 ARMY ARKANSAS ARNG CAMP ROBINSON AR 4423.56 205.38 46428.41 ARMY BLUE GRASS ARMY DEPOT RICHMOND KY 4165.02 116.83 28051.01 ARMY CALIFORNIA ARNG SACRAMENTO CA 5353.65 176.90 33042.87 ARMY CAMP ZAMA JAPAN SAGAMIHARA JPN 10174.82 655.40 64413.95 ARMY CARLISLE BARRACKS CARLISLE PA 1159.32 140.63 121302.79 ARMY COLORADO ARNG ENGLEWOOD CO 612.12 67.58 110406.50 ARMY CONNECTICUT ARNG HARTFORD CT 1677.33 82.94 49449.93 ARMY CORPUS CHRISTI AD CORPUS CHRISTI TX 2762.00 319.31 115607.89

J-2
Component Installation Name City State / Country
Goal Subject Square Footage
(000 SqFt)
Goal Subject BBTU
Goal Subject Intensity
ARMY DC ARNG (MOB) WASHINGTON, DC DC 595.94 85.32 143173.33 ARMY DELAWARE ARNG WILMINGTON DE 671.56 24.87 37031.47 ARMY DEVENS RFTA DEVENS MA 1311.19 107.71 82145.35 ARMY DUGWAY PROVING GROUND DUGWAY UT 2260.25 246.96 109261.27 ARMY FLORIDA ARNG SAINT AUGUSTINE FL 2933.92 73.87 25178.25 ARMY FORT A P HILL BOWLING GREEN VA 1521.81 70.24 46153.73 ARMY FORT BELVOIR FORT BELVOIR VA 13155.85 1057.63 80392.22 ARMY FORT BENNING FORT BENNING GA 20811.62 1360.28 65361.75 ARMY FORT BLISS EL PASO TX 22721.03 1254.32 55205.37 ARMY FORT BRAGG FORT BRAGG NC 34171.58 3203.84 93757.34 ARMY FORT BUCHANAN CATANO PR 1902.42 106.95 56216.38 ARMY FORT CAMPBELL FORT CAMPBELL KY 17053.78 1422.66 83421.76 ARMY FORT CARSON COLORADO SPGS CO 14717.12 1292.95 87853.47 ARMY FORT DETRICK FORT DETRICK MD 3564.84 1072.48 300848.35 ARMY FORT DRUM FORT DRUM NY 12114.39 660.71 54539.45 ARMY FORT GEORGE MEADE FORT MEADE MD 10168.87 644.59 63388.58 ARMY FORT GORDON AUGUSTA GA 10240.73 774.71 75650.15 ARMY FORT GREELY DELTA JUNCTION AK 1098.58 269.02 244883.17 ARMY FORT HAMILTON NEW YORK CITY NY 772.08 67.31 87180.93 ARMY FORT HOOD KILLEEN TX 23348.20 1839.65 78791.99 ARMY FORT HUACHUCA FORT HUACHUCA AZ 5702.28 427.00 74882.30
ARMY FORT HUNTER LIGGETT FORT HUNTER LIGGETT CA 1487.87 40.10 26947.93
ARMY FORT IRWIN FORT IRWIN CA 4304.08 515.51 119771.56 ARMY FORT JACKSON COLUMBIA SC 10318.12 799.67 77501.90 ARMY FORT KNOX FORT KNOX KY 11789.46 930.34 78913.19

J-3
Component Installation Name City State / Country
Goal Subject Square Footage
(000 SqFt)
Goal Subject BBTU
Goal Subject Intensity
ARMY FORT LEAVENWORTH FORT LEAVENWORTH KS 4774.93 361.46 75700.11
ARMY FORT LEE FORT LEE VA 10110.53 785.72 77712.71
ARMY FORT LEONARD WOOD FORT LEONARD WOOD MO 12318.97 1390.73 112893.34
ARMY FORT MCCOY SPARTA WI 6929.02 341.35 49264.11 ARMY FORT POLK FORT POLK LA 7810.14 688.37 88137.52 ARMY FORT RILEY FORT RILEY KS 11779.83 999.84 84877.21 ARMY FORT RUCKER FORT RUCKER AL 5942.34 488.74 82247.52 ARMY FORT SILL FORT SILL OK 12199.38 1062.86 87124.00 ARMY FORT STEWART FORT STEWART GA 15190.88 1243.77 81875.93
ARMY FORT WAINWRIGHT FORT WAINWRIGHT AK 6791.11 1869.99 275357.87
ARMY GEORGIA ARNG ATLANTA GA 2070.12 109.55 52920.48 ARMY GUAM ARNG (MOB) BARRIGADA GU 254.87 10.33 40510.07 ARMY HAWAII ARNG HONOLULU HI 1240.73 24.28 19566.67 ARMY HAWTHORNE AAP (GOCO) HAWTHORNE NV 9644.24 150.64 15619.79 ARMY HOLSTON AAP (GOCO) KINGSPORT TN 1959.53 2460.97 1255897.20 ARMY IDAHO ARNG BOISE ID 798.93 112.61 140955.19 ARMY ILLINOIS ARNG CAMP LINCOLN IL 2897.63 145.96 50371.22 ARMY INDIANA ARNG INDIANOPOLIS IN 4585.88 324.57 70776.10 ARMY IOWA AAP (GOCO) MIDDLETOWN IA 3943.49 699.72 177437.96 ARMY IOWA ARNG JOHNSTON IA 3167.68 150.50 47510.11 ARMY JOINT BASE LEWIS MCCHORD TACOMA WA 26495.65 2013.57 75996.37
ARMY JOINT BASE MYER-HENDERSON HALL
FORT MYER VA 3731.11 362.13 97055.59
ARMY KANSAS ARNG TOPEKA KS 1513.30 103.72 68540.96
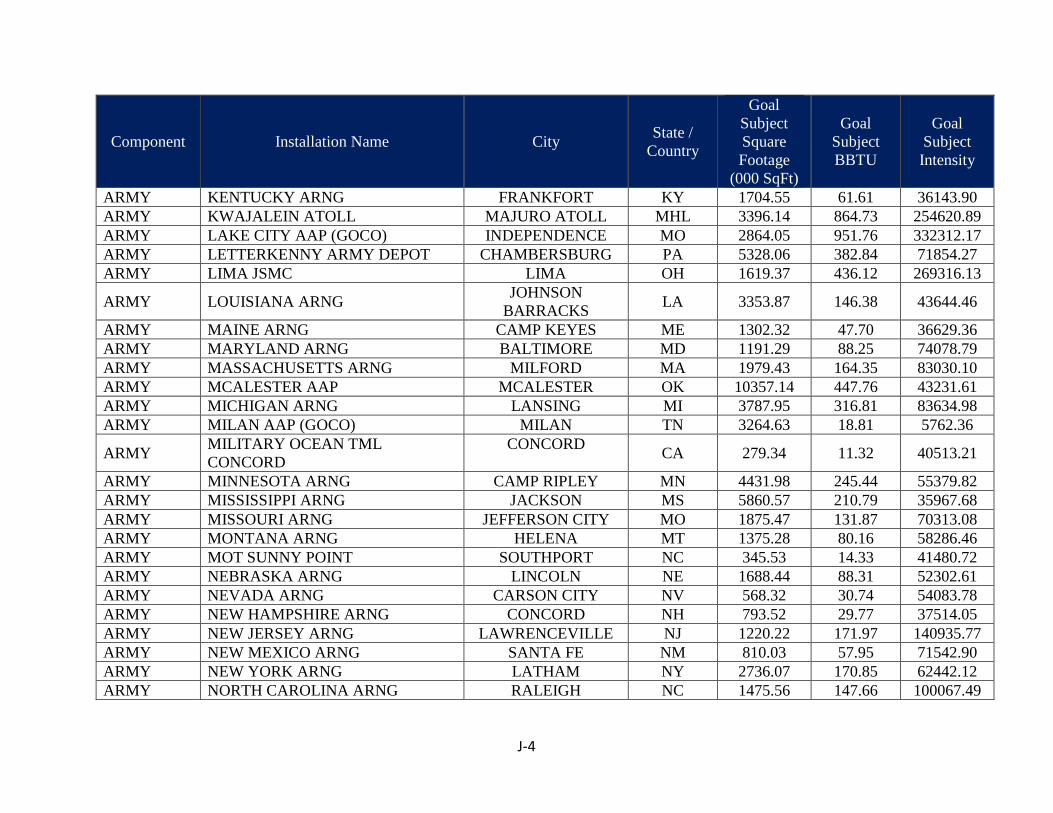
J-4
Component Installation Name City State / Country
Goal Subject Square Footage
(000 SqFt)
Goal Subject BBTU
Goal Subject Intensity
ARMY KENTUCKY ARNG FRANKFORT KY 1704.55 61.61 36143.90 ARMY KWAJALEIN ATOLL MAJURO ATOLL MHL 3396.14 864.73 254620.89 ARMY LAKE CITY AAP (GOCO) INDEPENDENCE MO 2864.05 951.76 332312.17 ARMY LETTERKENNY ARMY DEPOT CHAMBERSBURG PA 5328.06 382.84 71854.27 ARMY LIMA JSMC LIMA OH 1619.37 436.12 269316.13
ARMY LOUISIANA ARNG JOHNSON BARRACKS LA 3353.87 146.38 43644.46
ARMY MAINE ARNG CAMP KEYES ME 1302.32 47.70 36629.36 ARMY MARYLAND ARNG BALTIMORE MD 1191.29 88.25 74078.79 ARMY MASSACHUSETTS ARNG MILFORD MA 1979.43 164.35 83030.10 ARMY MCALESTER AAP MCALESTER OK 10357.14 447.76 43231.61 ARMY MICHIGAN ARNG LANSING MI 3787.95 316.81 83634.98 ARMY MILAN AAP (GOCO) MILAN TN 3264.63 18.81 5762.36
ARMY MILITARY OCEAN TML CONCORD
CONCORD CA 279.34 11.32 40513.21
ARMY MINNESOTA ARNG CAMP RIPLEY MN 4431.98 245.44 55379.82 ARMY MISSISSIPPI ARNG JACKSON MS 5860.57 210.79 35967.68 ARMY MISSOURI ARNG JEFFERSON CITY MO 1875.47 131.87 70313.08 ARMY MONTANA ARNG HELENA MT 1375.28 80.16 58286.46 ARMY MOT SUNNY POINT SOUTHPORT NC 345.53 14.33 41480.72 ARMY NEBRASKA ARNG LINCOLN NE 1688.44 88.31 52302.61 ARMY NEVADA ARNG CARSON CITY NV 568.32 30.74 54083.78 ARMY NEW HAMPSHIRE ARNG CONCORD NH 793.52 29.77 37514.05 ARMY NEW JERSEY ARNG LAWRENCEVILLE NJ 1220.22 171.97 140935.77 ARMY NEW MEXICO ARNG SANTA FE NM 810.03 57.95 71542.90 ARMY NEW YORK ARNG LATHAM NY 2736.07 170.85 62442.12 ARMY NORTH CAROLINA ARNG RALEIGH NC 1475.56 147.66 100067.49
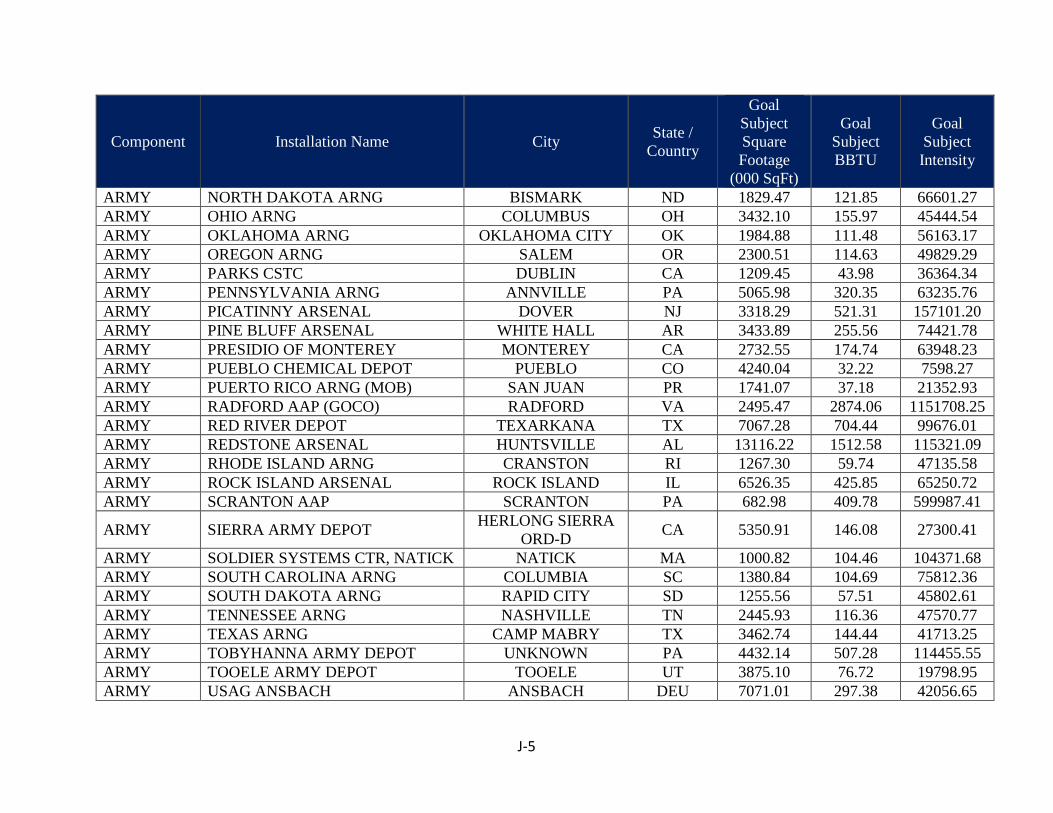
J-5
Component Installation Name City State / Country
Goal Subject Square Footage
(000 SqFt)
Goal Subject BBTU
Goal Subject Intensity
ARMY NORTH DAKOTA ARNG BISMARK ND 1829.47 121.85 66601.27 ARMY OHIO ARNG COLUMBUS OH 3432.10 155.97 45444.54 ARMY OKLAHOMA ARNG OKLAHOMA CITY OK 1984.88 111.48 56163.17 ARMY OREGON ARNG SALEM OR 2300.51 114.63 49829.29 ARMY PARKS CSTC DUBLIN CA 1209.45 43.98 36364.34 ARMY PENNSYLVANIA ARNG ANNVILLE PA 5065.98 320.35 63235.76 ARMY PICATINNY ARSENAL DOVER NJ 3318.29 521.31 157101.20 ARMY PINE BLUFF ARSENAL WHITE HALL AR 3433.89 255.56 74421.78 ARMY PRESIDIO OF MONTEREY MONTEREY CA 2732.55 174.74 63948.23 ARMY PUEBLO CHEMICAL DEPOT PUEBLO CO 4240.04 32.22 7598.27 ARMY PUERTO RICO ARNG (MOB) SAN JUAN PR 1741.07 37.18 21352.93 ARMY RADFORD AAP (GOCO) RADFORD VA 2495.47 2874.06 1151708.25 ARMY RED RIVER DEPOT TEXARKANA TX 7067.28 704.44 99676.01 ARMY REDSTONE ARSENAL HUNTSVILLE AL 13116.22 1512.58 115321.09 ARMY RHODE ISLAND ARNG CRANSTON RI 1267.30 59.74 47135.58 ARMY ROCK ISLAND ARSENAL ROCK ISLAND IL 6526.35 425.85 65250.72 ARMY SCRANTON AAP SCRANTON PA 682.98 409.78 599987.41
ARMY SIERRA ARMY DEPOT HERLONG SIERRA ORD-D CA 5350.91 146.08 27300.41
ARMY SOLDIER SYSTEMS CTR, NATICK NATICK MA 1000.82 104.46 104371.68 ARMY SOUTH CAROLINA ARNG COLUMBIA SC 1380.84 104.69 75812.36 ARMY SOUTH DAKOTA ARNG RAPID CITY SD 1255.56 57.51 45802.61 ARMY TENNESSEE ARNG NASHVILLE TN 2445.93 116.36 47570.77 ARMY TEXAS ARNG CAMP MABRY TX 3462.74 144.44 41713.25 ARMY TOBYHANNA ARMY DEPOT UNKNOWN PA 4432.14 507.28 114455.55 ARMY TOOELE ARMY DEPOT TOOELE UT 3875.10 76.72 19798.95 ARMY USAG ANSBACH ANSBACH DEU 7071.01 297.38 42056.65

J-6
Component Installation Name City State / Country
Goal Subject Square Footage
(000 SqFt)
Goal Subject BBTU
Goal Subject Intensity
ARMY USAG BAVARIA GRAFENWOHR DEU 23915.66 1548.89 64764.73 ARMY USAG BENELUX BRUSSELS BEL 5405.14 145.74 26963.02 ARMY USAG DAEGU TAEGU KOR 6568.29 417.38 63544.66
ARMY USAG DETROIT ARSENAL HARRISON TOWNSHIP MI 1926.18 249.60 129581.12
ARMY USAG HAWAII WAHIAWA HI 14689.87 815.05 55483.83 ARMY USAG HUMPHREYS CAMP HUMPHREYS KOR 12639.15 950.72 75220.27 ARMY USAG MIAMI MIAMI FL 781.86 88.16 112757.46 ARMY USAG RED CLOUD UIJONG BU KOR 9888.13 977.15 98820.27 ARMY USAG RHEINLAND-PFALZ KAISERLAUTERN DEU 24536.47 1282.20 52256.86 ARMY USAG STUTTGART STUTTGART DEU 8654.94 613.19 70848.12 ARMY USAG VICENZA VICENZA ITA 8230.31 584.16 70976.10 ARMY USAG WIESBADEN WIESBADEN DEU 9942.13 641.93 64566.77 ARMY USAG YONGSAN SEOUL KOR 8309.83 863.00 103853.41 ARMY UTAH ARNG DRAPER UT 1963.97 128.94 65652.74 ARMY VERMONT ARNG COLCHESTER VT 1204.61 56.82 47166.33 ARMY VIRGIN ISLANDS ARNG (MOB) CHRISTIANSTED VI 319.60 12.49 39083.11 ARMY VIRGINIA ARNG FORT PICKETT VA 3893.87 179.33 46054.13 ARMY WASHINGTON ARNG CAMP MURRAY WA 904.83 47.59 52595.29 ARMY WATERVLIET ARSENAL WATERVLIET NY 2203.28 299.25 135822.09 ARMY WEST POINT MIL RESERVATION WEST POINT NY 7956.56 935.70 117601.40 ARMY WEST VIRGINIA ARNG CHARLESTON WV 2081.10 160.67 77202.35 ARMY WHITE SANDS MISSILE RANGE WHITE SANDS NM 4688.09 280.84 59905.26 ARMY WISCONSIN ARNG MADISON WI 2470.30 179.47 72651.80 ARMY WYOMING ARNG CHYENNE WY 838.34 75.89 90522.73 ARMY YUMA PROVING GROUND YUMA AZ 1899.30 140.36 73899.99

J-7
Component Installation Name City State / Country
Goal Subject Square Footage
(000 SqFt)
Goal Subject BBTU
Goal Subject Intensity
AIR FORCE ABRAHAM LINCOLN CAPITAL AIRPORT
SPRINGFIELD IL 332.00 19.89 59900.60
AIR FORCE AIR NATIONAL GUARD READINESS CENTER (ANGRC)
ANDREWS AFB MD 348.00 24.19 69520.11
AIR FORCE ALPENA COUNTY REGIONAL AIRPORT
ALPENA MI 563.17 42.25 75023.26
AIR FORCE ALTUS AIR FORCE BASE ALTUS OK 2591.00 290.40 112080.66 AIR FORCE ANDERSEN AIR FORCE BASE AGANA GU 52.00 2.64 50693.28
AIR FORCE ARNOLD AIR STATION ARNOLD A F STATION TN 2798.00 1518.47 542696.93
AIR FORCE ATLANTIC CITY INTERNATIONAL AIRPORT
EGG HARBOR TOWNSHIP NJ 495.00 39.42 79626.26
AIR FORCE AVIANO AIR BASE ROVEREDO IN PIANO ITA 4231.00 289.66 68460.88
AIR FORCE BANGOR INTERNATIONAL AIRPORT (ANG)
UNKNOWN ME 511.90 48.99 95692.52
AIR FORCE BARKSDALE AIR FORCE BASE BARKSDALE AF BASE LA 5163.27 425.84 82475.45
AIR FORCE BARNES MUNICIPAL AIRPORT ANG
WESTFIELD MA 480.00 36.27 75566.67
AIR FORCE BEALE AIR FORCE BASE BEALE AFB CA 3156.14 343.61 108870.19
AIR FORCE BIRMINGHAM INTERNATIONAL AIRPORT
BIRMINGHAM AL 364.82 26.62 72952.99
AIR FORCE BOISE AIR TERMINAL (ANG) UNKNOWN ID 566.00 29.25 51669.61
AIR FORCE BRADLEY INTERNATIONAL AIRPORT (ANG)
UNKNOWN CT 400.55 33.05 82504.47
AIR FORCE BUCKLEY AIR FORCE BASE AURORA CO 1709.00 161.14 94287.30 AIR FORCE BUCKLEY AIR FORCE BASE AURORA CO 588.00 56.72 96465.99

J-8
Component Installation Name City State / Country
Goal Subject Square Footage
(000 SqFt)
Goal Subject BBTU
Goal Subject Intensity
AIR FORCE BURLINGTON INTERNATIONAL AIRPORT (ANG)
SOUTH BURLINGTON VT 479.30 22.69 47333.61
AIR FORCE CAMP BLANDING MILITARY RESERVATION (ANG) STARKE FL 123.60 4.10 33147.25
AIR FORCE CAMP MURRAY ANG STATION TACOMA WA 229.84 13.29 57831.28
AIR FORCE CAMP PENDLETON MILITARY RESERVATION(ANG) VIRGINIA BEACH VA 123.88 4.05 32667.66
AIR FORCE CAMP PERRY ANG STATION PORT CLINTON OH 119.39 4.53 37935.45 AIR FORCE CANNON AIR FORCE BASE CANNON AFB NM 3265.29 365.51 111938.60
AIR FORCE CARSWELL AIR RESERVE STATION
UNKNOWN TX 360.00 12.94 35955.56
AIR FORCE CHANNEL ISLANDS ANG STATION
PORT HUENEME CA 345.10 17.08 49498.70
AIR FORCE CHARLESTON AIR FORCE BASE UNKNOWN SC 8679.05 715.25 82411.31
AIR FORCE CHARLOTTE/DOUGLAS INT AIRPORT (ANG)
CHARLOTTE NC 620.00 26.32 42448.39
AIR FORCE CHEYENNE REGIONAL AIRPORT CHEYENNE WY 432.00 40.99 94872.69 AIR FORCE COLUMBUS AIR FORCE BASE COLUMBUS MS 1579.27 132.67 84007.38
AIR FORCE DANE COUNTY REGIONAL AIRPORT-TRUAX FIELD MADISON WI 474.70 33.93 71474.62
AIR FORCE DAVIS-MONTHAN AIR FORCE BASE
TUCSON AZ 4787.00 345.93 72263.84
AIR FORCE DES MOINES INTERNATIONAL AIRPORT ANG
UNKNOWN IA 417.42 33.07 79224.76
AIR FORCE DOBBINS AIR RESERVE BASE MARIETTA GA 1050.30 90.92 86567.65 AIR FORCE DOVER AIR FORCE BASE UNKNOWN DE 3855.10 415.88 107878.65
AIR FORCE DULUTH INTERNATIONAL AIRPORT (ANG)
DULUTH MN 482.95 55.84 115619.55

J-9
Component Installation Name City State / Country
Goal Subject Square Footage
(000 SqFt)
Goal Subject BBTU
Goal Subject Intensity
AIR FORCE DYESS AIR FORCE BASE ABILENE TX 3438.89 276.32 80349.98 AIR FORCE EARECKSON AIR STATION ADAK STATION AK 2915.85 675.07 231517.48 AIR FORCE EDWARDS AIR FORCE BASE LANCASTER CA 7250.00 760.02 104830.90 AIR FORCE EGLIN AIR FORCE BASE VALPARAISO FL 10822.00 1167.74 107904.64 AIR FORCE EIELSON AIR FORCE BASE UNKNOWN AK 3924.91 2146.77 546958.74 AIR FORCE EIELSON AIR FORCE BASE UNKNOWN AK 298.51 25.94 86882.38 AIR FORCE ELLINGTON FIELD HOUSTON TX 493.00 42.22 85636.92 AIR FORCE ELLSWORTH AIR FORCE BASE ELLSWORTH AFB SD 4044.00 417.52 103243.82 AIR FORCE EWVRA SHEPHERD FIELD ANG MARTINSBURG WV 652.00 64.47 98886.50 AIR FORCE FAIRCHILD AIR FORCE BASE AIRWAY HEIGHTS WA 4011.40 412.36 102796.31 AIR FORCE FAIRCHILD AIR FORCE BASE AIRWAY HEIGHTS WA 362.11 26.88 74235.37 AIR FORCE FORBES FIELD ANG TOPEKA KS 484.01 35.88 74138.81
AIR FORCE FORT SMITH MUNICIPAL AIRPORT ANG FORT SMITH AR 418.14 21.99 52591.93
AIR FORCE FORT WAYNE INTERNATIONAL AIRPORT FORT WAYNE IN 426.00 36.05 84629.11
AIR FORCE FRANCIS E WARREN AIR FORCE BASE CHEYENNE WY 3315.65 335.29 101123.16
AIR FORCE FRANCIS S GABRESKI AIRPORT (ANG)
WESTHAMPTON BEACH NY 360.00 35.23 97869.44
AIR FORCE FRESNO YOSEMITE INTERNATIONAL FRESNO CA 453.84 23.38 51524.43
AIR FORCE FT INDIANTOWN GAP ANG STATION ANNVILLE PA 348.30 19.19 55099.05
AIR FORCE GENERAL MITCHELL INTERNATIONAL APT (ANG) MILWAUKEE WI 382.79 29.45 76934.33

J-10
Component Installation Name City State / Country
Goal Subject Square Footage
(000 SqFt)
Goal Subject BBTU
Goal Subject Intensity
AIR FORCE GENERAL WAYNE A. DOWNING PEORIA INTERNATIONAL AIRPORT (ANG)
PEORIA IL 447.90 33.59 74987.72
AIR FORCE GOODFELLOW AIR FORCE BASE UNKNOWN TX 2615.10 217.97 83351.72 AIR FORCE GRAND FORKS AIR FORCE BASE GRAND FORKS AFB ND 2728.90 306.04 112147.75 AIR FORCE GREAT FALLS IAP ANG GREAT FALLS MT 428.00 37.00 86457.94 AIR FORCE GRISSOM AIR RESERVE BASE UNKNOWN IN 1049.00 87.49 83404.19
AIR FORCE GULFPORT-BILOXI REGIONAL AIRPORT (ANG) GULFPORT MS 634.07 28.35 44716.17
AIR FORCE HANSCOM AIR FORCE BASE BEDFORD MA 3534.75 463.78 131205.04 AIR FORCE HARRISBURG IAP MIDDLETOWN PA 330.00 23.04 69821.21
AIR FORCE HECTOR INTERNATIONAL AIRPORT (ANG) FARGO ND 492.19 35.49 72096.87
AIR FORCE HICKAM AIR FORCE BASE HICKAM AFB HI 851.82 34.56 40566.18 AIR FORCE HILL AIR FORCE BASE UNKNOWN UT 13491.73 2307.18 171006.65 AIR FORCE HOLLOMAN AIR FORCE BASE UNKNOWN NM 5443.58 500.84 92006.18
AIR FORCE HOMESTEAD AIR RESERVE BASE HOMESTEAD FL 1112.00 59.52 53526.08
AIR FORCE HULMAN REGIONAL AIRPORT TERRE HAUTE IN 393.47 41.52 105527.20 AIR FORCE HURLBURT FIELD EGLIN AFB FL 4855.22 513.90 105844.89 AIR FORCE INCIRLIK AIR BASE ADANA UNKNOWN TUR 4878.68 299.46 61380.90
AIR FORCE JACKSON INTERNATIONAL AIRPORT FLOWOOD MS 547.00 46.46 84943.33
AIR FORCE JACKSONVILLE IAP ANG JACKSONVILLE FL 442.20 25.98 58756.22
AIR FORCE JEFFERSON BARRACKS ANG STATION UNKNOWN MO 219.94 13.53 61504.54
AIR FORCE JOE FOSS FIELD ANG UNKNOWN SD 441.71 39.42 89236.88

J-11
Component Installation Name City State / Country
Goal Subject Square Footage
(000 SqFt)
Goal Subject BBTU
Goal Subject Intensity
AIR FORCE JOINT BASE ANDREWS-NAVAL AIR FACILITY WASHINGTON ANDREWS AFB MD 5360.49 551.39 102861.45
AIR FORCE JOINT BASE ANDREWS-NAVAL AIR FACILITY WASHINGTON ANDREWS AFB MD 490.00 61.96 126442.86
AIR FORCE JOINT BASE ELMENDORF-FT RICHARDSON ELMENDORF AFB AK 11748.47 1681.38 143114.93
AIR FORCE JOINT BASE ELMENDORF-FT RICHARDSON ELMENDORF AFB AK 556.00 52.63 94654.68
AIR FORCE JOINT BASE SAN ANTONIO (JBSA) SAN ANTONIO TX 36077.63 3367.64 93344.34
AIR FORCE KADENA AIR BASE KADENA AIR BASE OKINAWA JPN 23864.49 1194.76 50064.51
AIR FORCE KEESLER AIR FORCE BASE BILOXI MS 6445.66 631.29 97939.67
AIR FORCE KELLY FIELD ANNEX (LACKLAND AFB) LACKLAND AFB TX 388.00 32.96 84945.88
AIR FORCE KEY FIELD AIR NATIONAL GUARD MERIDIAN MS 408.81 23.96 58613.60
AIR FORCE KIRTLAND AIR FORCE BASE ALBUQUERQUE NM 6991.00 809.85 115842.23 AIR FORCE KIRTLAND AIR FORCE BASE ALBUQUERQUE NM 314.40 18.34 58326.42
AIR FORCE KLAMATH FALLS AIRPORT-KINGSLEY FIELD KLAMATH FALLS OR 493.00 38.01 77093.31
AIR FORCE KUNSAN AIR BASE KUNSAN KOR 4036.59 340.82 84431.91 AIR FORCE LAJES FIELD LAJESFIELD PRT 1768.27 38.34 21684.53 AIR FORCE LAMBERT ST LOUIS IAP ANG ST. LOUIS MO 293.85 9.68 32956.04 AIR FORCE LANGLEY AIR FORCE BASE LANGLEY AFB VA 12219.00 1232.62 100877.49 AIR FORCE LAUGHLIN AIR FORCE BASE UNKNOWN TX 1927.11 121.93 63271.95
AIR FORCE LINCOLN MUNICIPAL AIRPORT (ANG) UNKNOWN NE 356.04 30.97 86974.60

J-12
Component Installation Name City State / Country
Goal Subject Square Footage
(000 SqFt)
Goal Subject BBTU
Goal Subject Intensity
AIR FORCE LITTLE ROCK AIR FORCE BASE UNKNOWN AR 3506.00 482.39 137589.56 AIR FORCE LITTLE ROCK AIR FORCE BASE UNKNOWN AR 315.00 27.21 86365.08 AIR FORCE LOS ANGELES AIR FORCE BASE EL SEGUNDO CA 1109.00 90.58 81673.58
AIR FORCE LOUISVILLE INTERNATIONAL AIRPORT - STANDIFORD FIELD LOUISVILLE KY 416.81 22.91 54970.55
AIR FORCE LUIS MUNOZ MARIN INTERNATIONAL AIRPORT CAROLINA PR 475.00 27.22 57298.95
AIR FORCE LUKE AIR FORCE BASE GLENDALE AZ 4001.76 313.70 78389.20 AIR FORCE MACDILL AIR FORCE BASE UNKNOWN FL 5131.03 536.53 104565.94 AIR FORCE MALMSTROM AIR FORCE BASE MALMSTROM AFB MT 3338.00 672.12 201355.00
AIR FORCE MANSFIELD LAHM AIRPORT ANG MANSFIELD OH 353.00 31.05 87963.17
AIR FORCE MARCH AIR RESERVE BASE UNKNOWN CA 1994.00 115.43 57886.66 AIR FORCE MARCH AIR RESERVE BASE UNKNOWN CA 307.75 18.48 60058.29 AIR FORCE MARTIN STATE AIRPORT ANG MIDDLE RIVER MD 442.00 20.31 45941.18 AIR FORCE MAXWELL AIR FORCE BASE MONTGOMERY AL 6043.67 609.37 100827.44 AIR FORCE MCCONNELL AIR FORCE BASE WICHITA KS 2414.73 272.13 112693.76 AIR FORCE MCCONNELL AIR FORCE BASE WICHITA KS 529.20 73.20 138322.00
AIR FORCE MCENTIRE JOINT NATIONAL GUARD BASE UNKNOWN SC 454.00 30.43 67022.03
AIR FORCE MCGHEE TYSON AIRPORT LOUISVILLE TN 833.86 78.97 94707.74 AIR FORCE MCGUIRE AIR FORCE BASE MCGUIRE AFB NJ 12645.10 1177.33 93105.63 AIR FORCE MCGUIRE AIR FORCE BASE MCGUIRE AFB NJ 435.60 39.40 90454.55
AIR FORCE MEMPHIS INTERNATIONAL AIRPORT MEMPHIS TN 626.00 65.29 104290.73
AIR FORCE MINNEAPOLIS-ST PAUL IAP-AIR RESERVE STN MINNEAPOLIS MN 710.34 63.58 89503.49

J-13
Component Installation Name City State / Country
Goal Subject Square Footage
(000 SqFt)
Goal Subject BBTU
Goal Subject Intensity
AIR FORCE MINNEAPOLIS-ST PAUL IAP-AIR RESERVE STN MINNEAPOLIS MN 467.47 35.50 75938.08
AIR FORCE MINOT AIR FORCE BASE MINOT AFB ND 4405.00 615.64 139760.27 AIR FORCE MISAWA AIR BASE MISAWA AFB JPN 7925.74 1214.89 153284.53 AIR FORCE MOFFETT FLD ANG MOUNTAIN VIEW CA 441.20 12.62 28592.48
AIR FORCE MONTGOMERY REGIONAL AIRPORT (ANG) BASE MONTGOMERY AL 504.60 32.95 65291.32
AIR FORCE MOODY AIR FORCE BASE MOODY AF BASE GA 3199.52 210.02 65640.16 AIR FORCE MORON AIR BASE MORAN AB ESP 732.44 30.35 41434.11
AIR FORCE MOUNTAIN HOME AIR FORCE BASE UNKNOWN ID 3354.30 308.38 91935.83
AIR FORCE NASHVILLE INTERNATIONAL AIRPORT NASHVILLE TN 261.94 20.53 78392.60
AIR FORCE NELLIS AIR FORCE BASE LAS VEGAS NV 9825.71 893.30 90914.96 AIR FORCE NEW CASTLE COUNTY AIRPORT UNKNOWN DE 338.60 29.66 87593.03 AIR FORCE NEW ORLEANS NAS ANG BELLE CHASSE LA 507.00 35.68 70380.67
AIR FORCE NIAGARA FALLS IAP-AIR RESERVE STATION NIAGARA FALLS NY 700.00 76.87 109817.14
AIR FORCE NIAGARA FALLS IAP-AIR RESERVE STATION NIAGARA FALLS NY 185.52 12.08 65109.94
AIR FORCE NORTH HIGHLANDS ANG STATION
NORTH HIGHLANDS CA 133.00 5.07 38150.38
AIR FORCE OFFUTT AIR FORCE BASE OFFUTT A.F.B. NE 6447.00 720.88 111815.73 AIR FORCE OSAN AIR BASE OSAN AFB KOR 7948.00 606.74 76338.70
AIR FORCE OTIS AIR NATIONAL GUARD BASE (ANGB)
OTIS ANGB, MASHPEE MA 755.12 63.87 84578.72
AIR FORCE PATRICK AIR FORCE BASE PATRICK AFB FL 7062.00 754.96 106903.99

J-14
Component Installation Name City State / Country
Goal Subject Square Footage
(000 SqFt)
Goal Subject BBTU
Goal Subject Intensity
AIR FORCE PEASE INTERNATIONAL TRADEPORT PORTSMOUTH NH 547.07 45.83 83767.61
AIR FORCE PETERSON AIR FORCE BASE COLORADO SPRINGS CO 6821.64 1692.08 248045.67
AIR FORCE PITTSBURGH IAP-AIR RESERVE STN MOON PA 569.00 45.38 79760.98
AIR FORCE PITTSBURGH INTERNATIONAL AIRPORT (ANG) CORAOPOLIS PA 449.80 54.61 121407.02
AIR FORCE PORTLAND INTERNATIONAL AIRPORT PORTLAND OR 789.80 61.89 78366.68
AIR FORCE QUONSET STATE AIRPORT ANG NORTH KINGSTOWN RI 399.00 34.84 87320.80
AIR FORCE RAF ALCONBURY ALCONBURY GBR 1561.22 149.43 95710.65 AIR FORCE RAF CROUGHTON UNKNOWN GBR 1096.93 63.74 58108.49 AIR FORCE RAF FAIRFORD FAIRFORD UK 1048.00 35.39 33771.95 AIR FORCE RAF LAKENHEATH LAKENHEATH GBR 7248.82 564.92 77932.69 AIR FORCE RAF MILDENHALL MILDENHALL GBR 2986.17 279.87 93722.76 AIR FORCE RAMSTEIN AIR BASE RAMSTEIN DEU 15836.51 1071.98 67690.41
AIR FORCE RENO TAHOE INTERNATIONAL AIRPORT RENO NV 403.28 25.60 63475.30
AIR FORCE RICKENBACKER INTERNATION AIRPORT (ANG) UNKNOWN OH 508.50 41.90 82403.15
AIR FORCE ROBINS AIR FORCE BASE ROBINS AF BASE GA 13248.00 1909.80 144157.68 AIR FORCE ROBINS AIR FORCE BASE ROBINS AF BASE GA 723.60 57.70 79741.57
AIR FORCE ROSECRANS MEMORIAL AIRPORT ST. JOSEPH MO 399.17 22.36 56014.01
AIR FORCE SALT LAKE CITY INTERNATIONAL AIRPORT ANG SALT LAKE CITY UT 501.27 39.69 79187.50

J-15
Component Installation Name City State / Country
Goal Subject Square Footage
(000 SqFt)
Goal Subject BBTU
Goal Subject Intensity
AIR FORCE SAVANNAH/HILTON HEAD INTERNATIONAL AP GARDEN CITY GA 901.18 42.10 46711.98
AIR FORCE SCHENECTADY COUNTY AIRPORT ANG SCOTIA NY 422.00 37.87 89727.49
AIR FORCE SCHRIEVER AIR FORCE BASE COLORADO SPRINGS CO 2263.00 441.19 194958.46
AIR FORCE SCOTT AIR FORCE BASE BELLEVILLE IL 4659.97 581.28 124739.00 AIR FORCE SCOTT AIR FORCE BASE BELLEVILLE IL 353.82 28.65 80959.24 AIR FORCE SELFRIDGE ANG BASE MOUNT CLEMENS MI 1627.00 165.14 101501.54
AIR FORCE SEYMOUR JOHNSON AIR FORCE BASE
SEYMOUR JOHNSON AFB NC 3206.03 287.00 89517.25
AIR FORCE SHAW AIR FORCE BASE SHAW AF BASE SC 3319.34 284.50 85709.84 AIR FORCE SHEPPARD AIR FORCE BASE WICHITA FALLS TX 7300.66 627.68 85975.69
AIR FORCE SIOUX GATEWAY AP/COL. BUD DAY FIELD(ANG) SIOUX CITY IA 476.61 35.46 74392.06
AIR FORCE SKY HARBOR INTERNATIONAL AIRPORT PHOENIX AZ 276.00 15.79 57199.28
AIR FORCE SPANGDAHLEM AIR BASE SPANGDAHLEM AB DEU 7504.82 353.43 47093.59
AIR FORCE SPRINGFIELD BECKLEY MUNICIPAL AIRPORT SPRINGFIELD OH 503.55 35.93 71352.97
AIR FORCE STEWART INTERNATIONAL AIRPORT UNKNOWN NY 868.00 92.33 106366.36
AIR FORCE SYRACUSE HANCOCK FIELD ANG SYRACUSE NY 499.00 46.89 93973.95
AIR FORCE TINKER AIR FORCE BASE OKLAHOMA CITY OK 18715.00 2387.52 127572.54 AIR FORCE TOLEDO EXPRESS AIRPORT ANG SWANTON OH 379.00 25.56 67427.44 AIR FORCE TRAVIS AIR FORCE BASE FAIRFIELD CA 6503.15 487.82 75012.62

J-16
Component Installation Name City State / Country
Goal Subject Square Footage
(000 SqFt)
Goal Subject BBTU
Goal Subject Intensity
AIR FORCE TUCSON INTERNATIONAL AIRPORT TUCSON AZ 647.00 46.88 72451.31
AIR FORCE TULSA INTERNATIONAL AIRPORT TULSA OK 383.78 35.91 93558.57
AIR FORCE TYNDALL AIR FORCE BASE UNKNOWN FL 4148.88 329.08 79318.03
AIR FORCE USAF ACADEMY AIR FORCE ACADEMY CO 7016.64 790.02 112592.62
AIR FORCE VANCE AIR FORCE BASE ENID OK 1467.93 120.29 81947.37 AIR FORCE VANDENBERG AIR FORCE BASE LOMPOC CA 5092.00 486.99 95638.85 AIR FORCE VOLK FIELD CAMP DOUGLAS WI 668.00 44.26 66263.47 AIR FORCE W K KELLOGG AIRPORT BATTLE CREEK MI 406.00 43.02 105955.67 AIR FORCE WESTOVER AIR RESERVE BASE UNKNOWN MA 1651.20 161.65 97898.50 AIR FORCE WHITEMAN AIR FORCE BASE KNOB NOSTER MO 3773.48 509.66 135063.51 AIR FORCE WILL ROGERS WORLD AIRPORT OKLAHOMA CITY OK 360.64 27.07 75057.40
AIR FORCE WILLOW GROVE AIR RESERVE STATION HORSHAM PA 505.12 36.73 72711.87
AIR FORCE WRIGHT PATTERSON AIR FORCE BASE
WRIGHT-PATTERSON AFB OH 16482.00 2875.94 174489.93
AIR FORCE YEAGER AIRPORT ANG UNKNOWN WV 436.93 41.10 94056.04 AIR FORCE YOKOTA AIR BASE YOKOTA AFB JPN 9098.72 1184.48 130180.40
AIR FORCE YOUNGSTOWN-WARREN REGIONAL AIRPORT ARS VIENNA OH 741.50 70.42 94962.91
NAVY CAMP LEMONNIER DJBOUTI DJI 1751.00 913.94 521952.60 NAVY CBC GULFPORT MS GULFPORT MS 4632.00 130.33 28136.44 NAVY CFA CHINHAE KOR KOR 419.00 27.48 65575.18 NAVY CFA OKINAWA JA JPN 841.00 52.72 62684.90 NAVY CFA SASEBO JA JPN 4482.00 279.73 62410.75 NAVY CFA YOKOSUKA JA JPN 13129.00 2777.75 211573.39

J-17
Component Installation Name City State / Country
Goal Subject Square Footage
(000 SqFt)
Goal Subject BBTU
Goal Subject Intensity
NAVY FRC EAST CHERRY POINT NC CHERRY POINT NC 2036.00 741.25 364073.67 NAVY JB PEARL HARBOR-HICKAM HI PEARL HARBOR HI 19604.00 1057.47 53941.59
NAVY JBAB WASHINGTON DC JOINT BASE ANACOSTIA
BOLLING DC 3490.00 412.90 118309.17
NAVY JEB LITTLE CREEK-FORT STORY VA VIRGINIA BEACH VA 5647.00 635.40 112519.04
NAVY NAF ATSUGI JA JPN 4204.00 512.43 121890.82 NAVY NAF EL CENTRO CA EL CENTRO CA 1194.00 69.13 57895.31 NAVY NAF MISAWA JA JPN 907.00 82.25 90680.26 NAVY NAS CORPUS CHRISTI TX CORPUS CHRISTI TX 2726.00 199.04 73014.31 NAVY NAS FALLON NV FALLON NV 2188.00 204.63 93523.31 NAVY NAS JACKSONVILLE FL JACKSONVILLE FL 8166.00 895.30 109637.77 NAVY NAS JRB FORT WORTH TX FORT WORTH TX 3325.00 239.18 71932.93 NAVY NAS JRB NEW ORLEANS LA NEW ORLEANS LA 2283.00 165.25 72383.27 NAVY NAS KEY WEST FL KEY WEST FL 2939.00 286.82 97590.00 NAVY NAS KINGSVILLE TX KINGSVILLE TX 1126.00 103.76 92147.42 NAVY NAS LEMOORE CA LEMOORE CA 3575.00 261.43 73126.71 NAVY NAS MERIDIAN MS MERIDIAN MS 1602.00 147.16 91860.17 NAVY NAS OCEANA VA VIRGINIA BEACH VA 7749.00 596.11 76927.73 NAVY NAS PATUXENT RIVER MD PATUXENT RIVER MD 8340.00 916.20 109856.59 NAVY NAS PENSACOLA FL PENSACOLA FL 11410.00 928.58 81383.35 NAVY NAS SIGONELLA IT ITA 3014.00 209.16 69394.82 NAVY NAS WHIDBEY ISLAND WA OAK HARBOR WA 3706.00 429.72 115952.24 NAVY NAS WHITING FIELD MILTON FL MILTON FL 1227.00 84.35 68747.35
NAVY NAVBASE CORONADO SAN DIEGO CA SAN DIEGO CA 13917.00 1242.50 89279.37

J-18
Component Installation Name City State / Country
Goal Subject Square Footage
(000 SqFt)
Goal Subject BBTU
Goal Subject Intensity
NAVY NAVBASE GUAM GU 10091.00 607.04 60156.18
NAVY NAVBASE KITSAP BREMERTON WA BREMERTON WA 15223.00 2213.24 145387.64
NAVY NAVBASE POINT LOMA CA SAN DIEGO CA 6317.00 403.27 63838.06 NAVY NAVBASE SAN DIEGO CA SAN DIEGO CA 9203.00 980.68 106560.69
NAVY NAVBASE VENTURA CTY PT MUGU CA POINT MUGU CA 9223.00 329.96 35775.67
NAVY NAVMAG INDIAN ISLAND WA PORT HADLOCK WA 376.00 17.14 45582.45 NAVY NAVSTA EVERETT WA EVERETT WA 1839.00 139.52 75868.95 NAVY NAVSTA GREAT LAKES IL GREAT LAKES IL 9528.00 1023.36 107405.12 NAVY NAVSTA GUANTANAMO BAY CU CUB 6506.00 1221.62 187768.83 NAVY NAVSTA MAYPORT FL JACKSONVILLE FL 2901.00 210.75 72645.64 NAVY NAVSTA NEWPORT RI NEWPORT RI 6003.00 594.49 99032.82 NAVY NAVSTA NORFOLK VA NORFOLK VA 15232.00 1854.36 121741.01 NAVY NAVSTA ROTA SP ESP 4339.00 194.75 44883.15 NAVY NAWS CHINA LAKE CA CHINA LAKE CA 4651.00 529.84 113918.73 NAVY NSA ANDERSEN GUAM GU 6977.00 330.38 47352.30 NAVY NSA ANNAPOLIS MD ANNAPOLIS MD 6078.00 639.06 105142.48 NAVY NSA BAHRAIN BHR 2775.00 251.09 90483.60 NAVY NSA BETHESDA MD BETHESDA MD 5638.00 1162.56 206201.14 NAVY NSA CRANE IN CRANE IN 4233.00 775.04 183094.26 NAVY NSA HAMPTON ROADS VA NORFOLK VA 6104.00 887.92 145465.27 NAVY NSA MECHANICSBURG PA MECHANICSBURG PA 11375.00 669.30 58839.38
NAVY NSA MID SOUTH MILLINGTON TN MILLINGTON TN 2757.00 209.60 76026.12
NAVY NSA MONTEREY CA MONTEREY CA 1825.00 140.58 77027.40 NAVY NSA NAPLES IT NAPLES ITA 5629.00 383.34 68100.02

J-19
Component Installation Name City State / Country
Goal Subject Square Footage
(000 SqFt)
Goal Subject BBTU
Goal Subject Intensity
NAVY NSA ORLANDO FL ORLANDO FL 308.00 23.99 77889.61
NAVY NSA PANAMA CITY FL PANAMA CITY BEACH FL 1483.00 120.81 81465.95
NAVY NSA SARATOGA SPRINGS NY SARATOGA SPRINGS NY 40.00 3.18 79475.00
NAVY NSA SOUDA BAY GR GRC 508.00 30.42 59885.83
NAVY NSA SOUTH POTOMAC DAHLGREN VA DAHLGREN VA 6297.00 1444.65 229418.61
NAVY NSA WASHINGTON DC WASHINGTON NAVY YARD DC 9776.00 1819.55 186123.87
NAVY NSF BEAUFORT SC BEAUFORT SC 431.00 68.19 158208.82 NAVY NSF DIEGO GARCIA IOT 2325.00 942.31 405294.19
NAVY NSS NORFOLK NAVAL SHIPYARD VA NORFOLK VA 7474.00 353.36 47279.10
NAVY NSY BOS PORTSMOUTH NH PORTSMOUTH NH 4455.00 1086.25 243827.38 NAVY PMRF BARKING SANDS HI KEKAHA HI 595.00 67.12 112813.45
NAVY SINGAPORE AREA COORDINATOR SGP 632.00 30.72 48599.68
NAVY SUBASE KINGS BAY GA KINGS BAY GA 5334.00 690.03 129364.45 NAVY SUBASE NEW LONDON CT GROTON CT 3225.00 724.98 224799.69 NAVY WPNSTA EARLE COLTS NECK NJ COLTS NECK NJ 1240.00 144.41 116459.68 NAVY WPNSTA SEAL BEACH CA SEAL BEACH CA 2033.00 78.98 38848.01 NAVY WPNSTA YORKTOWN VA YORKTOWN VA 6072.00 186.07 30643.45 MARINE CORPS CATC CAMP FUJI JA JPN 644.00 66.15 102720.50
MARINE CORPS
CG MCAGCC TWENTYNINE PALMS CA
TWENTYNINE PALMS CA 6800.00 1157.35 170198.53
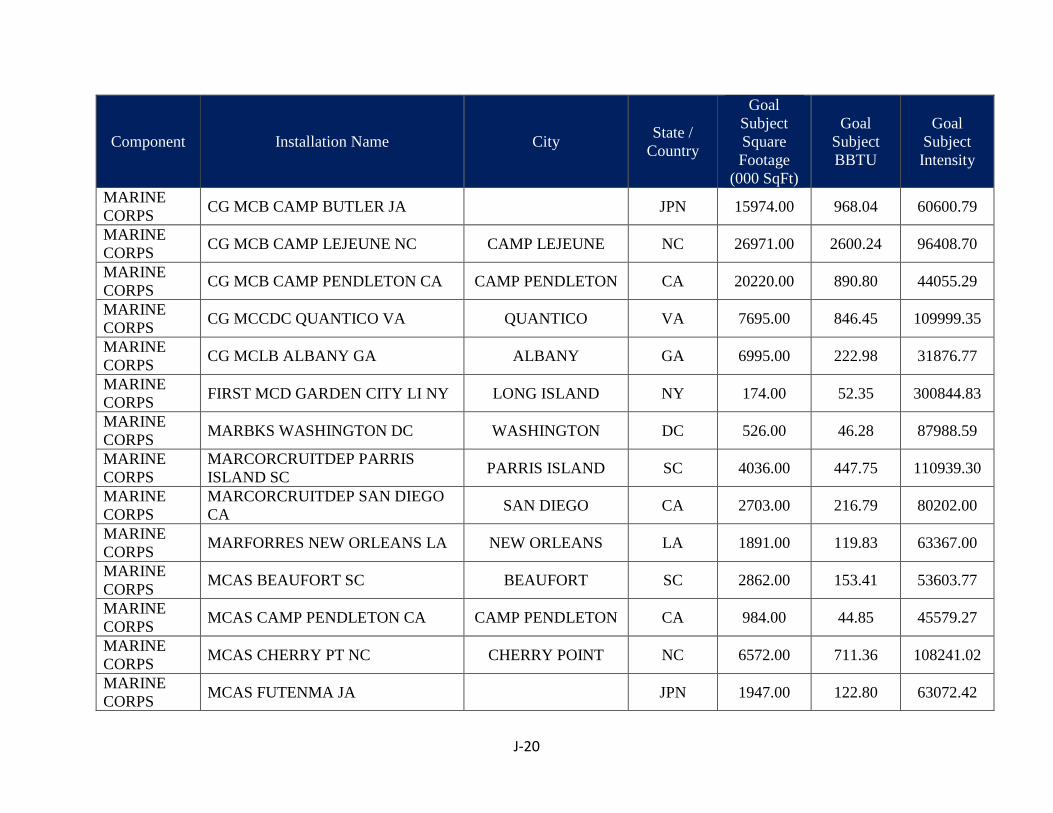
J-20
Component Installation Name City State / Country
Goal Subject Square Footage
(000 SqFt)
Goal Subject BBTU
Goal Subject Intensity
MARINE CORPS CG MCB CAMP BUTLER JA JPN 15974.00 968.04 60600.79
MARINE CORPS CG MCB CAMP LEJEUNE NC CAMP LEJEUNE NC 26971.00 2600.24 96408.70
MARINE CORPS CG MCB CAMP PENDLETON CA CAMP PENDLETON CA 20220.00 890.80 44055.29
MARINE CORPS CG MCCDC QUANTICO VA QUANTICO VA 7695.00 846.45 109999.35
MARINE CORPS CG MCLB ALBANY GA ALBANY GA 6995.00 222.98 31876.77
MARINE CORPS FIRST MCD GARDEN CITY LI NY LONG ISLAND NY 174.00 52.35 300844.83
MARINE CORPS MARBKS WASHINGTON DC WASHINGTON DC 526.00 46.28 87988.59
MARINE CORPS
MARCORCRUITDEP PARRIS ISLAND SC PARRIS ISLAND SC 4036.00 447.75 110939.30
MARINE CORPS
MARCORCRUITDEP SAN DIEGO CA SAN DIEGO CA 2703.00 216.79 80202.00
MARINE CORPS MARFORRES NEW ORLEANS LA NEW ORLEANS LA 1891.00 119.83 63367.00
MARINE CORPS MCAS BEAUFORT SC BEAUFORT SC 2862.00 153.41 53603.77
MARINE CORPS MCAS CAMP PENDLETON CA CAMP PENDLETON CA 984.00 44.85 45579.27
MARINE CORPS MCAS CHERRY PT NC CHERRY POINT NC 6572.00 711.36 108241.02
MARINE CORPS MCAS FUTENMA JA JPN 1947.00 122.80 63072.42

J-21
Component Installation Name City State / Country
Goal Subject Square Footage
(000 SqFt)
Goal Subject BBTU
Goal Subject Intensity
MARINE CORPS MCAS IWAKUNI JA JPN 7275.00 751.70 103326.19
MARINE CORPS MCAS MIRAMAR CA SAN DIEGO CA 6154.00 299.77 48710.76
MARINE CORPS MCAS YUMA AZ YUMA AZ 3132.00 192.36 61417.62
MARINE CORPS MCB CAMP MUJUK KOR 292.00 27.87 95431.51
MARINE CORPS MCB HAWAII KANEOHE BAY HI KANEOHE BAY HI 6342.00 286.43 45164.30
MARINE CORPS MCLB BARSTOW CA BARSTOW CA 4648.00 256.49 55182.87
MARINE CORPS MCMWTC BRIDGEPORT CA BRIDGEPORT CA 318.00 37.88 119132.08
MARINE CORPS MCSF BLOUNT ISLAND FL JACKSONVILLE FL 978.00 28.94 29587.93
MARINE CORPS
NAVAL HOSPITAL CAMP LEJEUNE NC CAMP LEJEUNE NC 950.00 136.79 143989.47
MARINE CORPS
NAVAL HOSPITAL CAMP PENDLETON CA CAMP PENDLETON CA 926.00 124.25 134182.51
MARINE CORPS NAVAL HOSPITAL OKINAWA JA JPN 716.00 155.95 217808.66
DCMA DCMA (1) BRATENAHL OH 77.67 9.02 116111.09 DCMA DCMA (2) CARSON CA 85.00 8.77 103176.47
DECA 88TH REGIONAL SUPPORT COMMAND INDIANAPOLIS IN 54.02 7.38 136579.04
DECA 99TH REGIONAL SUPPORT COMMAND CORAOPOLIS PA 43.09 7.19 166879.42

J-22
Component Installation Name City State / Country
Goal Subject Square Footage
(000 SqFt)
Goal Subject BBTU
Goal Subject Intensity
DECA ABERDEEN PROVING GROUND ABERDEEN MD 62.24 7.77 124871.47 DECA ALTUS AIR FORCE BASE UNKNOWN OK 57.78 8.15 141062.03
DECA ARNOLD AIR STATION ARNOLD A F STATION TN 23.19 4.25 183150.81
DECA AVIANO AIR BASE UNKNOWN ITA 64.44 7.13 110593.86
DECA BANGOR INTERNATIONAL AIRPORT (ANG) UNKNOWN ME 29.00 5.05 174034.48
DECA BARKSDALE AIR FORCE BASE BARKSDALE AF BASE LA 103.85 11.10 106879.42
DECA BEALE AIR FORCE BASE BEALE AFB CA 88.00 13.41 152375.00 DECA BEALE AIR FORCE BASE BEALE AFB CA 37.27 7.68 206037.03 DECA BEALE AIR FORCE BASE BEALE AFB CA 75.28 6.57 87323.83 DECA BUCKLEY AIR FORCE BASE AURORA CO 77.43 9.15 118181.11 DECA CAMP CASEY TONG DU CHON KOR 17.20 3.20 185951.85 DECA CAMP HENRY TAEGU KOR 37.79 5.05 133636.77 DECA CAMP HENRY TAEGU KOR 16.03 2.06 128229.13 DECA CAMP HENRY TAEGU KOR 8.10 1.11 136492.66 DECA CAMP HUMPHREYS UNKNOWN KOR 19.19 4.24 221023.56 DECA CAMP RED CLOUD UIJONG BU KOR 10.85 0.76 70046.08 DECA CAMP RED CLOUD UIJONG BU KOR 10.40 0.59 56239.18 DECA CAMP ZAMA SAGAMIHARA JPN 186.02 8.03 43150.81 DECA CAMP ZAMA SAGAMIHARA JPN 67.11 5.89 87706.75 DECA CAMP ZAMA SAGAMIHARA JPN 12.90 1.68 130030.24 DECA CAMP ZAMA SAGAMIHARA JPN 1.84 0.58 317218.90 DECA CANNON AIR FORCE BASE CANNON AFB NM 58.28 6.27 107563.23 DECA CARLISLE BARRACKS CARLISLE PA 59.87 6.07 101301.13 DECA CBC GULFPORT MS GULFPORT MS 30.89 8.26 267203.99

J-23
Component Installation Name City State / Country
Goal Subject Square Footage
(000 SqFt)
Goal Subject BBTU
Goal Subject Intensity
DECA CHARLESTON AIR FORCE BASE UNKNOWN SC 86.35 11.46 132663.93 DECA CHARLESTON AIR FORCE BASE UNKNOWN SC 63.73 10.65 167100.76 DECA COLUMBUS AIR FORCE BASE COLUMBUS MS 48.95 4.42 90314.80
DECA COMBAT SUPPORT TRAINING CENTER AND CAMP PARKS DUBLIN CA 7.80 1.57 201153.85
DECA COMFLEACT SASEBO JA SASEBO JPN 24.00 3.27 136041.67 DECA COMFLEACT SASEBO JA SASEBO JPN 19.77 2.05 103620.92 DECA COMFLEACT YOKOSUKA JA YOKOSUKA JPN 96.26 16.62 172652.38 DECA COMFLEACT YOKOSUKA JA YOKOSUKA JPN 85.96 15.91 185097.72 DECA CSO NAS MOFFETT FIELD CA MOFFETT FIELD CA 51.94 3.34 64252.16
DECA DAVIS-MONTHAN AIR FORCE BASE TUCSON AZ 114.90 14.08 122502.09
DECA DOVER AIR FORCE BASE UNKNOWN DE 78.38 5.65 72062.88 DECA DUGWAY PROVING GROUND DUGWAY UT 18.11 2.58 142241.86 DECA DYESS AIR FORCE BASE ABILENE TX 79.54 6.86 86267.80 DECA EDWARDS AIR FORCE BASE LANCASTER CA 60.39 6.70 110864.56 DECA EGLIN AIR FORCE BASE VALPARAISO FL 106.84 15.35 143621.95 DECA EGLIN AIR FORCE BASE VALPARAISO FL 63.31 12.07 190727.43 DECA EIELSON AIR FORCE BASE UNKNOWN AK 41.89 7.00 167056.58 DECA ELLSWORTH AIR FORCE BASE ELLSWORTH AFB SD 72.48 8.93 123190.91 DECA FAIRCHILD AIR FORCE BASE AIRWAY HEIGHTS WA 84.78 11.95 140953.05 DECA FLEET ACTIVITIES CHINHAE KS CHINHAE KOR 11.30 2.16 191238.94 DECA FORT BELVOIR FORT BELVOIR VA 141.84 19.18 135220.88 DECA FORT BENNING COLUMBUS GA 117.81 14.60 123919.87 DECA FORT BENNING COLUMBUS GA 2.90 0.36 124654.70 DECA FORT BLISS EL PASO TX 122.60 13.21 107756.93 DECA FORT BRAGG FORT BRAGG NC 95.33 16.53 173400.89

J-24
Component Installation Name City State / Country
Goal Subject Square Footage
(000 SqFt)
Goal Subject BBTU
Goal Subject Intensity
DECA FORT BRAGG FORT BRAGG NC 118.26 15.21 128580.01 DECA FORT BUCHANAN GUAYNABO PR 95.07 12.17 128017.67 DECA FORT CAMPBELL FORT CAMPBELL KY 121.87 14.87 121992.65
DECA FORT CARSON COLORADO SPRINGS CO 121.96 15.47 126840.71
DECA FORT DETRICK FREDERICK MD 39.28 6.41 163089.69 DECA FORT DETRICK FREDERICK MD 57.97 6.37 109917.03 DECA FORT DRUM EVANS MILLS NY 82.80 12.88 155507.25 DECA FORT GEORGE G MEADE FORT MEADE MD 118.00 15.61 132271.19 DECA FORT GORDON AUGUSTA GA 92.22 12.20 132286.61 DECA FORT GREELY DELTA JUNCTION AK 24.68 5.30 214812.41 DECA FORT HAMILTON NEW YORK CITY NY 50.34 9.16 181922.92 DECA FORT HOOD KILLEEN TX 127.78 20.78 162620.52 DECA FORT HOOD KILLEEN TX 105.66 9.28 87829.72 DECA FORT HUACHUCA SIERRA VISTA AZ 77.56 9.65 124442.38 DECA FORT JACKSON COLUMBIA SC 130.00 10.71 82407.69 DECA FORT KNOX MIDDLETOWN KY 121.84 11.79 96764.66
DECA FORT LEAVENWORTH FORT LEAVENWORTH KS 74.26 11.20 150783.07
DECA FORT LEE FORT LEE VA 242.18 27.54 113703.27 DECA FORT LEE FORT LEE VA 80.77 10.58 131031.24
DECA FORT LEONARD WOOD FORT LEONARD WOOD MO 70.99 11.24 158369.26
DECA FORT MCCOY SPARTA WI 15.93 3.76 236295.13 DECA FORT POLK FORT POLK LA 82.43 10.87 131916.39 DECA FORT RILEY FORT RILEY KS 112.68 15.72 139536.74 DECA FORT RUCKER FORT RUCKER AL 83.55 8.71 104246.46

J-25
Component Installation Name City State / Country
Goal Subject Square Footage
(000 SqFt)
Goal Subject BBTU
Goal Subject Intensity
DECA FORT SILL FORT SILL OK 101.57 13.66 134498.38 DECA FORT STEWART HINESVILLE GA 94.51 11.29 119422.72 DECA FORT STEWART HINESVILLE GA 57.70 7.24 125459.27
DECA FORT WAINWRIGHT FORT WAINWRIGHT AK 104.49 21.74 208090.49
DECA FRANCIS E WARREN AIR FORCE BASE CHEYENNE WY 77.43 6.69 86392.17
DECA GOODFELLOW AIR FORCE BASE UNKNOWN TX 57.15 7.26 127077.72 DECA GRAND FORKS AIR FORCE BASE GRAND FORKS AFB ND 41.25 3.79 91982.45 DECA HANSCOM AIR FORCE BASE BEDFORD MA 73.50 10.45 142221.56 DECA HILL AIR FORCE BASE UNKNOWN UT 86.90 12.48 143656.14 DECA HOLLOMAN AIR FORCE BASE UNKNOWN NM 68.66 3.47 50507.55 DECA INCIRLIK AIR BASE ADANA UNKNOWN TUR 67.20 6.00 89228.85 DECA INCIRLIK AIR BASE ADANA UNKNOWN TUR 14.79 1.50 101494.35 DECA JBAB ANACOSTIA BOLLING WASHINGTON, DC DC 71.82 11.72 163111.58
DECA JBPHH PEARL HARBOR - HICKAM HAWAII PEARL HARBOR HI 115.41 12.62 109368.50
DECA JBPHH PEARL HARBOR - HICKAM HAWAII PEARL HARBOR HI 98.47 9.81 99638.45
DECA JBSA - FORT SAM HOUSTON FORT SAM HOUSTON TX 104.44 15.48 148254.53
DECA JBSA - LACKLAND UNKNOWN TX 116.75 14.25 122074.90 DECA JBSA - RANDOLPH UNKNOWN TX 96.78 15.31 158164.48
DECA JNTEXPBASE LITTLE CREEK FS VA NORFOLK VA 100.12 11.91 118988.40
DECA JOINT BASE ANDREWS-NAVAL AIR FACILITY WASHINGTON ANDREWS AFB MD 113.41 16.12 142147.96
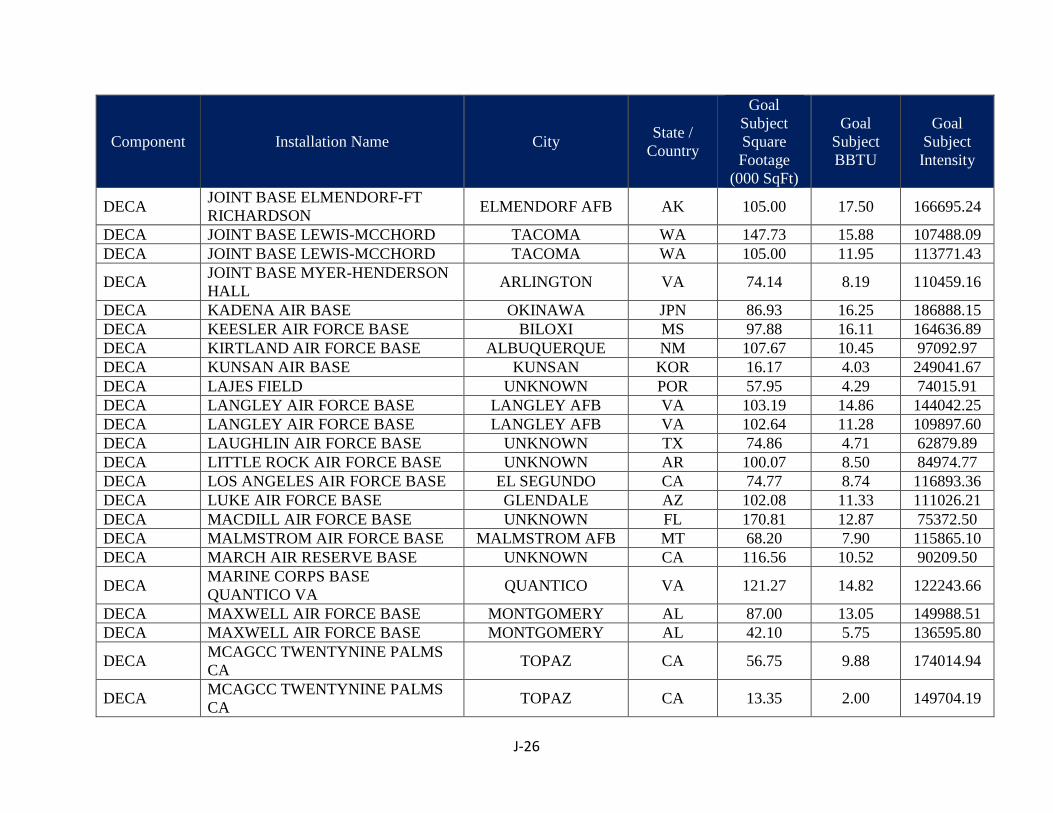
J-26
Component Installation Name City State / Country
Goal Subject Square Footage
(000 SqFt)
Goal Subject BBTU
Goal Subject Intensity
DECA JOINT BASE ELMENDORF-FT RICHARDSON ELMENDORF AFB AK 105.00 17.50 166695.24
DECA JOINT BASE LEWIS-MCCHORD TACOMA WA 147.73 15.88 107488.09 DECA JOINT BASE LEWIS-MCCHORD TACOMA WA 105.00 11.95 113771.43
DECA JOINT BASE MYER-HENDERSON HALL ARLINGTON VA 74.14 8.19 110459.16
DECA KADENA AIR BASE OKINAWA JPN 86.93 16.25 186888.15 DECA KEESLER AIR FORCE BASE BILOXI MS 97.88 16.11 164636.89 DECA KIRTLAND AIR FORCE BASE ALBUQUERQUE NM 107.67 10.45 97092.97 DECA KUNSAN AIR BASE KUNSAN KOR 16.17 4.03 249041.67 DECA LAJES FIELD UNKNOWN POR 57.95 4.29 74015.91 DECA LANGLEY AIR FORCE BASE LANGLEY AFB VA 103.19 14.86 144042.25 DECA LANGLEY AIR FORCE BASE LANGLEY AFB VA 102.64 11.28 109897.60 DECA LAUGHLIN AIR FORCE BASE UNKNOWN TX 74.86 4.71 62879.89 DECA LITTLE ROCK AIR FORCE BASE UNKNOWN AR 100.07 8.50 84974.77 DECA LOS ANGELES AIR FORCE BASE EL SEGUNDO CA 74.77 8.74 116893.36 DECA LUKE AIR FORCE BASE GLENDALE AZ 102.08 11.33 111026.21 DECA MACDILL AIR FORCE BASE UNKNOWN FL 170.81 12.87 75372.50 DECA MALMSTROM AIR FORCE BASE MALMSTROM AFB MT 68.20 7.90 115865.10 DECA MARCH AIR RESERVE BASE UNKNOWN CA 116.56 10.52 90209.50
DECA MARINE CORPS BASE QUANTICO VA QUANTICO VA 121.27 14.82 122243.66
DECA MAXWELL AIR FORCE BASE MONTGOMERY AL 87.00 13.05 149988.51 DECA MAXWELL AIR FORCE BASE MONTGOMERY AL 42.10 5.75 136595.80
DECA MCAGCC TWENTYNINE PALMS CA TOPAZ CA 56.75 9.88 174014.94
DECA MCAGCC TWENTYNINE PALMS CA TOPAZ CA 13.35 2.00 149704.19

J-27
Component Installation Name City State / Country
Goal Subject Square Footage
(000 SqFt)
Goal Subject BBTU
Goal Subject Intensity
DECA MCAS CHERRY POINT NC CHERRY POINT NC 59.25 6.66 112397.48 DECA MCAS IWAKUNI JA IWAKUNI JPN 53.88 8.46 157045.81 DECA MCAS MIRAMAR SAN DIEGO CA 90.81 11.67 128501.89 DECA MCAS YUMA AZ YUMA AZ 33.77 4.62 136679.99 DECA MCB CAMP LEJEUNE NC CAMP LEJEUNE NC 75.60 8.40 111075.84 DECA MCB CAMP LEJEUNE NC CAMP LEJEUNE NC 46.12 6.27 136039.38 DECA MCB CAMP PENDLETON CA CAMP PENDLETON CA 113.35 13.84 122077.53 DECA MCB CAMP PENDLETON CA CAMP PENDLETON CA 20.23 2.97 146648.87
DECA MCB CAMP S D BUTLER OKINAWA JA ZUKERAN JPN 290.58 11.66 40136.41
DECA MCB CAMP S D BUTLER OKINAWA JA ZUKERAN JPN 58.93 7.84 132966.81
DECA MCB CAMP S D BUTLER OKINAWA JA ZUKERAN JPN 31.25 5.38 172080.52
DECA MCB CAMP S D BUTLER OKINAWA JA ZUKERAN JPN 31.49 5.23 166079.09
DECA MCB HAWAII KANEOHE KANEOHE HI 76.90 12.74 165695.71 DECA MCCONNELL AIR FORCE BASE WICHITA KS 55.88 7.07 126547.85 DECA MCGUIRE AIR FORCE BASE MCGUIRE AFB NJ 103.00 14.01 135980.58 DECA MCGUIRE AIR FORCE BASE MCGUIRE AFB NJ 18.41 1.36 73597.31 DECA MCLB ALBANY GA ALBANY GA 36.67 5.80 158121.52 DECA MCLB BARSTOW CA BARSTOW CA 22.02 3.11 141351.74 DECA MCRD BEAUFORT PI SC PARRIS ISLAND SC 44.22 3.64 82383.54 DECA MCSPTACT KANSAS CITY MO BELTON MO 23.52 2.96 125786.43 DECA MINOT AIR FORCE BASE MINOT AFB ND 56.42 7.89 139806.10 DECA MISAWA AIR BASE MISAWA AFB JPN 82.46 9.52 115472.77 DECA MOODY AIR FORCE BASE MOODY AF BASE GA 64.26 8.87 138013.13
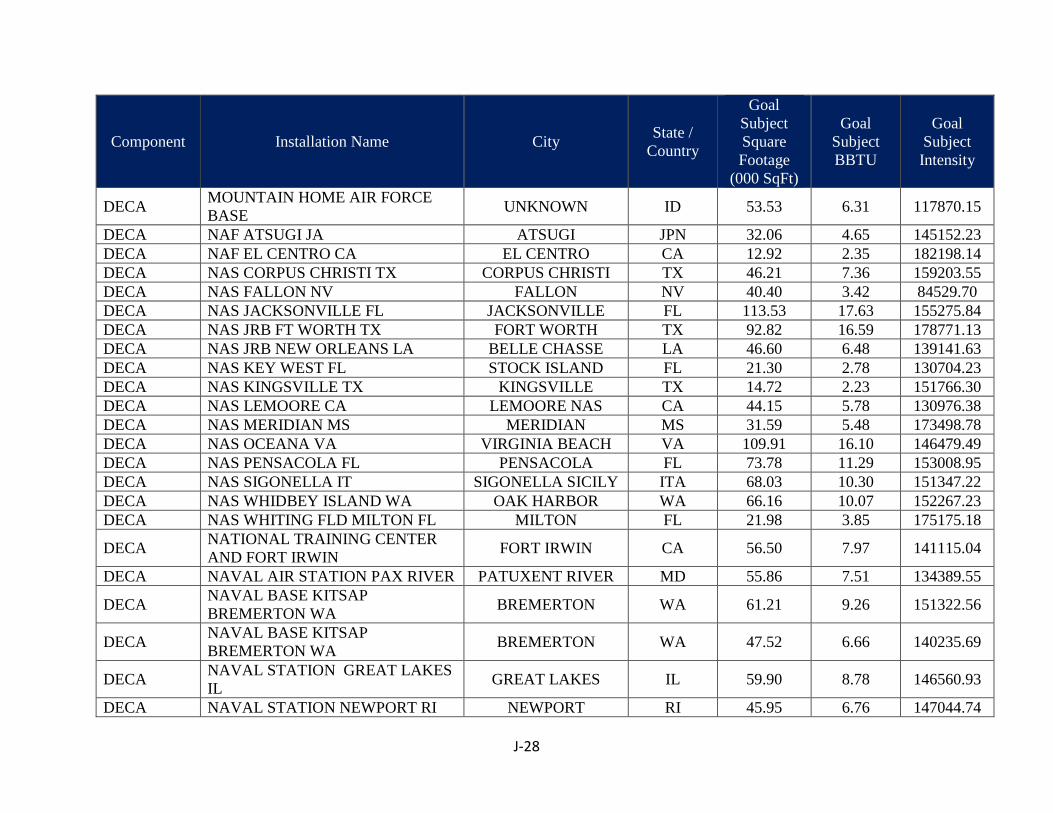
J-28
Component Installation Name City State / Country
Goal Subject Square Footage
(000 SqFt)
Goal Subject BBTU
Goal Subject Intensity
DECA MOUNTAIN HOME AIR FORCE BASE UNKNOWN ID 53.53 6.31 117870.15
DECA NAF ATSUGI JA ATSUGI JPN 32.06 4.65 145152.23 DECA NAF EL CENTRO CA EL CENTRO CA 12.92 2.35 182198.14 DECA NAS CORPUS CHRISTI TX CORPUS CHRISTI TX 46.21 7.36 159203.55 DECA NAS FALLON NV FALLON NV 40.40 3.42 84529.70 DECA NAS JACKSONVILLE FL JACKSONVILLE FL 113.53 17.63 155275.84 DECA NAS JRB FT WORTH TX FORT WORTH TX 92.82 16.59 178771.13 DECA NAS JRB NEW ORLEANS LA BELLE CHASSE LA 46.60 6.48 139141.63 DECA NAS KEY WEST FL STOCK ISLAND FL 21.30 2.78 130704.23 DECA NAS KINGSVILLE TX KINGSVILLE TX 14.72 2.23 151766.30 DECA NAS LEMOORE CA LEMOORE NAS CA 44.15 5.78 130976.38 DECA NAS MERIDIAN MS MERIDIAN MS 31.59 5.48 173498.78 DECA NAS OCEANA VA VIRGINIA BEACH VA 109.91 16.10 146479.49 DECA NAS PENSACOLA FL PENSACOLA FL 73.78 11.29 153008.95 DECA NAS SIGONELLA IT SIGONELLA SICILY ITA 68.03 10.30 151347.22 DECA NAS WHIDBEY ISLAND WA OAK HARBOR WA 66.16 10.07 152267.23 DECA NAS WHITING FLD MILTON FL MILTON FL 21.98 3.85 175175.18
DECA NATIONAL TRAINING CENTER AND FORT IRWIN FORT IRWIN CA 56.50 7.97 141115.04
DECA NAVAL AIR STATION PAX RIVER PATUXENT RIVER MD 55.86 7.51 134389.55
DECA NAVAL BASE KITSAP BREMERTON WA BREMERTON WA 61.21 9.26 151322.56
DECA NAVAL BASE KITSAP BREMERTON WA BREMERTON WA 47.52 6.66 140235.69
DECA NAVAL STATION GREAT LAKES IL GREAT LAKES IL 59.90 8.78 146560.93
DECA NAVAL STATION NEWPORT RI NEWPORT RI 45.95 6.76 147044.74
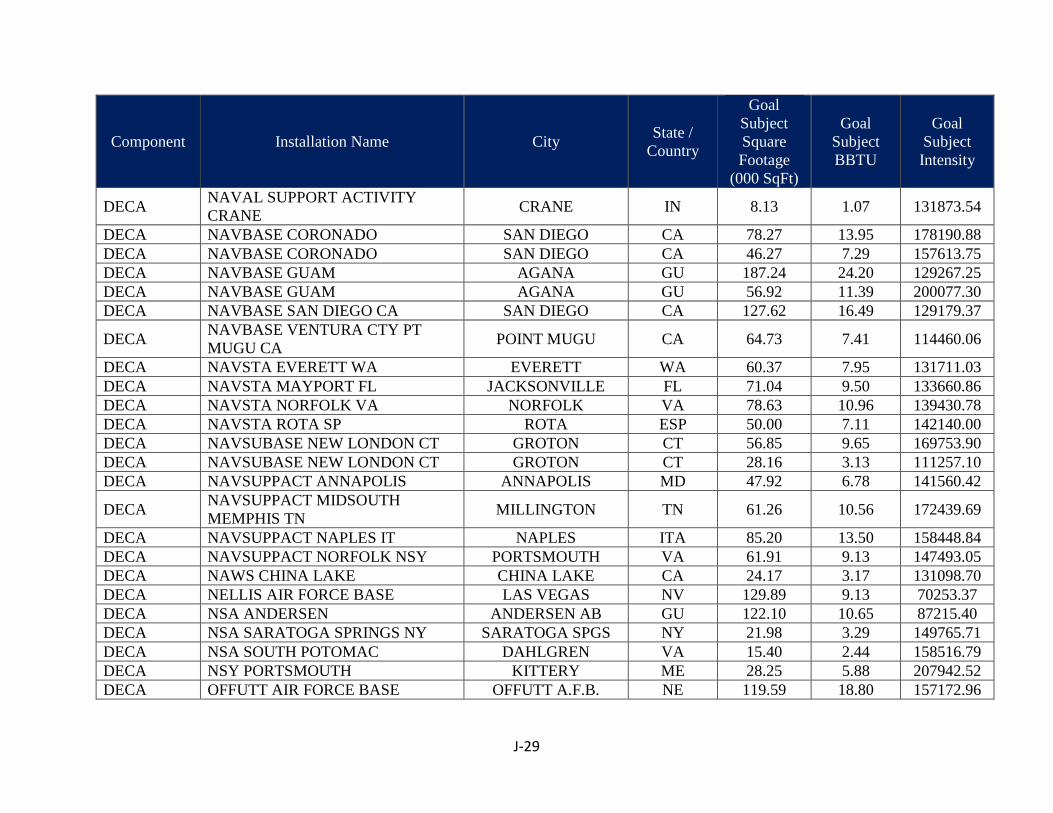
J-29
Component Installation Name City State / Country
Goal Subject Square Footage
(000 SqFt)
Goal Subject BBTU
Goal Subject Intensity
DECA NAVAL SUPPORT ACTIVITY CRANE CRANE IN 8.13 1.07 131873.54
DECA NAVBASE CORONADO SAN DIEGO CA 78.27 13.95 178190.88 DECA NAVBASE CORONADO SAN DIEGO CA 46.27 7.29 157613.75 DECA NAVBASE GUAM AGANA GU 187.24 24.20 129267.25 DECA NAVBASE GUAM AGANA GU 56.92 11.39 200077.30 DECA NAVBASE SAN DIEGO CA SAN DIEGO CA 127.62 16.49 129179.37
DECA NAVBASE VENTURA CTY PT MUGU CA POINT MUGU CA 64.73 7.41 114460.06
DECA NAVSTA EVERETT WA EVERETT WA 60.37 7.95 131711.03 DECA NAVSTA MAYPORT FL JACKSONVILLE FL 71.04 9.50 133660.86 DECA NAVSTA NORFOLK VA NORFOLK VA 78.63 10.96 139430.78 DECA NAVSTA ROTA SP ROTA ESP 50.00 7.11 142140.00 DECA NAVSUBASE NEW LONDON CT GROTON CT 56.85 9.65 169753.90 DECA NAVSUBASE NEW LONDON CT GROTON CT 28.16 3.13 111257.10 DECA NAVSUPPACT ANNAPOLIS ANNAPOLIS MD 47.92 6.78 141560.42
DECA NAVSUPPACT MIDSOUTH MEMPHIS TN MILLINGTON TN 61.26 10.56 172439.69
DECA NAVSUPPACT NAPLES IT NAPLES ITA 85.20 13.50 158448.84 DECA NAVSUPPACT NORFOLK NSY PORTSMOUTH VA 61.91 9.13 147493.05 DECA NAWS CHINA LAKE CHINA LAKE CA 24.17 3.17 131098.70 DECA NELLIS AIR FORCE BASE LAS VEGAS NV 129.89 9.13 70253.37 DECA NSA ANDERSEN ANDERSEN AB GU 122.10 10.65 87215.40 DECA NSA SARATOGA SPRINGS NY SARATOGA SPGS NY 21.98 3.29 149765.71 DECA NSA SOUTH POTOMAC DAHLGREN VA 15.40 2.44 158516.79 DECA NSY PORTSMOUTH KITTERY ME 28.25 5.88 207942.52 DECA OFFUTT AIR FORCE BASE OFFUTT A.F.B. NE 119.59 18.80 157172.96

J-30
Component Installation Name City State / Country
Goal Subject Square Footage
(000 SqFt)
Goal Subject BBTU
Goal Subject Intensity
DECA OSAN AIR BASE OSAN AFB KOR 48.60 5.26 108182.62 DECA OSAN AIR BASE OSAN AFB KOR 60.36 5.02 83080.70 DECA PATRICK AIR FORCE BASE PATRICK AFB FL 102.63 9.31 90697.38
DECA PETERSON AIR FORCE BASE COLORADO SPRINGS CO 102.33 12.77 124777.67
DECA PICATINNY ARSENAL DOVER NJ 22.00 4.02 182590.91 DECA PRESIDIO OF MONTEREY MONTEREY CA 111.31 12.68 113886.07 DECA RAF ALCONBURY UNKNOWN GBR 77.14 10.98 142386.77 DECA RAF CROUGHTON UNKNOWN GBR 19.50 3.14 160736.26 DECA RAF LAKENHEATH LAKENHEATH GBR 111.79 18.42 164785.23 DECA RAF MENWITH HILL UNKNOWN GBR 34.37 4.79 139204.05 DECA RAF MILDENHALL MILDENHALL GBR 13.80 2.24 162536.23 DECA RAMSTEIN AIR BASE RAMSTEIN DEU 177.61 24.34 137038.75 DECA RAMSTEIN AIR BASE RAMSTEIN DEU 95.05 12.72 133775.92 DECA RAMSTEIN AIR BASE RAMSTEIN DEU 58.56 10.25 175023.05 DECA RAMSTEIN AIR BASE RAMSTEIN DEU 40.51 7.45 183927.91 DECA RAMSTEIN AIR BASE RAMSTEIN DEU 37.29 2.10 56185.80 DECA REDSTONE ARSENAL HUNTSVILLE AL 80.90 11.35 140284.30 DECA ROBINS AIR FORCE BASE ROBINS AF BASE GA 70.23 10.13 144234.19 DECA ROCK ISLAND ARSENAL ROCK ISLAND IL 33.26 2.73 82140.71 DECA SCHOFIELD BARRACKS WAHIAWA HI 91.93 11.13 121076.96 DECA SCOTT AIR FORCE BASE BELLEVILLE IL 113.65 17.65 155289.83 DECA SELFRIDGE ANG BASE MOUNT CLEMENS MI 75.77 7.38 97344.67
DECA SEYMOUR JOHNSON AIR FORCE BASE
SEYMOUR JOHNSON AFB NC 65.66 8.93 136001.58
DECA SHAW AIR FORCE BASE SHAW AF BASE SC 60.57 9.21 152038.96 DECA SHEPPARD AIR FORCE BASE WICHITA FALLS TX 80.67 8.55 105950.17

J-31
Component Installation Name City State / Country
Goal Subject Square Footage
(000 SqFt)
Goal Subject BBTU
Goal Subject Intensity
DECA SPANGDAHLEM AIR BASE UNKNOWN DEU 54.02 8.83 163491.62 DECA SUBASE KINGS BAY GA KINGS BAY GA 52.56 7.99 151952.20 DECA TINKER AIR FORCE BASE OKLAHOMA CITY OK 87.03 10.92 125478.30 DECA TOBYHANNA ARMY DEPOT TOBYHANNA PA 22.03 2.85 129556.49 DECA TRAVIS AIR FORCE BASE FAIRFIELD CA 96.50 13.72 142145.08 DECA TYNDALL AIR FORCE BASE UNKNOWN FL 76.37 8.25 108006.18 DECA US ARMY GARRISON ANSBACH ANSBACH DEU 57.51 8.19 142367.81
DECA US ARMY GARRISON BAUMHOLDER BAUMHOLDER DEU 31.87 6.04 189537.77
DECA US ARMY GARRISON BENELUX BRUSSELS BEL 46.47 8.55 183976.07
DECA US ARMY GARRISON GRAFENWOEHR GRAFENWOHR DEU 55.22 11.07 200412.89
DECA US ARMY GARRISON GRAFENWOEHR GRAFENWOHR DEU 51.85 6.45 124349.13
DECA US ARMY GARRISON GRAFENWOEHR GRAFENWOHR DEU 13.65 0.99 72768.58
DECA US ARMY GARRISON HEIDELBERG HEIDELBERG DEU 789.30 20.85 26409.44
DECA US ARMY GARRISON HOHENFELS HOHENFELS DEU 38.20 5.36 140261.78
DECA US ARMY GARRISON LIVORNO LIVORNO ITA 26.46 3.97 150022.68 DECA US ARMY GARRISON SCHINNEN SCHINNEN NLD 24.01 5.27 219454.28
DECA US ARMY GARRISON STUTTGART STUTTGART DEU 64.32 6.50 101114.69
DECA US ARMY GARRISON STUTTGART STUTTGART DEU 40.97 2.85 69494.96
DECA US ARMY GARRISON STUTTGART STUTTGART DEU 5.29 2.14 404122.54

J-32
Component Installation Name City State / Country
Goal Subject Square Footage
(000 SqFt)
Goal Subject BBTU
Goal Subject Intensity
DECA US ARMY GARRISON STUTTGART STUTTGART DEU 18.18 1.63 89804.22
DECA US ARMY GARRISON VICENZA VICENZA ITA 54.59 8.77 160590.63
DECA US ARMY GARRISON WIESBADEN WIESBADEN DEU 61.88 10.56 170701.36
DECA USAF ACADEMY AIR FORCE ACADEMY CO 66.69 9.06 135895.40
DECA VANCE AIR FORCE BASE ENID OK 34.30 5.23 152464.80 DECA VANDENBERG AIR FORCE BASE LOMPOC CA 83.29 6.18 74141.22
DECA WEST POINT MILITARY RESERVATION WEST POINT NY 73.22 11.61 158492.78
DECA WHITE SANDS MISSILE RANGE LAS CRUCES NM 32.00 4.26 133031.25 DECA WHITEMAN AIR FORCE BASE KNOB NOSTER MO 60.73 7.92 130392.54
DECA WRIGHT PATTERSON AIR FORCE BASE
WRIGHT-PATTERSON AFB OH 123.03 14.17 115177.97
DECA YOKOTA AIR BASE YOKOTA AFB JPN 81.44 19.60 240723.00 DECA YONGSAN GARRISON SEOUL KOR 94.48 15.01 158857.34 DECA YONGSAN GARRISON SEOUL KOR 88.64 2.97 33472.10 DECA YONGSAN GARRISON SEOUL KOR 7.05 1.33 187889.96 DECA YUMA PROVING GROUND YUMA AZ 22.73 2.57 113178.50 DFAS DFAS LIMESTONE LIMESTONE ME 141000.00 10.45 74.12 DFAS DFAS ROME ROME NY 332000.00 140.15 422.15 DIA DLOC WAREHOUSE LANDOVER MD 267.00 12.78 47857.68
DIA JOINT BASE ANACOSTIA BOLLING WASHINGTON DC 1325.00 219.72 165827.17
DIA ROWE BLDG AND ULC 1/RIVANNA STATION CHARLOTTESVILLE VA 184.00 32.14 174668.48

J-33
Component Installation Name City State / Country
Goal Subject Square Footage
(000 SqFt)
Goal Subject BBTU
Goal Subject Intensity
DLA DEFENSE DISTRIBUTION DEPOT SAN JOAQUIN TRACY CA 5279.36 103.40 19586.28
DLA DEFENSE DISTRIBUTION DEPOT SUSQUEHANNA
NEW CUMBERLAND PA 7709.00 313.75 40698.53
DLA DEFENSE SUPPLY CENTER COLUMBUS COLUMBUS OH 3841.00 283.29 73752.96
DLA DEFENSE SUPPLY CENTER RICHMOND RICHMOND VA 4579.00 232.67 50812.84
NRO BUCKLEY AIR FORCE BASE AURORA CO 1254980.00 372.57 296.87 NRO FORT BELVOIR FT BELVOIR VA 1453656.00 425.42 292.65 NRO NRO HEADQUARTERS CHANTILLY VA 1520079.00 173.57 114.19 NRO PATRICK AIR FORCE BASE PATRICK AFB FL 759704.00 70.40 92.67 NRO VANDENBERG AIR FORCE BASE LOMPOC CA 434748.00 37.12 85.37 NRO WHITE SANDS MISSILE RANGE LAS CRUCES NM 234964.00 80.49 342.55 NSA FORT GEORGE G MEADE FORT MEADE MD 13967.70 2670.40 191183.00 WHS MARK CENTER ALEXANDRIA VA 1876.11 109.61 58423.48
WHS WASHINGTON HQS SERVICE PENTAGON, ARLINGTON VA 6967.11 1053.12 151156.46

K-1
Appendix K - References Energy Information Administration (EIA), Annual Energy Review, Table 1.11 U.S. Government Energy Consumption by Agency, Fiscal Years 1975-2011 [online source] (Washington, D.C. September 27, 2012, accessed May 15, 2018), available from: http://www.eia.gov/totalenergy/data/annual/showtext.cfm?t=ptb0111. Energy Information Administration, 2017 Monthly Commercial Sector Energy Use, Table 2.1a [online source] (Washington, D.C. April 26 24, 2018 accessed April 27, 2018), available from http://www.eia.gov/totalenergy/data/monthly/ Energy Information Administration, 2017 Monthly Commercial Sector Energy Use, Table 2.1c [online source] (Washington, D.C. April 26 24, 2018 accessed April 27, 2018), available from http://www.eia.gov/totalenergy/data/monthly/ Energy Information Administration (EIA), U.S. Overview [online source] (Washington, D.C. 2011, accessed May 15, 2018), available from: http://www.eia.gov/state/seds/data.cfm?incfile=/state/seds/sep_sum/html/rank_use_gdp.html&sid=US. U.S. Census Bureau, Census Regions and Division of the United States, [online source] (Washington, D.C., 2014, accessed March 24 2017), available from: https://www2.census.gov/geo/pdfs/maps-data/maps/reference/us_regdiv.pdf U.S. Department of Energy (DOE), Energy Efficiency and Renewable Energy, Federal Energy Management Program, Comprehensive Annual Energy Data and Sustainability Performance [online source] (Washington, D.C.,2017, accessed May 15, 2018 available from: http://ctsedwweb.ee.doe.gov/Annual/Report/TotalSiteDeliveredEnergyConsumptionPerGrossSquareFootByFederalAgenciesByYear.aspx. U.S. Department of Energy (DOE), Energy Efficiency and Renewable Energy, Federal Energy Management Program, Guidelines Establishing Criteria for Excluding Buildings [online source] (Washington, D.C., 2006, accessed March 9, 2016), available from: http://www1.eere.energy.gov/femp/pdfs/exclusion_criteria.pdf.