Embed Size (px)
Citation preview

OFFICE OF DIVERSITY AND INCLUSIONOffice of Human Resources and Administration
U.S. Department of Veterans Affairs
STATE OF THE AGENCY
FY 10 EEO Program Status Report & FY 11 EEO Plan
STATE OF THE AGENCY
FY 10 EEO Program Status Report & FY 11 EEO Plan
1

2
Background and Legal Foundation
EEOC Management Directive 715 (MD-715) Provides policy guidance and standards to Federal Agencies for establishing and maintaining affirmative programs of equal employment opportunity under:
Title VII of the Civil Rights Act of 1964, as amended (Sec 717 USC 2000e)Section 501 of the Rehabilitation Act of 1973
Requires agencies to: Assess Agency’s performance against EEOC’s six essential elements for a Model EEO Program Analyze workforce, perform barrier analysis, and develop corrective strategies to facilitate equal opportunity in the workplaceSubmit an annual report to EEOC and brief the Agency Head on the Agency’s EEO status

3
VALUE
In order to be a high performing organization in the 21st century, organizations must tap into the rich diversity of our global community and leverage the diverse knowledge, skills, and perspectives of all of our human resources. Only then can we realize the full performance potential and competitive advantages that diversity brings in service to our Nation’s Veterans. This is the business case for diversity and inclusion in the VA workforce that supports the legal and moral imperatives.

4
MD 715’s Six Essential Elements of aModel EEO Program
Demonstrated commitment from agency leadership
Integration of EEO into the agency's strategic mission
Management and program accountability
Proactive prevention of unlawful discrimination
Efficiency
Responsiveness and legal compliance

5
Model EEO Program: Accomplishments Leadership Commitment
Secretary issued new EEO, Diversity & No FEAR Policy statement, adding sexual orientation protections Secretary issued Diversity & Inclusion Excellence Award and ADR Award linked to D&I Strategic Plan Secretary established 2 % hiring goal for individuals with targeted disabilities Expanded VA Diversity Council to include employee unions and affinity group representatives VHA established its 1st Chief Diversity Officer position focusing on diversity & cultural competency
Integration of EEO into the Agency’s Strategic Mission
EEO Director (ASHRA) meets regularly with the Secretary and Deputy Secretary on diversity issues ASHRA and DAS for D&I co-chair the VA Diversity Council, comprising senior execs from all Admins ODI meets quarterly with Admin EEO/Diversity senior staff to strengthen collaboration and integration Maintained robust communications on D&I issues via Newsletter, webcasts, broadcasts, web site.
Management and Program Accountability
Implemented mandatory EEO, diversity and inclusion critical element in SES performance plans Created VA’s 1st Centralized Reasonable Accommodation Fund for people with disabilities (90) Created VA’s 1st Centralized Diversity Internship Program resulting in a record 164 diverse interns Developed new EEO Dashboard to report on EEO complaints, workforce analysis, and ADR Issued VA Diversity & Inclusion Annual Report showing progress made in FY 10

Proactive Prevention of Unlawful Discrimination
Implemented VA’s 1st VA-wide Mandatory EEO, Diversity, and Conflict Mgt Training for Mgrs Trained over 2000 employees plus 10,000 managers in EEO, RA, diversity, and ADR in FY 10;
27,000+ to date. Reduced VA’s per capita EEO complaint filing rate from 0.76 to 0.72 in FY 10
Efficiency
Increased EEO process efficiency and reduced processing time to below the regulatory 180 days
Responsiveness and Legal Compliance
Reduced EEO average counseling time to 27 days, below EEOC’s mandate of 30 days Reduced average ADR process time to 71 days, below EEOC’s mandate of 90 days VA leads Federal govt in the area of workforce analysis and EEO reporting systems
6
Model EEO Program: Accomplishments

7
Model EEO Program:Challenges and Potential Barriers to EEO
Inconsistent training for employees in EEO and diversity
Inconsistent State of the Facility briefings to leadership
Lack of corporate, integrated strategic recruitment outreach & retention
Inconsistent collaboration between EEO and HR program offices/functions
Applicant Flow system not yet available in VA; SES pilot in development

8
VA Workforce Representation(Permanent and Temporary)
as of September 2010
White Men
White Women
Black Men
Black Women
Hispanic Men
Hispanic Women
Asian Men
Asian Women
Native Hawai-ian/Pa-cific Is-lander Men
Native Hawai-ian/Pa-cific Is-lander
Women
Ameri-can In-
dian Men
Ameri-can In-
dian Women
Other Men
Other Women
CLF 0.390300000000
003
0.337400000000
003
0.0484 0.0566 0.061700000000
0004
0.0452 0.0192 0.017100000000
0002
0.000600000000000007
0.000500000000000006
0.00340000000000003
0.00320000000000004
0.00880000000000009
0.00760000000000005
RCLF
0.2511 0.477800000000
002
0.031400000000
0003
0.0813 0.031400000000
0003
0.0433 0.0237 0.032100000000
0001
0.000300000000000004
0.000600000000000007
0.00310000000000003
0.00620000000000006
0.00340000000000003
0.00540000000000006
On-board FY09
0.248900000000
001
0.363300000000
002
0.088200000000
0003
0.1468 0.0303 0.0347 0.0255 0.0415 0.000800000000000009
0.00110000000000001
0.00540000000000006
0.0082 0.00220000000000003
0.00310000000000003
On-board FY10
0.2498 0.362400000000
002
0.088200000000
0003
0.1444 0.031400000000
0003
0.036100000000
0001
0.0257 0.0413 0.000800000000000009
0.00110000000000001
0.0046 0.00690000000000008
0.00280000000000001
0.00440000000000005
5%
15%
25%
35%
45%
Less than expected representation
CLF: Civilian Labor Force: Everyone in USA 16 and older who is working or seeking work. Based on 2000 Census
RCLF: Relevant Civilian Labor Force: CLF limited to occupations that are comparable to those we employ (weighted by occupation size if combining multiple occupations).

5-Year Trend(Permanent and Temporary)
9
Whit
eBlac
k
Hispan
icAsia
n
Native
Haw
aiian
/Pac
ific Is
lande
r
Amer
India
nOth
er0.00%
10.00%
20.00%
30.00%
40.00%
50.00%
60.00%
70.00%
80.00%
CLF RCLF 2006 2007 2008 2009 2010
Graph reflects workforce as of September 30 of each Fiscal Year
Less than expected representation
Decrease on FY10 most likely due to recoding of 2 or more races category

10
Targeted Disabilities
FY 2000
FY 2001
FY 2002
FY 2003
FY 2004
FY 2005
FY 2006
FY 2007
FY 2008
FY 2009
FY 2010
0.00%
0.20%
0.40%
0.60%
0.80%
1.00%
1.20%
1.40%
1.60%
1.80%
2.00%
VA Government Average
1.47% (FY09) to 1.55% (FY10)
2006 2007 2008 2009 2010
Targeted Disability
0.0149 0.0148 0.0143 0.0143 0.0151
Reportable Disability
0.0925 0.0938000000000002
0.0936000000000003
0.0974 0.1009
1.00%
3.00%
5.00%
7.00%
9.00%
11.00%
Permanent
Permanent & Temporary
Targeted Disabilities: Deafness, Blindness, Missing extremities, Partial paralysis, Complete paralysis, Epilepsy, Severe intellectual disability, Psychiatric disabilities, Dwarfism

11
2006 2007 2008 2009 2010
Disabled Veteran
0.074859585883142
0.0771502209713251
0.0793550643385341
0.0849574164394873
0.0902473627010117
Total Veterans
0.249786235225083
0.308861780262008
0.299342733837856
0.297716249399639
0.297928557018374
2.50%
7.50%
12.50%
17.50%
22.50%
27.50%
32.50%
Workforce Veteran Population(FY 2006 - FY 2010)
Permanent and Temporary
Corrected usingDoD BIRLS data

12
Internal Promotions (GS/GM & Title 38)
Significant under-promotion
(Includes high concentration in Title 38)
High promotion.
White male
White Female
Black male
Black Female
Hispanic male
Hispanic Female
Asian Male
Asian Female
Hawaiin/ Pacific is-
lander male
Hawaiian/ Pacific is-
lander Female
American Indian male
Ameri-cian In-dian Fe-
male
On-board
0.2498 0.36240000000000
1
0.0882 0.1444 0.0314 0.0361 0.0257 0.0413 0.00080000000000
0003
0.00110000000000
001
0.0046 0.00690000000000
003
Pro-mo-tion
0.2577 0.3569 0.103 0.1486 0.0319 0.0363 0.01550000000000
01
0.0217 0.0013 0.0013 0.00590000000000
003
0.00790000000000
004
2.50%
7.50%
12.50%
17.50%
22.50%
27.50%
32.50%
37.50%

13
Internal Promotion Ratefor FY 2010
FY 2010 permanent and temporary VA promotions compared to availability in feeder grades for these occupations.
%
Wh
ite
Men
Wh
ite
W...
Bla
ck M
en
Bla
ck W
om
en
His
pan
ic M
en
His
pan
ic ..
.
Asi
an M
en
Asi
an W
...
Pac
ific
Isla
...
Pac
ific
Isl..
.
Ind
ian
Men
Ind
ian
W...
0
5
10
15
20
25
30
35
40
45
Promotions OnboardW
hit
e M
en
Wh
ite
W...
Bla
ck M
en
Bla
ck W
...
His
pan
ic M
en
His
pan
ic ..
.
Asi
an M
en
Asi
an W
...
Pac
ific
Isl..
.
Pac
ific
Isl..
.
Ind
ian
Men
Ind
ian
W...
0
5
10
15
20
25
30
35
40
45
Promotions Onboard
GS/GM 7-9-11-12 GS/GM 13-15
VA promotions compared to availability in feeder grades 12-14.
%

14
Grade DisparityVA GS/GM permanent only as of 9/30/10
1 2 3 4 5 6 7 8 9 10 11 12 13 14 150%
10%
20%
30%
40%
50%
60%
70%
80%
90%
White
Black
Hispanic
Asian
Native Hawaiian/Pacific Islander
Amer Indian
Other
Grade

15
Whit
e M
ale
Whit
e Fem
ale
Black
Male
Black
Female
Hispan
ic m
ale
Hispan
ic Fem
ale
Asian
Male
Asian
Female
Native
Haw
aiian
/Pac
ific Is
lande
r male
Native
Haw
aiian
/Pac
ific Is
lande
r Fem
ale
Amer
ican
India
n M
ale
Amer
ican
India
n Fem
ale
Other
Male
Other
Fem
ale0
1,000
2,000
3,000
4,000
5,000
6,000
7,000
8,000
9,000 Separation
Hires
Hires and SeparationsFor FY 2010
0
5,000
10,000
15,000
20,000
25,000
405
2,926
22,236
350 2,259
15,287
Disabilities(Permanent Only)

16
Separations By Type and Race/EthnicityFor FY 2010 (Permanent)
White Men
White Women
Black Men
Black Women
Hispanic Men
Hispanic Women
Asian Men
Asian Women
Native Hawai-ian/Pa-cific Is-lander Men
Native Hawai-ian/Pa-cific Is-lander
Women
American Indian Men
American Indian
Women
Other Men
Other Women
On-board
0.2497334455667
8
0.3610234287317
62
0.0908845398428
732
0.1470187991021
34
0.0320777216610
552
0.0366231762065
097
0.0233515712682
379
0.0391238776655
445
0.000778619528619529
0.0010802469135
8025
0.0045945566778
8999
0.0067129629629
6298
0.0027567340067
3402
0.0042403198653
1989
Re-tire-ment
0.3347876299242
94
0.3480046195303
49
0.0870011548825
869
0.1100988066213
26
0.0360580007699
218
0.0247658154754
268
0.0170665982291
801
0.0302835878352
368
0.000256640574874888
0.000128320287437444
0.0050044912100
6031
0.0044912100603
1055
0.0012832028743
7444
0.000769921724624663
Re-gret-table Loss
0.2559106830122
62
0.3791593695271
47
0.0869089316987
74
0.1204028021015
76
0.0350262697022
767
0.0351357267950
963
0.0252845884413
31
0.0310858143607
707
0.0012040280210
1577
0.0019702276707
5308
0.0061295971978
9843
0.0111646234676
007
0.0040499124343
2574
0.0065674255691
7688
Other 0.2739059967585
09
0.1977309562398
7
0.1491085899513
78
0.1037277147487
85
0.0356564019448
947
0.0129659643435
981
0.0178282009724
473
0.0113452188006
483
0 0 0.0097244732576
9854
0.0016207455429
4977
0.0032414910858
9953
0.0016207455429
4977
5%
15%
25%
35%
45%
Regrettable Loss: Resignations from government and transfers to other government agencies
17
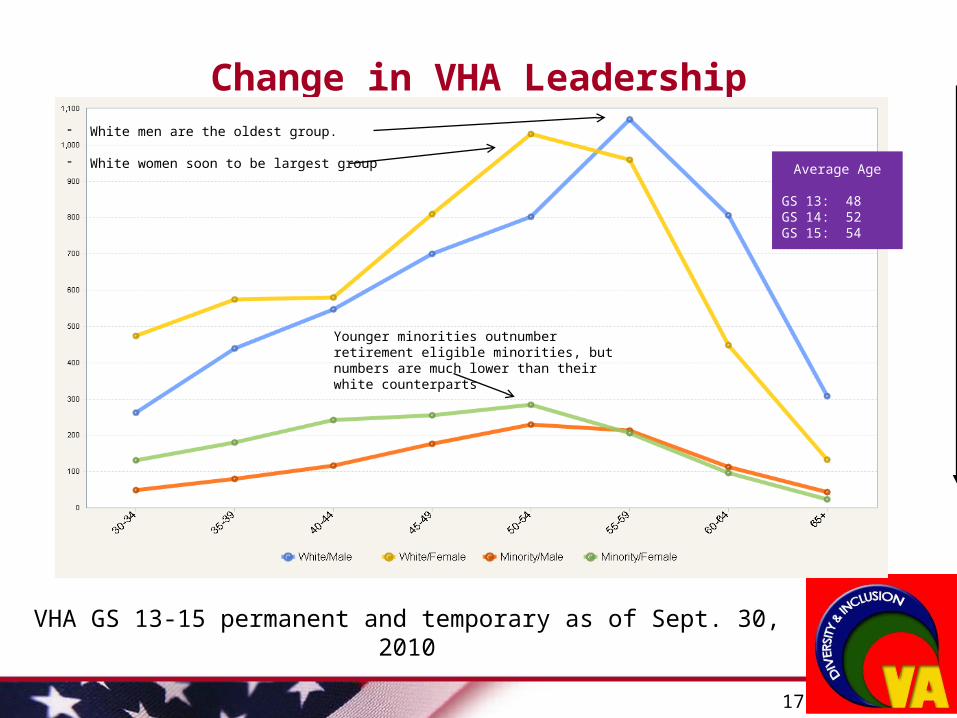
Change in VHA Leadership
VHA GS 13-15 permanent and temporary as of Sept. 30, 2010
- White men are the oldest group.
- White women soon to be largest group
Younger minorities outnumber retirement eligible minorities, but numbers are much lower than their white counterparts
Average Age
GS 13: 48GS 14: 52GS 15: 54

18
Change in VBA Leadership
VBA GS 13-15 permanent and temporary as of Sept. 30, 2010
- Minorities show good numbers at lower ages
- White women soon to be oldest group
Average Age
GS 13: 48GS 14: 48GS 15: 48

19
Change in NCA Leadership
NCA GS 13-15 permanent and temporary as of Sept. 30, 2010
- White men clearly the oldest group now and in the near future
- Minority women have a strong younger presence
Average Age
GS 13: 51GS 14: 54GS 15: 56

20
Change in VACO Leadership
VACO GS 13-15 permanent and temporary as of Sept. 30, 2010
Average Age
GS 13: 49GS 14: 49GS 15: 52
- White men clearly the oldest group now and in the near future
Younger minorities outnumber retirement eligible minorities, but numbers are much lower than their white counterparts

21
Identified Triggers/ Potential Barriers to EEO
Low participation rates of White and Hispanic women in comparison to RCLF
Representation of people with targeted disabilities
Diversity decreases as grade level increases
Lack of current, legally sufficient training in EEO and diversity areas
Organizational climate indices:High per capita rate of complaints High resignation rates

22
Plan to Eliminate Barriers;
Continue implementation of VA Diversity & Inclusion Strategic Plan Dept-wide; enforce corporate diversity policies and accountability measures; explore ODI Regional Model
Promote use of special hiring authorities (Schedule A, Disabled Veteran) and internship programs such as National Diversity Internship Program, Presidential Management Fellow to increase diversity of employment pipeline
Market My VA Career to bridge career gaps and grade disparities
Strategically target outreach of leadership development programs to underrepresented communities
Designate Special Placement Coordinators and Local Reasonable Accommodation Coordinators in all facilities; train all managers in disability employment strategies

23
Plan to Eliminate Barrierscontinued
Fully implement VA Plan on Employment and Retention of Individuals with Disabilities
Implement Applicant Flow/Adverse Impact Analysis tool in VA recruitment and leadership development selection processes
Provide standardized VA-wide training in EEO, diversity, and conflict management for all employees
Increase use of ADR throughout Discrimination Complaint process
Expand use of organizational climate survey data to identify potential barriers to inclusion (e.g., disparate perceptions of fairness and empowerment based on race, ethnicity, gender and generation)

24
QUESTIONS?
ODI Contact Information:
Georgia Coffey, DAS for Diversity & Inclusion 202-461-4131