Embed Size (px)
Citation preview

Office of Connecticut State Treasurer
Denise L. Nappier
2018 Public Finance Outlook Conference
2018 Public Finance Outlook Conference
THE IMPACT OF TAX
REFORM ON MUNICIPAL
ISSUERS
1

2018 Public Finance Outlook Conference
PANEL:
Moderator
Vivian AltmanManaging Director and Head of Public Finance
Janney Montgomery Scott LLC, New York, NY
David Panico
Partner and Chair of Public Finance Group
Robinson & Cole LLP, Hartford, CT
Lisa SoederPartner and Founder
Soeder & Associates LLC, Hartford, CT
William Thompson Jr.Partner and Chief Administrative Officer
Siebert Cisneros Shank & Co. LLC, New York, NY
2

2018 Public Finance Outlook Conference
I. TOPICS:
CHANGES IN LAW
INTERNAL REVENUE CODE
● Prohibition on Advance Refundings
● Elimination of Tax Credit Bonds
● Reduction in Rates
● Alternative Minimum Tax Changes
● Limitation of State and Local Tax Payments
● Increase in Standard Deductions
● Mortgage Interest Limitation
3

2018 Public Finance Outlook Conference
TOPICS:
CONNECTICUT GENERAL STATUTES
● Maximum Maturity for New Money Bonds
Increased To 30 Years
● Maximum Maturity for Refunding Bonds
Increased To 30 Years
● Refunding Bonds May Be Secured By Property Tax Lien
● Elimination of Amortization Requirements for Refunding Bonds Without Net PV Savings
● Impact of Refunding Bonds Not Considered For
Deficit Obligations
● MARB
● Spending Cap/Volatility Cap/Bond Cap/”Bond Lock”
4

2018 Public Finance Outlook Conference
II. IMPACT ON MARKET
DEMAND
● Banks, Insurance Companies, Individuals
● Increasing Rates, Yield Curve
● Comparison Against Dividend-Paying
Stocks as Investment
NEW MONEY SOLUTIONS
● Variable Rate Bonds
● Shorter Call Provisions/Declining Premiums
● Use of Make-Whole Redemptions
● Bank Loans
5

2018 Public Finance Outlook Conference
IMPACT ON MARKET
ADVANCE REFUNDING SOLUTIONS
● Current Refundings
● Taxable Advance Refundings
● Tender Offers/Negotiations With Existing
Bondholders
● “Cinderella Bonds”
● Forward Deliveries
● Forward Starting Swaps/Rate Locks
● Sale of Optional Redemption Right
6

2018 Public Finance Outlook Conference
III. IMPACT ON ISSUERS/NOT-FOR-PROFITS
ISSUERS
● Rates
● Declining Home Values/Residential Tax Base
● Higher Vacancy Rates
● Reduced Discretionary State Spending
NOT-FOR-PROFITS
● Reduced Tax Driven Donor Contributions
● Reduced Discretionary State Spending
7

Office of Connecticut State Treasurer
Denise L. Nappier
2018 Public Finance Outlook Conference

Short-Term Investment Fund
23rd Annual Investors Meeting
March 28, 2018
Michael M. Terry, CFA
Principal Investment Officer
Cash Management Division

Primary Objectives
STIF’s mandate is to provide:
• Safety
• Liquidity
• Yield

Short-Term Investment Fund – Safety Conservative Portfolio Composition
The STIF portfolio remains conservative with a focus on
government/agency, bank and highly rated corporate issuers.
A-1 and A-2 rated investments average a 1 day maturity and all A-2
and unrated investments are backed by letters of credit from a
Federal Home Loan Bank.
A-1+ amount includes repurchase agreements

Short-Term Investment Fund – Safety Conservative Portfolio Composition
STIF has been actively
diversifying the
portfolio across
markets while only
investing in the
strongest issuers.

Short-Term Investment Fund – Safety Designated Surplus Reserve
Contributions to reserves:
$4.7 million during Fiscal 2017
$2.3 million Fiscal 2018 to date (1/31/18)
$4.8 million over the last 12 months (2/1/17 – 1/31/18)

Short-Term Investment Fund – SafetyStress Test
STIF’s portfolio is tested under various interest rate scenarios,
changes in risk premiums and investor redemptions.
The portfolio consistently proves resilient to changes.

Short-Term Investment Fund – Liquidity Significant Liquidity
Overnight Investments or investments that are available on a same-day or next-day basis.
As of January 31, 2018, one-day liquidity stood at 43
percent of the portfolio.

Short-Term Investment Fund – Liquidity Investor Composition
The State Treasury continues to be the single largest investor in
STIF.
Local governments, with approximately $1.9 billion in deposits in
STIF, represented 29% of the fund as of January 31, 2018.
One day liquidity was approximately 1.5x municipal deposits.

Short-Term Investment Fund – LiquidityWeighted Average Maturity
STIF’s WAM, at 34 days, remains conservative and well below its
guidelines and AAAm fund requirements.
• IMoneyNet’s First Tier Institutions-Only AAA-Rated Money Fund Report (MFR) Averages Index.
• Weighted average maturity to the next reset date.
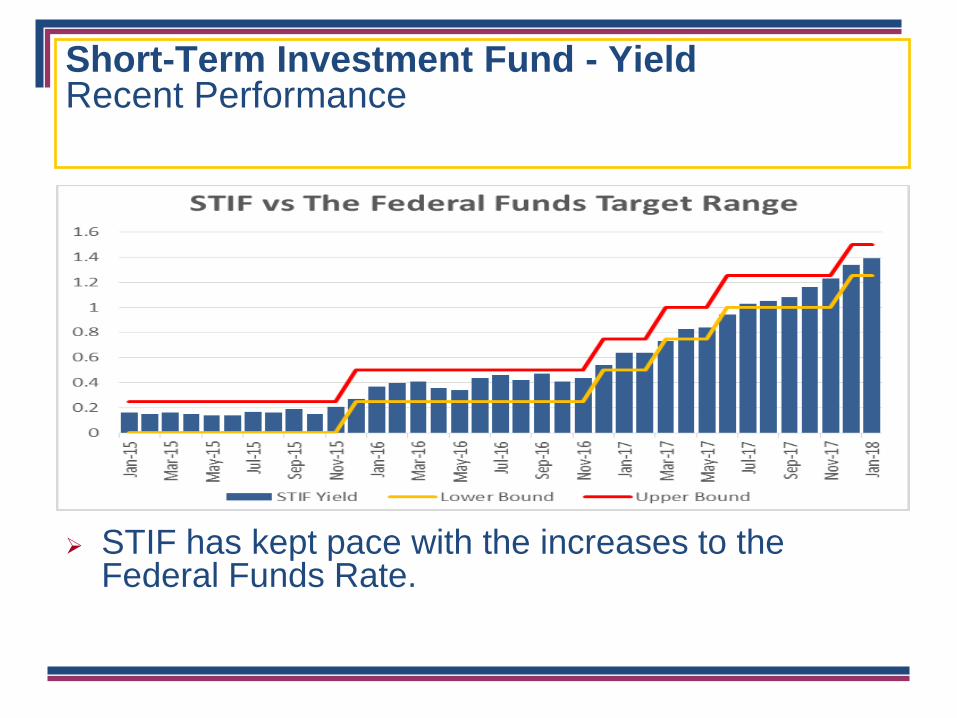
Short-Term Investment Fund - YieldRecent Performance
STIF has kept pace with the increases to the Federal Funds Rate.
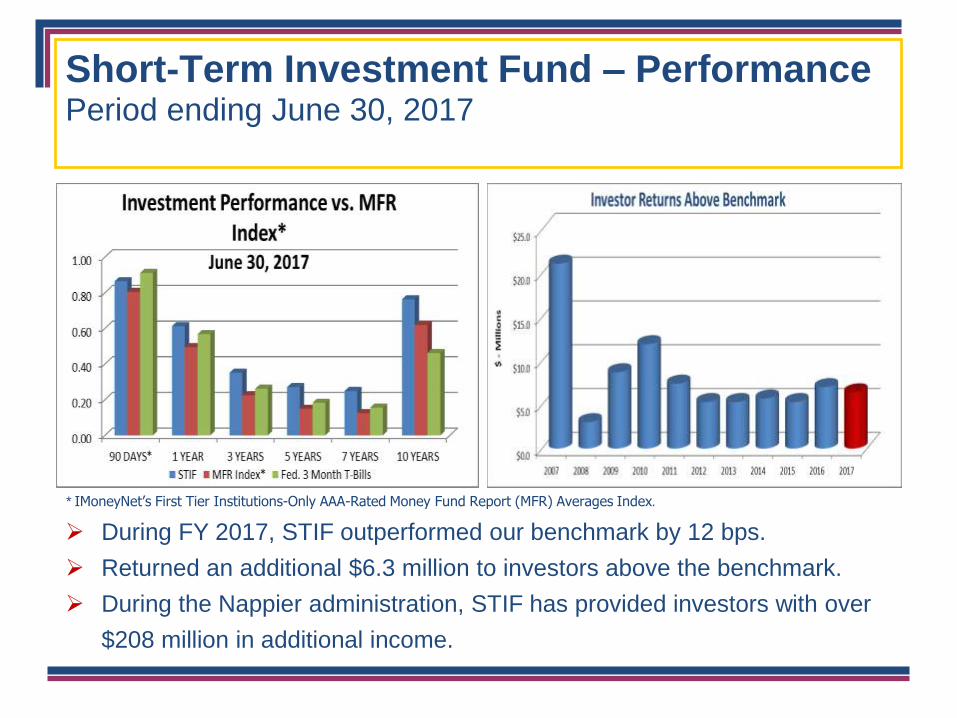
Short-Term Investment Fund – Performance Period ending June 30, 2017
During FY 2017, STIF outperformed our benchmark by 12 bps.
Returned an additional $6.3 million to investors above the benchmark.
During the Nappier administration, STIF has provided investors with over
$208 million in additional income.
* IMoneyNet’s First Tier Institutions-Only AAA-Rated Money Fund Report (MFR) Averages Index.

Short-Term Investment FundRecent Performance
For Calendar Year 2017, outperformed benchmark
by 10 bps (0.96% vs. 0.86%), thereby earning an
additional $5.8 million for investors.
Fiscal year-to-date (1/31/2018), the average rate on
STIF was 14 basis points higher than the average
rate on the benchmark (1.19% vs 1.05%), thereby
earning an additional $4.4 million for investors.

Market ReportOverview
Short-term rates continue to increase due to the
increase in Federal Funds as well as the
increase in LIBOR.
The increases in short-term rates are expected
to continue at a measured and gradual pace.
The risk to interest rate forecasts is a pick-up in
both wage inflation as well as inflationary
pressures in the price of raw materials and
finished goods due to trade policy.

Market Report Federal Funds
Based on futures implied probabilities, there is a greater than even
chance that the FOMC increases rates again in June and
September of 2018. A December rate hike is also expected despite
not be factored into the futures market currently.
Source: Bloomberg

Market Report Federal Funds
The forecast by the FOMC has not changed, but notice the
upward shift in the central tendency.

Market Report Short-Term Yield Curve
Source: Bloomberg
Interest rates have increased due to stronger economic
data, potential inflation and the response of monetary
policy to these factors.

Going Forward
Short-term rates are expected to continue to
increase at a gradual pace.
With fewer buyers in the short-term credit space,
there will continue to be opportunities to add highly
rated corporate issuers in order to enhance yield.
Breakeven rates between fixed rate and floating rate
securities must factor in outlier events and be
monitored closely when investing.
Thank you!
Cash Management Division
Lawrence A. Wilson, CTP
Assistant Treasurer - Cash Management
(860) 702-3126
STIF Investment Management
Michael M. Terry, CFA
Principal Investment Officer
(860) 702-3255
Marc R. Gagnon
Securities Analyst
(860) 702-3158
Paul A. Coudert
Investment Officer
(860) 702-3254
Leonora Gjonbalaj
Investment Technician
(860) 702-3118
Investor Services: [email protected]
Investment Transactions 1-800-754-8430
STIF Express Online Account Access www.state.ct.us/ott/STIFHome.htm

Office of Connecticut State Treasurer
Denise L. Nappier
2018 Public Finance Outlook Conference

Laurie Martin, CPA
Interim Chief Investment Officer
Municipal Employees’ Retirement Fund
Investment Overview
28

Agenda
2017 Market Overview
Municipal Employees’ Retirement Fund
(“MERF”) Performance Update
Calendar year 2017 results
Liability Profile of MERF
29

Market OverviewGlobal Equity Returns Drove Performance
30
21.8%26.2%
37.3%
0.0%
10.0%
20.0%
30.0%
40.0%
US Equity DevelopedInternational Equity
Emerging MarketsEquity
Global equity returns were the key drivers of performance for 2017
Strong returns were primarily due to positive sentiment regarding global
growth combined with strong earnings and continued central bank support
US Equity indices posted positive returns every month and
The Tax Cuts and Jobs Act was passed in December

Market Overview
US Dollar Weakened
Opposite to last year, the US Dollar weakened in 2017, which drove
outperformance in Emerging Markets Equity and Developed International
Equity
31

Market Overview
Majority of sectors performed very well
Information technology and materials relative to aerospace and defense were the
best performers but all sectors gained during the year
32
-1.3%
-1.0%
12.1%
13.5%
21.0%
22.1%
22.2%
23.0%
23.8%
38.8%
-10.0% 0.0% 10.0% 20.0% 30.0% 40.0% 50.0%
Telecomm
Energy
Utilities
Consumer Staples
Industrials
Healthcare
Financials
Consumer Discretionary
Materials
Information Technology

Market Overview
Select Information Technology Firms Dominated
33
“FANG” stocks Facebook, Amazon, Netflix and Google accounted for a large
percentage of the S&P 500 return for the year
21.8%
53.0%56.0% 55.0%
33.0%
0.0%
10.0%
20.0%
30.0%
40.0%
50.0%
60.0%
S&P 500 Facebook Amazon Netflix Google

Market Overview
Oil Volatility Impacted the Energy Sector
Oil prices were very volatile in 2017 starting the year at $52.33 per barrel but
ending at $60.42 – an increase of 15.46%
34

Market OverviewLow Volatility
35
Despite significant geopolitical and fiscal policy uncertainty, market volatility as
measured by the VIX index (“Fear Gauge”) was the lowest it has been in decades

Policy asset allocation targets remained the same for the portfolio
Asset liability/allocation study in progress
MERF Asset Allocation Targets
36
Cash3%
Bonds35%
Equities37%
Real Estate7%
Private Equity10%
Alternatives8%

MERF Returns as of December 31, 2017
37
CMERS has generated strong performance across all asset classes
1 Year Performance: +14.5% vs. +14.0% for the benchmark
5 Year Performance: +7.8% vs, +7.7% for the benchmark
One Year Returns Five Year Returns
0.0%
10.0%
20.0%
30.0%
40.0%
MERF Benchmark
0.0%
10.0%
20.0%
30.0%
40.0%
MERF Benchmark
Market Value Change (Millions)
Beginning Balance $2,281.5
Net Disbursements ($59.5)
Investment Earnings $328.1
Ending Balance $2,550.1
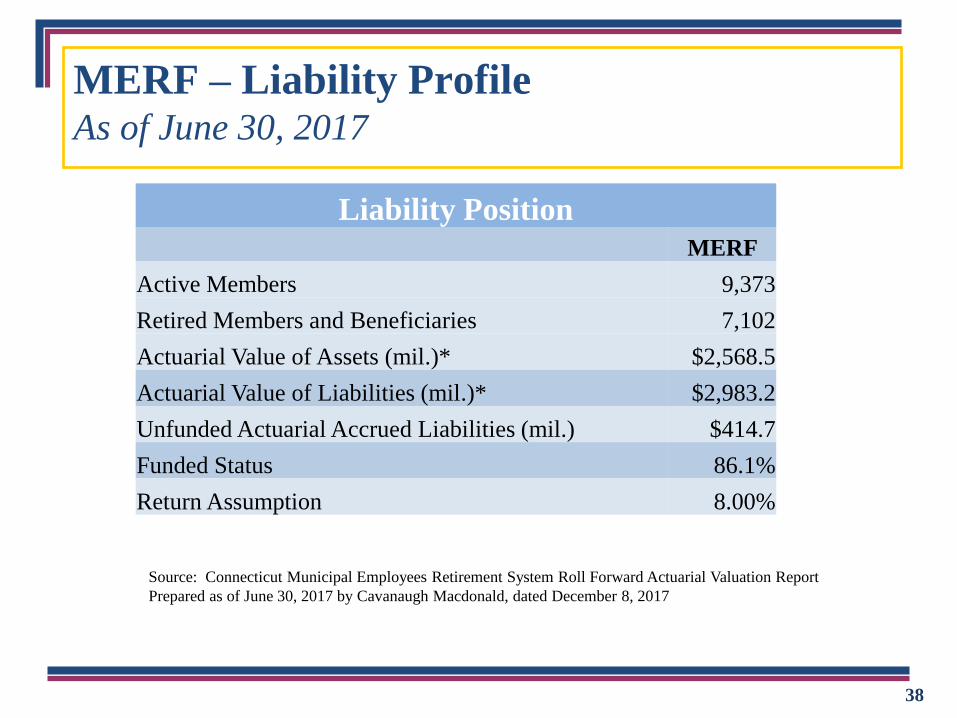
MERF – Liability ProfileAs of June 30, 2017
Source: Connecticut Municipal Employees Retirement System Roll Forward Actuarial Valuation Report
Prepared as of June 30, 2017 by Cavanaugh Macdonald, dated December 8, 2017
Liability Position
MERF
Active Members 9,373
Retired Members and Beneficiaries 7,102
Actuarial Value of Assets (mil.)* $2,568.5
Actuarial Value of Liabilities (mil.)* $2,983.2
Unfunded Actuarial Accrued Liabilities (mil.) $414.7
Funded Status 86.1%
Return Assumption 8.00%
38

39
Thank you!

Office of Connecticut State Treasurer
Denise L. Nappier
2018 Public Finance Outlook Conference

State and National Economic Update
Patrick J. FlahertyAssistant Director of Research and Information
Connecticut Department of Labor
Office of the State TreasurerPublic Finance Outlook Conference
East Hartford, ConnecticutMarch 28, 2018


National & Connecticut Labor Market
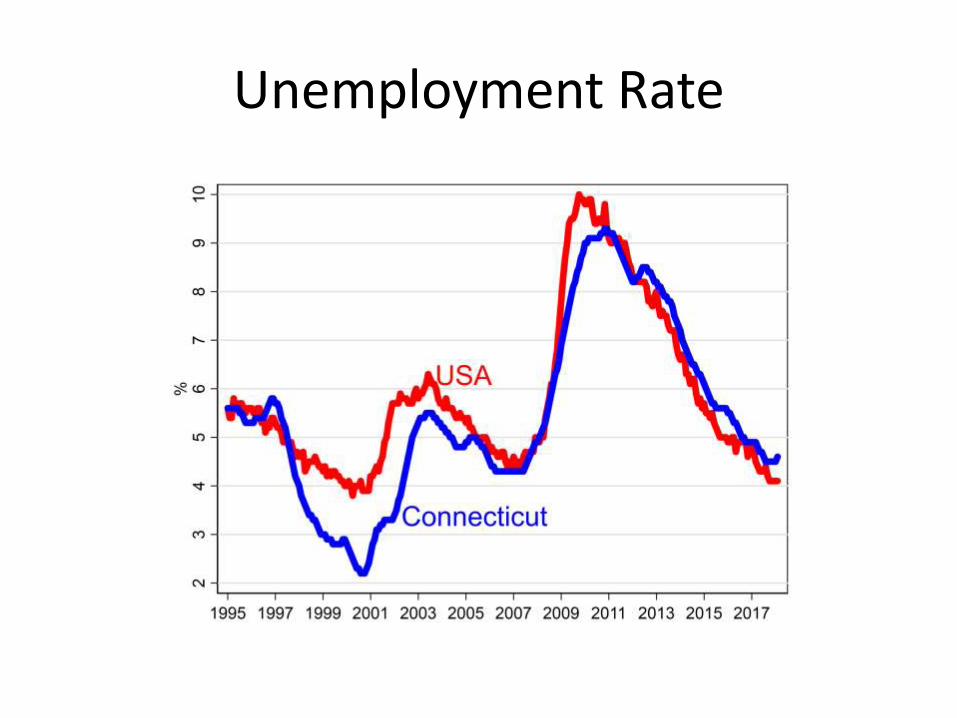
Unemployment Rate

U.S. EmploymentChange from Previous Month

U.S. Job Change, Hiring & Separations

U.S. Separations by Type

U.S. Job Openings(Thousands)

Connecticut Payroll Employment
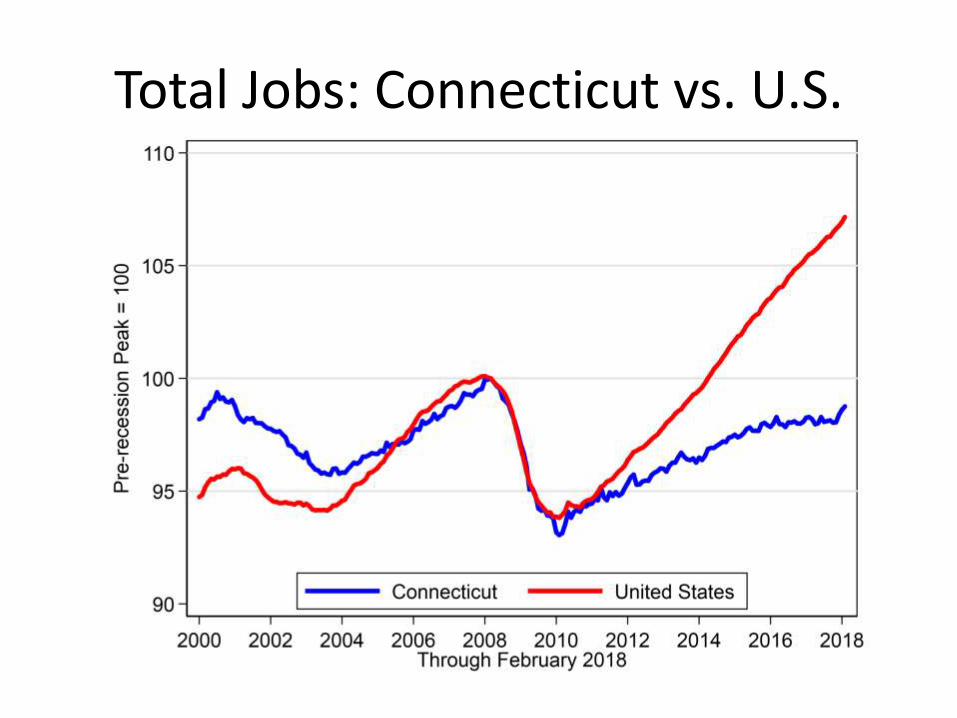
Total Jobs: Connecticut vs. U.S.

Total JobsConnecticut vs. Massachusetts

Employment/Population RatioConnecticut vs. U.S.

Employment/Population RatioConnecticut vs. Massachusetts

Connecticut’s Education AdvantagePortion of Labor Force with B.A. or More
Connecticut Employment Change By Industry

Connecticut Employment Change
Total Employment
• For this and the following charts – change in average employment for calendar year compared to average employment in previous calendar year.
• For 2018 change from Jan/Feb 2017 average to Jan/Feb 2018 average.


Total Wages


Total Wages & SalariesAnnual % Change

Average Wages & SalariesAll Industries
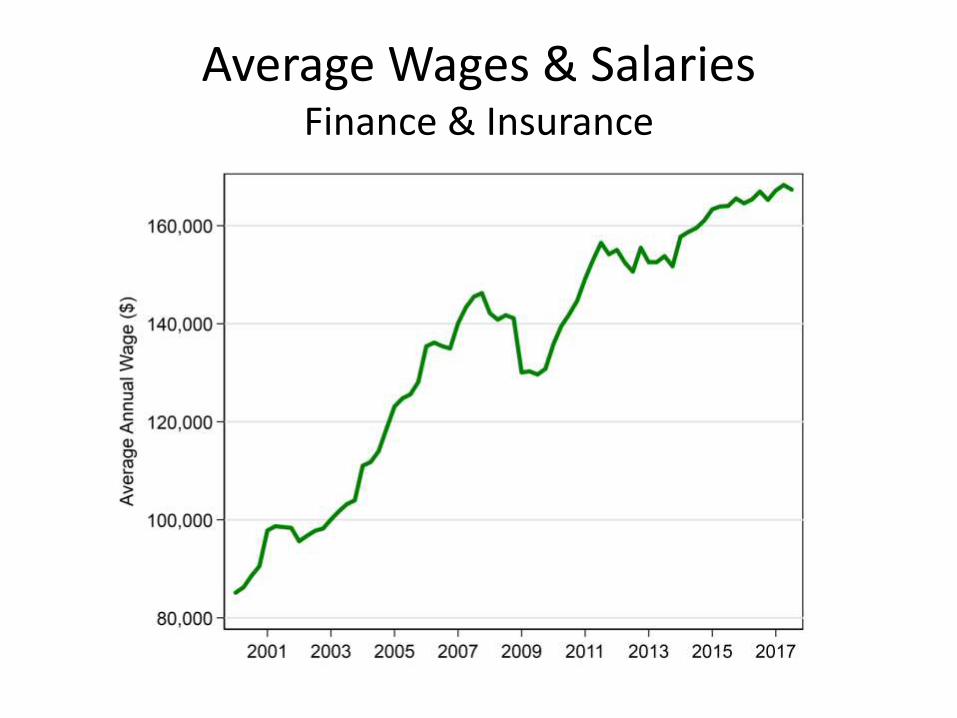
Average Wages & SalariesFinance & Insurance

Total Wage ChangeFinance & Insurance

Total Wage ChangeManufacturing

Total Wage ChangeAll Industries – Southwestern Connecticut

Population Projections


Projected Population Change 2015 to 2030
Largest Increases
• New Haven
• West Haven
• Manchester
• Bridgeport
• Norwich
• Danbury
• Windham
• Stamford
Largest Declines
• Greenwich
• Westport
• Monroe
• New Fairfield
• Wilton
• Ridgefield
• New Milford
• Cheshire
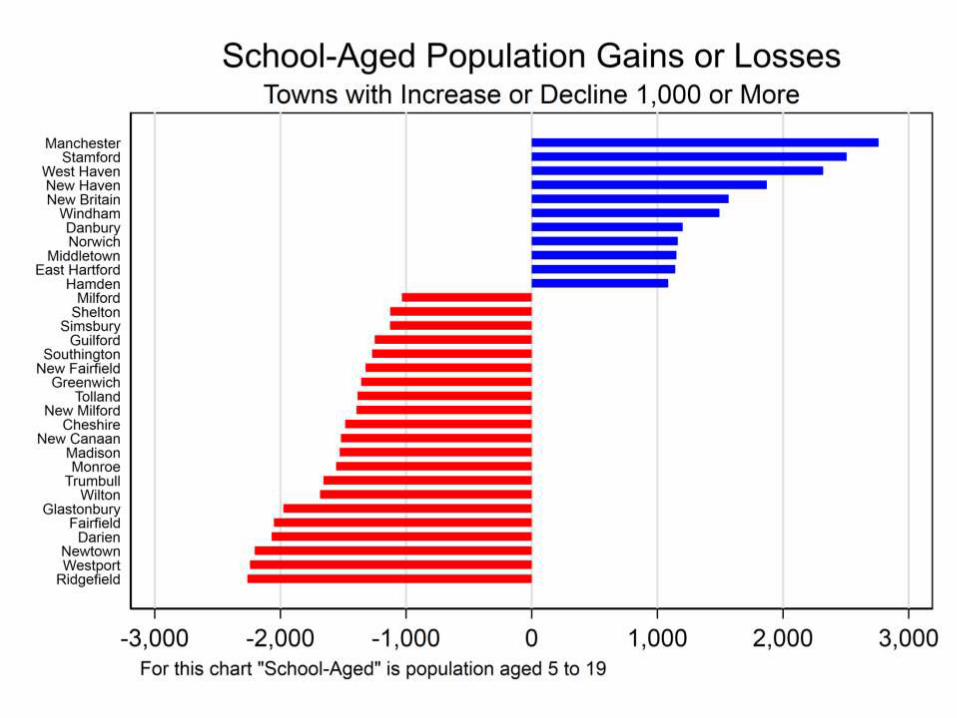

School-Aged Population Gains or LossesProjections 2015 to 2030
Largest Increases
• Manchester
• Stamford
• West Haven
• New Haven
• New Britain
• Windham
• Danbury
• Norwich
• Middletown
• East Hartford
Largest Decreases
• Ridgefield
• Westport
• Newtown
• Darien
• Fairfield
• Glastonbury
• Wilton
• Trumbull
• Monroe
• Madison


Connecticut Department of Labor Office of Research

Office of Connecticut State Treasurer
Denise L. Nappier
2018 Public Finance Outlook Conference