Embed Size (px)
Citation preview

Office of Connecticut State Treasurer
Denise L. Nappier
2017 Public Finance Outlook Conference
0

Table of Contents
Short-Term Investment Fund Page 2
Municipal Employees’ Retirement Fund Investment Overview Page 21
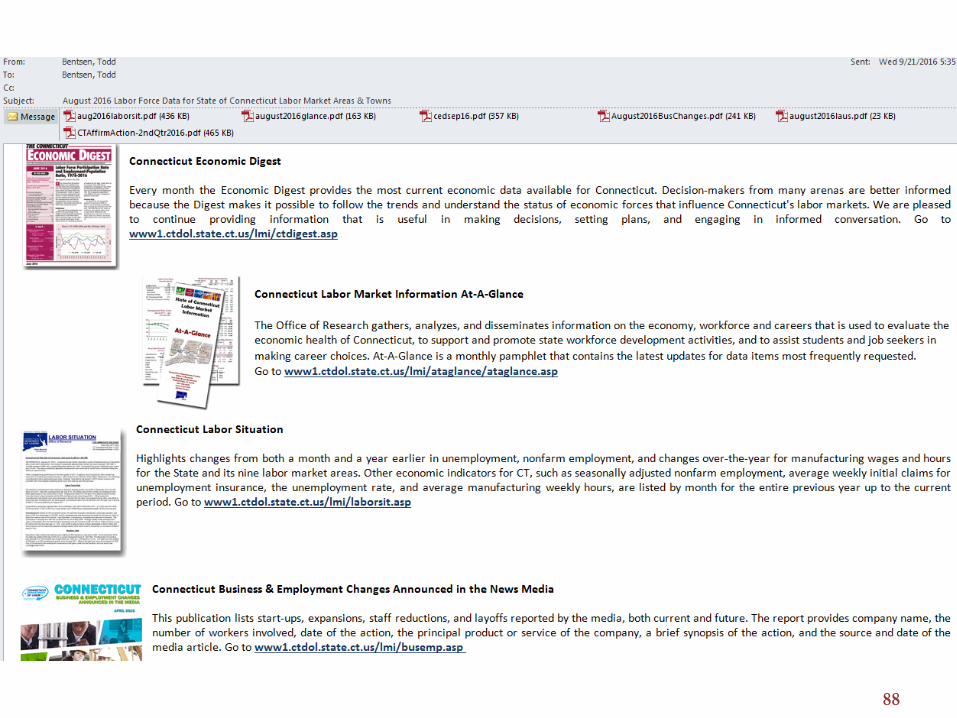
Connecticut Labor Market Overview and Outlook Page 34
Protecting Your Town from Cyber Hacking and Theft Page 91
1

Short-Term Investment Fund
22nd Annual Investors Meeting
March 29, 2017
Michael M. Terry, CFA
Principal Investment Officer
Cash Management Division
2
Primary Objectives
STIF’s mandate is to provide:
• Safety
• Liquidity
• Yield
3

Short-Term Investment Fund – Safety Conservative Portfolio Composition
The STIF portfolio remains conservative with a focus on
government/agency, bank and highly rated corporate issuers.
A-1 and A-2 rated investments average a 1 day maturity and all A-2
investments are backed by a letter of credit from a Federal Home Loan
Bank.
A-1+ amount includes repurchase agreements with
banks rated A-1 or better
4

Short-Term Investment Fund – Safety Conservative Portfolio Composition
STIF has been actively
diversifying the
portfolio across
markets while only
investing in the
strongest issuers.
5

Short-Term Investment Fund – Safety Designated Surplus Reserve
Contributions to reserves:
$904 thousand during Fiscal 2016
$2.2 million Fiscal 2017 to date (1/31/17)
$2.8 million over the last 12 months (1/31/16 – 1/31/17)
6

Short-Term Investment Fund – Safety
Regular Stress Testing
STIF’s portfolio is tested monthly under various interest rate
scenarios, changes in risk premiums and investor redemptions.
The portfolio consistently proves resilient to changes.
7

Short-Term Investment Fund – Liquidity Significant Liquidity
Overnight Investments or investments that are available on a same-day or next-day basis.
As of January 31, 2017, one-day liquidity stood at 53
percent of the portfolio.
8

Short-Term Investment Fund – Liquidity Investor Composition
The State Treasury continues to be the single largest investor in
STIF.
Local governments, with approximately $1.3 billion in STIF
deposits, represented 21% of the fund as of January 31, 2017.
One day liquidity was approximately 2.5x municipal deposits.
9

Short-Term Investment Fund – Liquidity Weighted Average Maturity
STIF’s WAM, at 33 days, remains conservative and well below its
guidelines and AAAm fund requirements.
* IMoneyNet’s First Tier Institutions-Only AAA-Rated Money Fund Report (MFR) Averages Index.
* IMoneyNet’s First Tier Institutions-Only AAA-Rated Money Fund Report (MFR) Averages Index.
10

Short-Term Investment Fund - Yield Recent Performance
STIF has kept pace with the increases to the Federal Funds target range.
11

Short-Term Investment Fund – Performance Period ending June 30, 2016
During FY 2016, STIF outperformed our benchmark by 14 bps.
Returned an additional $7.0 million to investors above the benchmark.
During the Nappier administration, STIF has provided investors with over
$200 million in additional income.
* IMoneyNet’s First Tier Institutions-Only AAA-Rated Money Fund Report (MFR) Averages Index.
12

Short-Term Investment Fund Recent Performance
For Calendar Year 2016, STIF outperformed
benchmark by 16 bps (0.42% vs. 0.26%), thereby
earning an additional $8.2 million for investors.
Fiscal year-to-date (1/31/2017), the average rate on
STIF was 15 basis points higher than the average
rate on the benchmark (0.48% vs 0.33%), thereby
earning an additional $4.9 million for investors.
13

Market Report Overview
The shift from monetary policy to fiscal policy is
currently underway with monetary policy
becoming tighter and fiscal policy proposals
becoming the driver.
Risk has shifted from financial to
political/geopolitical, the latter being harder to
model and/or determine the effects on markets.
14

Market Report Federal Funds
Based on the futures market’s implied probabilities,
there is a greater than even chance that the FOMC
increases rates in June and December for a total of
three hikes in 2017.
Source: Bloomberg world interest rate probabilities
15

Market Report Federal Funds
The range of forecasts by FOMC members has become
narrower.
16

Market Report Short-Term Yield Curve
Source: Bloomberg
Rates have increased and the short-term yield curve has
steepened due to Fed policy actions and concerns
regarding inflation.
17
Going Forward
We believe that there will be approximately two
more hikes to the Federal Funds rate during
calendar 2017.
As a result, we are positioning the portfolio in order
to capitalize of the rate hikes and measuring
prospective investments versus these expectations.
Credit will continue to play an active role in the
portfolio as we determine which risks make the most
sense.
18

Thank you!
Cash Management Division
Lawrence A. Wilson, CTP
Assistant Treasurer - Cash Management
(860) 702-3126
STIF Investment Management
Michael M. Terry, CFA
Principal Investment Officer
(860) 702-3255
Marc R. Gagnon
Securities Analyst
(860) 702-3158
Paul A. Coudert
Investment Officer
(860) 702-3254
Peter A. Gajowiak
Securities Analyst
(860) 702-3124
STIF Investor Services Barbara Szuba
Accountant
(860) 702-3118
Email: [email protected]
Investment Transactions 1-800-754-8430
STIF Express Online Account Access www.state.ct.us/ott/STIFHome.htm
19

Office of Connecticut State Treasurer
Denise L. Nappier
2017 Public Finance Outlook Conference
20
Laurie Martin, CPA
Interim Chief Investment Officer
Municipal Employees’ Retirement Fund
Investment Overview
March 29, 2017
21

Agenda
Market Overview
Municipal Employees’ Retirement Fund
(“MERF”) Performance Update
Calendar year 2016 results
Liability Profile of MERF
21 22

Market Overview Global Growth Consistently Led by US Equity
1yr 3yr 5yr 7yr
Emerging Markets Equity 10.18% -2.13% 1.85% 0.91% International Equity 1.59% -1.03% 7.13% 4.38%
Domestic Equity 12.72% 8.42% 14.65% 12.91%
MERF Equity Targets
Emerging – 7%
International – 14%
US – 16%
-4.00%
-2.00%
0.00%
2.00%
4.00%
6.00%
8.00%
10.00%
12.00%
14.00%
16.00%
Emerging Mkt Index EAFE Index Russell 3000 IndexSource: Bloomberg
23

Market Overview Strength of US Dollar Relative to International Currencies
Much of the relative
outperformance in US
equities has been driven
by dollar strength
Local currency returns in
non-US developed
markets have fared much
better
The non-US developed
market equity exposure
in MERF has a 50% US
dollar hedge which has
continued to benefit the
portfolio
75
80
85
90
95
100
105
De
c-1
1
Mar
-12
Jun
-12
Sep
-12
De
c-1
2
Mar
-13
Jun
-13
Sep
-13
De
c-1
3
Mar
-14
Jun
-14
Sep
-14
De
c-1
4
Mar
-15
Jun
-15
Sep
-15
De
c-1
5
Mar
-16
Jun
-16
Sep
-16
De
c-1
6
US Dollar Index
Source: Bloomberg
24

Market Overview Improved Economics in the US
All S&P 500 sectors, except Healthcare, had positive returns for the year ending
December 31, 2016 with Energy performing the best as oil prices stabilized
Healthcare stocks declined with the uncertainty around policy changes
-2.7%
5.4%
6.0%
13.9%
16.3%
16.7%
18.9%
22.8%
23.5%
27.4%
-10.0% -5.0% 0.0% 5.0% 10.0% 15.0% 20.0% 25.0% 30.0%
Healthcare
Consumer Staples
Consumer Discretionary
Information Technology
Utilities
Materials
Industrials
Financials
Telecomm
Energy
Source: Bloomberg – US Equity Sector returns for Calendar Year 2016
25

Market Overview The Rise in Oil Prices
Strong global oil demand outweighing supply drove prices up
approximately 80% during 2016
26

Market Overview Strong High Yield Bond Returns Within Fixed Income
High yield bond spreads to Treasuries narrowed further during the year
due to oil price rebounds followed by anticipated pro-business initiatives
Energy sector represents 17% of this market
MERF’s High Yield investments returned 15.8% for the year
300
400
500
600
700
800
900
Jan
-16
Jan
-16
Feb
-16
Feb
-16
Mar
-16
Mar
-16
Ap
r-1
6
Ap
r-1
6
May
-16
May
-16
Jun
-16
Jun
-16
Jul-
16
Jul-
16
Au
g-1
6
Au
g-1
6
Sep
-16
Sep
-16
Oct
-16
Oct
-16
No
v-1
6
No
v-1
6
De
c-1
6
De
c-1
6
High Yield - Spread to Treasury
1400
1450
1500
1550
1600
1650
1700
1750
1800
1850
Jan
-16
Jan
-16
Feb
-16
Feb
-16
Mar
-16
Mar
-16
Ap
r-1
6
Ap
r-1
6
May
-16
May
-16
Jun
-16
Jun
-16
Jul-
16
Jul-
16
Au
g-1
6
Au
g-1
6
Sep
-16
Sep
-16
Oct
-16
Oct
-16
No
v-1
6
No
v-1
6
De
c-1
6
De
c-1
6
High Yield - Index
Source: Bloomberg Source: Bloomberg
27

Market Overview Fiscal and Monetary Policy Drove Inflation in China
China introduced new stimulus measures to move from deflation to rising inflation in an attempt to grow its economy
Market volatility continues to be a key concern for this market as China represents 27% of the Emerging Markets index
MERF’s Emerging Markets Equity investments returned 12.9% for the year
28

MERF returned 8.7% net of all fees and expenses vs. 8.9% for the benchmark Equities outperformed fixed income
Strongest performance from emerging markets and US equity as well as high yield bonds
Calendar Year 2016 Performance Highlights
Bonds 35%
Equities 37%
Alteratives 25%
Cash 3%
MERF Asset Allocation
29

MERF Returns as of December 31, 2016
MERF has generated strong performance across all asset classes
1 Year Performance: +8.7% vs. +8.9% for the benchmark
5 Year Performance: +7.4% vs, +7.5% for the benchmark
One Year Returns Five Year Returns
0.0%
5.0%
10.0%
15.0%
20.0%
MERF Benchmark
-5.0%
0.0%
5.0%
10.0%
15.0%
20.0%
MERF Benchmark
30

MERF – Liability Profile As of June 30, 2016
* The actuarial valuation is conducted every two years. These numbers are based on the last
valuation which took place in 2016. The next valuation is scheduled for 2018.
Source: Connecticut Municipal Employees Retirement System Actuarial Valuation Report
Prepared as of June 30, 2016 by Cavanaugh Macdonald, dated January 12, 2017
Liability Position
MERF
Active Members 9,373
Retired Members and Beneficiaries 7,102
Actuarial Value of Assets (mil.)* $2,445.5
Actuarial Value of Liabilities (mil.)* $2,840.3
Unfunded Actuarial Accrued Liabilities (mil.) $394.8
Funded Status 86.1%
Return Assumption 8.00%
31

Thank you!
32

Office of Connecticut State Treasurer
Denise L. Nappier
2017 Public Finance Outlook Conference
33

More of the Same Yet Everything Seems Different:
Connecticut Labor Market Overview and Outlook
Patrick J. Flaherty Assistant Director of Research and Information
Connecticut Department of Labor
Office of the State Treasurer Public Finance Outlook Conference
East Hartford, Connecticut March 29, 2017
34
35

CONNECTICUT AND THE NATION
36

Unemployment Rate
37

U.S. Employment Indicators
38

39
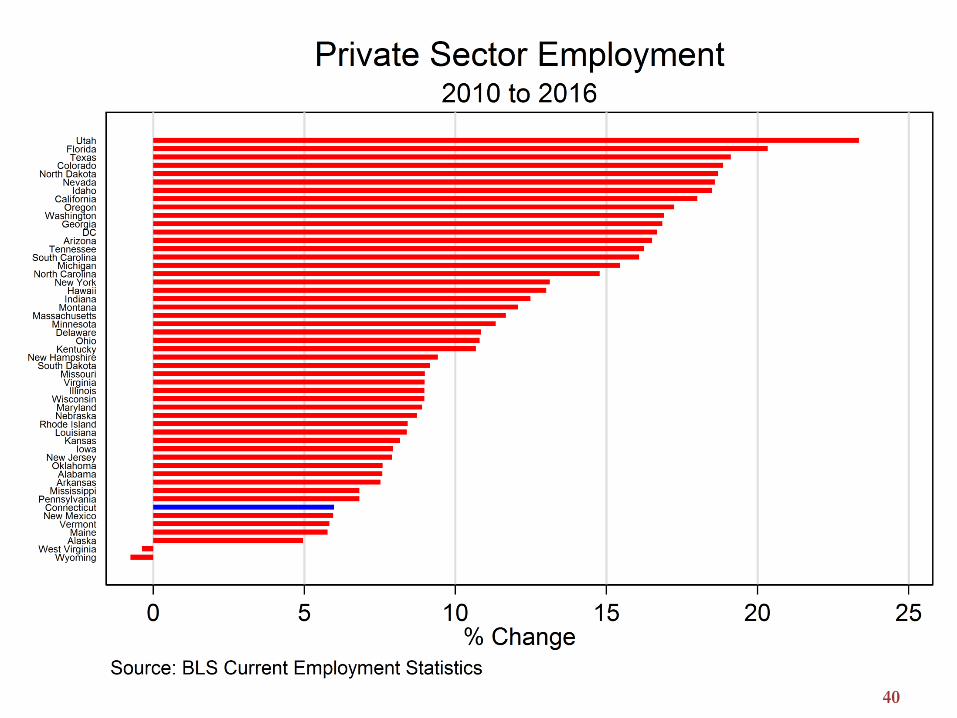
40

Connecticut Payroll Employment
41

CONNECTICUT INDUSTRIES
42

43
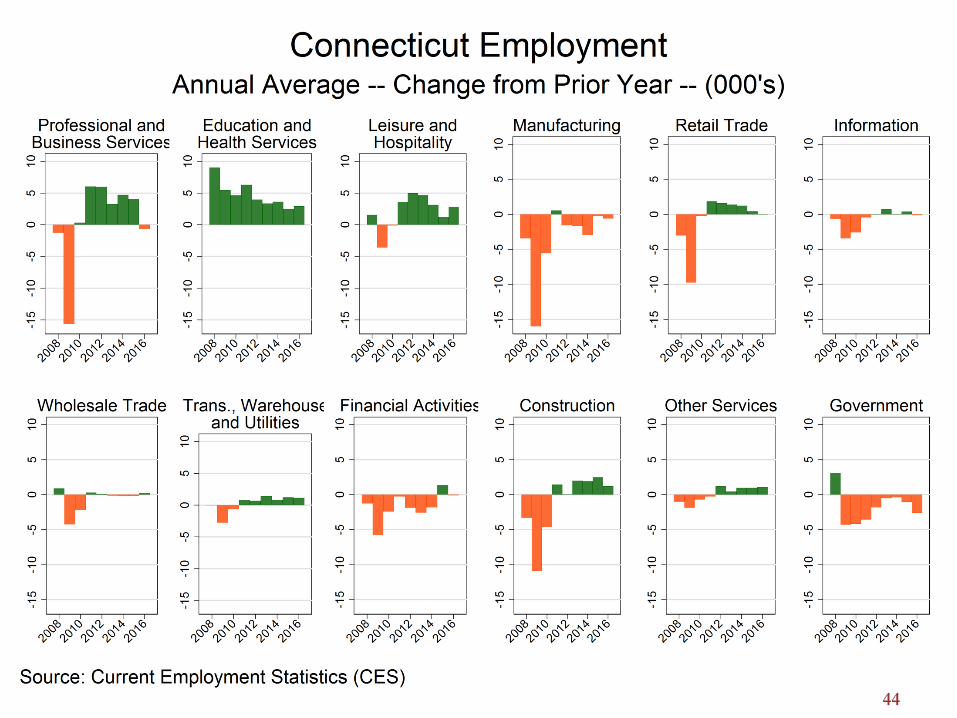
44
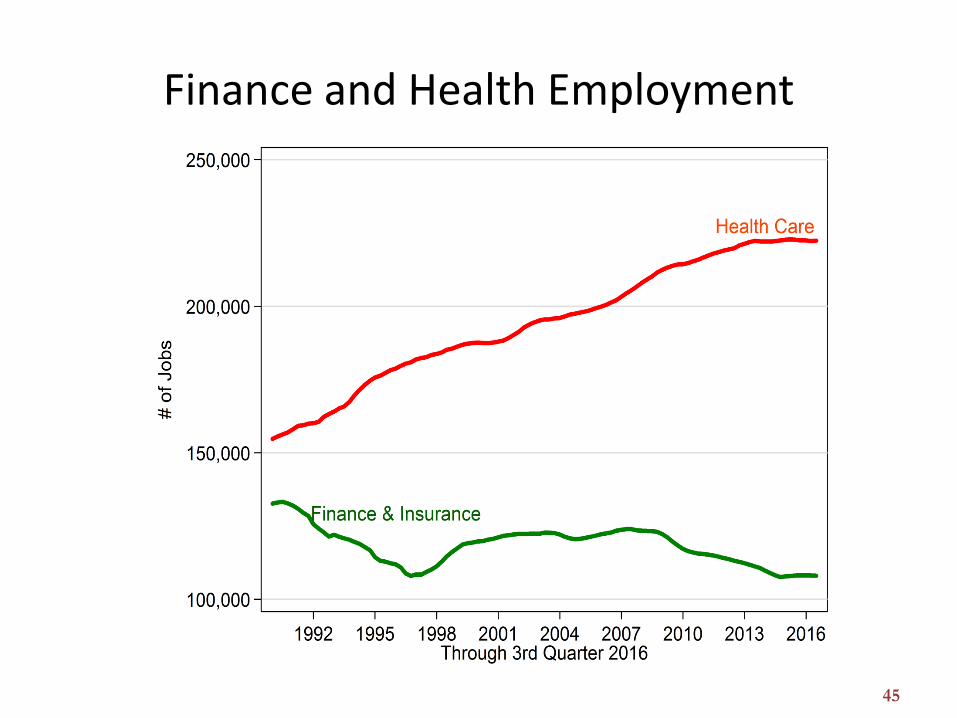
Finance and Health Employment
45

Finance, Health, & Manufacturing Employment
46

Connecticut Employment Year Ending 2016 Q3
47

Employment Change This Year Health Care and Social Assistance
48

49

Connecticut Employment General Medical and Surgical Hospitals
50

Connecticut Employment Nursing Care Facilities
51

Connecticut Employment Home Health Care Services
52

Connecticut Employment Manufacturing – Year Ending 2016Q3
53

Connecticut Employment Change Manufacturing – Year Ending 2016Q3
54
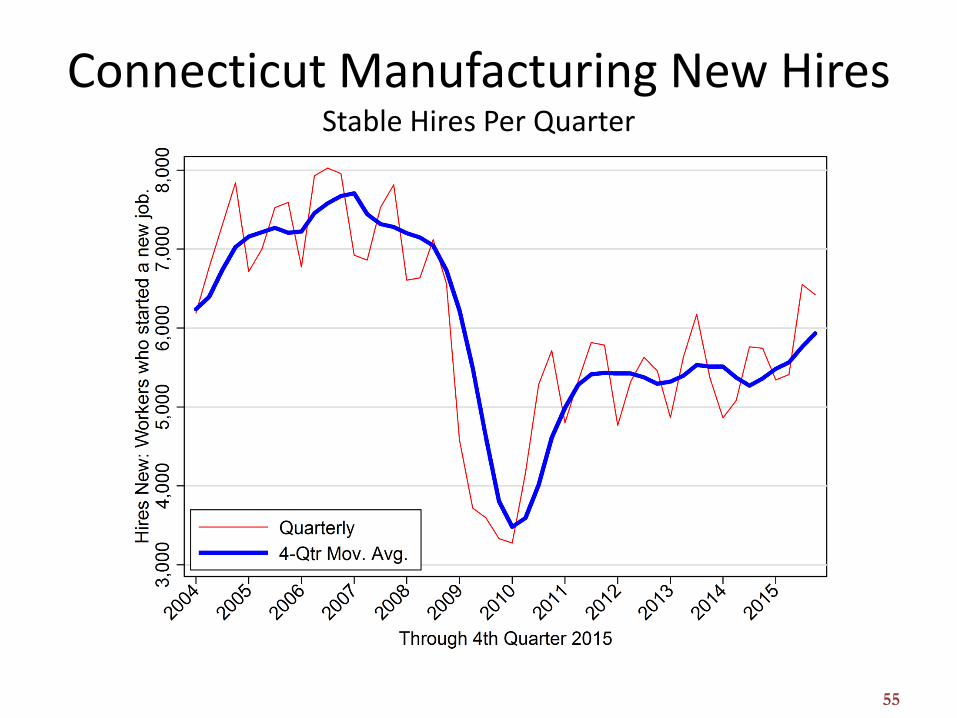
Connecticut Manufacturing New Hires Stable Hires Per Quarter
55
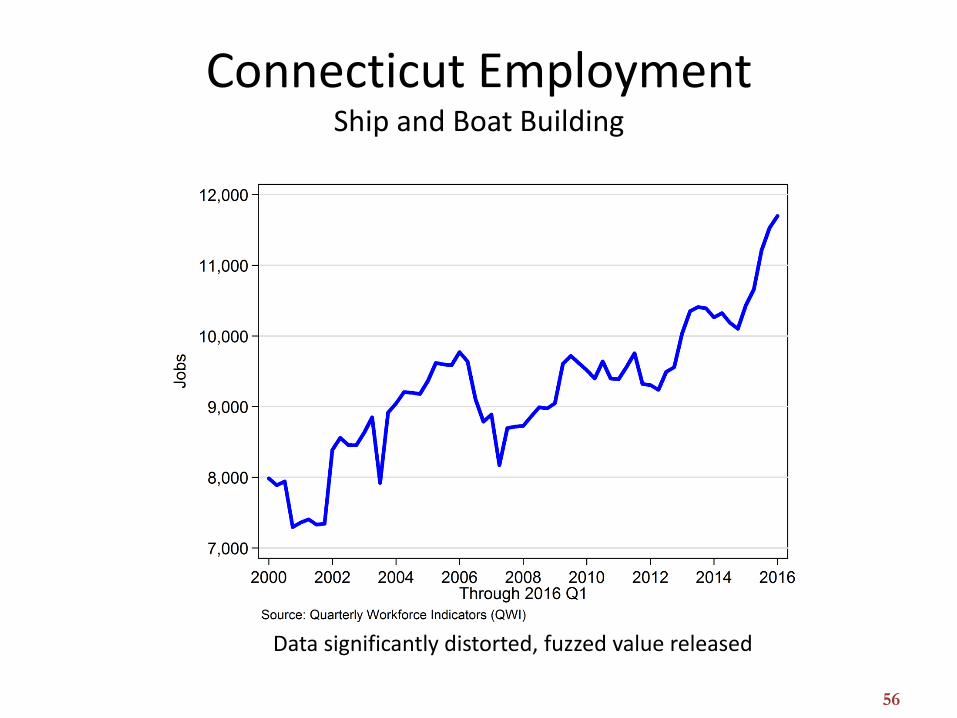
Connecticut Employment Ship and Boat Building
Data significantly distorted, fuzzed value released
56

EMPLOYMENT BY AREA AND TOWN
57

Payroll Employment Statewide and Largest Labor Market Areas
58
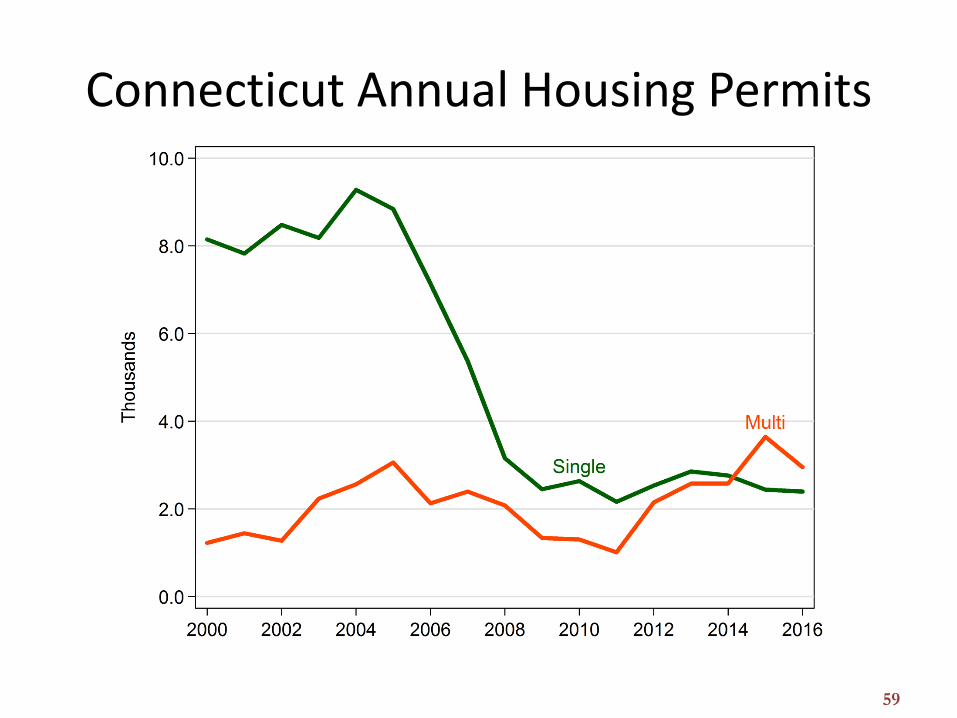
Connecticut Annual Housing Permits
59

Employment Change by Town Eastern Connecticut
60

Employment Change by Town North Central Connecticut
61

Employment Change by Town Northwest Connecticut
62

Employment Change by Town South Central Connecticut
63

Employment Change by Town Southwest Connecticut
64

POPULATION, DEMOGRAPHICS & PROJECTIONS
65

Births in Connecticut
66

Connecticut Population Age 5 to 9
67

Connecticut Population Age 10 to 14
68
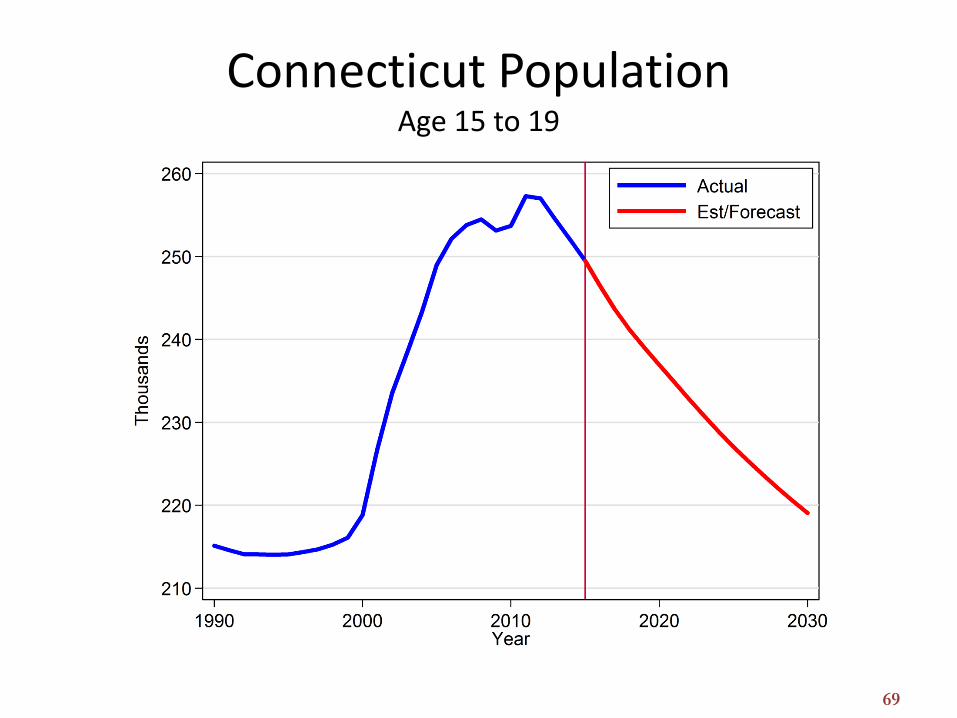
Connecticut Population Age 15 to 19
69

Connecticut Population Age 20 to 24
70

Connecticut Population Age 65 and Over
71

72

Change in U.S. Labor Force 2014 to 2024 by Age
73

Change in U.S. Labor Force 2014 to 2024 by Race or Ethnic Group
74

75

76

77

Connecticut Projections By Industry 2014 to 2024
78

Connecticut Projections Health Care Employment 2014 to 2024
79
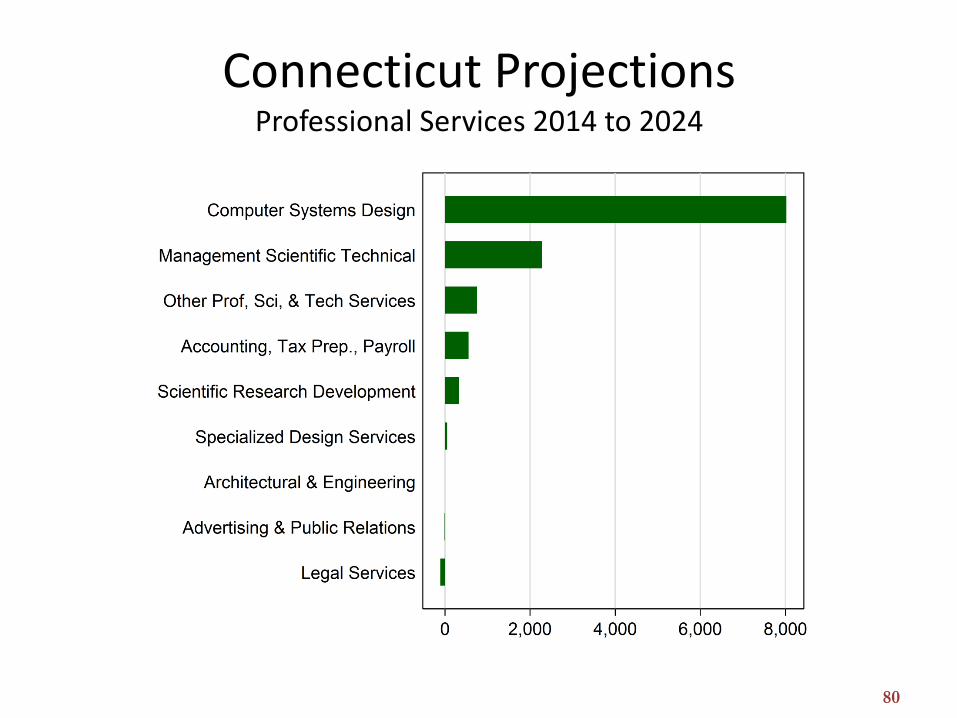
Connecticut Projections Professional Services 2014 to 2024
80

Connecticut Projections Minimum Education for Growth Occupations 2014-2024
81

Connecticut Total Openings 2014-2024 by Median Wage & Minimum Education
82

Connecticut Employment by Size of Firm
83

Connecticut Employment Change by Size of Firm
84

Connecticut Employment Change by Size of Firm
85

Connecticut Employment Change
By Race By Ethnicity
86

87
88

Connecticut Department of Labor Office of Research
89

Office of Connecticut State Treasurer
Denise L. Nappier
2017 Public Finance Outlook Conference
90

Panelists:
David Geick, Director, IT Security Services
Bureau of Enterprise Systems and Technology
Christopher Hauser, 2nd Vice President, Cyber Risk
Travelers Companies, Inc.
Jack McCoy, Chief Information Officer
Town of Manchester
Moderator:
Catherine E. LaMarr, General Counsel
Office of the Treasurer
Protecting Your Town from
Cyber Hacking and Theft
91

Schedule of Presentation
You’ve Been Hacked!
Proper Preparation Prevents Poor
Performance
Pay Me Now or Pay Me [More?] Later
Q & A
92

Resources
Cybersecurity Checklist for Cities http://www.ott.ct.gov/Cashdocs/CybersecurityChecklistforCities.pdf
Mitre Co STIX TAXII List http://www.ott.ct.gov/Cashdocs/MitreCoSTIXTAXIIList.pdf
Cyber Guide https://www.travelers.com/travelers-institute/cyber/resources/cyber-guide.aspx
Cyber Risk Pressure Test https://www.travelers.com/quiz/cyber-security/cyber-risk-pressure
93

Thank you!
94
Office of Connecticut State Treasurer
Denise L. Nappier
2017 Public Finance Outlook Conference
95