Embed Size (px)
Citation preview

Office Fund III

2 | Griffin Partners
This presentation does not constitute an offer to sell, or a solicitation of an offer to buy, any securities by any person. Such an offer may be extended only by the Fund’s Confidential Offering Memorandum. Any such offer will only be made in compliance with applicable federal and state securities laws and will be made exclusively to “accredited investors” as such term is defined by rule 501 under Regulation D of the securities act.
DISCLAIMER AND NOTICE REGARDING FORWARD-LOOKING STATEMENTS
This presentation contains statements which may constitute “forward-looking statements.” Forward-looking statements relate to expectations, beliefs, projections, future plans and strategies, targeted returns, anticipated events or trends and similar expressions concerning matters that are not historical facts. In some cases, investors can identify forward-looking statements by terms such as “anticipate”, “believe”, “could”, “estimate”, “expect”, “forecast”, “intend”, “may”, “plan”, “potential”, “target”, “should”, “will” and “would” or the negative of these terms or other similar terminology. The forward-looking statements are based on the beliefs, assumptions and expectations of the General Partner regarding the future performance of the Fund, and the expectations can change as a result of many possible events or factors, not all of which are known to or within the control of such parties. If a change occurs, the business, financial condition, liquidity and results of operations of the General Partner and/or the Fund may vary materially from those expressed in the forward-looking statements. Investors should carefully consider these risks before making an investment decision with respect to the Fund, along with the factors described in the Offering Memorandum under the heading “Risk Factors” that could cause actual results to vary from forward-looking statements.All forward looking statements, expressed or implied, included in this presentation are expressly qualified in their entirety by the cautionary statements set forth above. These cautionary statements should also be considered in connection with any subsequent written or oral forward looking statements made by the General Partner or anyone acting on behalf of the General Partner about the Fund.
35+ yearsREAL ESTATE INVESTING

3 | Griffin Partners
Table of Contents
Experience ..........................................................................................................4
Our Disciplined Approach ...............................................................6
Our Proven Process ..................................................................................7
Our Track Record.........................................................................................9
Market Opportunity .............................................................................13
Target Markets ............................................................................................15
Fund Objectives and Terms........................................................17
Additional Attributes of the Fund .......................................18
Select Prior Investments .................................................................19
Leadership .......................................................................................................24

4 | Griffin Partners
ExperienceGRIFFIN PARTNERS HISTORY AND BACKGROUNDGriffin Partners is a full service real estate operating company. Since the inception of its investment management business in 1998, Griffin Partners has a fully documented investment track record of 27 separate investments in the value-added space encompassing 33 individual properties. We believe that the best risk adjusted returns are in the value-add space, and therefore the firm’s focus is on value-add infill office and light industrial assets, conservatively leveraged. Weighted average leveraged IRR for the firm’s investments has been 15.6% net of fees and carried interest, achieved over three real estate cycles, with cash yield of 6.8%. Target submarkets are carefully underwritten with extensive analysis of demographics, occupancies, rental rates and property values over multiple cycles. The five partners comprising the investment and asset management senior team have an average tenure at Griffin of 14 years and average industry experience of 26 years. Since the Firm’s inception, Griffin Partners has been involved with 68 individual properties encompassing 11.2 million square feet with an aggregate value exceeding $1.5 billion.
1980
1995
1998
2002
2003-10
2011
Established as a developer
Began acquiring & managing office buildings
Started formal investment management business
Fund I
JV Investments
Fund II
27 33separate
investmentsindividual properties
VALUE-ADDED REAL ESTATESINCE 1998

5 | Griffin Partners
Griffin Partners is raising its third value-added fund that will target investments in existing office and light industrial real estate assets located primarily in Sunbelt markets experiencing employment growth rates consistently above the national average. Value-added real estate investment strategies generally target properties that are not fully occupied and can be acquired at a substantial discount to replacement cost. Griffin Partners differentiates its approach to value-added investment by also focusing on fundamentals at the sub-market level, in particular, growth in historical rental rates from market peak to market peak. Within desirable sub-markets, Griffin Partners seeks properties situated at fundamentally sound locations which have been poorly managed, capital constrained, or adversely impacted by temporary externalities. These property level characteristics tend to drive vacancies higher despite the relative favorable performance of the sub-market and quality of the location. Improving management, leasing and marketing, completing deferred maintenance, making common area upgrades, investing capital to improve tenant spaces, addressing inadequate parking capacity and removing undesirable tenants are among strategies we employ to raise occupancy and rental rates and thereby value.
We are disciplined sellers and always seek to exit an investment as soon as the specific business plan for that investment is complete.
Fund III

6 | Griffin Partners
Our Disciplined Approach 4-Step Process
1.Investment Targets
Location-based Investing
Source via Broker & Owner
Relationships
Asset Filter & Cursory Review
Preliminary Financial Underwriting
Daylight Investment with Equity
Sources
Submit Initial Non-binding
Offer
2.Underwriting Process
Finalize Proforma Underwriting
Negotiate Final Price/Terms
Investment Committee Approval
Execute Binding Contract
3.Contract Process
Complete Due Diligence
Complete Equity & Debt Placement
Asset Management Transition
Closing
4.Closing Process
$1.5 BillionAggregate Property Value Managed

7 | Griffin Partners
Our Proven Process For Successful Real Estate Investing
Strong Market and Sub-market Demographics
and Job Growth
Historical Multi-cycle
Peak-to-Peak Rental Rate
Growth
Rent Roll Diversification in Multi-tenant Buildings with No More Than 35% Leased to
Any Tenant
Low Leverage: No More Than
65% Loan-to-Cost
Profitable Investment
8 | Griffin Partners
The Fund will target investments anticipated to generate 16%-18% internal rates of return at the property level, a performance objective that is consistent with Griffin Partners’ historical track record using similar leverage. Griffin Partners believes target returns of 16%-18% using conservative leverage represent a compelling risk adjusted return opportunity to investors.
The Fund will be the third real estate investment fund sponsored by Griffin Partners. The first fund, Griffin Partners Office I – 2002, L.P., was raised and invested in the fall and winter of 2002. The fund acquired four properties. All four of those properties have been sold.
Griffin’s Fund II concluded its fund raise with a final closing in December 2012, and completed its three year investment period as of December 31, 2015, having invested 94.3% of its committed capital in eleven (11) office and industrial assets in Texas, North Carolina and Arizona. Total partners’ capital invested by Fund II equaled $22.9 million. Three (3) investments were direct with Fund II as the exclusive or primary owner, and eight (8) were joint venture investments made with institutional partners wherein a Fund II affiliate had a minority interest and operating control as the operating partner. One of Fund II’s investments, a mezzanine loan, has been repaid achieving a realized IRR of 19.2%, and the fund manager expects to sell two or more of Fund II’s investments in 2016.
Fund II’s eleven (11) investments have been spread across 2.3 million square feet of office and light industrial real estate in six (6) different cities having an aggregate original investment value of $305 million and a December 2015 market value of $345 million. Each of Fund II’s investments are conservatively leveraged on a stand-alone basis with an initial weighted average loan to purchase price ratio of 60%. Fund II has made quarterly distributions of operating cash flow since the first quarter of 2013 and is currently paying a 5%+ annualized cash yield.
The fund targets investments anticipated to generate
16-18% internal rates of return.

9 | Griffin Partners
Our Track Record Fund II: 2011 - 2015 By the Numbers
9
210 18 11
3541,677Distinct Metro
Markets Targeted
Purchase Offers /156 2nd Offers Purchase
ContractsInvestments
Closed
Detailed Underwritings
Distinct Property Investment
Opportunities Reviewed
80% widely marketed and20% Unsolicited,
off-market or failed process
Public Data Subscription Databases Proprietary Database2,100+ Properties
AND

10 | Griffin Partners
Investment Track Record
Griffin Partners Office Fund I - Summary Valuation at December 31, 2015 ($ millions)
Property Name Date of Investment
Location Size (SF)
Total Cost
Total Equity
Distributed Fair Value(1)
Realization Date
Annualized Cash Yield
Equity Multiple
IRR
2424 & 2500 Wilcrest Oct-02 Houston 153,736 $9.6 $3.2 $4.7 N/A Mar-07 5.3% 1.49 10.8%
Physicians Centre Aug-02 Bryan 114,493 11.5 3.4 4.4 N/A Apr-12 6.0% 1.29 3.8%
Tower II Dec-02 Corpus Christi 289,462 5.3 2.9 9.1 N/A Sep-15 8.2% 3.14 16.6%
TOTAL 557,691 $26.4 $9.5 $18.2 6.6%(2) 1.93 11.0%(2)
Fees, Expenses & Carried Interest
Management Fees - - -
Partnership Expenses - - (0.3)
Carried Interest - - (0.6)
TOTAL to LPs $26.4 $9.5 $17.3 4.7% 1.81 9.1%
Notes: (1) N/A indicates property has been sold and/or investment realized as of December 31, 2015.(2) Weighted average Yield and IRR are weighted on fair value, or distributions if realized.(3) Total equity includes all investors, both Griffin Partners entities and other institutional investors.(4) Total equity and distributions include only Fund II’s portion, not equity or distributions of other investors.(5) Indicates the current estimated value of Fund II’s interest in the property, including any promoted interest attributable to Fund II.(6) Fund II IRR calculations assume the fair value of Fund II’s interest as if the asset had been sold on December 31, 2015.
Fund I

11 | Griffin Partners
Investment Track Record
Griffin Partners Separate Investments - Summary Valuation at December 31, 2015 ($ millions)
Property Name Date of Investment
Location Size (SF)
Total Cost
Total Equity
Distributed Fair Value(1)
Realization Date
Annualized Cash Yield
Equity Multiple
IRR
Beltway Service Center Jun-98 Houston 86,700 $5.7 $0.8 $2.4 N/A Apr-03 0.0% 2.87 30.6%
Suburban Office Sep-99 Houston 191,583 19.2 7.0 12.2 N/A Mar-05 6.7% 1.75 10.6%
CBD Office Sep-99 Victoria 167,719 7.9 2.6 12.0 N/A Jun-09 14.2% 4.58 26.1%
CBD Office May-00 El Paso 309,814 8.8 2.7 14.6 N/A Jun-08 18.2% 5.37 38.4%
Hudson Products Bldg Mar-01 Houston 26,145 4.0 0.8 1.4 N/A Oct-03 6.8% 1.79 27.8%
14800 St. Mary's Jul-02 Houston 84,775 6.1 6.1 8.9 N/A Feb-07 0.0% 1.46 9.8%
Suburban Office Dec-03 San Antonio 325,898 43.7 11.8 23.6 N/A Apr-10 9.3% 2.00 18.6%
Suburban Office Dec-03 San Antonio 168,637 18.3 6.2 16.0 N/A Sep-12 9.5% 2.57 15.0%
Suburban Office Dec-03 San Antonio 241,248 26.9 7.8 20.3 N/A May-13 10.5% 2.62 12.8%
Suburban Office Jun-04 Dallas 145,866 10.6 3.7 6.4 N/A Jun-07 4.1% 1.70 19.1%
Suburban Office Sep-05 Houston 341,947 47.4 17.6 36.8 N/A Mar-12 4.7% 2.09 14.6%
CBD Office Mar-07 Houston 795,115 153.9 54.9 151.8 N/A Feb-15 7.2% 2.77 16.0%
TOTAL 2,885,447 $352.5 $122.1(3) $306.5 7.5%(2) 2.51 16.9%(2)
Fees, Expenses & Carried Interest
Management Fees - - -
Partnership Expenses - - -
Carried Interest - - (13.3)
TOTAL to LPs $352.5 $122.1 $293.1 $- 7.5% 2.40 16.3%
Notes: (1) N/A indicates property has been sold and/or investment realized as of December 31, 2015.(2) Weighted average Yield and IRR are weighted on fair value, or distributions if realized.(3) Total equity includes all investors, both Griffin Partners entities and other institutional investors.(4) Total equity and distributions include only Fund II’s portion, not equity or distributions of other investors.(5) Indicates the current estimated value of Fund II’s interest in the property, including any promoted interest attributable to Fund II.(6) Fund II IRR calculations assume the fair value of Fund II’s interest as if the asset had been sold on December 31, 2015.
Separate Investments

12 | Griffin Partners
Investment Track Record
Griffin Partners Office Fund II - Summary Valuation at December 31, 2015 ($ millions)
Property Name Date of Investment
Location Size (SF)
Total Cost
Total Equity
Distributed Fair Value(1)
Realization Date
Annualized Cash Yield
Equity Multiple
IRR(6)
12603 Southwest Freeway Jun-12 Houston 142,009 $14.0 $3.8 $0.5 $6.2 Not Sold 3.9% 1.77 17.0%
Suburban Office Aug-12 Dallas 308,038 42.2 0.7 0.1 2.0 Not Sold 4.1% 3.14 30.1%
Commerce Center Sep-12 Houston 93,945 11.1 0.7 0.1 1.1 Not Sold 2.8% 1.53 13.9%
Suburban Office Dec-12 Houston 504,721 86.0 2.6 1.0 2.9 Not Sold 12.9% 1.55 17.6%
Parkway Fountains Jun-13 Phoenix 82,811 11.3 4.1 - 4.5 Not Sold 0.0% 1.09 3.4%
Tower II Mezzanine Loan Jun-13 Corpus Christi 795,115 0.6 0.6 0.8 - Sep-15 14.0% 1.43 19.2%
Suburban Office Feb-14 Phoenix 77,432 10.7 0.8 - 0.7 Not Sold 0.0% 0.98 -1.0%
CBD Office Dec-14 San Antonio 534,184 106.5 5.3 0.7 5.3 Not Sold 12.3% 1.13 12.3%
Suburban Office Oct-15 Raleigh 99,181 20.3 0.9 - 0.9 Not Sold 0.0% 1.00 N/A
Suburban Office Dec-15 Phoenix 104,534 17.0 1.3 - 1.3 Not Sold N/A 1.00 N/A
Suburban Office Dec-15 Raleigh 56,933 6.1 0.3 - 0.3 Not Sold N/A 1.00 N/A
Cash Reserves - 1.9 1.9 (0.3) 1.9 N/A 0.0 N/A N/A
TOTAL 2,798,903 $327.7 $22.9 (4) $2.9(4) $27.1(5) 5.9%(2) 1.31 13.7%(2)(6)
7.8% 18.0%
Fees, Expenses & Carried Interest
Management Fees $- $- $(0.9) -
Partnership Expenses - - (0.4) -
Carried Interest - - - -
TOTAL to LPs $327.7 $22.9 $1.6 $27.1 4.1% 1.25 12.7%
Size (SF) Total Cost Total Equity Distributed Fair Value Annualized Cash Yield Equity Multiple IRR
5,736,388 $706.6 $154.5 $312.0 $27.1 7.1% 2.19 15.6%
TOTAL Net to LPs - All Investments
(1) N/A indicates property has been sold and/or investment realized as of December 31, 2015.(2) Weighted average Yield and IRR are weighted on fair value, or distributions if realized.(3) Total equity includes all investors, both Griffin Partners entities and other institutional investors.
Notes: (4) Total equity and distributions include only Fund II’s portion, not equity or distributions of other investors.(5) Indicates the current estimated value of Fund II’s interest in the property, including any promoted interest attributable to Fund II.(6) Fund II IRR calculations assume the fair value of Fund II’s interest as if the asset had been sold on December 31, 2015.
Fund II and Total Net to LPs
Underwritten Returns Through Life of Fund II

13 | Griffin Partners
Market Opportunity
By the end of 2015, capital flows had resulted in the highest historical spread ever between cap rates in secondary markets and cap rates in primary markets, reaching 160 basis points (bp). That spread, which is for all property types, compares to a 15 year average of around 95 bp, and a low a few years before the global financial crisis (GFC) of less than 50 bp. The widely accepted definition of major (primary) markets includes only NYC, San Francisco, LA, Washington, Chicago and Boston. Griffin Partners believes that the liquidity premium represented by this spread is a lingering legacy of the GFC and significantly exceeds its appropriate level. We seek to benefit by making acquisitions in secondary markets where assets presently provide the most compelling risk adjusted returns. It is likely that this spread will compress over time as capital flows become more balanced.
10%
9%
8%
7%
6%
5%
4%
3%
2%
1%
0%2001 2002 2003 2004 2005 2006 2007 2008 2009 2009 2011 2012 2013 2014 2015
Spread Between Office Cap Rates and Interest Rates
10yr UST CBD Office CAP Rates Suburban Office CAP Rates
Source: RCA, HFF

14 | Griffin Partners
There is a correlation between yields on real estate and interest rates, particularly over the longer term, but the correlation coefficient is lower than widely believed. Charting office cap rates versus the 10 year US Treasury indicates the spread between the two varies dramatically over time. Since 2001 it has been as low as 43 bp in 2007, as high as 457 bp in 2009 and currently stand at about 350 bp. Furthermore some lag time can be observed, and most importantly, there is little evidence of direct causation. In a research report published in 2015, CBRE compares the global office composite yield to the US unemployment rate, which CBRE posits as the best single indicator of the global economic cycle. The data encompass three full economic cycles and show a “close correspondence between the US labor market and global yields.” This suggests that if interest rates rise over the next few years, the spread between interest rates and cap rates will likely compress as long as the trend in the US unemployment rate continues to be downward to stable.
7.0
6.5
6.0
5.5
5.0
4.5
4.0
12
10
8
6
4
2
0
Source: CBRE Econometric Advisors
Global Office Composite (left scale) U.S. Unemployment (right scale)
1989
Q2
1990
Q2
1991
Q2
1992
Q2
1993
Q2
1994
Q2
1995
Q2
1996
Q2
1997
Q2
1998
Q2
1999
Q2
2000
Q2
2001
Q2
2002
Q2
2003
Q2
2004
Q2
2005
Q2
2006
Q2
2007
Q2
2008
Q2
2009
Q2
2010
Q2
2011
Q2
2012
Q2
2013
Q2
2014
Q2
Composite Global Office Yields and US Unemployment %

15 | Griffin Partners
Ultimately, intermediate and long term job growth is the most relevant indicator signaling future improvement in leasing demand for office and light industrial real estate assets. Fund III intends to acquire assets in markets with favorable long term demographic trends and job growth exceeding the national average and that have at least 400,000 employees on non-farm payrolls. We believe that a minimum of 400,000 non-farm employees in a market ensures sufficient liquidity for commercial real estate to allow for exiting investments in a reasonably timely manner. The most recent US Bureau of Labor Statistics report on job growth in all of the US Metropolitan Statistical Areas (“MSA”) highlights several markets that meet these selection criteria. The list is summarized in the nearby table.
Non-farm Payroll Statistics
January 2000
January 2010
December 2014
December 2015 Number Percent Number Annual % Number Annual %
Austin 653.00 760.00 929.00 964.00 34.9 3.8% 203.9 4.0% 311.2 2.5%
Charlotte 911.00 933.00 1,094.00 1,130.00 36.1 3.3% 196.9 3.2% 219.4 1.4%
Dallas-Fort Worth 2,725.00 2,858.00 3,359.00 3,458.00 98.9 2.9% 599.8 3.2% 733.1 1.5%
Denver 1,190.00 1,183.00 1,374.00 1,398.00 24.2 1.8% 215.4 2.8% 207.9 1.0%
Houston 2,214.00 2,501.00 2,993.00 3,016.00 23.2 0.8% 514.8 3.2% 801.8 2.0%
Nashville 719.00 742.00 899.00 929.00 29.1 3.2% 186.1 3.8% 209.7 1.6%
Phoenix 1,551.00 1,687.00 1,885.00 1,939.00 55.3 2.9% 252.0 2.3% 388.5 1.4%
Raleigh 427.00 488.00 577.00 587.00 10.4 1.8% 99.4 3.1% 159.8 2.0%
Salt Lake City 542.00 584.00 661.00 681.00 19.9 3.0% 96.9 2.6% 138.9 1.4%
San Antonio 744.00 846.00 965.00 999.00 33.6 3.5% 152.7 2.8% 254.5 1.9%
US Total 131,010.00 129,802.00 140,402.00 143,137.00 2,735.0 1.9% 13,335.0 1.6% 12,127.0 0.6%
Change from Dec. 2014 to Dec.
2015 1 Year
Change from Q1 2010 to Q4 2015
6 Years
Change from Q1 2000 to Q4 2015
16 Years
Target Markets

16 | Griffin Partners
Selected Geography and Market Resource Alignment
Several MSAs on the East and West coasts also meet the target market criteria described above; however, Griffin Partners believes that these markets are less suitable targets for the Fund because substantial domestic and foreign capital flows have depressed yields, particularly in the large “gateway” markets. Furthermore, the Fund’s principals believe in and practice “hands-on” management that requires frequent visits to the assets by senior managers, and as such, limiting the number and relative distance between markets improves the amount of time that the Fund’s principals can spend in each market and with each asset. An affiliate of the Fund, Griffin Partners, Inc. (“GPI”), will provide property management services for each of the fund’s assets at fair market rates. GPI has been providing property management services for owned assets and on a third party basis since 1980.
GPI takes a very pro-active property management approach, benchmarks its performance against industry data, and consistently hires and trains top-notch professionals. GPI’s property management team has in-house expertise and leadership in numerous critical areas including energy efficiency, budgeting/accounting supervision, operating expense control, vendor contract negotiations, value-added construction, and hands-on tenant retention programs. In each market the Fund will retain third party leasing firms of the highest caliber to provide leasing services.
AustinCharlotte
Dallas-Fort WorthDenver
HoustonNashville
PhoenixRaleigh
Salt Lake CitySan Antonio
17 | Griffin Partners
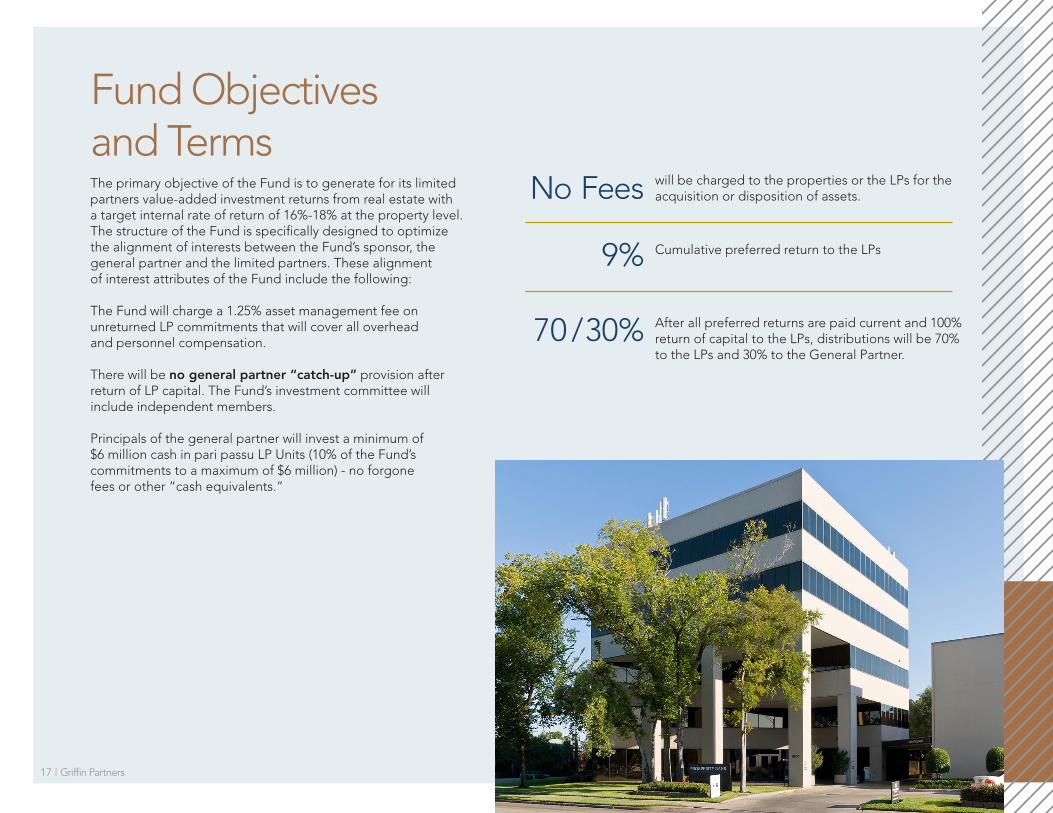
Fund Objectives and Terms The primary objective of the Fund is to generate for its limited partners value-added investment returns from real estate with a target internal rate of return of 16%-18% at the property level. The structure of the Fund is specifically designed to optimize the alignment of interests between the Fund’s sponsor, the general partner and the limited partners. These alignment of interest attributes of the Fund include the following:
The Fund will charge a 1.25% asset management fee on unreturned LP commitments that will cover all overhead and personnel compensation.
There will be no general partner “catch-up” provision after return of LP capital. The Fund’s investment committee will include independent members.
Principals of the general partner will invest a minimum of $6 million cash in pari passu LP Units (10% of the Fund’s commitments to a maximum of $6 million) - no forgone fees or other “cash equivalents.”
9%
70 / 30%
No Fees
Cumulative preferred return to the LPs
After all preferred returns are paid current and 100% return of capital to the LPs, distributions will be 70% to the LPs and 30% to the General Partner.
will be charged to the properties or the LPs for the acquisition or disposition of assets.

18 | Griffin Partners
Additional Attributes of the Fund A portion of the Fund will be invested alongside institutional capital in joint ventures allowing the Fund to further diversify its holdings and potentially benefit from available promoted interest structures.
65%
16-18%
7%
15%
Low leverage – The partnership agreement specifically prohibits leverage in excess of 65% loan-to-investment cost.
Target returns of 16% to 18% IRR are consistent with the previous investment track record of the sponsor’s prior funds and the Fund’s principals.
Current cash yield for the Fund is expected to be 7% over the Fund life, also consistent with historical performance.
The Fund may invest up to 15% of its committed capi-tal in speculative development projects.

19 | Griffin Partners
BANK OF AMERICA PLAZA – San Antonio, Texas
Griffin Partners acquired Bank of America Plaza in December 2014. The building is a twenty-eight story, Class A project located in the northern end of San Antonio’s Central Business District. It is the largest multi-tenant office building in San Antonio and has been institutionally managed and leased since inception. The building was built in 1983 and is 532,922 square feet. B of A Plaza has excellent ingress and egress to all major thoroughfares of I-10 (to Houston), I-35 (to Austin and Dallas), and I-37 (to Corpus Christi). Upgrades of the common areas should enhance tenant retention which is key to the overall investment strategy of this project, with Bank of America as a long term tenant for over 20 years.
THE OFFICES AT PIN OAK PARK – Bellaire, Texas
The Offices at Pin Oak Park were acquired in December 2012. The two parcels totaling 11.9 acres includes five buildings totaling 504,721 square feet. The buildings range from five to ten stories in height and were originally developed between 1974 and 1980. Located on I-610 West Loop at Bellaire, this suburban Houston project has excellent proximity to the Texas Medical Center and Galleria/Uptown submarkets. As a result, the project experiences spillover demand from both office and medical users in these submarkets and medical users currently account for 54% of the occupied area. One building, 6700 West Loop South is 100% leased to medical users.
Our Success Stories Prior Investments

20 | Griffin Partners
PLANO CORPORATE CENTER I & II – Plano, Texas
These twin 154,00 square foot buildings were acquired by Griffin Partners in August 2012. Each building is three stories with efficient 50,000 square foot floor plates and ample 5/1000 square foot parking which caters to larger high- density users. As a result, the project has been developing a strong roster of credit tenants including Penny Mac, United Health and Fresenius who utilize the facility for customer service and back-office purposes.
CAROLINA PLACE – Raleigh, North Carolina
Griffin Partners recently acquired Carolina Place in October 2015. This 99,181 square foot, institutional quality office asset is in an irreplaceable location overlooking the Carolina Country Club just inside the Raleigh Beltline. The surrounding neighborhoods are some of the most prestigious and wealthiest zip codes in all of Raleigh/Durham. The tenant roster is a “who’s who list” of strong credit players in the local market and cover various industries including financial services, healthcare providers and law firms.
Our Success Stories Prior Investments

21 | Griffin Partners
1500 CITY WEST – Houston, Texas
Griffin Partners acquired 1500 City West in September 1999. The building is a ten-story office building located in the west Houston submarket known as Westchase District just off of the Sam Houston Tollway. The property contains 191,583 rentable square feet and has an adjacent parking garage. The building features a contemporary white steel spandrel and glass exterior. Griffin Partners renovated the main lobby, elevator cabs and common area between the garage and the building. Major tenants that Griffin Partners placed in the building include Allstate Insurance and GE Capital Loan Services (GEMSA).
This asset was underperforming due primarily to a poor tenant mix and outdated aesthetics. Griffin Partners corrected the problem with the tenant mix through the buyout of an undesirable tenant’s lease and updated the building’s interior and common area architectural appeal. The upgrades, re-tenanting and subsequent lease-up added value to the investment. The property was sold in March 2005.
UNION SQUARE I&II – San Antonio, Texas
Griffin Partners acquired Union Square I (USI) in December 2003 from Equity Office Properties Trust (EOP). The 194,399 square foot Class A building is prominently positioned on US 281 at Jones Maltsberger Road in San Antonio’s North Central Submarket and is directly adjacent to the San Antonio International Airport. Union Square offers superior access to many of San Antonio’s more prestigious residential neighborhoods, and many of its tenants choose the project due to exceptional access to nearby executive housing and its desirability to quality employees. Occupancy and tenant satisfaction at USI had deteriorated during a year long sale process by EOP to sell its entire three building San Antonio portfolio. The sale process was lengthy because the effort had twice failed to result in a closing. Griffin Partners had bid each of the two previous times, losing out to higher bidders each time. Partially due to seller fatigue, Griffin Partners was able to acquire the entire EOP San Antonio portfolio (see next page) at a price approximately 7% below its original bid during the first attempted sale. The value-added investment strategy included purchasing assets that were underperforming due primarily to management neglect and deferred maintenance during the lengthy sale process and an inferior tenant mix, all of which was compounded by a market downturn. Griffin Partners improved the aesthetic appeal of the USI which helped in the effort to attract and retain new tenants. The occupancy went from 88% at acquisition to 100% when sold. In addition, a vacant 3 acre development tract came with the asset at acquisition. Griffin Partners erected a six story, 131,185 square foot building, Union Square II on the tract in 2007 to accommodate the expansion of a USI tenant. Griffin Partners sold Union Square I & II in April 2010.
Our Success Stories Prior Investments

22 | Griffin Partners
NORTHWEST CENTER – San Antonio, Texas
Rising 14 stories, the 241,248 square foot Northwest Center is located at the highly visible intersection of Loop 410 and I-10 in San Antonio. The building has striking visual appeal with its silver-tinted solar glass exterior and multiple roof line insets. Three-story columns highlight the main entrance, creating a portico that shelters the three stories of tinted glass windows enveloping the interior atrium. The lobby features polished, cream colored travertine marble and lush interior landscaping. The building offers spectacular views and excellent access to all major thoroughfares throughout the city. Tenants of Northwest Center enjoy an upgraded energy management system, on-site delicatessen, modern building conference room, card-key access and 24 hour security. Retail amenities – including hotels, restaurants and banking – surround the property.
1177 WEST LOOP – Houston, Texas
The beautifully designed 1177 West Loop building is a 341,947 square foot, 18-story, Class A office property located in the Uptown/Galleria sub-market of Houston. It features a simple parabolic curve, wrapped in mirrored glass and polished aluminum, sweeping gracefully toward the West Loop. The reverse side is formed by a series of angles, which begin at the northwest tip of the curve, reaching toward a densely wooded area to the west, and back to meet the southeast tip of the curve. Griffin Partners installed a covered breezeway connecting the building with the garage on the east side of the site and completed major remodelling of the lobby and upgrades to the elevators. The building features on-site management, a large first floor delicatessen, 24-hour manned security, garage parking and excellent access to Houston’s Galleria and Downtown markets.
Our Success Stories Prior Investments

23 | Griffin Partners
1301 FANNIN – Houston, Texas
Located in Houston’s Central Business District, 1301 Fannin is a 795,115 square foot office building that offers a host of safety-related and technological features found in a few other downtown towers. Built to withstand weather- related disasters, 1301 Fannin features raised flooring, hurricane-rated windows and numerous electrical backup systems to ensure data integrity in the event of power loss. Other amenities include on-site security, Luby’s Etc. cafeteria and coffee shop, card key access, tenant conference rooms, fitness facilities and easy access to Houston’s light rail system.
The Class A building has a diverse roster of tenants including global energy firms, banking and financial services companies, consulting and technology firms. In the spring of 2009 the building was upgraded with a $2.4 million dollar lobby renovation. Also in 2009, Griffin completed the first phase expansion of the building’s emergency power system. The $6.4 million expansion provides for an additional four megawatts of N+1 redundant backed-up power. In 2014, we completed a complex and highly technical $6.2 million replacement of the central plant increasing the property’s redundant chilled water capacity 50% from 2,400 tons to 3,600 tons.
Our Success Stories Prior Investments

24 | Griffin Partners
FRED GRIFFIN, CHAIRMAN Mr. Griffin, 77, is founder and Chairman of Griffin Partners, Inc., and its related affiliates. Mr. Griffin joined Exxon Company USA in 1969. It was there that Fred Griffin began his real estate career with Friendswood Development Company, a subsidiary of Exxon Corporation. As an integral part of Friendswood’s growth, he played a key role in the purchase, planning, and development of Kingwood, Woodlake, Greenspoint, Copperfield, Clear Lake City, and other substantial projects throughout the greater Houston area. In 1980, Mr. Griffin, with Conley Juban, formed Griffin/Juban Companies, the predecessor to Griffin Partners. The Griffin/Juban Companies – and subsequently Griffin Partners - have built or acquired projects encompassing approximately 11.2 million square feet space with an aggregate value of $1.5 billion. In addition to serving as Chairman of Griffin Partners, Fred’s other appointments include: Board of Directors and Executive Committee of the Bay Area Houston Economic Partnership, Director of Central Houston, Chairman of Mayor Parker’s Downtown Retail Task Force, Chairman of Space Center Houston, which is an educational visitor’s center for the Johnson Space Center, Chairman of the fund raising for The Shuttle and 747 Carrier Project - Bring the Legacy Home, and Leader of Griffin Partners Project for Development Services Relating to George R. Brown Convention Center Improvements, Construction of Parking Garage and Redesign of Avenida de las Americas.
EDWARD GRIFFIN, PRESIDENT Mr. Griffin, 52, joined Griffin Partners in January 2002 and serves as the company’s President. In addition to his activities in setting the strategic direction and day-to-day management, he is Chairman of the firm’s Investment Committee, and takes a lead role in development activities of the company. Prior to joining the company, Mr. Griffin spent six years as CFO and subsequently CEO of a holding company with operating entities involved with the manufacture and distribution of automotive parts in the United States and Mexico. His career also includes management positions in commercial and investment banking, including five years in the Financial Advisory Services practice of Coopers & Lybrand L.L.P., culminating as Manager of the Houston Corporate Finance Group and six years as vice president and commercial lending officer with the former First City National Bank of Houston. He has extensive skills in many areas of finance and accounting including debt and equity financing, valuation, mergers and acquisitions, and corporate finance in both real estate and industry. Mr. Griffin has significant experience negotiating and executing large, complex transactions and has conducted business in Europe, Africa, Asia and Latin America. Mr. Griffin earned a BA in Economics from Washington & Lee University. He serves on the Board of Directors and Executive Committee of Urban Harvest, is the 2014 President of the Board of the Houston Chapter of NAIOP, a Commercial Real Estate Development Association, and is also on the Board of the Alley Theater.
Bachelor of Science in Physics-EngineeringWASHINGTON & LEE UNIVERSITY
Bachelor of Administration in EconomicsWASHINGTON & LEE UNIVERSITY
Master of Business AdministrationUNIVERSITY OF TEXAS
Board of Directors URBAN HARVEST, THE ALLEY THEATER
Recipient of the 2013 Quasar Award for Exceptional Leadership in Economic Development
2014 President of the BoardNAIOP, HOUSTON CHAPTER
Leadership

25 | Griffin Partners
EDWIN A. (DREW) LEWIS, DIRECTOR OF CLIENT ADVISORY SERVICES Mr. Lewis, 69, is Director of Client Advisory Services for Griffin Partners. Mr. Lewis also serves as the vice president of the General Partner of the Fund and executive vice president of the Manager. In 2015 Drew Lewis joined Lee & Associates – Houston as a Principal focusing on tenant representation and advisory services. Mr. Lewis also acts as Chairman of the Board for the Houston group as well as a representative in Corporate Services for Lee & Associates-Houston. With management and ownership experience that spans more than three decades, Mr. Lewis is known for his strong drive, understanding of market conditions, and ability to recognize future trends. His successful career includes hundreds of assignments, millions of square feet, and the creation and development of three successful companies. Mr. Lewis has an exhaustive knowledge of tenants, the commercial real estate business, and a drive to find the best and highest use for every property Griffin Partners handles. Before joining Griffin Partners in 2002, Mr. Lewis served as Chairman of the Board of NAI Houston, a commercial brokerage service company, while devoting a significant portion of his time to client consulting, tenant representation and investments. His background includes virtually all phases of business and commercial real estate including market forecasting, project marketing, leasing, sales, client representation, build-to-suit, building development, sale-leaseback financing and consulting. His facility background relates to users in office, medical and industrial projects, and he has individually been responsible for representation of more than 10 million square feet of project and user transactions. A native Houstonian, Mr. Lewis is married with one son, Chris, who is now a principal with Lee & Associates of Houston.
LEE MORELAND, EXECUTIVE VICE PRESIDENT/ASSET MANAGEMENT
Mr. Moreland, 55, is the Executive Vice President of Asset Management at Griffin Partners and is responsible for developing strategic objectives and ensuring the execution of strategy for the properties in the Griffin Partners portfolio. Mr. Moreland has more than thirty years of experience in the commercial real estate industry. Prior to joining Griffin Partners in November 2006, he was Vice President-Asset Management, for Crescent Real Estate Equities where he was responsible for the performance of the companies’ joint venture portfolio, consisting of over 8 million square feet of Class A office projects. Mr. Moreland was also responsible for a large portfolio of office buildings throughout the Southwest as Vice President-Regional Manager for CMD Realty Investors. He also served six years with American General as Director of Commercial Real Estate. He graduated from the University of Texas with BBA degrees in Finance and Real Estate and is a former member of the Board of Directors for the Energy Corridor District.
LeadershipFormer Chairman of the Board NAI HOUSTON
Industrial-Petroleum Engineering DegreeUNIVERSITY OF HOUSTON
Bachelor of Business Administration degrees in Finance and Real EstateUNIVERSITY OF TEXAS
Served for 6 years as Director of CommercialReal EstateAMERICAN GENERAL

26 | Griffin Partners
ANDREW MONTGOMERY, EXECUTIVE VICE PRESIDENT/HEAD OF ACQUISITIONS Mr. Montgomery, 41, is the Executive Vice President/Head of Acquisitions at Griffin Partners. Mr. Montgomery has 18 years of commercial real estate experience. In his two years with Griffin Partners he has assisted in various roles of acquisition and disposition, investment strategy, and debt and equity capital raising initiatives, translating to over $172 million in transactions totaling over 1.3 million square feet of office product. Prior to joining the company, Andrew spent fourteen years as Managing Director of Acquisitions for Hines Interests Limited Partnership (“Hines”). While at Hines he was involved in acquiring and/or developing in excess 18.0 million square feet translating to over $4.1 billion of office, multi-family and industrial properties on behalf of several discretionary and non-discretionary Hines funds as well as various one-off capital partnerships. Andrew received his finance degree from Louisiana State University in Baton Rouge, LA and he is currently a board member of Clayton Dabney Foundation for Kids with Cancer, a non-profit organization that sponsors needy families, with children in the last stages of terminal cancer creating lasting memories.
FRED HEYNE, DIRECTOR OF ACQUISITIONS Mr. Heyne, 37, is Director of Acquisitions at Griffin Partners. Mr. Heyne has 10 years of commercial real estate experience. He works directly with Andrew Montgomery, Executive Vice President/Head of Acquisitions, and currently manages acquisitions activities, underwriting, market analysis and the property database. Fred started with Griffin Partners as an hourly independent contractor managing the company’s property database and in his 5 years with Griffin has assisted in analyzing 2000+ properties for acquisition, underwritten 400+, resulting in the disposition and/or acquisition of 2.3 million square feet of office and industrial properties for Griffin totaling $350 million. Fred is a licensed real estate broker in Texas. He is a fifth generation Houstonian and attended St. John’s School and Episcopal High School. He has a BA in Maritime Studies from Texas A&M University. Fred and his family are heavily involved in the Special Needs Department at Texas Children’s Hospital and the Arbor School.
LeadershipBachelors Degree in Finance LOUISIANA STATE UNIVERSITY
Bachelor of Arts Degree TEXAS A&M UNIVERSITY
Board MemberCLAYTON DABNEY FOUNDATION
Licensed Real Estate Broker in Texas

FOR ADDITIONAL INFORMATION, PLEASE CONTACT EDWARD GRIFFIN:
713-439-5322
Office Fund III