Embed Size (px)
Citation preview

2Q2017OFFICE
reportPowerful Performance. Extraordinary Results.
Houston Economic IndicatorsThe Houston Business-Cycle Index has expanded at an average annual rate of 3.3 percent so far in 2017 - close to its historical average. Revisions to data at the end of 2016, however, left the index reading considerably weaker than initially estimated.
After surging in 2015 and 2016, the number of layoffs filed with the Texas Workforce Commission under the Worker Adjustment and Retraining Notification Act is normalizing. At an average level of 376 from March to May, monthly filings are close to their historical average for Houston. Current figures are still higher than those observed between 2009 and 2015 but are consistent with a market that is putting the oil bust behind it.
In past oil busts, it took about three months for the rig count and about a year for the mining-related job count to bottom out once oil prices began to recover. West Texas Intermediate (WTI) crude oil hit bottom in February 2016, followed by the rig count in May 2016. It looks like mining-related employment in Houston bottomed out in December 2016, though that data may be revised. Since December, mining-related jobs have grown by 7,300.
Recent changes in other leading indicators such as stock values, single-family permits, chemical production, home sales and job advertisements are—in aggregate—supportive of a modest pickup in employment growth in the months ahead.
Source: Federal Reserve Bank of DallasJune 2017
WHAT’S IN THIS ISSUE?PAGE 4: In the NewsPAGE 6: Market SnapshotPAGE 7: Houston EconomyPAGE 10: Development UpdatePAGE 15: Submarket Snapshot
HOT MARKET TOPICS

2 C
OLVI
LL O
FFIC
E PR
OPER
TIES
2Q
2017
OFF
ICE
MAR
KET
REPO
RT
HOUSTON’S PREMIER
WESTCHASE LOCATION
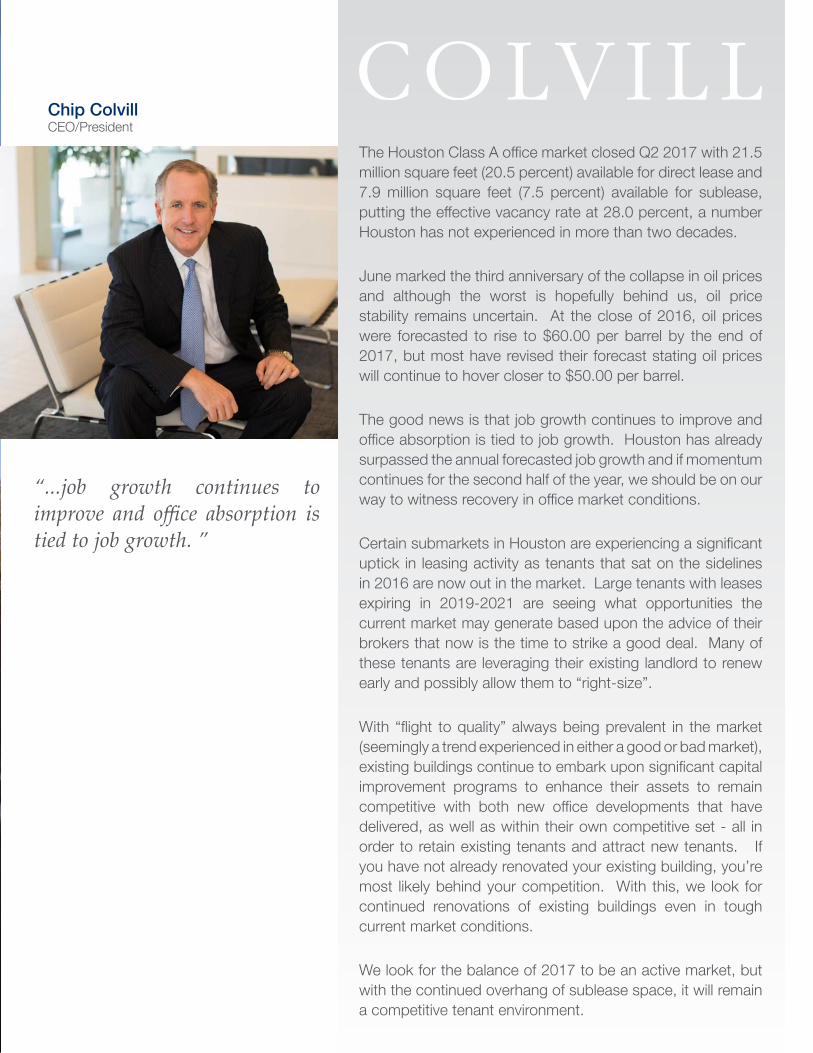
The Houston Class A office market closed Q2 2017 with 21.5 million square feet (20.5 percent) available for direct lease and 7.9 million square feet (7.5 percent) available for sublease, putting the effective vacancy rate at 28.0 percent, a number Houston has not experienced in more than two decades.
June marked the third anniversary of the collapse in oil prices and although the worst is hopefully behind us, oil price stability remains uncertain. At the close of 2016, oil prices were forecasted to rise to $60.00 per barrel by the end of 2017, but most have revised their forecast stating oil prices will continue to hover closer to $50.00 per barrel.
The good news is that job growth continues to improve and office absorption is tied to job growth. Houston has already surpassed the annual forecasted job growth and if momentum continues for the second half of the year, we should be on our way to witness recovery in office market conditions.
Certain submarkets in Houston are experiencing a significant uptick in leasing activity as tenants that sat on the sidelines in 2016 are now out in the market. Large tenants with leases expiring in 2019-2021 are seeing what opportunities the current market may generate based upon the advice of their brokers that now is the time to strike a good deal. Many of these tenants are leveraging their existing landlord to renew early and possibly allow them to “right-size”.
With “flight to quality” always being prevalent in the market (seemingly a trend experienced in either a good or bad market), existing buildings continue to embark upon significant capital improvement programs to enhance their assets to remain competitive with both new office developments that have delivered, as well as within their own competitive set - all in order to retain existing tenants and attract new tenants. If you have not already renovated your existing building, you’re most likely behind your competition. With this, we look for continued renovations of existing buildings even in tough current market conditions.
We look for the balance of 2017 to be an active market, but with the continued overhang of sublease space, it will remain a competitive tenant environment.
“...job growth continues to improve and office absorption is tied to job growth. ”
Chip ColvillCEO/President

4 C
OLVI
LL O
FFIC
E PR
OPER
TIES
2Q
2017
OFF
ICE
MAR
KET
REPO
RT
In the NewsThe Airbnb of Commercial Real Estate ArrivesSpacegrab is a new online commercial leasing platform that allows tenants to sublease a portion or all of their space, and it launched in Los Angeles this quarter. GlobeSt.com interviewed Founder David Hay on the new concept introduced into the commercial real estate marketplace.GlobeSt.com: Tell me about the concept behind Spacegrab?David Hay: Spacegrab is a secondary marketplace for commercial real estate leases. We are the only online site where leaseholders can exit a portion or all of their lease through a sublease or assignment. There is no other service that allows leaseholders to exit through these two options. We are really allowing for a user-friendly and easy-to-use listing service so that users can get a listing in two to three minutes. Those users can then get in touch with the listing tenant directly. We have partnered with BizEquity, which is a company that does evaluation services, and Sharplaunch, which is a marketing company that provides marketing packages for people looking to market their space. We are really the one-stop-shop if someone wants to come in and understand what their business is worth, what their lease is worth and get brokerage services, if needed. We are really looking to provide opportunities that no one else has.
GlobeSt.com: What was the impetus to launch this platform?Hay: I have a background in all facets of the commercial real estate industry, whether finance, brokerage, acquisition or development. Through my own experiences, I realized that the industry lags other industries in terms of efficiency and transparency, and most importantly, there is a need for everything to be cloud based and digital. In the last couple of years, there has been a massive push toward tech. In 2016, there was more than $2.6 billion in venture capital money spent on commercial real estate tech investing. My motivation was seeing that a lot of tenants were dissatisfied both on the landlord side and with their financing. They couldn’t accurately predict their sales and growth for three to five years, but were forced to commit to leases that were locking them in for longer periods of time. I have been able to acquire properties where the tenant was under-performing, and I was able to negotiate the early termination of the lease and bring in a tenant that would be more suitable for the property, thus creating value. Value-propositions that I put into place through my own experiences and by bridging the gap between business owners and leaseholds were really the main motivating forces.
GlobeSt.com: Is there a conflict with leaseholders transferring their lease to other users?Hay: We are offering a marketplace. Ultimately, the leaseholders will need to get approval from the landlord. If the lease rate is so low that the landlord would never agree to it, then maybe it is a situation where the landlord would want to buy out the tenant. If the lease term allows for a transfer by a sublease, the landlord can purchase it or someone else can. What we are doing is creating a transparent system where the leaseholder can value their lease, value their business, and potentially make the most use of their space. Right now, it is highly inefficient for someone to be locked in a lease without a lifeline. It does no good for the landlord. It is both inefficient and inelastic, and it makes no sense.
GlobeSt.com: Are landlords able to use the site as a marketing tool?Hay: This is meant for current leaseholders to either sublease a portion of the space or assign the lease over to someone else completely. The landlord has only one role to play in this, and that is agreeing to the transfer. The landlord is ultimately going to be getting a tenant that is better suited for their property. This platform is meant for leaseholders.
GlobeSt.com: Why are you launching in L.A., and where is the business headed?Hay: Los Angeles is a pretty good testing ground for this, because it has a diverse economy. We are going to be going to San Diego and San Francisco next, working our way through California. The plan is going to be to go nationwide in the near future.
Source: GlobeSt.com, May 2017

COLVILL OFFICE PROPERTIES 2Q 2017 OFFICE MARKET REPORT 5
MARKET SNAPSHOT
Powerful Performance. Extraordinary Results.
Houston Market Snapshot 6Houston Economy 7Development Update 10
SNAPSHOT

6 C
OLVI
LL O
FFIC
E PR
OPER
TIES
2Q
2017
OFF
ICE
MAR
KET
REPO
RT
Market SnapshotHOUSTON METRO TRENDS 06.2017 05.2017 04.2017 03.2017 02.2017 01.2017
Nonfarm Payroll Employment (in Ks) 3,058.9(p) 3,048.2 3,042.2 3,024.1 3,010.1 2,995.0
Change in Jobs (in Ks) 10.7(p) 6.0 18.1 14.0 15.1 -41.0
Unemployment Rate Not Released 5.1% 5.3% 5.7% 5.9% 5.7%
WTI Crude Oil Spot Price (price per barrel) $45.18 $48.48 $51.06 $49.33 $53.47 $52.50
Henry Hub Natural Gas Spot Price (price per MMBtu) $2.98 $3.15 $3.10 $2.88 $2.85 $3.30
Single-family Home Sales 8,414 8,156 6,583 7,013 4,993 4,080
Median Sales Price $239,000 $235,000 $228,000 $227,500 $220,000 $210,000
HOUSTON OFFICE TRENDS Q2 2017 Q1 2017 Q4 2016 Q3 2016 Q2 2016 Q1 2016Class A Occupancy Rate 72.0% 72.3% 73.2% 73.2% 75.1% 77.7%
Class A Average Net Asking Rate $24.14 $24.31 $24.40 $24.71 $24.93 $25.42
Class A Under Construction (SF in thousands) 2,405 1,979 2,572 2,572 2,828 4,433
ENCLAVE PLACE | 1
3 0 0 , 0 0 0 S F O F P R E M I U M C L A S S A O F F I C E S PA C E I N H O U S T O N ’ S E N E R G Y C O R R I D O R

COLVILL OFFICE PROPERTIES 2Q 2017 OFFICE MARKET REPORT 7
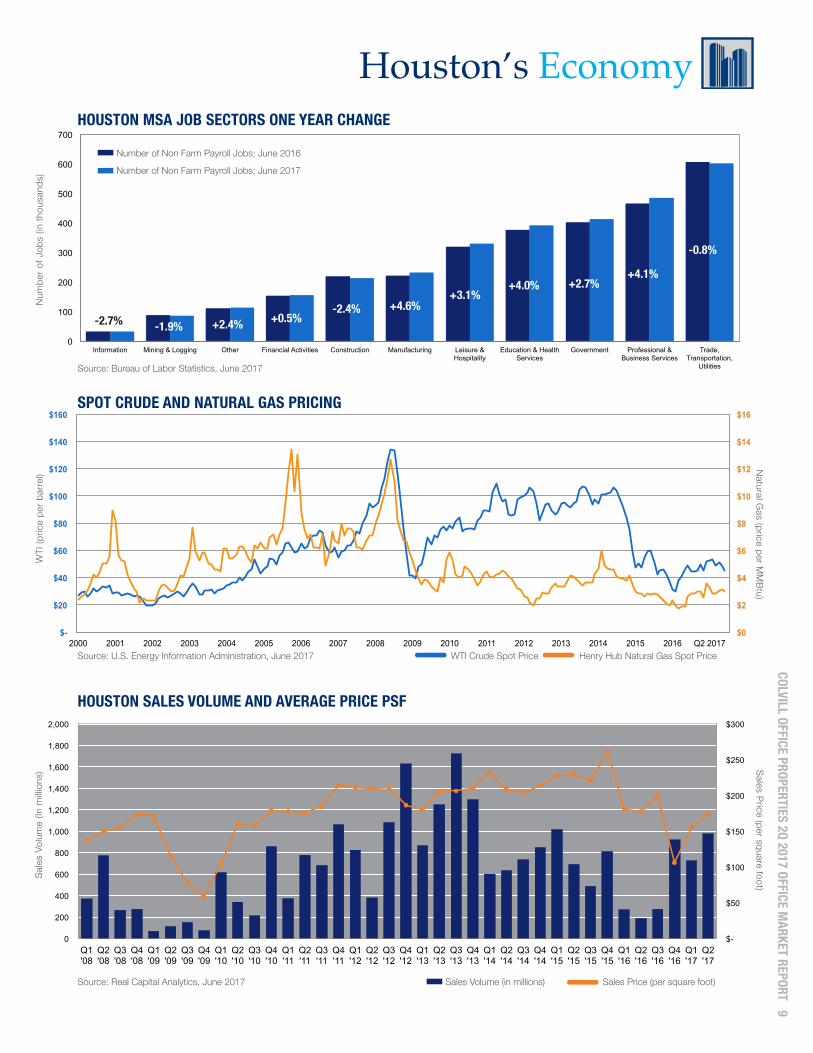
Houston’s EconomyEMPLOYMENTThe Houston metro area added 22,900 jobs during the first half of 2017, a significant increase over the 14,600 jobs added in the same time period last year and already ahead of the 18,700 jobs added during the entire year in 2016. So far this year, the following sectors contributed the largest gains: Leisure & Hospitality (+17,000 jobs), Professional & Business Services (+12,600 jobs) and Manufacturing (+10,500 jobs). Trade, Transportation & Utilities (-24,500 jobs) contributed the largest loss in jobs, and while this sector typically sheds jobs in both January and February of each year, growth during the remaining months in 2017 was less than usual. Houston’s May unemployment rate was 5.1 percent, down from 5.7 percent in January. Texas’ unemployment rate was 4.4 percent, down from 4.9 percent in January and the U.S. unemployment rate was 4.1 percent, down from 5.1 during the same period.
HOME PRICINGAccording to the latest monthly report produced by the Houston Association of Realtors (HAR), home prices and sales volume reached new heights the first half of the year, keeping 2017 on track to be a record year for Houston real estate. The greatest sales gains took place among homes priced from $750,000 and above (categorized as the luxury market), followed by homes in the $150,000 to $249,999 range. June was the eighth straight month that the luxury segment enjoyed rising sales. A total of 47,354 single-family homes sold in the first half of 2017, compared to the previous four years when 43-44,000 single-family homes sold in the first six months of each year. On a year-to-date basis, home sales remain ahead of 2016’s volume by 7.4 percent. New listings pushed inventory levels to a 4.4-month supply, the highest in almost 5 years. The single-family home median price (the figure at which half of the homes sold for more and half sold for less) climbed 2.6 percent to $239,000. The average price edged up 1.5 percent to $304,155. Both figures are all-time highs.
OIL & GASThe West Texas Intermediate (WTI) crude price closed June 2017 priced at $45.18 per barrel, down from $48.76 a year earlier in June 2016. 2017 prices peaked in February at $53.47 and have slowly dropped since. In a June story headlined “Big Banks Wave Goodbye to Hopes for Year-End Oil Price Surge,” Bloomberg reported that Bank of America, Citi and Goldman Sachs no longer expect crude to reach $60 per barrel by year’s end. They now expect crude to hover around $50.00 throughout the remainder of 2017, according to the report. Henry Hub spot prices have been relatively flat in 2017, averaging $3.04 per million British thermal units (MMBtu) during the first half of the year, which is the same as the fourth quarter 2016 average price. Prices averaged $2.98/MMBtu in June. Closer-to-normal winter temperatures are expected this winter following last year’s warm winter, which contributes to growth in residential and commercial consumption. Also, export growth is forecast to increase in the second half of 2017 and in 2018. Both factors could contribute to modest upward price pressure.
SUPPLY VERSUS DEMANDThe Houston Class A office market did not experience any new deliveries during Q2 2017. According to CoStar, the Class A Houston office market posted 822,591 square feet of negative net absorption during Q2 2017. Coupled with 228,722 square feet of negative net absorption posted during Q1 2017, the year-to-date amount totals just over 1 million square feet of negative absorption so far in 2017. According to the Colvill Office Properties defined Houston Class A market, the direct available rate rose to 20.5 percent in Q2 2017. Factor in the nearly 8 million square feet of Class A sublease space available and the effective vacancy rate now stands at a historical 28.0 percent.
COMMERCIAL INVESTMENT SALES ACTIVITYHouston market sales volume totaled $979.1 million during Q2 2017. While 2017 total sales volume numbers are healthy, average sales price per square foot remains much lower than usual, closing the quarter at $174.00. Those numbers should rise throughout the remainder of 2017 as a few Class A trophy buildings have recently hit the market and expect to trade within 2017.
ENCLAVE PLACE | 1
3 0 0 , 0 0 0 S F O F P R E M I U M C L A S S A O F F I C E S PA C E I N H O U S T O N ’ S E N E R G Y C O R R I D O R

8 C
OLVI
LL O
FFIC
E PR
OPER
TIES
2Q
2017
OFF
ICE
MAR
KET
REPO
RT
Houston’s Economy
3%
4%
5%
6%
7%
8%
9%
10%
11%
2005 2006 2007 2008 2009 2010 2011 2012 2013 2014 2015 2016 May 2017
2%
4%
6%
8%
10%
12%
14%
16%
18%
20%
-2,000,000
0
2,000,000
4,000,000
6,000,000
8,000,000
10,000,000
12,000,000
2004 2005 2006 2007 2008 2009 2010 2011 2012 2013 2014 2015 2016 Q2 2017
HISTORICAL EMPLOYMENT GROWTH
CLASS A HOUSTON SUPPLY, DEMAND AND VACANCY
HISTORICAL UNEMPLOYMENT RATE
Source: U.S. Bureau of Labor Statistics Not Seasonally Adjusted, May 2017
Source: CoStar, June 2017. Includes all Class A office buildings in the Houston market.
United States Texas Houston
5.1%
4.1%4.4%
Change in Supply Change in Demand Vacancy Rate
2,200
2,300
2,400
2,500
2,600
2,700
2,800
2,900
3,000
3,100
3,200
Jan-03 Jan-04 Jan-05 Jan-06 Jan-07 Jan-08 Jan-09 Jan-10 Jan-11 Jan-12 Jan-13 Jan-14 Jan-15 Jan-16 Q2 2017
2.0% 3.2% 4.4% 4.1%3.2%
Source: U.S. Bureau of Labor Statistics, June 2017 Number of Non Farm Payroll Jobs; in thousands
A N N U A L G R O W T H0.0% 0.6%
MIDYEAR0.8%
YTD 2017
YTD 2017
COLVILL OFFICE PROPERTIES 2Q 2017 OFFICE MARKET REPORT 9
Houston’s Economy
$-
$50
$100
$150
$200
$250
$300
0
200
400
600
800
1,000
1,200
1,400
1,600
1,800
2,000
Q1 '08
Q2 '08
Q3 '08
Q4 '08
Q1 '09
Q2 '09
Q3 '09
Q4 '09
Q1 '10
Q2 '10
Q3 '10
Q4 '10
Q1 '11
Q2 '11
Q3 '11
Q4 '11
Q1 '12
Q2 '12
Q3 '12
Q4 '12
Q1 '13
Q2 '13
Q3 '13
Q4 '13
Q1 '14
Q2 '14
Q3 '14
Q4 '14
Q1 '15
Q2 '15
Q3 '15
Q4 '15
Q1 '16
Q2 '16
Q3 '16
Q4 '16
Q1 '17
Q2 '17
$0
$2
$4
$6
$8
$10
$12
$14
$16
$-
$20
$40
$60
$80
$100
$120
$140
$160
2000 2001 2002 2003 2004 2005 2006 2007 2008 2009 2010 2011 2012 2013 2014 2015 2016 Q2 2017
0
100
200
300
400
500
600
700
Information Mining & Logging Other Financial Activities Construction Manufacturing Leisure & Hospitality
Education & Health Services
Government Professional & Business Services
Trade, Transportation,
Utilities
HOUSTON MSA JOB SECTORS ONE YEAR CHANGE
HOUSTON SALES VOLUME AND AVERAGE PRICE PSF
SPOT CRUDE AND NATURAL GAS PRICING
Source: Bureau of Labor Statistics, June 2017
Source: U.S. Energy Information Administration, June 2017
Source: Real Capital Analytics, June 2017
Sale
s Vo
lum
e (In
milli
ons)
Sales Price (per square foot)
Sales Volume (in millions) Sales Price (per square foot)
WTI
(pric
e pe
r bar
rel)
Natural G
as (price per MM
Btu)
WTI Crude Spot Price Henry Hub Natural Gas Spot Price
Number of Non Farm Payroll Jobs; June 2016
Number of Non Farm Payroll Jobs; June 2017
-0.8%
+4.1%+2.7%+4.0%
+3.1%+4.6%-2.4%
+0.5%-1.9% +2.4%-2.7%
Num
ber o
f Job
s (in
thou
sand
s)

10
COLV
ILL O
FFIC
E PR
OPER
TIES
2Q
2017
OFF
ICE
MAR
KET
REPO
RT
SUBMARKET # OF PROJECTS
CBD 1
West Loop 1
Upper Kirby / Greenway 1
Sugar Land 2
Energy Corridor 0
Katy Freeway East 1
Far West Katy 2
Westchase 1
The Woodlands 2
TOTAL 11*
* Represents total number of office projects currently under construction in Houston’s major submarkets; not indicative of the total number of projects in the entire market.
PERCENT OF TOTAL SF OF OFFICE SPACE SCHEDULED FOR DELIVERY IN EACH SUBMARKET
32.4%
28.3%
10.7%
7.8%
7.8%
6.6%
4.3% 2.1%
CBD
The Woodlands
Sugar Land
Upper Kirby Greenway
Westchase
Far West Katy
West Loop
Katy Freeway East
610
45
10
2886
225
6
99
99
45
10
610
45
90A
59
5990A
8
8
8
249
290
146
The Woodlands
Hwy 249
Greenspoint
North Loop/Northwest
Energy Corridor
Westchase
Sugar Land
GalleriaWest Loop
Greenway
Inner Loop
CBD
N
West Belt
Katy Freeway East
8
Katy/Far West
11
11
New Developments
32.4%
28.3%
10.7%
7.8%
7.8%
6.6%
4.3% 2.1%
CBD
The Woodlands
Sugar Land
Upper Kirby Greenway
Westchase
Far West Katy
West Loop
Katy Freeway East
2,000,000
1,800,000
1,600,000
1,400,000
1,200,000
1,000,000
800,000
600,000
400,000
200,000
-
1
The second quarter of 2017 ended without any new Class A office buildings delivering
to the market. Three office projects totaling 600,000 square feet broke
ground Q2 2017, bringing the total amount currently under construction in the Houston Class A office market to just over 2.4 million square feet.
Of the 2.4 million square feet currently underway, 47.1
percent is pre-leased, leaving just under 1.3 million square feet
available for pre-lease.
727,000 square of the space currently under construction is scheduled to deliver throughout the remainder of 2017.
2
2
2

COLVILL OFFICE PROPERTIES 2Q 2017 OFFICE MARKET REPORT 11
-
100,000
200,000
300,000
400,000
500,000
600,000
700,000
800,000
900,000
Q3 2017 Q4 2017 Q1 2018 Q2 2018 Q3 2018 Q4 2018 Q1 2019 Q2 2019
Pre Leased Under Construction TOTAL SF OF OFFICE SPACE SCHEDULED FOR DELIVERY
Pre-Leased Under Construction
Q3 2017 Q4 2017 Q1 2018 Q2 2018 Q3 2018 Q4 2018 Q1 2019 Q2 2019
2,000,000
1,800,000
1,600,000
1,400,000
1,200,000
1,000,000
800,000
600,000
400,000
200,000
-
Most spec projects planned were placed on the shelf until market conditions improve. Other than a few small office buildings in the outlying Houston submarkets, the build-to-suits and Skanska’s new office tower downtown are driving what little construction is occurring. Some companies are still willing to pay higher rents in brand new office buildings that offer the latest workplace trends, while other companies are taking advantage of a soft market by locking in affordable rates.
Submarket Building Developer Size (SF) % Leased Asking Rent Major TenantsNone
Q2 2017 DELIVERIES
L I O N S T O N E I N V E S T M E N T S
712 MAIN STREETIN THE HEART OF
DOWNTOWN
L I O N S T O N E I N V E S T M E N T S
PLACES FOR PRODUCTIVE PEOPLE.™

12
COLV
ILL O
FFIC
E PR
OPER
TIES
2Q
2017
OFF
ICE
MAR
KET
REPO
RT
New Developments
SUBMARKET BUILDING NAME ADDRESS DEVELOPER BUILDING SIZE
LEASED SF
LEASED %
ASKING RENT $ (NNN)
MAJOR TENANTS DELIVERY
Katy Freeway East Memorial Green 12525 Memorial Dr. MIDWAY 50,000 11,405 23% 28.50 None Aug-17
Upper Kirby/Greenway Kirby Collection 3200 Kirby Dr. Thor Equities 188,545 - 0% 31.50 None Aug-17
Westchase Lockton Place 3657 Briarpark Dr. Triten Corporation 187,011 145,742 78% 25.00 Lockton Companies Oct-17
Sugar Land Imperial Market 198 Kempner Street Imperial Market Development 110,350 - 0% 27.50 None Oct-17
Far West Katy Members Choice Credit Union 18211 Katy Freeway Members Choice
Credit Union 86,255 47,463 55% 19.00 Members Choice C/U Oct-17
West Loop The Post Oak 1601 Hollyhurst Ln. Landry's Management 104,579 - 0% 38.00 None Dec-17
Far West Katy Grandway West Bldg. 4
2322 Grand Pkwy N.
The Urban Companies 72,045 36,596 51% 17.50 None Jan-18
Sugar Land Lake Pointe One Creek Bend Dr.Planned Community Developers
147,159 - 0% 24.50 None Sep-18
The Woodlands HP Campus City Plaza Dr.
USAA Real Estate/Patrinely Group/CDC Houston
378,000 378,000 100% N/A HP Sep-18
The Woodlands Cityplace 2 1701 City Plaza Dr.
USAA Real Estate/Patrinely Group/CDC Houston
303,137 303,137 100% N/A ABS Oct-18
CBD Capitol Tower 800 Capitol St. Skanska USA 778,344 209,798 27% 34.00 Bank of America Jun-19
TOTAL UNDER CONSTRUCTION 2,405,425 1,132,141 47.1%
UNDER CONSTRUCTION FOR LEASE
Total Under Construction 2,405,425 SFTotal Leased 1,132,141 SF
Bold indicates the building broke ground during the current quarter.
Experience Class-A Office with a mix of lifestyle amenities.

COLVILL OFFICE PROPERTIES 2Q 2017 OFFICE MARKET REPORT 13
Powerful Performance. Extraordinary Results.
HOUSTON SUBMARKETS
Powerful Performance. Extraordinary Results.
Submarket Highlights 14CBD 17Inner Loop 23West Loop 25Greenway/Upper Kirby 31Sugar Land 33North Loop/Northwest 35Energy Corridor 37Katy Freeway East 41Far West Katy 43 West Belt 45Westchase 47Highway 249 51Greenspoint 53The Woodlands 55
SUBMARKETS

14
COLV
ILL O
FFIC
E PR
OPER
TIES
2Q
2017
OFF
ICE
MAR
KET
REPO
RT
Houston’s Submarkets
610
45
10
2886
225
6
99
99
45
10
610
45
90A
59
5990A
8
8
8
249
290
146
The Woodlands
Hwy 249
Greenspoint
North Loop/Northwest
Energy Corridor
Westchase
Sugar Land
GalleriaWest Loop
Greenway
Inner Loop
CBD
N
West Belt
Katy Freeway East
8
Katy/Far West
SUBMARKET HIGHLIGHTS
CBD
Overall occupancy rates in the CBD declined 210 basis points during Q2 2017, ending the quarter at 77.1 percent occupied, down from 79.2 percent occupied during Q1 2017. Following its merger with Spectra Energy, Enbridge added the entirety of its space (13 floors) at 1100 Louisiana to the sublease market. Enbridge plans to consolidate employees at the Spectra headquarters located in the West Loop submarket. Although future available space is not included in the market report statistics, 1000 Main began marketing four floors available January 2018 as they anticipate NRG will relocate. Quoted net rental rates declined slightly from $28.97 during Q1 2017 to $28.88 during Q2 2017.
WEST LOOP
Although the West Loop submarket experienced an increase in leasing activity during Q2 2017, the space removed from the market did not negate the additional space added during the quarter. The submarket ended Q2 2017 at 75.7 percent occupied, slightly lower than the 76.0 percent occupied the previous quarter. Direct available rates rose from 18.7 percent available Q1 2017 to 19.3 percent available Q2 2017. Sublease space available declined from 5.3 percent available to 5.0 percent available during the same time period. Quoted net rental rates declined slightly from $24.38 during Q1 2017 to $24.22 during Q2 2017.
ENERGY CORRIDOR
With very little office space activity occurring during Q2 2017 in the Energy Corridor, market conditions remained relatively unchanged. The submarket ended Q2 2017 at 61.5 percent occupied compared to 61.2 percent occupied the previous quarter. Direct available rates declined from 24.1 percent available Q1 2017 to 23.8 percent available Q2 2017. Sublease space available remained unchanged ending Q2 2017 14.7 percent available. The cloud over the Energy Corridor does have a silver lining. This is the first quarter since Q1 2016 that a large tenant has not added its space to the sublease market. Quoted net rental rates declined from $22.92 during Q1 2017 to $22.46 during Q2 2017.
WESTCHASE
Overall occupancy rates declined 110 basis points during Q2 2017, ending the quarter at 66.1 percent occupied, down from 67.2 percent occupied during Q1 2017. Direct available rates rose from 20.5 percent available Q1 2017 to 20.9 percent available Q2 2017. Sublease space available rose from 12.4 percent available Q1 2017 to 13.0 percent available Q2 2017. Quoted net rental rates declined from $22.98 during Q1 2017 to $22.61 during Q2 2017. Aker Solutions recently added its 2.5 floors located at Pinnacle Westchase to the sublease market.

COLVILL OFFICE PROPERTIES 2Q 2017 OFFICE MARKET REPORT 15
610
45
10
2886
225
6
99
99
45
10
610
45
90A
59
5990A
8
8
8
249
290
146
The Woodlands
Hwy 249
Greenspoint
North Loop/Northwest
Energy Corridor
Westchase
Sugar Land
GalleriaWest Loop
Greenway
Inner Loop
CBD
N
West Belt
Katy Freeway East
8
Katy/Far West
140
5
104
28 1
27
94
12 8 9
38
9
110
27
84
6
42
1 2
61
4 1 11
33
5 22
6
44
1 14 10 10 1 2 2 3 3 1 0
20
40
60
80
100
120
140
160
CBD Inner Loop
West Loop
Upper Kirby Greenway
Sugar Land
North Loop Northwest
Energy Corridor
Katy Freeway
East
Far West Katy
West Belt
Westchase Highway 249
Greenspoint The Woodlands
FULL FLOORS AVAILABLEDirectSubleaseFuture Available
Submarket#of
Bldgs.
Total Inventory
(SF)
Occupancy(%)
Direct Available
(SF)
Direct Available
(%)
Sublet Available
(SF)
Sublet Available
(%)
Average Quoted
Net Rate
CBD - Total Class A 30 29,377,493 77.1 4,573,066 15.6 2,143,420 7.3 $28.86
CBD Tier I 10 10,847,305 82.8 1,632,063 15.0 236,892 2.2 $31.78
CBD Tier II 13 13,330,701 74.7 1,645,684 12.3 1,732,956 13.0 $28.73
CBD Tier III 7 5,199,487 71.7 1,295,319 24.9 173,572 3.3 $23.10
Inner Loop 6 1,732,719 79.8 211,421 12.2 138,429 8.0 $24.93
West Loop - Total Class A 53 19,894,580 75.7 3,832,677 19.3 993,168 5.0 $24.22
West Loop Tier I 19 8,249,403 78.4 1,251,604 15.2 532,904 6.5 $28.46
West Loop Tier II 22 8,381,407 76.0 1,702,359 20.3 305,782 3.6 $21.92
West Loop Tier III 12 3,263,770 68.3 878,714 26.9 154,482 4.7 $19.39
Upper Kirby / Greenway 19 7,143,006 81.1 1,231,706 17.2 117,085 1.6 $22.45
Sugar Land 14 2,402,018 83.3 285,990 11.9 115,826 4.8 $21.05
North Loop / Northwest 10 2,108,884 60.3 829,485 39.3 8,134 0.4 $14.02
Energy Corridor - Total Class A 44 12,337,586 61.5 2,932,800 23.8 1,819,758 14.7 $22.46
Energy Corridor Tier I 22 7,983,921 54.8 2,015,995 25.3 1,589,847 19.9 $24.31
Energy Corridor Tier II 22 4,353,665 73.7 916,805 21.1 229,911 5.3 $19.07
Katy Freeway East 17 3,996,572 83.3 555,076 13.9 112,082 2.8 $24.67
Far West Katy 11 1,336,151 71.7 353,368 26.4 24,464 1.8 $19.05
West Belt 19 2,873,102 71.9 465,052 16.2 341,623 11.9 $20.34
Westchase - Total Class A 30 8,626,376 66.1 1,800,614 20.9 1,123,130 13.0 $22.61
Westchase Tier I 12 4,526,587 68.2 856,437 18.9 585,203 12.9 $25.84
Westchase Tier II 18 4,099,789 63.8 944,177 23.0 537,927 13.1 $19.04
Highway 249 12 2,760,859 74.4 530,412 19.2 175,728 6.4 $19.14
Greenspoint 20 4,740,151 29.3 2,786,179 58.8 564,914 11.9 $14.41
The Woodlands - Total Class A 31 5,513,753 75.7 1,133,627 20.6 205,042 3.7 $25.66
The Woodlands Tier I 18 3,748,394 82.4 472,893 12.6 187,267 5.0 $26.97
The Woodlands Tier II 13 1,765,359 61.6 660,734 37.4 17,775 1.0 $22.88
TOTALS 316 104,843,250 72.0 21,521,473 20.5 7,882,803 7.5 $24.14
CBD Inner Loop West Loop Upper Kirby Sugar Land North Loop Energy Katy Freeway Far West West Belt Westchase Highway 249 Greenspoint The Greenway Northwest Corridor East Katy Woodlands

16
COLV
ILL O
FFIC
E PR
OPER
TIES
2Q
2017
OFF
ICE
MAR
KET
REPO
RT
1001 FANNIN THE JONES ON MAIN 717 TEXAS 1100 LOUISIANA 811 LOUISIANA ONE SHELL PLAZA 600 TRAVIS 601 TRAVIS 609 MAIN AT TEXAS 1415 LOUISIANA
BRAD BEASLEYPAULA BRUNS
DAMON THAMES CONNOR SAXEVINCE STRAKE
MICHAEL ANDERSONWIN HAGGARD
PAULA BRUNS PAULA BRUNSDAMON THAMESCAMERON COLVILL
PAULA BRUNSCAMERON COLVILL
CLARK THOMPSONWIN HAGGARDMARGARET ELKINS
PAULA BRUNS MICHAEL ANDERSONDAMON THAMES
CONNOR SAXEVINCE STRAKE
page 32 page 33
C I T Y C E N T R E N O R T H OFFICE / MIXED-USE
2
ONCE COMPLETE, CITYCENTRE OFFICE TOWER 1 AND II WILL
NEARLY DOUBLE THE DISTRICT’S AVAILABLE CLASS-A OFFICE SPACE. The 13-story residential building offers spacious living areas and thoughtful appointments. Ground level restaurant and retail components will enhance the urban lifestyle.
3
2 RESIDENTIAL
1 OFFICE
3 RETAIL & RESTAURANT
Master PLAN
3
11
3
4 GREEN SPACE4
3
CITYCENTRE TOWERS
CHIP COLVILLMICHAEL ANDERSON CONNOR SAXE
SubmarketCBDWest Loop/GalleriaInner LoopUpper KirbyEnergy Corridor West BeltWestchaseCollege Station
Colvill Portfolio Assignments: Representing over 17 million sq. ft. in office properties in the Houston office market area.
DAMON THAMESCHIP COLVILL CONNOR SAXE
ENCLAVE PLACE
OUR CLIENTS
L I O N S T O N E I N V E S T M E N T S
CrimsonServices CityWestPlace
621,000 SF
CityWestPlace
580,000 SF
1001 Fannin
450,000 SF
Phoenix Tower
390,000 SF
1100 Louisiana
310,000 SF
Brookhollow Central
219,000 SF
1001 Fannin
254,000 SF
One Greesnpoint Place
225,000 SF
600 Travis
216,000 SF
LARGE TRANSACTION HISTORY
Colvill Office Properties is a service-minded, relationship oriented leasing company that optimizes value for owners of first-class office properties.
GALLERIA TOWER 2GALLERIA TOWER 1 GALLERIA FINANCIAL CTR BLVD PLACE 6
MICHAEL ANDERSONWIN HAGGARD BRAD BEASLEYCAMERON COLVILL
MICHAEL ANDERSONWIN HAGGARD BRAD BEASLEYCAMERON COLVILL
MICHAEL ANDERSONWIN HAGGARD BRAD BEASLEYCAMERON COLVILL
CONNOR SAXECHIP COLVILL
SAN FELIPE PLACE
CLARK THOMPSONBRAD BEASLEYMARGARET ELKINS
CITYCENTRE 1, 2, 3, 4, 5
CONNOR SAXEMICHAEL ANDERSON
ONE GROVE STREET
MICHAEL ANDERSON CONNOR SAXEVINCE STRAKE
GREENSTREET
DAMON THAMES CONNOR SAXE VINCE STRAKE
FIVE POST OAK PARK
DAMON THAMESVINCE STRAKE
2500 CITYWEST
WIN HAGGARDVINCE STRAKE
ONE OAK PARK
MICHAEL ANDERSONCONNOR SAXE
CHIP COLVILLCAMERON COLVILL
WESTWAY ONE 1430 ENCLAVE
DAMON THAMES CONNOR SAXECHIP COLVILL
WIN HAGGARDCHIP COLVILL
CONNOR SAXEMICHAEL ANDERSON
MEMORIAL GREEN TWO WESTLAKE PARK
BRAD BEASLEYCHIP COLVILL
4477 WEST SAM HOU WESTWAY II
CHIP COLVILLCAMERON COLVILL
HONEYWELL BUILDING
CHIP COLVILLCAMERON COLVILL
CENTURY SQUARE
MICHAEL ANDERSONCONNOR SAXE
609 Main at Texas
225,000 SF
BRAD BEASLEYCAMERON COLVILL
BELTWAY LAKES III

COLVILL OFFICE PROPERTIES 2Q 2017 OFFICE MARKET REPORT 17
1001 FANNIN THE JONES ON MAIN 717 TEXAS 1100 LOUISIANA 811 LOUISIANA ONE SHELL PLAZA 600 TRAVIS 601 TRAVIS 609 MAIN AT TEXAS 1415 LOUISIANA
BRAD BEASLEYPAULA BRUNS
DAMON THAMES CONNOR SAXEVINCE STRAKE
MICHAEL ANDERSONWIN HAGGARD
PAULA BRUNS PAULA BRUNSDAMON THAMESCAMERON COLVILL
PAULA BRUNSCAMERON COLVILL
CLARK THOMPSONWIN HAGGARDMARGARET ELKINS
PAULA BRUNS MICHAEL ANDERSONDAMON THAMES
CONNOR SAXEVINCE STRAKE
page 32 page 33
C I T Y C E N T R E N O R T H OFFICE / MIXED-USE
2
ONCE COMPLETE, CITYCENTRE OFFICE TOWER 1 AND II WILL
NEARLY DOUBLE THE DISTRICT’S AVAILABLE CLASS-A OFFICE SPACE. The 13-story residential building offers spacious living areas and thoughtful appointments. Ground level restaurant and retail components will enhance the urban lifestyle.
3
2 RESIDENTIAL
1 OFFICE
3 RETAIL & RESTAURANT
Master PLAN
3
11
3
4 GREEN SPACE4
3
CITYCENTRE TOWERS
CHIP COLVILLMICHAEL ANDERSON CONNOR SAXE
SubmarketCBDWest Loop/GalleriaInner LoopUpper KirbyEnergy Corridor West BeltWestchaseCollege Station
Colvill Portfolio Assignments: Representing over 17 million sq. ft. in office properties in the Houston office market area.
DAMON THAMESCHIP COLVILL CONNOR SAXE
ENCLAVE PLACE
OUR CLIENTS
L I O N S T O N E I N V E S T M E N T S
CrimsonServices CityWestPlace
621,000 SF
CityWestPlace
580,000 SF
1001 Fannin
450,000 SF
Phoenix Tower
390,000 SF
1100 Louisiana
310,000 SF
Brookhollow Central
219,000 SF
1001 Fannin
254,000 SF
One Greesnpoint Place
225,000 SF
600 Travis
216,000 SF
LARGE TRANSACTION HISTORY
Colvill Office Properties is a service-minded, relationship oriented leasing company that optimizes value for owners of first-class office properties.
GALLERIA TOWER 2GALLERIA TOWER 1 GALLERIA FINANCIAL CTR BLVD PLACE 6
MICHAEL ANDERSONWIN HAGGARD BRAD BEASLEYCAMERON COLVILL
MICHAEL ANDERSONWIN HAGGARD BRAD BEASLEYCAMERON COLVILL
MICHAEL ANDERSONWIN HAGGARD BRAD BEASLEYCAMERON COLVILL
CONNOR SAXECHIP COLVILL
SAN FELIPE PLACE
CLARK THOMPSONBRAD BEASLEYMARGARET ELKINS
CITYCENTRE 1, 2, 3, 4, 5
CONNOR SAXEMICHAEL ANDERSON
ONE GROVE STREET
MICHAEL ANDERSON CONNOR SAXEVINCE STRAKE
GREENSTREET
DAMON THAMES CONNOR SAXE VINCE STRAKE
FIVE POST OAK PARK
DAMON THAMESVINCE STRAKE
2500 CITYWEST
WIN HAGGARDVINCE STRAKE
ONE OAK PARK
MICHAEL ANDERSONCONNOR SAXE
CHIP COLVILLCAMERON COLVILL
WESTWAY ONE 1430 ENCLAVE
DAMON THAMES CONNOR SAXECHIP COLVILL
WIN HAGGARDCHIP COLVILL
CONNOR SAXEMICHAEL ANDERSON
MEMORIAL GREEN TWO WESTLAKE PARK
BRAD BEASLEYCHIP COLVILL
4477 WEST SAM HOU WESTWAY II
CHIP COLVILLCAMERON COLVILL
HONEYWELL BUILDING
CHIP COLVILLCAMERON COLVILL
CENTURY SQUARE
MICHAEL ANDERSONCONNOR SAXE
609 Main at Texas
225,000 SF
BRAD BEASLEYCAMERON COLVILL
BELTWAY LAKES III

Powerful Performance. Extraordinary Results.www.colvilloffice.com
713.877.1550
The COLVILL Office Reportis compiled and analyzed by Sherra GilbertDirector of ResearchColvill Office Properties