Embed Size (px)
Citation preview

Sun Commercial Real Estate, Inc. 6140 Brent Thurman Way, Suite 140 Las Vegas, Nevada 89148www.suncommercialre.com
Offering Memorandum12 Office Building Portfolio near E. Warm Springs Road and Pecos Road
A value-add multi-tenant
Class B office property offering a terrific infill
location in Southeast Las
Vegas.

12 Office Building Portfolio near E. Warm Springs Road and Pecos Road
The information contained herein was obtained from sources believed reliable, however, Sun Commercial Real Estate, Inc. any of its agents or employees make no guaranty, warranty or representation as to the completeness and/or accuracy thereof, inclusive of any current and future projected returns. Anyone utilizing this analysis does so at their own risk and agrees to hold Sun Commercial Real Estate, Inc., its agents and employees harmless. The presentation of this property is subject to error, omissions change of price or conditions prior to sale, or withdrawal without notice.
Cathy Jones, CPA, SIOR, CCIMCEO
NV Lic # B0056010.CORP
Alexandria MaloneAssociate
NV Lic # S.0190399
Paul MiachikaExecutive Vice President
NV Lic # S.0184612
CONTACTS
TABLE OFCONTENTS
LONGFORD PLAZA
01 OFFERING SUMMARY
02 PROPERTY OVERVIEW
03 MARKET OVERVIEW
04 FINANCIAL INFORMATION
05 LAS VEGAS VALLEY OVERVIEW

01 OFFERINGSUMMARY

12 Office Building Portfolio near E. Warm Springs Road and Pecos Road5
Silverado Ranch
Enterprise
Green ValleySouth
WhitneyRanch
MacDonaldRanch
SpringValley
SunriseManor
Downtown
BoulderCity
Seven Hills
Anthem
SouthernHighlands
RhodesRanch
MountainsEdge
Summerlin
CentennialHills
NorthLas Vegas
Winchester
Paradise
Henderson
Silverado Ranch
Enterprise
Green ValleySouth
WhitneyRanch
MacDonaldRanch
SpringValley
SunriseManor
Downtown
BoulderCity
Seven Hills
Anthem
SouthernHighlands
RhodesRanch
MountainsEdge
Summerlin
CentennialHills
NorthLas Vegas
Winchester
Paradise
Henderson
93
95
95
93
OFFERING SUMMARY
±99,299SQUARE FEET
±81%OCCUPANCY
2002-2007CONSTRUCTION
$111PRICE PER SF
OFFERING HIGHLIGHTS
Purchase Price: $11,000,000
Total Building SF: ±99,299 SF
First Year NOI: $717,160
Stabilized NOI: $1,048,494
Cap Rate (Year One): 6.52%
Stabilized Cap Rate: 9.5%
Office Park: Includes Twelve Class B Garden Style Buildings
Year Built: 2002-2007
Site Area: ±7.58 Acres
LONGFORD PLAZA3037-3097, 3127, 3203, 3227, 3283 and 3291 E. Warm Springs Road,
Las Vegas, Nevada 89120
CHARLESTON BOULEVARD
CHEYENNE AVENUE
CRAIG ROAD
ANN ROAD
TROPICANA AVENUE
SAHARA AVENUE
BLUE DIAMOND ROAD
SUNSET ROAD
WARM SPRINGS ROAD
CACTUS AVENUE
LAKE MEAD BOULEVARD
FLAMINGO ROAD
DU
RA
NG
O D
RIV
E
RA
INBO
W B
OU
LEV
AR
D
DEC
ATU
R B
OU
LEV
AR
D
EAST
ERN
AV
ENU
E
LAM
B BO
ULE
VA
RD
LAS
VEG
AS
BOU
LEV
AR
D

12 Office Building Portfolio near E. Warm Springs Road and Pecos Road6
INVESTMENT HIGHLIGHTS
Value-Add Office Opportunity – Excellent opportunity to purchase a suburban office property priced well below replacement cost.
Condo Sales – A buyer has the option to consider selling individual condos over time. Current sales in this park have sold as high as $217 PSF, nearly double current asking price.
Below Market Rents – The average current rent of $1.25 per square foot modified gross is up to 44% below lease comparables in the immediate area.
Attractive Returns – Value-add annual returns projected at 21.70% on a leveraged basis over a five-year hold.
Strong Office Fundamentals – Office demand combined with reducing vacancy continues to increase absorption and place upward pressure on rents.
$11,000,000 | 6.52% CAP RATE
LOCATION AND AMENITIES
Strategically located at the entry into Green Valley, an upscale and affluent neighborhood of Henderson consisting of numerous master-planned communities
Longford Plaza is less than 10 minutes from McCarran International Airport (50 million passengers in 2019)
Centrally located between the new Allegiant Raiders Stadium, the Raiders practice facility, T-Mobile Arena, and the new Henderson Vegas Golden Knights practice facility
Located minutes from the I-215 outerbelt that wraps the Las Vegas Valley
Beautiful courtyards offer a warm ambiance and space for outdoor uses
OFFERING SUMMARY

PROPERTYOVERVIEW02

12 Office Building Portfolio near E. Warm Springs Road and Pecos Road8
PROPERTY OVERVIEW
ADDRESS 3037-3097, 3127, 3203, 3227, 3283 and 3291 E. Warm Springs Road, Las Vegas, Nevada 89120
ACCESS Three points along Warm Springs Road
SITE SIZE ±7.58 Acres
PARCELS 177-12-513-004, 009, 010, 011, 013, 014, 015, 017, 177-12-516-002, 177-12-517-002, 177-12-518-005 and 006
ZONING C-P (Office-Professional), Clark County
PARKING RATIO ±4:1,000
LAND SITE SUMMARY

12 Office Building Portfolio near E. Warm Springs Road and Pecos Road9
SITE PLAN
PROPERTY DESCRIPTION 12, single-story garden style office buildings with tile roofs and faux chimney features including wrought iron gate courtyard entrances with interlocking paver flooring.
PROPERTY SIZE ±99,299 Square Feet
YEAR BUILT 2002-2007
EXTERIOR WALLS Prefab foam core with hardwood and stucco exterior finish
WINDOWS Aluminum frame with insulated glass
ROOF 10 Ply Built-Up Roofing System
HVAC Individual roof-top, Carrier package split system heat pump units
RESTROOMS Courtyard accessible common area, mens’ and womens’ restrooms in each building
CEILINGS Interior ceilings include mostly tegular acoustical ceiling system with aluminum tee runners with some units having an open/exposed ceiling look
INTERIOR WALLS Standard walls to be textured and painted sheetrock
ELECTRICAL 120/208 volt
FIRE & SAFETY Wet fire suppression system
BUILDING SPECS
PROPERTY OVERVIEW
3047
303730
67
3087
3127
3203 3291 3283
3077
30573097
E WARM SPRINGS ROAD
3227

12 Office Building Portfolio near E. Warm Springs Road and Pecos Road10
PROPERTY PHOTOSPROPERTY OVERVIEW

12 Office Building Portfolio near E. Warm Springs Road and Pecos Road11
PROPERTY PHOTOSPROPERTY OVERVIEW

MARKETOVERVIEW03

12 Office Building Portfolio near E. Warm Springs Road and Pecos Road13
SUBMARKET OVERVIEW
The South Las Vegas submarket is the largest office submarket in the metro valley with over 13 million square feet1. Proximity to numerous amenities, including new retail and residential developments, has created positive demand and helped the vacancies remain below the submarket’s historical average, currently at ±10.5%.
New construction has been limited with only two projects currently under construction. Gardner Plaza and Village in Henderson will deliver approximately 24,000 SF and 100,000 SF of office space, respectively. Existing building owners will have a competitive edge as new buildings will have a higher rental rate compared to existing buildings given the cost of new construction today.
Compared to the previous year, sales volume in the South submarket has been modest with over $318 million in sales volume in 2019. Recent notable transactions were Cornerstone Office Park, which traded at $27.2 million, Siena Medical Pavilion, which closed at $51.6 million, and the Las Vegas Raiders HQ Facility at $191 million.
1CoStar Las Vegas – NV Office Market Report as of March 2020.
MARKET OVERVIEW

12 Office Building Portfolio near E. Warm Springs Road and Pecos Road14
AREA OVERVIEWLongford Plaza is located near the southwest intersection of Warm Springs Road and Pecos Road. While Longford Plaza is in the City of Las Vegas, the location of the property is at the northwestern boundary of the City of Henderson and the master planned communities of Green Valley, Anthem, MacDonald Ranch, and Seven Hills, to name a few. Proximity to the City of Henderson has numerous benefits, including access to its population of 302,000, making Henderson the second largest city in the state. Nearby lifestyle amenities such as The District at Green Valley Ranch, Galleria Mall, Green Valley Ranch Resort and Casino, Lake Las Vegas, and world-class parks and trails systems provide the quality of life that new residents and businesses are looking for.
The area is ideally situated in the southern portion of the Las Vegas valley, just minutes from the Las Vegas Strip and a short distance from McCarran International Airport. Major highways serving the area include I-15, US 95 and I-215, the latter of which has an entrance less than two miles west of Longford Plaza, providing easy travel across town and to bordering states.
MARKET OVERVIEW
W WARM SPRINGS ROAD

12 Office Building Portfolio near E. Warm Springs Road and Pecos Road15
AREA DEMOGRAPHICS
5 Mile
3 Mile
1 Mile
Longford Plaza
POPULATION
1 Mile 3 Miles 5 Miles
2019 Population 13,186 135,423 399,326
2024 Population 13,808 143,016 430,434
HOUSEHOLD
1 Mile 3 Miles 5 Miles
2010 Households 4,926 50,567 143,177
2019 Households 5,150 53,541 158,640
2024 Households 5,374 56,323 170,356
2019 Average HH Size 2.52 2.52 2.50
INCOME 2019
1 Mile 3 Miles 5 Miles
<$15,000 7.1% 7.1% 9.8%
$15,000 - $24,999 5.0% 6.8% 8.1%
$25,000 - $34,999 9.0% 8.6% 9.7%
$35,000 - $49,999 11.1% 12.5% 13.5%
$50,000 - $74,999 21.7% 20.8% 20.5%
$75,000 - $99,999 16.4% 14.7% 13.5%
$100,000 - $149,999 15.5% 15.7% 14.4%
$150,000 - $199,999 7.4% 7.6% 5.6%
$200,000+ 6.7% 6.0% 4.8%
2019 Median HH Income $68,753 $65,708 $58,379
2019 Average Household Income $90,795 $57,570 $78,824
RRAACCEE AANNDD EETTHHNNIICCIITTYY 2200119911 MMiillee 22 MMiilleess 33 MMiilleess
White 31.5% 35.8% 37.3%
Black 25.7% 25.0% 21.7%
American Indian 0.9% 1.0% 0.9%
Asian - Number 4.3% 4.4% 4.9%
Pacific Islander 0.7% 0.9% 0.8%
Some Other Race 31.5% 27.0% 28.2%
Two or More Races 5.3% 6.1% 6.2%
Hispanic Origin (Any Race) 54.7% 47.8% 51.4%
*Source: U.S. Census Bureau, Census 2010 Summary File 1. Esri forecasts for 2019 and 2024.
MARKET OVERVIEW

12 Office Building Portfolio near E. Warm Springs Road and Pecos Road16
LEASE COMPARABLES MAP
SUBJECT PROPERTY
1
2
3
4
5
6
7
MARKET OVERVIEW
S LA
S V
EGA
S BO
ULE
VA
RD
S EA
STER
N A
VEN
UE
N PEC
OS RO
AD
N STEPH
AN
IE STREET
E CACTUS AVENUE
ST ROSE
PARKW
AY
W H
ORIZO
N RID
GE PARK
WAY
S GREEN
VA
LLEY PA
RKW
AY
E SILVERADO RANCH BOULEVARD
E WINDMILL LANE
S M
ARY
LAN
D P
ARK
WA
Y
E WARM SPRINGS ROAD
E SUNSET ROAD

12 Office Building Portfolio near E. Warm Springs Road and Pecos Road17
LEASE COMPARABLESLongford Plaza - For Lease Comps
# Property Name Property Address Property Location Property Type
Year Built / Reno.
Condition / TI Allowance
Lease Type
BuildingSF
Comp Suite
Asking Rate
CAM/OE(1)
MG Lease Rate Equivalent
Subj
ect
1 Longford Plaza
3037-3097, 3127, 3203, 3227, 3283 and 3291
E. Warm Springs Rd.,Las Vegas, NV 89120
On E. Warm Springs Rd., E. of Eastern Ave.
Multi-Tenant Office 2003
Second Generation / Negotiable
MG 99,299 - $1.35 $1.35
1 1 Seven Hills Business Park
3039 W. Horizon Ridge Pkwy.,Henderson, NV 89052
On W. Horizon Ridge Pkwy., E. of Seven Hills Dr.
Multi-Tenant Office 2005
Second Generation / Negotiable
Net 6,754 1,750 $1.40 $0.35 $1.75
2 1 Silverado Professional Park
700 E. Silverado Ranch Blvd.,Las Vegas, NV 89183
NWC Silverado Ranch Blvd. & Pollock St.
Multi-Tenant Office 2003
Second Generation / Negotiable
Net 24,251 1,800 $1.80 $0.45 $2.25
3 1 Eastern Professional Park
8425 S. Eastern Ave.,Las Vegas, NV 89123
On S. Eastern Ave., N. of Wigwam Pkwy.
Multi-Tenant Office 2006
Second Generation / Negotiable
MG 3,400 3,400 $1.95 $1.95
4 1 Horizon Ridge Professional Park
2420 W. Horizon Ridge Pkwy.,Henderson, NV 89052
On Horizon Ridge Pkwy., W. of Green Valley Pkwy.
Multi-Tenant Office 2010
Second Generation / Negotiable
NNN 4,500 2,500 $1.50 $0.40 $1.90
5 1 Pecos Springs Business Park
7335 S. Pecos Rd.,Las Vegas, NV 89120
SWC S. Pecos Rd. & W. E. Warm Springs Rd.
Multi-Tenant Office 2008
Second Generation / Negotiable
NNN 8,065 4,000 $1.35 $0.40 $1.75
6 1 Sunset Ridge Professional Park
2900 N. Green Valley Pkwy.,Henderson, NV 89120
On Green Valley Pkwy., N. of E. Sunset Rd.
Multi-Tenant Office 1994
Second Generation / Negotiable
NNN 5,754 4,049 $1.25 $0.40 $1.65
7 1 Windmill Place 370-380 E. Windmill Ln.,Las Vegas, NV 89123
On E. Windmill Ln., W. of Bermuda Rd.
Multi-Tenant Office 2008
Second Generation / Negotiable
NNN 21,651 4,855 $1.70 $0.40 $2.10
Average 2005 - - 10,625 3,193 $1.91Median 2006 - - 6,754 3,400 $1.90
Notes:(1) Asking rate adjusted up by $0.40 PSF, for estimated CAM, to determine a MG lease rate equivalent to compare with the subject Property.
Page 1
MARKET OVERVIEW

12 Office Building Portfolio near E. Warm Springs Road and Pecos Road18
LONGFORD PLAZA CONDO SALE COMPARABLESMARKET OVERVIEW
Longford Plaza - Office Buildings and Condos Sold
Property Address/Unit Number Description Year Built / Reno.
BuildingSF Sales Price $/SF Sales Date
Subj
ect
3037-3097, 3127, 3203, 3227, 3283 and 3291 E. Warm Springs Rd., Las Vegas, NV 89120 Portfolio 2004 99,299 $11,000,000 $110.78 -
1 3161-300 Condo 2003 1,824 $301,000 $165.02 4/1/19
2 3167-200 Condo 2003 2,203 $330,500 $150.02 4/5/19
3 3167-300 Condo 2003 1,814 $272,000 $149.94 4/5/19
4 3153-200 Condo 2003 1,910 $279,761 $146.47 4/17/19
5 3161-100 Condo 2003 2,025 $321,000 $158.52 7/1/19
6 3183 Building 2003 8,505 $1,233,225 $145.00 9/3/19
7 3199-300 Condo 2003 1,824 $300,090 $164.52 8/28/19
8 3199-100, -200 Condo x 2 2003 4,214 $695,310 $165.00 10/4/19
9 3199-400 (1) Condo 2003 2,294 $298,220 $130.00 11/6/19
10 3223 Condo 2004 1,667 $295,000 $176.96 11/27/19
11 3161-400 Condo 2003 2,322 $383,130 $165.00 1/8/20
12 3161-200 Condo 2003 2,205 $363,825 $165.00 2/3/20
13 3153 - 300 Condo 2003 1,406 $306,000 $217.64 4/1/20
Average 2003 2,632 $413,774 $161.47 -
Median 2003 2,025 $306,000 $164.52 -
Notes
(1) Low price due to suite build-out as a former sandwich shop with no office buildout.* All properties have Office and Professional (C-P) zoning.

FINANCIALINFORMATION04

12 Office Building Portfolio near E. Warm Springs Road and Pecos Road20
RENT ROLL AS OF NOVEMBER 1, 2020RENT ROLL - LONGFORD PLAZAAs of November 1, 2020
Occupied Suites:
Suite Tenant Size Tenant Since Rent/SF/Mo. Rent/Mo. Rent/SF/Yr Rent/Yr Increases Renewal Options Comments:
3037-100 CRS Services Limited 2,579 06/13/11 $1.60 $4,136.34 $19.25 $49,636.08 None
3037-200 Imagine Communications 2,662 05/17/18 05/17/18 05/30/23 $1.15 $3,061.30 $13.80 $36,735.60 Two 5-Year Options
3037-300 Med James, Inc. 3,057 12/1*17 11/01/20 10/31/23 $1.35 $4,126.95 $16.20 $49,523.40 None Relocated from 3057 #400 and 3097 #200Insurance company
3037-400 New tenant 2,576 11/01/20 Month to Month lease as of November 1st
3047-100 Diana L McIntosh Agency, Inc. 675 04/01/16 05/01/19 04/30/22 $1.25 $843.75 $15.00 $10,125.00 05/01/21 $15.60 None
3047-200 Bradley Roberts, DDS 3,191 11/01/02 11/01/19 10/31/22 $1.60 $5,258.77 $19.78 $63,105.24 11/01/21 $20.37 One 3-Year Option
3047-500 LTRD Corporation 3,062 01/01/15 01/01/20 12/31/22 $1.20 $3,674.40 $14.40 $44,092.80 None
3057-100 Key Insurance Company 3,655 11/01/17 11/01/20 10/31/23 $1.35 $4,934.25 $16.20 $59,211.00None
3057-300 Han-Tae Cho DDS 2,526 06/02/02 04/02/20 03/31/25 $1.65 $4,167.90 $19.80 $50,014.80 04/01/21 $20.40 None
3067-100 Odyssey Wellness Inc. 3,502 05/01/18 05/01/18 05/31/21 $1.15 $4,027.30 $13.80 $48,327.60 One 3-Year Option
3077-100 Real Properties Management Group 6,928 06/01/18 06/01/18 07/31/23 $1.15 $7,967.20 $13.80 $95,606.40 None
3087-100 Endure Recovery Services LLC 2,344 10/01/18 10/01/18 09/30/21 $1.15 $2,695.60 $13.80 $32,347.20 One 3-Year Option
3087-300 Janek Performance Group, Inc. 5,014 09/01/18 05/01/20 08/31/23 $1.29 $6,455.53 $15.45 $77,466.36 One 5-Year Option
3097-100 Bee-Well Collective LLC 1,721 08/01/19 08/01/19 07/31/22 $1.30 $2,237.30 $15.60 $26,847.60 08/01/21 $16.20 One 3-Year Option
3097-300 Morro Bay Consulting LLC 1,644 07/01/18 07/01/18 06/30/21 $1.15 $1,890.60 $13.80 $22,687.20 One 3-Year Option
3097-400 Serenity Wellness Center of Las Vegas 1,764 05/01/19 05/01/19 04/30/22 $1.20 $2,116.80 $14.40 $25,401.60 05/01/21 $15.00 One 3-Year Option36 Months
Rent amended April 28, 2020, due to impact of the Corona Virus. They provide sales training, coaching, and consulting.
08/01/21 $13.8009/01/21 $14.8809/01/22 $15.84
62 Months
37 Months
39 Months
36 Months
Current Term
60 Months05/17/21 $14.4005/17/22 $15.60
36 Months
36 Months11/01/21 $16.6911/01/22 $17.19
Month to Month
36 Months
Holdover rate; previous 3 year term expired 5/30/20.
01/01/21 $14.8301/01/22 $15.2836 Months
Signed three year extension on June 12, 2020
Larry Tindall Residential Designer – Residential design and development firm
11/01/21 $16.6911/01/22 $17.19
36 Months
36 Months
36 Months
Assumed lease of previous dental practice and extended term to 5 years.
Residential and commercial real estate management group, mostly associations.
60 Months
FINANCIAL INFORMATION

12 Office Building Portfolio near E. Warm Springs Road and Pecos Road21
RENT ROLL (CON’T)FINANCIAL INFORMATION
Occupied Suites:
Suite Tenant Size Tenant Since Rent/SF/Mo. Rent/Mo. Rent/SF/Yr Rent/Yr Increases Renewal Options Comments:Current Term
3127-100 3,822 12/01/17 12/01/17 11/30/20 $1.08 $6,815.60 $12.93 $81,787.20 None3127-400 2,502
3127-200 Green Valley Insurance Services, Inc. 1,419 10/01/12 $1.72 $2,435.01 $20.59 $29,220.12 11/01/20 $13.56 None
3127-300 Perceptions Counseling Center 3,131 11/01/18 11/01/18 10/31/21 $1.15 $3,600.65 $13.80 $43,207.80 None
3203-100 Guest Concepts, Inc. 1,551 04/01/09 05/01/20 04/30/23 $1.35 $2,093.85 $16.20 $25,126.20 None
3203-400 Rietz Consulting, Inc. 2,618 02/01/19 02/01/19 02/28/22 $1.20 $3,141.60 $14.40 $37,699.20 03/01/21 $15.00 None
3227-100 Writing Adventures LLC 1,590 03/01/15 05/01/18 04/30/21 $1.18 $1,883.36 $14.21 $22,600.32 None
3283-100 Automobile Shipping Quotes, Inc. 1,965 08/01/18 08/01/18 07/31/21 $1.15 $2,259.75 $13.80 $27,117.00 One 3-Year Option
3283-300 Actus Holdings 6,439 11/01/18 11/01/18 10/31/21 $1.15 $7,404.85 $13.80 $88,858.20 None
3291-100 Arcadia Security & Patrol, Inc. 2,041 10/01/18 10/01/18 10/31/23 $1.20 $2,449.20 $14.40 $29,390.40 One 3-Year Option
3291-200 Lato & Petrova CPAs, Ltd. 2,156 11/01/09 06/01/18 05/31/21 $1.25 $2,691.72 $14.98 $32,300.64 None
3291-300 MDC Restaurants, LLC 1,855 04/01/19 04/01/19 03/31/22 $1.20 $4,900.80 $14.40 $58,809.60 04/01/21 $15.00 None3291-400 2,229 02/15/16
Occupied Total: 80,218 Sq. Ft. $1.25 $97,270.38 $1,167,244.56Percent Occupied: 80.78%
Financials services/wealth management company
Rent abated July through Sept. 2020 due to the impact of the Corona Virus with 3 yr. extension
Full-service civil engineering, land surveying, land planning, and consulting company.
Restaurant operator, owns numerous concepts in Las Vegas.
37 Months
36 Months
05/01/21 $16.6905/01/22 $17.19
36 Months
36 Months
Universal Retirement, LLC
Holdover rate; previous 1 yr. term expired 11/30/19.
61 Months10/01/21 $14.8810/01/22 $15.3610/01/23 $15.84
36 Months
36 Months
36 Months
36 Months
36 Months
Rent abated July 2020 and July 2021.
Month to Month

12 Office Building Portfolio near E. Warm Springs Road and Pecos Road22
RENT ROLL (CON’T)FINANCIAL INFORMATIONOccupied Suites:
Suite Tenant Size Tenant Since Rent/SF/Mo. Rent/Mo. Rent/SF/Yr Rent/Yr Increases Renewal Options Comments:Current Term
Vacant Suites:
Suite Tenant Size
3057-400 Available Space 2,324
3067-300 Available Space 3,426
3087-200 Available Space 3,516
3097-200 Available Space 1,740 Available as of November 1st
3203-200 Available Space 1,895
3203-300 Available Space 835
3227-200 Available Space 1,822 Under negotiation
3227-400 Available Space 3,523 Under negotiation. Former medical buildout for a chiropractic practice
Vacant Total: 19,081 Sq. Ft.Percent Vacant: 19.22%
Total Property Size: 99,299
Comments

12 Office Building Portfolio near E. Warm Springs Road and Pecos Road23
ARGUS - CASH FLOWFINANCIAL INFORMATION
Forecast Forecast Forecast Forecast Forecast Forecast Forecast
Year 1 Year 2 Year 3 Year 4 Year 5 Year 6For the Years Ending Aug-2021 Aug-2022 Aug-2023 Aug-2024 Aug-2025 Aug-2026 Total
Rental Revenue Potential Base Rent 1,570,375 1,651,885 1,717,690 1,781,595 1,833,578 1,886,475 10,441,598 Absorption & Turnover Vacancy -365,350 -167,312 -113,666 -42,381 -45,059 -61,210 -794,979 Free Rent -38,523 -37,049 -30,690 -12,843 -12,656 -14,660 -146,422 Scheduled Base Rent 1,166,502 1,447,524 1,573,333 1,726,371 1,775,863 1,810,604 9,500,197Total Rental Revenue 1,166,502 1,447,524 1,573,333 1,726,371 1,775,863 1,810,604 9,500,197
Other Tenant Revenue Total Expense Recoveries 0 14,642 23,409 29,912 33,720 37,871 139,556Total Other Tenant Revenue 0 14,642 23,409 29,912 33,720 37,871 139,556
Total Tenant Revenue 1,166,502 1,462,166 1,596,743 1,756,283 1,809,583 1,848,475 9,639,753
Other Revenue Parking Revenue 13,860 14,207 14,553 14,917 15,281 15,663 88,480 Credits for contracted abatement 3,601 0 0 0 0 0 3,601Total Other Revenue 17,461 14,207 14,553 14,917 15,281 15,663 92,081
Potential Gross Revenue 1,183,963 1,476,373 1,611,296 1,771,200 1,824,864 1,864,137 9,731,833
Vacancy & Credit Loss Vacancy Allowance 0 0 -58,830 -138,978 -141,933 -131,324 -471,065Total Vacancy & Credit Loss 0 0 -58,830 -138,978 -141,933 -131,324 -471,065
Effective Gross Revenue 1,183,963 1,476,373 1,552,466 1,632,223 1,682,931 1,732,813 9,260,768
Operating Expenses Utilities 18,000 18,540 19,096 19,669 20,259 20,867 116,431 Reparis & Maintenance 41,700 42,951 44,240 45,567 46,934 48,342 269,733 Association Dues 192,256 198,024 203,964 210,083 216,386 222,877 1,243,591 Property Taxes 81,352 83,793 86,306 88,896 91,562 94,309 526,218 Insurance 16,360 16,851 17,356 17,877 18,413 18,966 105,823 Management Fee 35,519 44,291 46,574 48,967 50,488 51,984 277,823 Contracted Services 67,756 69,789 71,882 74,039 76,260 78,548 438,274 Parking Fees to Assoc. 13,860 14,207 14,553 14,917 15,281 15,663 88,480Total Operating Expenses 466,803 488,444 503,972 520,014 535,583 551,556 3,066,372
Net Operating Income 717,160 987,928 1,048,494 1,112,209 1,147,348 1,181,257 6,194,396
Cash FlowLongford Plaza (Buy and Hold Proforma January 2021)Jan, 2021 through Dec, 2026

12 Office Building Portfolio near E. Warm Springs Road and Pecos Road24
ARGUS - CASH FLOW (CON’T)FINANCIAL INFORMATION
Forecast Forecast Forecast Forecast Forecast Forecast Forecast
Year 1 Year 2 Year 3 Year 4 Year 5 Year 6For the Years Ending Aug-2021 Aug-2022 Aug-2023 Aug-2024 Aug-2025 Aug-2026 Total
Leasing Costs Tenant Improvements 147,825 192,080 166,680 87,828 94,410 101,414 790,236 Leasing Commissions 68,155 95,424 88,505 38,273 40,503 51,655 382,515 Total Leasing Costs 215,981 287,503 255,184 126,101 134,913 153,069 1,172,751
Capital Expenditures Capital Reserves 14,895 14,895 14,895 14,895 14,895 14,895 89,369 Total Capital Expenditures 14,895 14,895 14,895 14,895 14,895 14,895 89,369
Total Leasing & Capital Costs 230,876 302,398 270,079 140,995 149,808 167,964 1,262,120
Cash Flow Before Debt Service 486,285 685,530 778,414 971,213 997,540 1,013,293 4,932,276
Debt Service Interest New Loan 283,411 276,519 269,298 261,782 253,960 0 1,344,970 Total Interest 283,411 276,519 269,298 261,782 253,960 0 1,344,970
Principal New Loan 156,375 177,247 184,469 191,985 199,806 0 909,882 Total Principal 156,375 177,247 184,469 191,985 199,806 0 909,882
Total Debt Service 439,786 453,766 453,767 453,767 453,766 0 2,254,852
Cash Flow After Debt Service 46,499 231,764 324,647 517,446 543,774 1,013,293 2,677,424
Financing Proceeds New Loan 7,150,000 0 0 0 0 0 7,150,000 Total Proceeds 7,150,000 0 0 0 0 0 7,150,000
Loan Costs New Loan -71,500 0 0 0 0 0 -71,500 Total Loan Costs -71,500 0 0 0 0 0 -71,500
Total Financing (Net) 7,078,500 0 0 0 -6,240,118 0 838,382
Cash Flow Available for Distribution 7,124,999 231,764 324,647 517,446 -5,696,344 1,013,293 3,515,806

12 Office Building Portfolio near E. Warm Springs Road and Pecos Road25
ARGUS- SOURCES & USESFINANCIAL INFORMATION
Forecast Forecast Forecast Forecast Forecast Forecast
Year 1 Year 2 Year 3 Year 4 Year 5For the Years Ending Aug-2021 Aug-2022 Aug-2023 Aug-2024 Aug-2025 Total
Sources Of Capital Net Operating Gains 717,160 987,928 1,048,494 1,112,209 1,147,348 5,013,139 Debt Funding Proceeds 7,150,000 0 0 0 0 7,150,000 Initial Equity Contribution 3,921,500 0 0 0 0 3,921,500 Net Proceeds From Sale 0 0 0 0 14,322,745 14,322,745Defined Sources Of Capital 11,788,660 987,928 1,048,494 1,112,209 15,470,093 30,407,384Required Equity Contributions 0 0 0 0 0 0Total Sources Of Capital
Uses Of Capital Property Purchase Price 11,000,000 0 0 0 0 11,000,000 Total Property Purchase Price 11,000,000 0 0 0 0 11,000,000 Total Debt Service 439,786 453,766 453,767 453,767 453,766 2,254,852 Total Loan Costs 71,500 0 0 0 0 71,500 Tenant Improvements 147,825 192,080 166,680 87,828 94,410 688,822 Leasing Commissions 68,155 95,424 88,505 38,273 40,503 330,860 Capital Expenditures 14,895 14,895 14,895 14,895 14,895 74,474 Debt Retirement 0 0 0 0 6,240,118 6,240,118Defined Uses Of Capital 11,742,162 756,164 723,846 594,762 6,843,692 20,660,626Cash Flow Distributions 46,499 231,764 324,647 517,446 8,626,401 9,746,758Total Uses Of Capital
Unleveraged Cash on Cash Return Cash to Purchase Price 4.42% 6.23% 7.08% 8.83% 9.07% 35.63% NOI to Book Value 6.39% 8.57% 8.88% 9.31% 9.49% 41.45%Leveraged Cash on Cash Return Cash to Initial Equity 1.19% 5.91% 8.28% 13.20% 13.87% 42.44%Leveraged Yield NOI less leasing costs and Interest to Initial Equity 5.55% 10.81% 13.36% 18.47% 19.34% 67.54%
Unleveraged Monthly IRR 11.98%Leveraged Monthly IRR 21.70%
Sources and UsesLongford Plaza (Buy and Hold Proforma January 2021)Jan, 2021 through Dec, 2025
11,788,660 987,928 1,048,494 1,112,209 15,470,093 30,407,384
1,048,494 1,112,209 15,470,093 30,407,384
* Results displayed are based on Forecast data only
11,788,660 987,928

12 Office Building Portfolio near E. Warm Springs Road and Pecos Road26
ARGUS- MARKET LEASING SUMMARY
3,000 SF and smaller 3,000 SF and Larger Dental 3,000 SF and smaller w TI's/LCs by Seller 3,000 SF and Larger w lower TI's
Term Length (Years/Months) 3/2 5/2 5/2 3/2 5/2Renewal Probability 75.00% 75.00% 75.00% 75.00% 75.00%
Months Vacant 9 9 9 9 9Months Vacant (Blended) 2.25 2.25 2.25 2.25 2.25
Market Base Rent (UOM) $ / SF / Month $ / SF / Month $ / SF / Month $ / SF / Month $ / SF / MonthMarket Base Rent (New) $1.40 $1.35 $1.60 $1.40 $1.35Market Base Rent (Renewal) $1.40 $1.35 $1.60 $1.40 $1.35Market Base Rent (Blended) $1.40 $1.35 $1.60 $1.40 $1.35
Rent Increases (annually) 3% 3% 3% 3% 3%
New Free Rent (Months) 2 2 2 2 2Renewal Free Rent (Months) 0 0 0 0 0Blended Free Rent (Months) 0.5 0.5 0.5 0.5 0.5
Recovery Type Base Year Stop Base Year Stop Base Year Base Year Stop Base Year Stop
Tenant Improvements (UOM) $ / Area $ / Area $ / Area None $ / AreaTenant Improvements (New) $10.00 $10.00 $10.00 $0.00 $5.00Tenant Improvements (Renew) $3.00 $3.00 $3.00 N/A N/ATenant Improvements (Blended) $4.75 $4.75 $4.75 N/A N/A
Leasing Commissions (New) 6% 6% 6% 0% 6%Leasing Commissions (Renew) 2.50% 2.50% 2.50% 0% 2.50%
Upon Expiration 3,000 SF and smaller 3,000 SF and Larger Dental 3,000 SF and smaller 3,000 SF and Larger
Market Leasing SummaryLongford PlazaAs of January 1, 2021
FINANCIAL INFORMATION

12 Office Building Portfolio near E. Warm Springs Road and Pecos Road27
ARGUS - CASH FLOW - INDIVIDUAL BUILDING SALEFINANCIAL INFORMATION
Forecast Forecast Forecast Forecast Forecast
Year 1 Year 2 Year 3 Year 4For the Years Ending Aug-2021 Aug-2022 Aug-2023 Aug-2024 Total
Rental Revenue Potential Base Rent 1,117,782 934,648 575,392 184,649 2,812,471 Absorption & Turnover Vacancy 0 0 0 0 -8,254 Free Rent -3,601 0 0 0 -3,601 Scheduled Base Rent 1,108,106 784,559 454,467 138,722 2,485,854Total Rental Revenue 1,108,106 784,559 454,467 138,722 2,485,854
Total Tenant Revenue 1,108,106 784,559 454,467 138,722 2,485,854
Other Revenue Credits for contracted abatement 3,601 0 0 0 3,601Total Other Revenue 3,601 0 0 0 3,601
Potential Gross Revenue 1,111,707 784,559 454,467 138,722 2,489,455
Vacancy & Credit Loss Vacancy Allowance -55,585 -39,228 -22,723 -6,936 -124,473Total Vacancy & Credit Loss -55,585 -39,228 -22,723 -6,936 -124,473
Effective Gross Revenue 1,056,122 745,331 431,743 131,786 2,364,982
Operating Expenses CAM 394,591 269,116 154,712 36,860 857,302 Management fee (3%) 31,684 22,360 12,952 2,838 67,811Total Operating Expenses 426,275 291,476 167,664 39,698 925,113
Net Operating Income 629,846 453,856 264,079 92,088 1,439,869
Cash Flow Report
Jan, 2021 through Dec, 2024Longford Plaza (Individual Building Sales w 5.0% I/O bridge loan)

12 Office Building Portfolio near E. Warm Springs Road and Pecos Road28
ARGUS - CASH FLOW - INDIVIDUAL BUILDING SALE (CON’T)FINANCIAL INFORMATION
Forecast Forecast Forecast Forecast Forecast
Year 1 Year 2 Year 3 Year 4For the Years Ending Aug-2021 Aug-2022 Aug-2023 Aug-2024 Total
Capital Expenditures Capital Reserves 13,837 9,162 5,114 1,147 29,259 Sale of buildings -3,228,715 -4,714,980 -4,411,243 -2,659,665 -15,014,603 Less 5% selling fees 161,436 235,749 220,562 132,983 750,730 Total Capital Expenditures -3,053,443 -4,470,069 -4,185,568 -2,525,534 -14,234,613
Total Leasing & Capital Costs -3,053,443 -4,470,069 -4,185,568 -2,525,534 -14,234,613
Cash Flow Before Debt Service 3,683,289 4,923,925 4,449,646 2,617,622 15,674,482
Debt Service Interest New Interest Only Bridge Loan 368,509 227,117 100,430 2,933 698,989 Total Interest 368,509 227,117 100,430 2,933 698,989
Principal Additional Principal Payments 2,071,996 2,937,661 2,668,368 175,975 7,854,000 Total Principal 2,071,996 2,937,661 2,668,368 175,975 7,854,000
Total Debt Service 2,440,505 3,164,778 2,768,798 178,908 8,552,989
Cash Flow After Debt Service 1,242,784 1,759,147 1,680,848 2,438,714 7,121,493
Financing New Bridge Loan 7,854,000 0 0 0 7,854,000 Total Proceeds 7,854,000 0 0 0 7,854,000
Loan Costs New Bridge Loan -154,000 0 0 -77,000 -231,000 Total Loan Costs -154,000 0 0 -77,000 -231,000
Total Financing (Net) 7,700,000 0 0 -77,000 7,623,000
Cash Flow Available for Distribution 8,942,784 1,759,147 1,680,848 2,361,714 14,744,493

12 Office Building Portfolio near E. Warm Springs Road and Pecos Road29
ARGUS- SOURCES & USES - INDIVIDUAL BUILDING SALEFINANCIAL INFORMATION
Forecast Forecast Forecast Forecast Forecast
Year 1 Year 2 Year 3 Year 4For the Years Ending Aug-2021 Aug-2022 Aug-2023 Aug-2024 Total
Sources Of Capital Net Operating Gains 629,846 453,856 264,079 92,088 1,439,869 Debt Funding Proceeds 7,854,000 0 0 0 7,854,000 Initial Equity Contribution 3,300,000 0 0 0 3,300,000 Gross Sale Proceeds 3,228,715 4,714,980 4,411,243 2,659,665 15,014,603Defined Sources Of Capital 15,012,561 5,168,836 4,675,322 2,751,753 27,608,472Required Equity Contributions 0 0 0 0 0Total Sources Of Capital
Uses Of Capital Property Purchase Price 11,000,000 0 0 0 11,000,000 Total Loan Origination & Exit Costs 154,000 0 0 77,000 231,000 Debt Service (interest only payments) 368,509 227,117 100,430 2,933 698,989 Debt Retirement 2,071,996 2,937,661 2,668,368 175,975 7,854,000 Resale selling fees 161,436 235,749 220,562 132,983 750,730 Capital Reserve 13,837 9,162 5,114 1,147 29,260Defined Uses Of Capital 13,769,778 3,409,689 2,994,474 390,038 20,563,979Cash Flow Distributions 1,242,783 1,759,147 1,680,848 2,361,715 7,044,493Total Uses Of Capital
Unleveraged Cash on Cash Return Cash to Purchase Price 33.48% 44.76% 40.45% 23.80% 142.50% NOI to Book Value (average for each year) 6.18% 6.12% 6.26% 6.40% 24.96%Leveraged Cash on Cash Return Cash to Initial Equity 37.66% 53.31% 50.93% 73.90% 215.80%
Unleveraged IRR (Annual rate, compounded monthly) 20.25%Leveraged IRR (Annual rate, compounded monthly) 42.64% * Results displayed are based on Forecast data only
Sources and Uses
Jan, 2021 through Dec, 2024
15,012,561 5,168,836 4,675,322 2,751,753 27,608,472
Longford Plaza (Individual Building Sales w 5.0% I/O bridge loan)
15,012,561 5,168,836 4,675,322 2,751,753 27,608,472

12 Office Building Portfolio near E. Warm Springs Road and Pecos Road30
EXIT STRATEGYFINANCIAL INFORMATION
One of the potential exit strategies consists of systematically selling individual buildings to owner/users at a price starting at $145 psf to take advantage of historically attractive SBA loan terms or to smaller investors looking for relatively simple investment property. Based on the assumptions, the projected leveraged return is 42.6% annually on a monthly compounded basis. This is based on a 4-year holding period with an equity investment of $3,300,000 based on the portfolio asking price of $11.0M ($111 psf) and an inflation adjusted current individual building resale price of $145 psf. Total projected cash distribution is $7,044,493 on a cash investment of $3,300,000 resulting in an equity return ratio of 2.42. It is also worthy to note that given the portfolio’s current occupancy of 81% there is immediate cash flow to service the debt and provide an interim return prior to selling individual buildings. Additionally, if certain buildings are sold unit by unit on a condominium basis then higher sales prices will be achievable as borne out by recent comps within the park. Here are the main assumptions made:
• Sale price of individual buildings at a current price of $145 psf, subject to annual inflation, less 5% in selling fees/costs resulting in total sales volume of $15,014,603 (net of selling fees)
• Approximately one building sold per quarter starting in June 2021 with the final sale occurring on or about September 2024
• The order of building sales was based on when leases expired or could be renewed to create as clean a situation as possible for either owner users to buy or for existing tenants to purchase
• Overall operating costs decrease as buildings sell but are still inflated annually on a psf basis on the remaining buildings until they are sold
• No new leasing is assumed to occur; just some strategic renewals depending on when specific buildings are being targeted to be sold

12 Office Building Portfolio near E. Warm Springs Road and Pecos Road31
EXIT STRATEGY (CON’T)
$11,000,000 Lender Exit Fee 1% Paid at end
70.00% Origination Fees 2% Included in loan
$7,700,000 Total Loan Amount 7,865,000$
$7,865,000 $11,000,000
Jun-21 3227 6,935 92,364 $145.00 $145.00 $1,005,575 $50,279 $955,296 $0 $645,318 $7,219,682 $10,231,765
Sep-21 3067 6,928 85,436 $145.00 $145.00 $1,004,560 $50,228 $954,332 $0 $644,666 $6,575,016 $9,464,305
Dec-21 3283 8,404 77,032 $145.00 $145.00 $1,218,580 $60,929 $1,157,651 $0 $782,012 $5,793,005 $8,533,339
Mar-22 3127 10,874 66,158 $145.00 $149.35 $1,624,032 $81,202 $1,542,830 $0 $1,011,851 $4,781,154 $7,328,755
Jun-22 3203 6,899 59,259 $145.00 $149.35 $1,030,366 $51,518 $978,847 $0 $641,968 $4,139,186 $6,564,507
Sep-22 3097 6,869 52,390 $145.00 $149.35 $1,025,885 $51,294 $974,591 $0 $639,176 $3,500,010 $5,803,583
Dec-22 3047 6,928 45,462 $145.00 $149.35 $1,034,697 $51,735 $982,962 $0 $644,666 $2,855,344 $5,036,123
Apr-23 3037 10,874 34,588 $145.00 $153.83 $1,672,753 $83,638 $1,589,115 $0 $1,011,851 $1,843,493 $3,831,539
Sep-23 3077 6,928 27,660 $145.00 $153.83 $1,065,738 $53,287 $1,012,451 $0 $644,666 $1,198,827 $3,064,079
Dec-23 3087 10,874 16,786 $145.00 $153.83 $1,672,753 $83,638 $1,589,115 $0 $1,011,851 $186,976 $1,859,495
Apr-24 3057 8,505 8,281 $145.00 $158.45 $1,347,578 $67,379 $1,280,199 $0 $186,976 $0 $917,341
Sep-24 3291 8,281 0 $145.00 $158.45 $1,312,086 $65,604 $1,246,482 $0 $0 $0 $0
99,299 $15,014,603 $750,730 $14,263,873 $0 $7,865,000
Longford Plaza Exit Strategy: Projected Building Sales and Debt Repayment
Purchase Price
Initial Loan/Value %Loan Subtotal
Date Building Area Remaining RSF
Sale Price($/SF) Sale Amount
Inflation Adjusted(3% per year starting Sept
2021)
Address Fees (5%)) Net Proceeds
Amortized Paydown Loan Balance Remaining
Book Value
Debt Paydown(% of initial loan)
120%
FINANCIAL INFORMATION

LAS VEGAS VALLEYOVERVIEW05

12 Office Building Portfolio near E. Warm Springs Road and Pecos Road33
Raiders Stadium - $1.9 Billion 62-acres west of the Strip
T-Mobile Arena 20,000 Seating Capacity
Raiders Corporate Headquarters 320,000 SF Practice Facility
Las Vegas Ballpark - $150 Million 10,000 Seating Capacity
Vegas Golden Knights Practice Facility UFC Corporate Headquarters
SPORTS/ENTERTAINMENT
Long heralded as “the entertainment capital of the world,” Las Vegas is on its way to adding “sports” to that title.
Residents and visitors can chose from seasonal events such as the NBA Summer League and the Wrangler National Finals Rodeo or the variety of homegrown professional and semi-professional teams.
The Las Vegas valley is poised to become a premier sports destination for fans of all types.
LAS VEGAS VALLEY OVERVIEW

12 Office Building Portfolio near E. Warm Springs Road and Pecos Road34
LOW COST OF DOING BUSINESS:The combination of our zero inventory tax, a rich transportation infrastructure, and the geographic location of the state’s two largest urban centers are prime reasons that top brands like Amazon, Wal-Mart, Levi Strauss & Co., Barnes & Noble, Ur-ban Outfitters, and others choose Nevada to stage their warehousing and distribution strategies.
Collectively, the cities of Las Vegas, Reno, Sparks, Carson City and surrounding towns are less than one day’s drive over arterial interstate highways to near-ly 60 million consumers as well as to the major U.S. deep water seaports serving the Pacific Rim. Major Union Pacific and Southern Pacific rail connections in Las Vegas and Reno also, too, play an essential role in carrying the world’s freight from the Pacific Coast to America’s Heartland and beyond.
Nevada offers a very competitive cost of doing business and is attracting more and more compa-nies each day from higher-cost regions.
NEVADA HAS:• An abundance of economical commercial
real estate
• Competitive utility rates for commercial operations
• Low-cost startup, regulatory, licensing and annual fees
• Proximity to West Coast/California markets and businesses, reducing shipping and storage costs
• Excellent air cargo costs for shipping by air out of Nevada
• Nevada business incentives
1. Tax abatements for job creation, capital investment and intellectual property development
2. Workforce development training grants
3. Catalyst Fund to support new business or expansion in state
EXCELLENT TAX ADVANTAGES:
NO Personal Income Tax
NO Corporate Income Tax
NO Unitary Tax
NO Franchise Tax
NO Inventory Tax
NO Estate Tax
NO Inheritance Tax
NEVADA BUSINESS ADVANTAGES
Provided by:
www.diversifynevada.com
NEVADA BUSINESS ADVANTAGESLAS VEGAS VALLEY OVERVIEW
12 Office Building Portfolio near E. Warm Springs Road and Pecos Road35
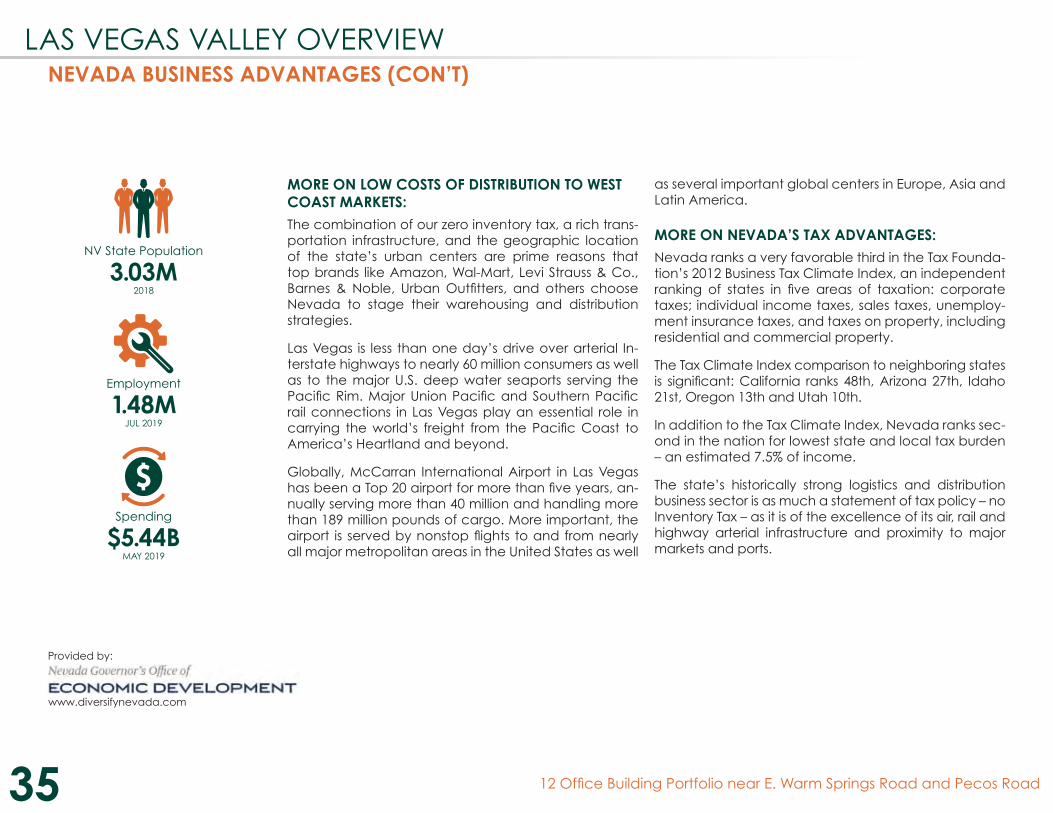
MORE ON LOW COSTS OF DISTRIBUTION TO WEST COAST MARKETS:The combination of our zero inventory tax, a rich trans-portation infrastructure, and the geographic location of the state’s urban centers are prime reasons that top brands like Amazon, Wal-Mart, Levi Strauss & Co., Barnes & Noble, Urban Outfitters, and others choose Nevada to stage their warehousing and distribution strategies.
Las Vegas is less than one day’s drive over arterial In-terstate highways to nearly 60 million consumers as well as to the major U.S. deep water seaports serving the Pacific Rim. Major Union Pacific and Southern Pacific rail connections in Las Vegas play an essential role in carrying the world’s freight from the Pacific Coast to America’s Heartland and beyond.
Globally, McCarran International Airport in Las Vegas has been a Top 20 airport for more than five years, an-nually serving more than 40 million and handling more than 189 million pounds of cargo. More important, the airport is served by nonstop flights to and from nearly all major metropolitan areas in the United States as well
as several important global centers in Europe, Asia and Latin America.
MORE ON NEVADA’S TAX ADVANTAGES:Nevada ranks a very favorable third in the Tax Founda-tion’s 2012 Business Tax Climate Index, an independent ranking of states in five areas of taxation: corporate taxes; individual income taxes, sales taxes, unemploy-ment insurance taxes, and taxes on property, including residential and commercial property.
The Tax Climate Index comparison to neighboring states is significant: California ranks 48th, Arizona 27th, Idaho 21st, Oregon 13th and Utah 10th.
In addition to the Tax Climate Index, Nevada ranks sec-ond in the nation for lowest state and local tax burden – an estimated 7.5% of income.
The state’s historically strong logistics and distribution business sector is as much a statement of tax policy – no Inventory Tax – as it is of the excellence of its air, rail and highway arterial infrastructure and proximity to major markets and ports.
NV State Population
3.03M2018
Employment
1.48MJUL 2019
Spending
$5.44BMAY 2019
Provided by:
www.diversifynevada.com
NEVADA BUSINESS ADVANTAGES (CON’T)LAS VEGAS VALLEY OVERVIEW

12 Office Building Portfolio near E. Warm Springs Road and Pecos Road36
RESORTS WORLD$4.2B
CONVENTION CENTER EXP.$1.4B UNION VILLAGE$1.2B SWITCH$1.0B PROJECT NEON$1.0B
EXTREME SPORTS PARK$800MTHE MAJESTIC$850M MSG SPHERE$TBD
LAS VEGAS STADIUM$1.9B
THE DREW$3.1B
$24+ Billionin New Capital Investment
is Driving Growth
HENDERSON WEST$950M
JACKIE ROBINSON ARENA$2.7B
*From Applied Analysis
LAS VEGAS OVERVIEWLAS VEGAS VALLEY OVERVIEW

12 Office Building Portfolio near E. Warm Springs Road and Pecos Road37
LasVegas
METROPOLITAN STATISTICAL AREA STATS
2.3M2018 POPULATION
1.1MLABOR FORCE
3.7%UNEMPLOYMENT
RATE
$808MGROSS CASINO
GAMING REVENUE
3.5MVISITOR VOLUME
$265KEXISTING HOME
MEDIAN CLOSING PRICE
$57.2KMEDIAN INCOME
30.8%COLLEGE EDUCATED
POPUATION
32.5%POPULATION EMPLOYED
IN LEISURE AND HOSPITALITY
From LVGEA
LAS VEGAS STATSLAS VEGAS VALLEY OVERVIEW

12 Office Building Portfolio near E. Warm Springs Road and Pecos Road38
Las Vegas VS Los Angeles
San Francisco
$82K AVERAGE TECH SALARIES $97K $114K
$82K x 500 100,00 SF @ 200 SF/PERSONEQUALS 500 PEOPLE
$97K x 500 $114 x 500
$40.9MM AVG SALARY X HEADCOUNT=TOTAL ANNUAL SALARY COST $48.4MM $56.8MM
100,000 SF@ $23.11 PSF GROSS
REAL ESTATE COSTSCLASS B RENTS - PER YEAR
100,000 SF@ $48.30 PSF GROSS
100,000 SF@ $92.40 PSF GROSS
$2.3MM $4.8MM $9.2MM$409MM + $23MM TOTAL
10 YEAR SALARY COST + REAL ESTATE COST$484MM + $48MM $568MM + $92MM
$432MM $532MM $660MMFrom www.business.org
LAS VEGAS BUSINESS DIFFERENTIATORS
CHOOSING LAS VEGAS WILL SAVE $100M - $228Min combined labor and real estate costs over a 10-year period
LAS VEGAS VALLEY OVERVIEW

12 Office Building Portfolio near E. Warm Springs Road and Pecos Road39
SUN COMMERCIAL REAL ESTATE, INC. (the “Broker”) has been retained on an exclusive basis to market the property described herein (the “Property”). Broker has been authorized by the Seller of the Property (the “Seller”) to prepare and distribute the enclosed information (the “Material”) for the purpose of soliciting offers to purchase from interested parties. More detailed financial, title and tenant lease information may be made available upon request following the mutual execution of a letter of intent or contract to purchase between the Seller and a prospective purchaser. You are invited to review this opportunity and make an offer to purchase based upon your analysis. If your offer results in the Seller choosing to open negotiations with you, you will be asked to provide financial references. The eventual purchaser will be chosen based upon an assessment of price, terms, ability to close the transaction and such other matters as the Seller deems appropriate.
The Material is intended solely for the purpose of soliciting expressions of interest from qualified investors for the acquisition of the Property. The Material is not to be copied and/or used for any other purpose or made available to any other person without the express written consent of Broker or Seller. The Material does not purport to be all-inclusive or to contain all of the information that a prospective buyer may require. The information contained in the Material has been obtained from the Seller and other sources and has not been verified by the Seller or its affiliates. The pro forma is delivered only as an accommodation and neither the Seller, Broker, nor any of their respective affiliates, agents, representatives, employees, parents, subsidiaries, members, managers, partners, shareholders, directors, or officers, makes any representation or warranty regarding such pro forma. Purchaser must make its own investigation of the Property and any existing or available financing, and must independently confirm the accuracy of the projections contained in the pro forma.
Seller reserves the right, for any reason, to withdraw the Property from the market. Seller has no obligation, express or implied, to accept any offer. Further, Seller has no obligation to sell the Property unless and until the Seller executes and delivers a signed agreement of purchase and sale on terms acceptable to the Seller, in its sole discretion. By submitting an offer, a purchaser will be deemed to have acknowledged the foregoing and agreed to release Seller and Broker from any liability with respect thereto.
Property walk-throughs are to be conducted by appointment only. Contact Brokers for additional information.
CONFIDENTIALITY & DISCLOSURE

Cathy Jones, CPA, SIOR, CCIMCEO
NV Lic # B0056010.CORP
Alexandria MaloneAssociate
NV Lic # S.0190399
Paul MiachikaExecutive Vice President
NV Lic # S.0184612
Sun Commercial Real Estate, Inc.6140 Brent Thurman Way, Suite 140, Las Vegas, Nevada 89148
702 | 968 | 7300 Ph • 702 | 968 | 7301 Faxwww.SunCommercialRE.com
CONTACTS
3037-3291 E. Warm Springs Road | Offering Memorandum