Embed Size (px)
Citation preview
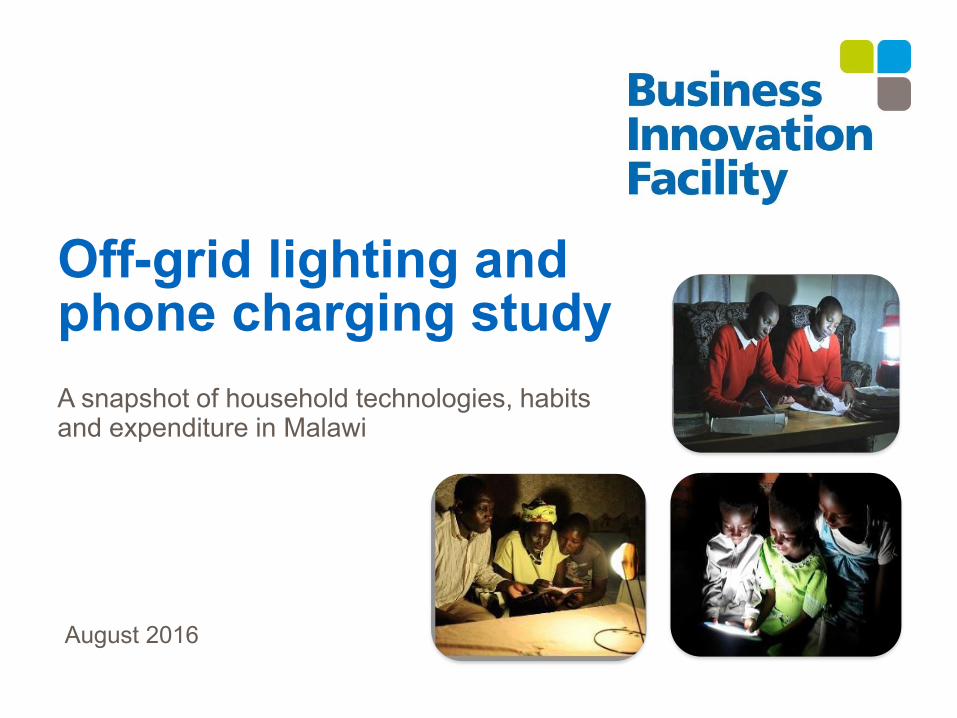
Off-grid lighting and phone charging study
August 2016
A snapshot of household technologies, habits and expenditure in Malawi

Malawi has one of the lowest electricity access rates in the world, standing at only 9%; the problem is particularly acute in rural areas where only 1% of the rural population has electricity access.
2
Background

3
Background
• Household solar products offer the best potential for rapidly increasing access to modern energy services in Malawi.
• Technological advances bringing increased quality and lower prices, coupled with business innovation has enabled a boom in the household solar industry - 7.5 million quality-verified solar lights have been sold in Africa. The products provide bright light and mobile phone charging, and the cheapest are now available for just $8.
• Alternative methods of lighting such as kerosene, candles and torches provide low-quality light are damaging to health, are dangerous, and actually more expensive than modern electric lighting. However modern products are yet to gain a significant market share in Malawi.
• Furthermore, relatively little is known about off-grid consumers lighting and phone charging habits.

The goal of this off-grid lighting and phone charging study are:
• Raise the profile of the off-grid market amongst key stakeholders (private sector, government, financial service providers, media)
• Highlight the opportunity for private sector growth in the off-grid lighting and charging market
• Encourage further private sector investment through improving the understanding of consumers
This study explores key consumer insights:
• What are the prevalent lighting technologies and how they are used.
• Lighting and phone charging habits and expenditure
• Awareness and perceptions of household solar products
Study goals
4

• Nationally representative survey covering 7 districts randomly selected from Northern, Central and South regions. Data was collected face to face, in-home using computer assisted personal interviews (CAPI) method of data collection. The questionnaire was structured and programmed onto hand-held devices.
• The sample was purposive, off-grid constituting n=513 respondents/households. Households and respondents were randomly selected. Individuals with a grid connection were not included in the sample.
• The respondent was either head of the household, spouse, or any other adult member.
• The survey was conducted in February and March 2016.
Methodology
5

Structure of sample
District Classification Village Township Sample Size District Total
Blantyre Urban Bangwe 18
36 Nancholi ward 18
Zomba Urban Sadzi 18
36 Matawale ward 18
Lilongwe Urban Chilinde 18
36 Area 25 18
Mzuzu Urban Chiwanja ward 18
36 Chiputula 18
Rumphi Rural Mwangónga 41
123 Mzongano 41
Chiulazeru 41
Chikhwawa Rural Sekeni 41
123 Nedi 41
Mthumba 41
Salima Rural Mzalule 41
123 Makunje 41
Mazombwe 41
Total 513 513
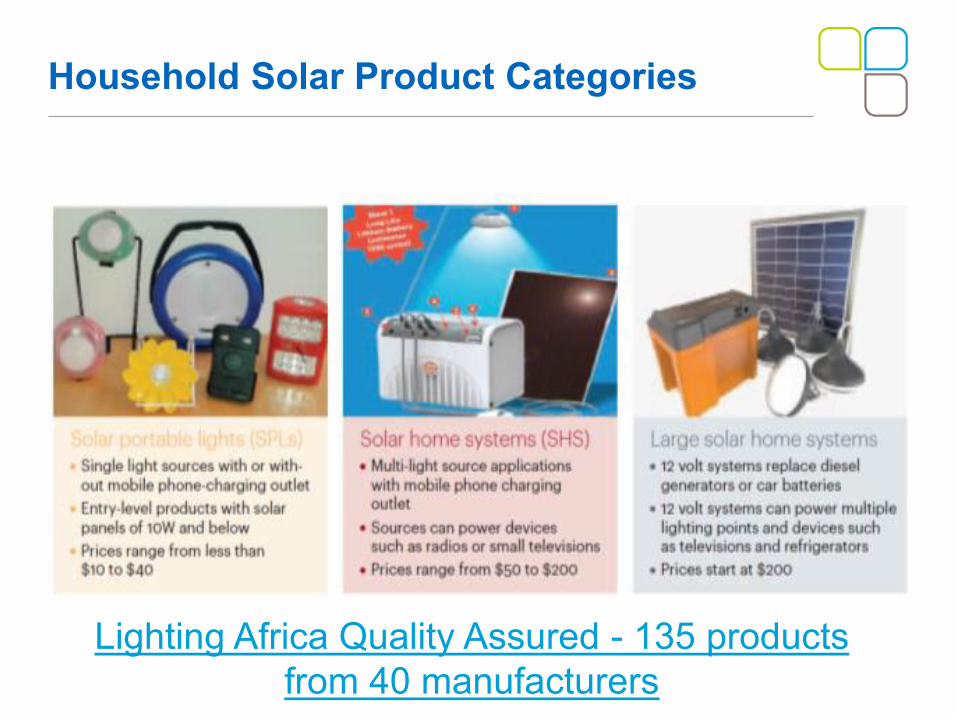
Household Solar Product Categories
Lighting Africa Quality Assured - 135 products from 40 manufacturers

Summary and interpretation of findings

Income and solar lighting adoption
• Income level determines penetration of solar household lighting, with greater ownership amongst higher income houses.
National and household expenditure
• Malawi spends nearly $50
million (MK 34 billion) on
bad quality and harmful
lighting every year.
• Average annual spend per
household on lighting =
$14 (MK 10,000) and
phone charging = $9
(MK6,000).
Income, mobile phone ownership and solar lighting relationships
• Low household income is not a significant barrier to mobile phone ownership.
•
• Households typically own more than one mobile phone.
• There is a strong correlation between mobile phone ownership and solar lighting usage.
Summary of findings
81% of households using solar lighting had a mobile phone as opposed to 58% of households that were not using solar lighting
Solar lighting penetration
• Penetration of household solar lighting in Malawi is still at its infancy.
• Ownership varies significantly between households in urban and rural areas, and between districts.
• Two thirds of off-grid households use battery-powered torches (63%) followed by candles (14%)
13% of off-grid households were using solar lighting: 9% portable solar lights and 4% fixed solar lights

• Households using solar lighting were motivated by affordability (long term savings 41%), brighter light (18%) and its reliability (available everyday 15%). Non users were motivated to non renewable lighting solutions by affordability (short term affordability 65%). And local availability (13%)
Awareness of solar lighting and its benefits
• Word of mouth is the biggest driver of solar lighting awareness 90%). Radio comes a distant second (16%).
• The following benefits are mentioned of solar lighting: Cost saving the long term (63%), brighter light (29%) phone and radio charging capability (23%) and safer than other alternatives (13%)
Summary of findings
Affordability is the main driver for selecting a lighting solution. Affordability for solar lighting is perceived in terms of long term savings while for non renewable sources its on the unit cost of acquisition
92% aware of solar lighting. 63% mention long term cost saving as the biggest benefit of solar lighting
Phone charging behaviour and costs
• Most phones are charged a few times in a week (from once to thrice). Phone charging is an accessible service as people take on average 15 minutes to reach the nearest charging station.
Motivations for main source of lighting
It takes 15 minutes to reach the nearest phone charging point

• There is a significant difference between users and non users with 71% of users claiming they know an outlet where solar products are available as opposed to 37% of non users.
Distance to the nearest point of purchase
• Both users and non users of solar lighting who are aware of an outlet selling solar products mention that it would take them an average of one hour or less to reach the nearest outlet.
Solar lighting price awareness
• Asked to estimate the price of solar products, most users and non users of solar lighting gave close estimates to the correct market prices. Users estimated prices of PSPs at the price of medium-end PSPs (46,000 MK), non-users gave prices close to entry-level PSPs (9,000 MK).
Satisfaction with main lighting source
• Solar lighting records the highest level of satisfaction (portable solar 71% and fixed solar 55%). Torches and candles which are the most used lighting methods record the lowest level of satisfaction (35% and 41% respectively).
Summary of findings
Solar lighting usage patterns
• Solar lights once in the household are used more than any other lighting source (about 7 hours daily; suggesting both early morning and evening usage).
Purchasing solar lighting
• Grocery stores and markets are mentioned mostly as the points of sale where solar products would be available (53% and 43% respectively).

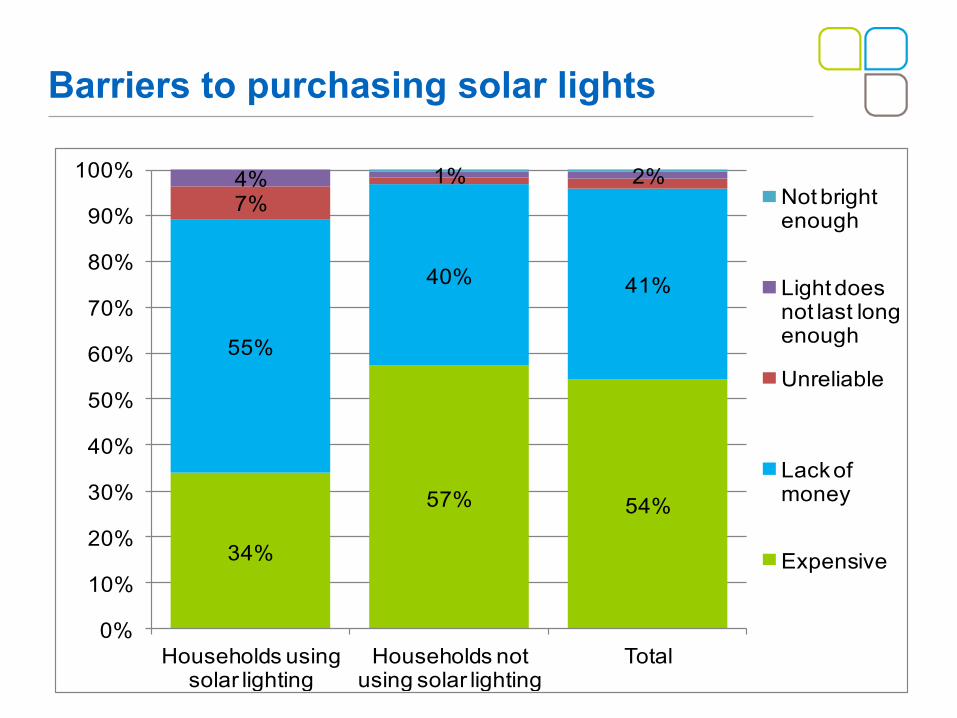
Where as 55% of current users of solar lighting mention lack of money, 40% of non users attribute lack of money as main barrier. Only 34% of current users mention expensiveness as main barriers as opposed to 57% of non users.
Drawbacks of main source of lighting
• The main drawback of solar lighting from current users is the reduced performance on cloudy/rainy days (58%). This is mentioned as the only drawback.
Users of non renewable sources mention that theur current sources of lighting are expensive (29%), break down frequently (25%) and are dangerous (17%).
Warranty: Awareness and value attached to it
• 58% of off-grid households were aware of a warranty. Users were however more aware (73%) as opposed to non users (56%).
• Households are willing to pay more for products with warranty at a similar proportion of both current users and non users of solar lighting (94%).
Summary of findings
Interest in solar lighting
• There is a big interest in adopting solar lighting. 78% of current non users are interested in getting solar.
Barriers to solar lighting acquisition
• Perception of solar lighting being expensive and genuine lack of money are the 2 biggest barriers.
78% of non-renewable lighting users are interested in acquiring solar lighting

Survey findings 1. Solar lighting penetration and profile of users versus non-users 2. Lighting habits 3. Lighting costs and associated expenditure 4. Awareness of and attitudes towards solar lighting 5. Finding the target market
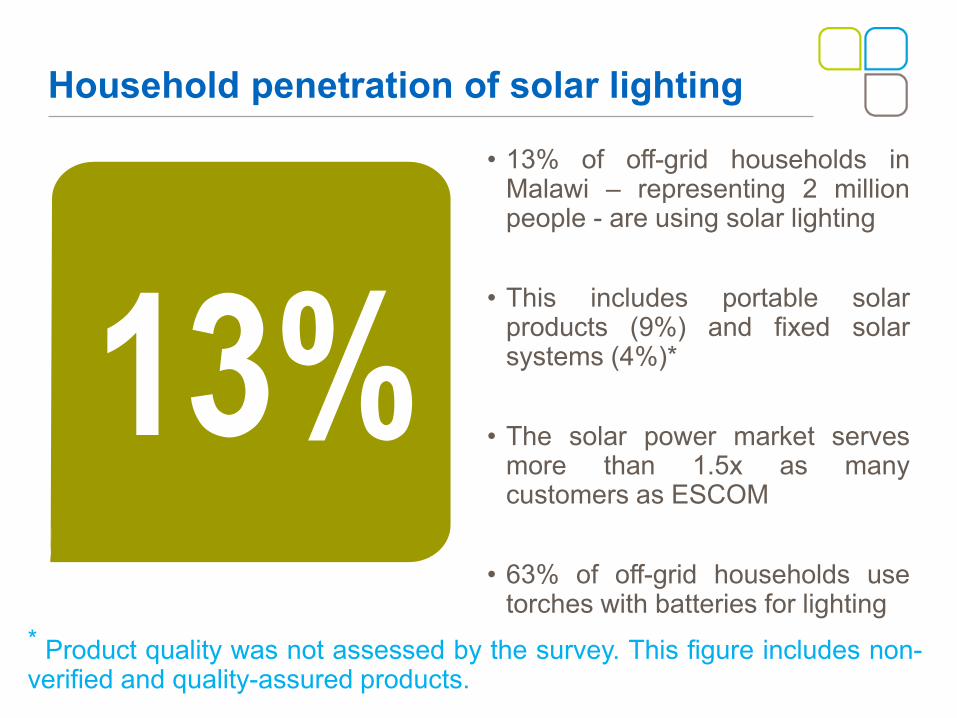
• 13% of off-grid households in Malawi – representing 2 million people - are using solar lighting
• This includes portable solar products (9%) and fixed solar systems (4%)*
• The solar power market serves more than 1.5x as many customers as ESCOM
• 63% of off-grid households use torches with batteries for lighting
Household penetration of solar lighting
13% * Product quality was not assessed by the survey. This figure includes non-verified and quality-assured products.

Primary source of lighting
15
63% 14%
2%
5%
9%
4% 3%
Torches
Candles
Paraffin
Biomass
Portable solar
Fixed solar
Other

Urban Rural Blantyre Lilongwe Zomba Mzuzu Rumphi Salima Chikwawa
Portable solar 6% 6% 0% 3% 13% 2% 19%
Fixed solar 0% 3% 0% 3% 6% 9% 0%
• High penetration in Rumphi and Chikwawa where products have been aggressively promoted by prominent distributors and donors
Solar penetration by district
16
Urban average
Rural average
National average
Portable solar 3% 11% 9%
Fixed solar 1% 5% 4%
• Market penetration higher in rural districts. Urban consumers commonly cite product security as a risk.
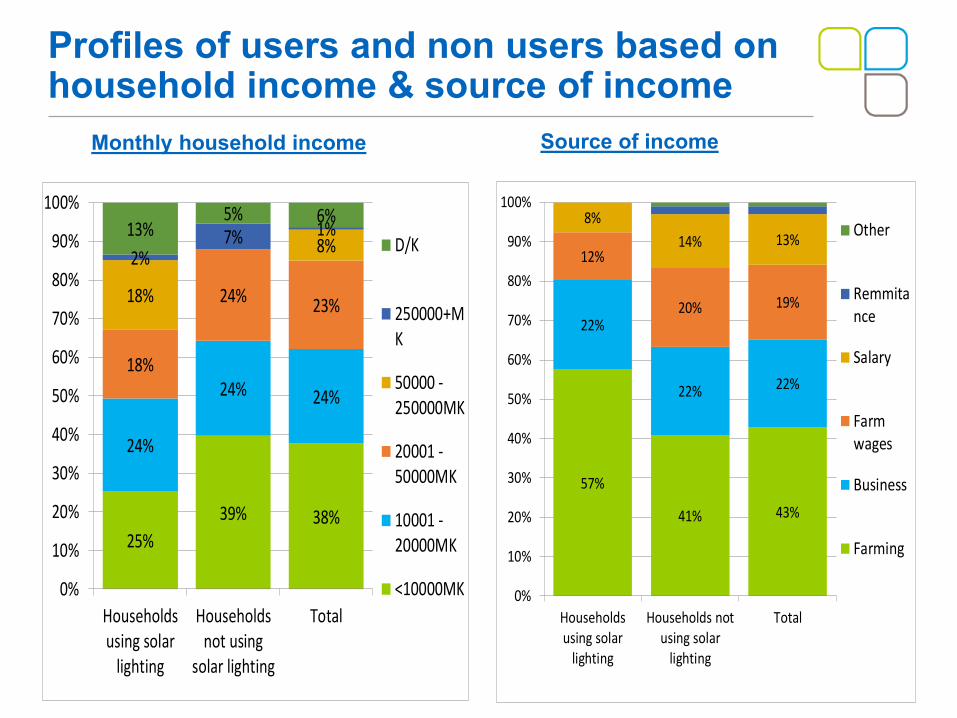
25%
39% 38%
24%
24% 24%
18%
24%23%
18%
8%2%
7% 1%13%5% 6%
0%
10%
20%
30%
40%
50%
60%
70%
80%
90%
100%
Households
using solar
lighting
Households
not using
solar lighting
Total
D/K
250000+M
K
50000 -
250000MK
20001 -
50000MK
10001 -
20000MK
<10000MK
Profiles of users and non users based on household income & source of income
57%
41% 43%
22%
22% 22%
12%
20% 19%
8%
14% 13%
0%
10%
20%
30%
40%
50%
60%
70%
80%
90%
100%
Households
using solar
lighting
Households not
using solar
lighting
Total
Other
Remmita
nce
Salary
Farm
wages
Business
Farming
Monthly household income Source of income

81%
58% 61%
19%
42% 39%
0%
10%
20%
30%
40%
50%
60%
70%
80%
90%
100%
Households using solar
lighting
Households not using solar
lighting
Total
No
Yes
Profiles of users and non users based on mobile phone ownership
Whether household has mobile phone Number of mobile phones in households
Number of
mobile phones
Households using solar lighting
1.81
Households not using solar lighting
1.58
Total
1.62

Lighting habits

Frequency of using main lighting source
98%95%
90% 88% 88%
80%
2%5%
10% 12% 12%
20%
0%
10%
20%
30%
40%
50%
60%
70%
80%
90%
100%
PSP SHS Candles Torches Paraffin Biomass
Daily Less than daily
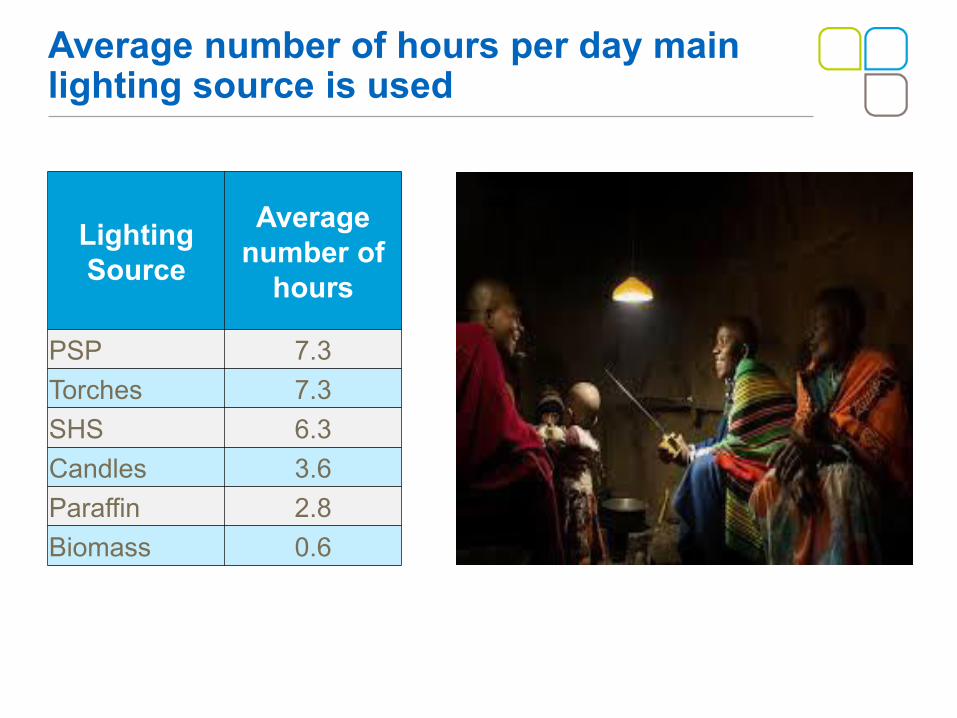
Average number of hours per day main lighting source is used
Lighting Source
Average number of
hours
PSP 7.3
Torches 7.3
SHS 6.3
Candles 3.6
Paraffin 2.8
Biomass 0.6

41%
65%62%
13%11%
15%
6% 7%
18%
3%6%5% 5% 5%
10%
4% 4%9%
3% 4%2%1%
0%
10%
20%
30%
40%
50%
60%
70%
Households using solarlighting
Households not usingsolar lighting
Total
Affordable Locally available Reliable Bright enough
Long lasting light No fumes Portability D/K
Reasons for choice of main lighting source

1%
29%
0%
25%
0%
17%
7%11%
7%10%
13%
2%
58%
0%
14%
0%0%
10%
20%
30%
40%
50%
60%
70%
Households using solar lighting Households not using solar lighting
Expensive Breaks down often
Dangerous Not bright enough
Unreliable Heavy fumes
Light does not last long enough Not portable
Doesn’t work in cloudy days Switches off suddenly
Drawbacks of main lighting source

28%19%
5% 3% 7%
43%
38%
30% 36%
13%
35%31%
5%
10%
88%
4%7%
26%
29%50%
52%
86%
35%
49%
2%10% 5% 9% 14%
26%
7%
0%
10%
20%
30%
40%
50%
60%
70%
80%
90%
100%P
orta
ble
Sol
ar
Fix
ed
Sol
ar
To
rch
es
Ca
ndle
s
Ker
ose
ne L
am
ps
Bio
mas
s
Oth
er
Ligh
ting
Me
tho
ds To
tal
Very dissatisfied
Dissatisfied
Neither satisfiednor dissatisfied
Satisfied
Very satisfied
Satisfaction with main lighting source
Lighting Costs & Expenditure

Estimated annual household expenditure on lighting
26
-
2.000
4.000
6.000
8.000
10.000
12.000
Torches Candles Paraffin Pico solarproduct
Ma
law
i K
wacha (
MK
700 =
US
D 1
)
Asset purchase Consumable cost
PSP payback period ($10)
8 months
12 months
15 months

• Malawi spends nearly $50 million (MK 34 billion) on bad quality and harmful lighting every year.
• Average annual spend per household on lighting = $14 (MK 10,000).
• The payback period for a pico solar product is 8 months when compared with battery-powered torches.
• Most good quality products come with a 2-year warranty and 5-year expected lifetime
National expenditure on bad quality lighting
$50
million

Annual expenditure on mobile phone charging
28
0%
5%
10%
15%
20%
25%
30%
0-2,500 2,501 -5,000
5,001 -7,500
7,501 -10,000
10,001 -12,500
12,501 -15,000
15,001 -17,500
17,501 -20,000
20,001 +
Perc
enta
ge o
f re
sp
ondents
with m
obile
p
ho
ne
Annual expenditure on mobile phone charging
Average annual spend per user
MK 6,000 /
$9

13%9%
2%
13%15%13%
59%
15%
65%
27%
84%
100%
0%
10%
20%
30%
40%
50%
60%
70%
80%
90%
100%
Kerosene Torches PSP SHS
Once a month or more Once every two to three months
Less often Does not know
Frequency of acquisition of main lighting source

Cost of acquiring lighting sources
Main Lighting Source
Solar Home
System PSP Torches
Paraffin lamps
Average cost Of Acquisition (Malawi Kwacha)
91,315 9,002 768 106

88%
77%
11%13%16%
35%
3%
29%
4%
25%
0%
10%
20%
30%
40%
50%
60%
70%
80%
90%
100%
Kerosene Candles Torches
More than once a week Once a week
Once every 2 weeks Less often/Don’t know
Frequency of purchasing fuel for main lighting source
Solar lighting awareness and attitudes
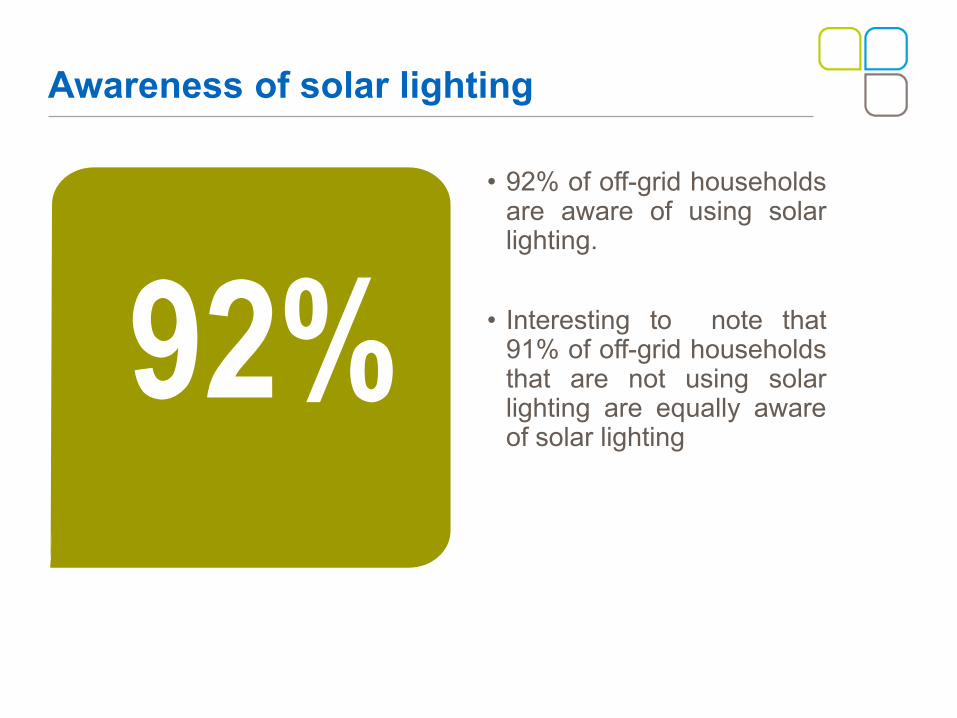
• 92% of off-grid households are aware of using solar lighting.
• Interesting to note that 91% of off-grid households that are not using solar lighting are equally aware of solar lighting
Awareness of solar lighting
92%

Source of solar lighting awareness
Source of awareness
Households using solar
lighting
Households not using solar
lighting Total Family and friends 94.7% 94.7% 90.4%
Radio 5.3% 21.2% 15.9%
Other source 0.0% 5.8% 5.8%
Road show 0.0% 2.7% 2.7%
School 0.0% 2.0% 2.0%
Vendors/ Shops 0.0% 1.0% 1.0%
Newspaper 0.0% 0.0% 0.0%
TV 0.0% 0.0% 0.0%

63%
29%
23%
13%
6%
0%
10%
20%
30%
40%
50%
60%
70%
Cheaper in thelong run
Gives brighterlight
Charges phones, radio…
Safer thanother lighting
methods
Is not polutting
Main perceived benefits of solar lighting

71%
37%43%
29%
63%57%
0%
10%
20%
30%
40%
50%
60%
70%
80%
90%
100%
Households using solar lighting
Households not using solar lighting
Total
No; I don’t know
Yes; I know
Whether knows outlet where can buy solar light

Outlet where can go buy solar light
Location
Households using solar
lighting
Households not using solar
lighting Total
Grocery stores 39.1% 21.4% 52.6%
Market 28.3% 17.2% 43.1%
School 10.9% 2.8% 6.9% Agribusiness stores 0.0% 2.6% 6.4%
Filling station 0.0% 0.2% 0.5%
Average time in minutes
Households using solar
lighting
Households not using solar
lighting Total
47.06
58.10
55.33
Average time (minutes) to reach nearest outlet selling solar products
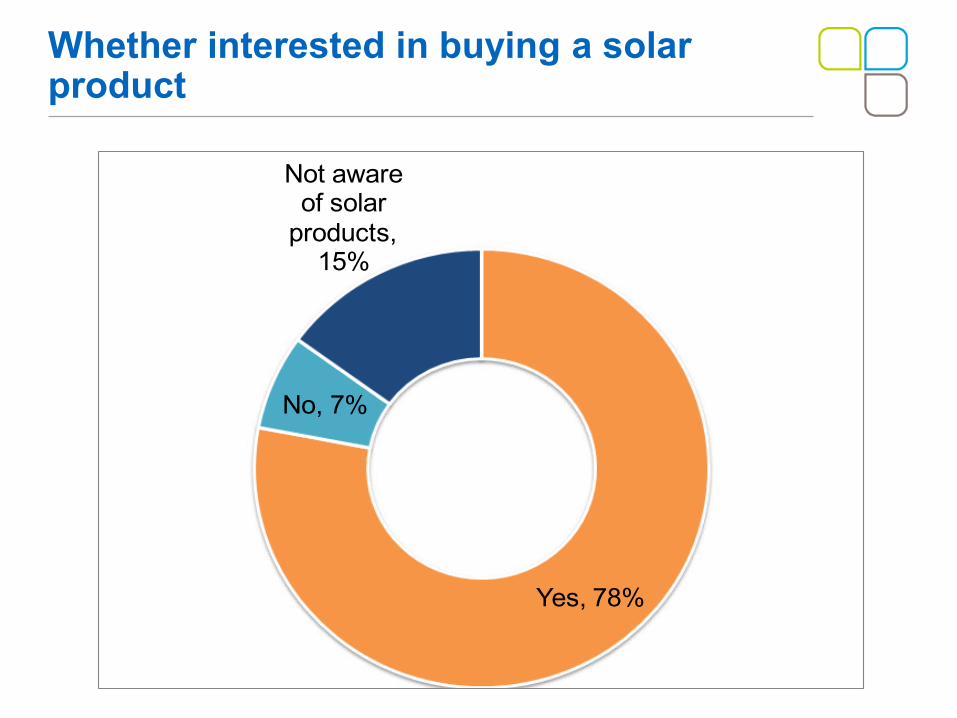
Whether interested in buying a solar product
Yes, 78%
No, 7%
Not aware of solar
products, 15%

Spontaneous perception of solar lighting prices
Household profile
Average price estimated a solar light would cost
Amount willing to pay for a solar light
Households using solar lighting
Mean in Malawi Kwacha
52,062
46,000
Households not using solar lighting
Mean in Malawi Kwacha
16,914
9,071
Total Mean in Malawi Kwacha
21,757
9,370

73%
56% 58%
27%
44% 42%
0%
10%
20%
30%
40%
50%
60%
70%
80%
90%
100%
Households
using solar
lighting
Households
not using
solar lighting
Total
No
Yes
Warranty: Awareness and perceived value
94% 94% 94%
6% 4% 5%
0%
10%
20%
30%
40%
50%
60%
70%
80%
90%
100%
Households
using solar
lighting
Households
not using
solar lighting
Total
D
/K
N
o
Y
es
Consumer awareness of product warranty
Consumer willingness to pay more for a product with warranty
34%
57% 54%
55%
40% 41%
7%4% 1% 2%
0%
10%
20%
30%
40%
50%
60%
70%
80%
90%
100%
Households using solar lighting
Households not using solar lighting
Total
Not bright enough
Light does not last long enough
Unreliable
Lack of money
Expensive
Barriers to purchasing solar lights

Finding the target market in Malawi’s agricultural economy

Consumer spatial distribution
43
Value chain
Estimated No. of
Smallholder Farmers
Estimated No. of
Employees Coffee 2,513 N/A Cotton 120,000 4,000 Dairy 17,500 N/A Sugarcane 3,700 3,925 Tea 11,500 46,792 Tobacco 400,000 5000

Malawi’s agricultural calendar and income timing
44
Value chain type Jan Feb Mar Apr May Jun Jul Aug Sep Oct Nov Dec
Cotton
Sugarcane
Dairy
Tobacco
Tea
Coffee
Key
Smallholder farmers Seasonal workers
Income Timing Calender

Closing slide: Disclaimer
This document is an output from a project funded by the UK Department for International Development (DFID). However, the views expressed and information contained in it are not necessarily those of or endorsed by DFID who can accept no responsibility for such views or information or for any reliance placed on them.
The Business Innovation Facility (BIF) is a project funded by the UK Department for International Development (DFID). It is managed for DFID by PricewaterhouseCoopers LLP in collaboration with Imani Development, Intellecap, HamsaHub limited and The Convention on Business Integrity
This publication has been prepared for general guidance on matters of interest only, and does not constitute professional advice. You should not act upon the information contained in this publication without obtaining specific professional advice. No representation or warranty (express or implied) is given as to the accuracy or completeness of the information contained in this publication, and, to the extent permitted by law, PricewaterhouseCoopers LLP and the other entities managing BIF (as listed above) do not accept or assume any liability, responsibility or duty of care for any consequences of you or anyone else acting, or refraining to act, in reliance on the information contained in this publication or for any decision based on it. The views presented in this publication are those of the author(s) and do not necessarily represent the views of BIF, its managers, funders or project partners.